|
||||||||||||||||||||||||||||||||||||||||||||||||||||||||||||||||||||||||||||||||||||||||||||||||||||||||||||||||||||||||||||||||||||||||||||||||||||||||||||||||||||||||||||||||||||||||||||||||||||||||||||||||||||||||||||||||||||||||||||||||||||||||||||||||||||||||||||||||||||||||||||||||||||||||||||||||||||||||||
| |
| Phenotypic Information (metabolism pathway, cancer, disease, phenome) |
| |
| |
| Gene-Gene Network Information: Co-Expression Network, Interacting Genes & KEGG |
| |
|


| Gene Summary for HSPA9 |
| Basic gene info. | Gene symbol | HSPA9 |
| Gene name | heat shock 70kDa protein 9 (mortalin) | |
| Synonyms | CRP40|CSA|GRP-75|GRP75|HEL-S-124m|HSPA9B|MOT|MOT2|MTHSP75|PBP74 | |
| Cytomap | UCSC genome browser: 5q31.1 | |
| Genomic location | chr5 :137890570-137911318 | |
| Type of gene | protein-coding | |
| RefGenes | NM_004134.6, | |
| Ensembl id | ENSG00000113013 | |
| Description | 75 kDa glucose-regulated proteincatecholamine-regulated protein 40epididymis secretory sperm binding protein Li 124mheat shock 70kD protein 9Bmortalin, perinuclearmortalin-2p66-mortalinpeptide-binding protein 74stress-70 protein, mitochondrial | |
| Modification date | 20141222 | |
| dbXrefs | MIM : 600548 | |
| HGNC : HGNC | ||
| Ensembl : ENSG00000113013 | ||
| HPRD : 02770 | ||
| Vega : OTTHUMG00000129206 | ||
| Protein | UniProt: go to UniProt's Cross Reference DB Table | |
| Expression | CleanEX: HS_HSPA9 | |
| BioGPS: 3313 | ||
| Gene Expression Atlas: ENSG00000113013 | ||
| The Human Protein Atlas: ENSG00000113013 | ||
| Pathway | NCI Pathway Interaction Database: HSPA9 | |
| KEGG: HSPA9 | ||
| REACTOME: HSPA9 | ||
| ConsensusPathDB | ||
| Pathway Commons: HSPA9 | ||
| Metabolism | MetaCyc: HSPA9 | |
| HUMANCyc: HSPA9 | ||
| Regulation | Ensembl's Regulation: ENSG00000113013 | |
| miRBase: chr5 :137,890,570-137,911,318 | ||
| TargetScan: NM_004134 | ||
| cisRED: ENSG00000113013 | ||
| Context | iHOP: HSPA9 | |
| cancer metabolism search in PubMed: HSPA9 | ||
| UCL Cancer Institute: HSPA9 | ||
| Assigned class in ccmGDB | C | |
| Top |
| Phenotypic Information for HSPA9(metabolism pathway, cancer, disease, phenome) |
| Cancer | CGAP: HSPA9 |
| Familial Cancer Database: HSPA9 | |
| * This gene is included in those cancer gene databases. |
|
|
|
|
|
| . | ||||||||||||||||||||||||||||||||||||||||||||||||||||||||||||||||||||||||||||||||||||||||||||||||||||||||||||||||||||||||||||||||||||||||||||||||||||||||||||||||||||||||||||||||||||||||||||||||||||||||||||||||||||||||||||||||||||||||||||||||||||||||||||||||||||||||||||||||||||||||||||||||||||||||||||||||||||
Oncogene 1 | Significant driver gene in | |||||||||||||||||||||||||||||||||||||||||||||||||||||||||||||||||||||||||||||||||||||||||||||||||||||||||||||||||||||||||||||||||||||||||||||||||||||||||||||||||||||||||||||||||||||||||||||||||||||||||||||||||||||||||||||||||||||||||||||||||||||||||||||||||||||||||||||||||||||||||||||||||||||||||||||||||||||||||
| cf) number; DB name 1 Oncogene; http://nar.oxfordjournals.org/content/35/suppl_1/D721.long, 2 Tumor Suppressor gene; https://bioinfo.uth.edu/TSGene/, 3 Cancer Gene Census; http://www.nature.com/nrc/journal/v4/n3/abs/nrc1299.html, 4 CancerGenes; http://nar.oxfordjournals.org/content/35/suppl_1/D721.long, 5 Network of Cancer Gene; http://ncg.kcl.ac.uk/index.php, 1Therapeutic Vulnerabilities in Cancer; http://cbio.mskcc.org/cancergenomics/statius/ |
| REACTOME_METABOLISM_OF_PROTEINS | |
| OMIM | |
| Orphanet | |
| Disease | KEGG Disease: HSPA9 |
| MedGen: HSPA9 (Human Medical Genetics with Condition) | |
| ClinVar: HSPA9 | |
| Phenotype | MGI: HSPA9 (International Mouse Phenotyping Consortium) |
| PhenomicDB: HSPA9 | |
| Mutations for HSPA9 |
| * Under tables are showing count per each tissue to give us broad intuition about tissue specific mutation patterns.You can go to the detailed page for each mutation database's web site. |
| There's no structural variation information in COSMIC data for this gene. |
| * From mRNA Sanger sequences, Chitars2.0 arranged chimeric transcripts. This table shows HSPA9 related fusion information. |
| ID | Head Gene | Tail Gene | Accession | Gene_a | qStart_a | qEnd_a | Chromosome_a | tStart_a | tEnd_a | Gene_a | qStart_a | qEnd_a | Chromosome_a | tStart_a | tEnd_a |
| DA499861 | HSPA9 | 1 | 62 | 5 | 137896734 | 137896795 | NEFL | 58 | 558 | 8 | 24813631 | 24814131 | |
| BG876899 | HSPA9 | 7 | 168 | 5 | 137906742 | 137909524 | HSPA9 | 160 | 213 | 5 | 137906680 | 137906733 | |
| BM835588 | HSPA9 | 1 | 103 | 5 | 137893155 | 137893629 | SLC35A2 | 104 | 631 | X | 48762698 | 48768953 | |
| DA922289 | MARCH6 | 1 | 198 | 5 | 10354004 | 10378944 | HSPA9 | 199 | 562 | 5 | 137902388 | 137903411 | |
| BM818077 | HSPA9 | 1 | 116 | 5 | 137902738 | 137902852 | RPS20 | 108 | 510 | 8 | 56985723 | 56987059 | |
| BM722787 | INA | 1 | 527 | 10 | 105049348 | 105049874 | HSPA9 | 523 | 593 | 5 | 137891576 | 137891646 | |
| BG993754 | ZRANB1 | 21 | 242 | 10 | 126656048 | 126656269 | HSPA9 | 240 | 495 | 5 | 137899374 | 137899629 | |
| Top |
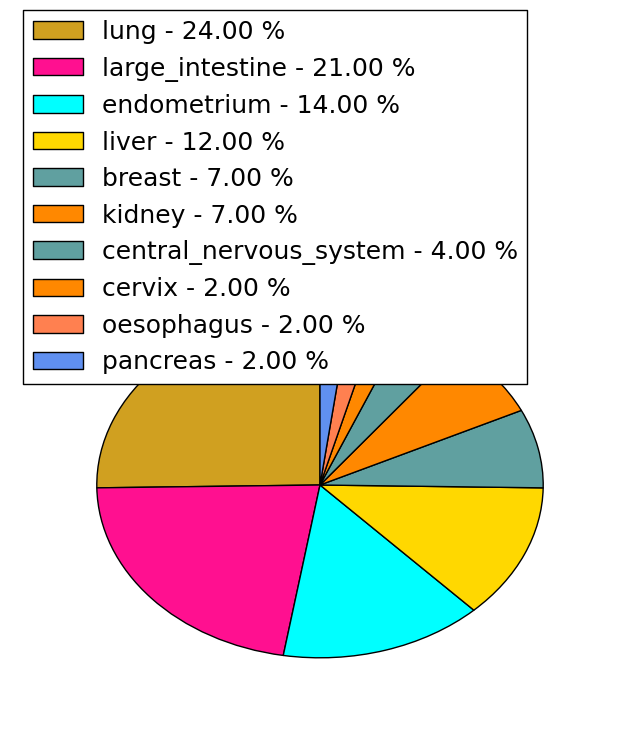
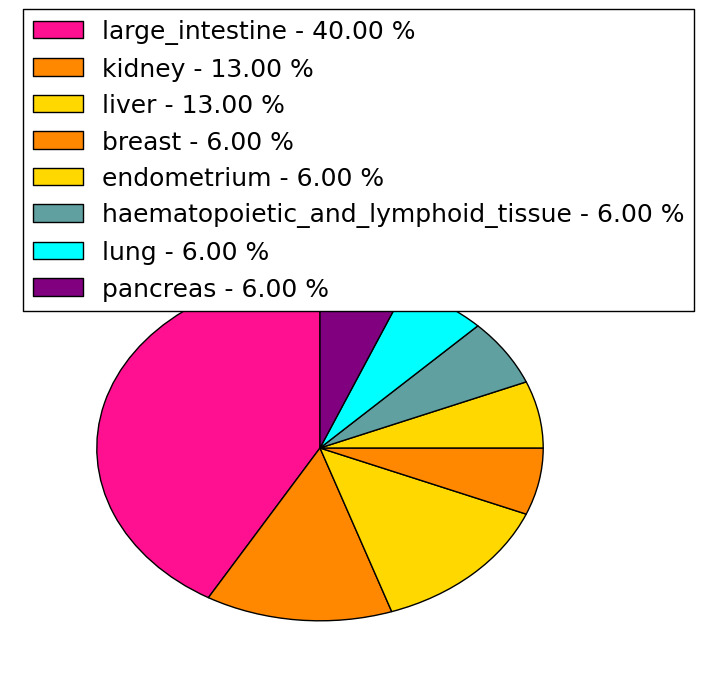
| Mutation type/ Tissue ID | brca | cns | cerv | endome | haematopo | kidn | Lintest | liver | lung | ns | ovary | pancre | prost | skin | stoma | thyro | urina | |||
| Total # sample | 1 | |||||||||||||||||||
| GAIN (# sample) | 1 | |||||||||||||||||||
| LOSS (# sample) |
| cf) Tissue ID; Tissue type (1; Breast, 2; Central_nervous_system, 3; Cervix, 4; Endometrium, 5; Haematopoietic_and_lymphoid_tissue, 6; Kidney, 7; Large_intestine, 8; Liver, 9; Lung, 10; NS, 11; Ovary, 12; Pancreas, 13; Prostate, 14; Skin, 15; Stomach, 16; Thyroid, 17; Urinary_tract) |
| Top |
|
 |
| Top |
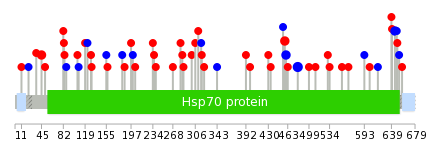
| Stat. for Non-Synonymous SNVs (# total SNVs=41) | (# total SNVs=15) |
 |  |
(# total SNVs=0) | (# total SNVs=0) |
| Top |
| * When you move the cursor on each content, you can see more deailed mutation information on the Tooltip. Those are primary_site,primary_histology,mutation(aa),pubmedID. |
| GRCh37 position | Mutation(aa) | Unique sampleID count |
| chr5:137894317-137894317 | p.T480T | 3 |
| chr5:137895585-137895585 | p.R460R | 2 |
| chr5:137909762-137909762 | p.D45E | 2 |
| chr5:137895590-137895590 | p.I458T | 2 |
| chr5:137892170-137892170 | p.L645L | 2 |
| chr5:137893676-137893676 | p.? | 2 |
| chr5:137892505-137892505 | p.E593E | 1 |
| chr5:137903154-137903154 | p.E236K | 1 |
| chr5:137895576-137895576 | p.T463A | 1 |
| chr5:137906680-137906680 | p.R127* | 1 |
| Top |
|
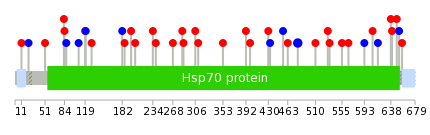 |
| Point Mutation/ Tissue ID | 1 | 2 | 3 | 4 | 5 | 6 | 7 | 8 | 9 | 10 | 11 | 12 | 13 | 14 | 15 | 16 | 17 | 18 | 19 | 20 |
| # sample | 1 | 1 | 9 | 1 | 5 | 4 | 5 | 2 | 7 | 6 | ||||||||||
| # mutation | 1 | 1 | 9 | 1 | 5 | 4 | 5 | 2 | 8 | 7 | ||||||||||
| nonsynonymous SNV | 1 | 1 | 6 | 3 | 3 | 4 | 1 | 6 | 6 | |||||||||||
| synonymous SNV | 3 | 1 | 2 | 1 | 1 | 1 | 2 | 1 |
| cf) Tissue ID; Tissue type (1; BLCA[Bladder Urothelial Carcinoma], 2; BRCA[Breast invasive carcinoma], 3; CESC[Cervical squamous cell carcinoma and endocervical adenocarcinoma], 4; COAD[Colon adenocarcinoma], 5; GBM[Glioblastoma multiforme], 6; Glioma Low Grade, 7; HNSC[Head and Neck squamous cell carcinoma], 8; KICH[Kidney Chromophobe], 9; KIRC[Kidney renal clear cell carcinoma], 10; KIRP[Kidney renal papillary cell carcinoma], 11; LAML[Acute Myeloid Leukemia], 12; LUAD[Lung adenocarcinoma], 13; LUSC[Lung squamous cell carcinoma], 14; OV[Ovarian serous cystadenocarcinoma ], 15; PAAD[Pancreatic adenocarcinoma], 16; PRAD[Prostate adenocarcinoma], 17; SKCM[Skin Cutaneous Melanoma], 18:STAD[Stomach adenocarcinoma], 19:THCA[Thyroid carcinoma], 20:UCEC[Uterine Corpus Endometrial Carcinoma]) |
| Top |
| * We represented just top 10 SNVs. When you move the cursor on each content, you can see more deailed mutation information on the Tooltip. Those are primary_site, primary_histology, mutation(aa), pubmedID. |
| Genomic Position | Mutation(aa) | Unique sampleID count |
| chr5:137894317 | p.T480T | 2 |
| chr5:137893590 | p.T455T | 1 |
| chr5:137902355 | p.L182L | 1 |
| chr5:137891797 | p.S657P | 1 |
| chr5:137906670 | p.T433T | 1 |
| chr5:137893599 | p.D130G | 1 |
| chr5:137902369 | p.Y652Y | 1 |
| chr5:137892147 | p.G430S | 1 |
| chr5:137906699 | p.T120T | 1 |
| chr5:137893663 | p.F648L | 1 |
| * Copy number data were extracted from TCGA using R package TCGA-Assembler. The URLs of all public data files on TCGA DCC data server were gathered on Jan-05-2015. Function ProcessCNAData in TCGA-Assembler package was used to obtain gene-level copy number value which is calculated as the average copy number of the genomic region of a gene. |
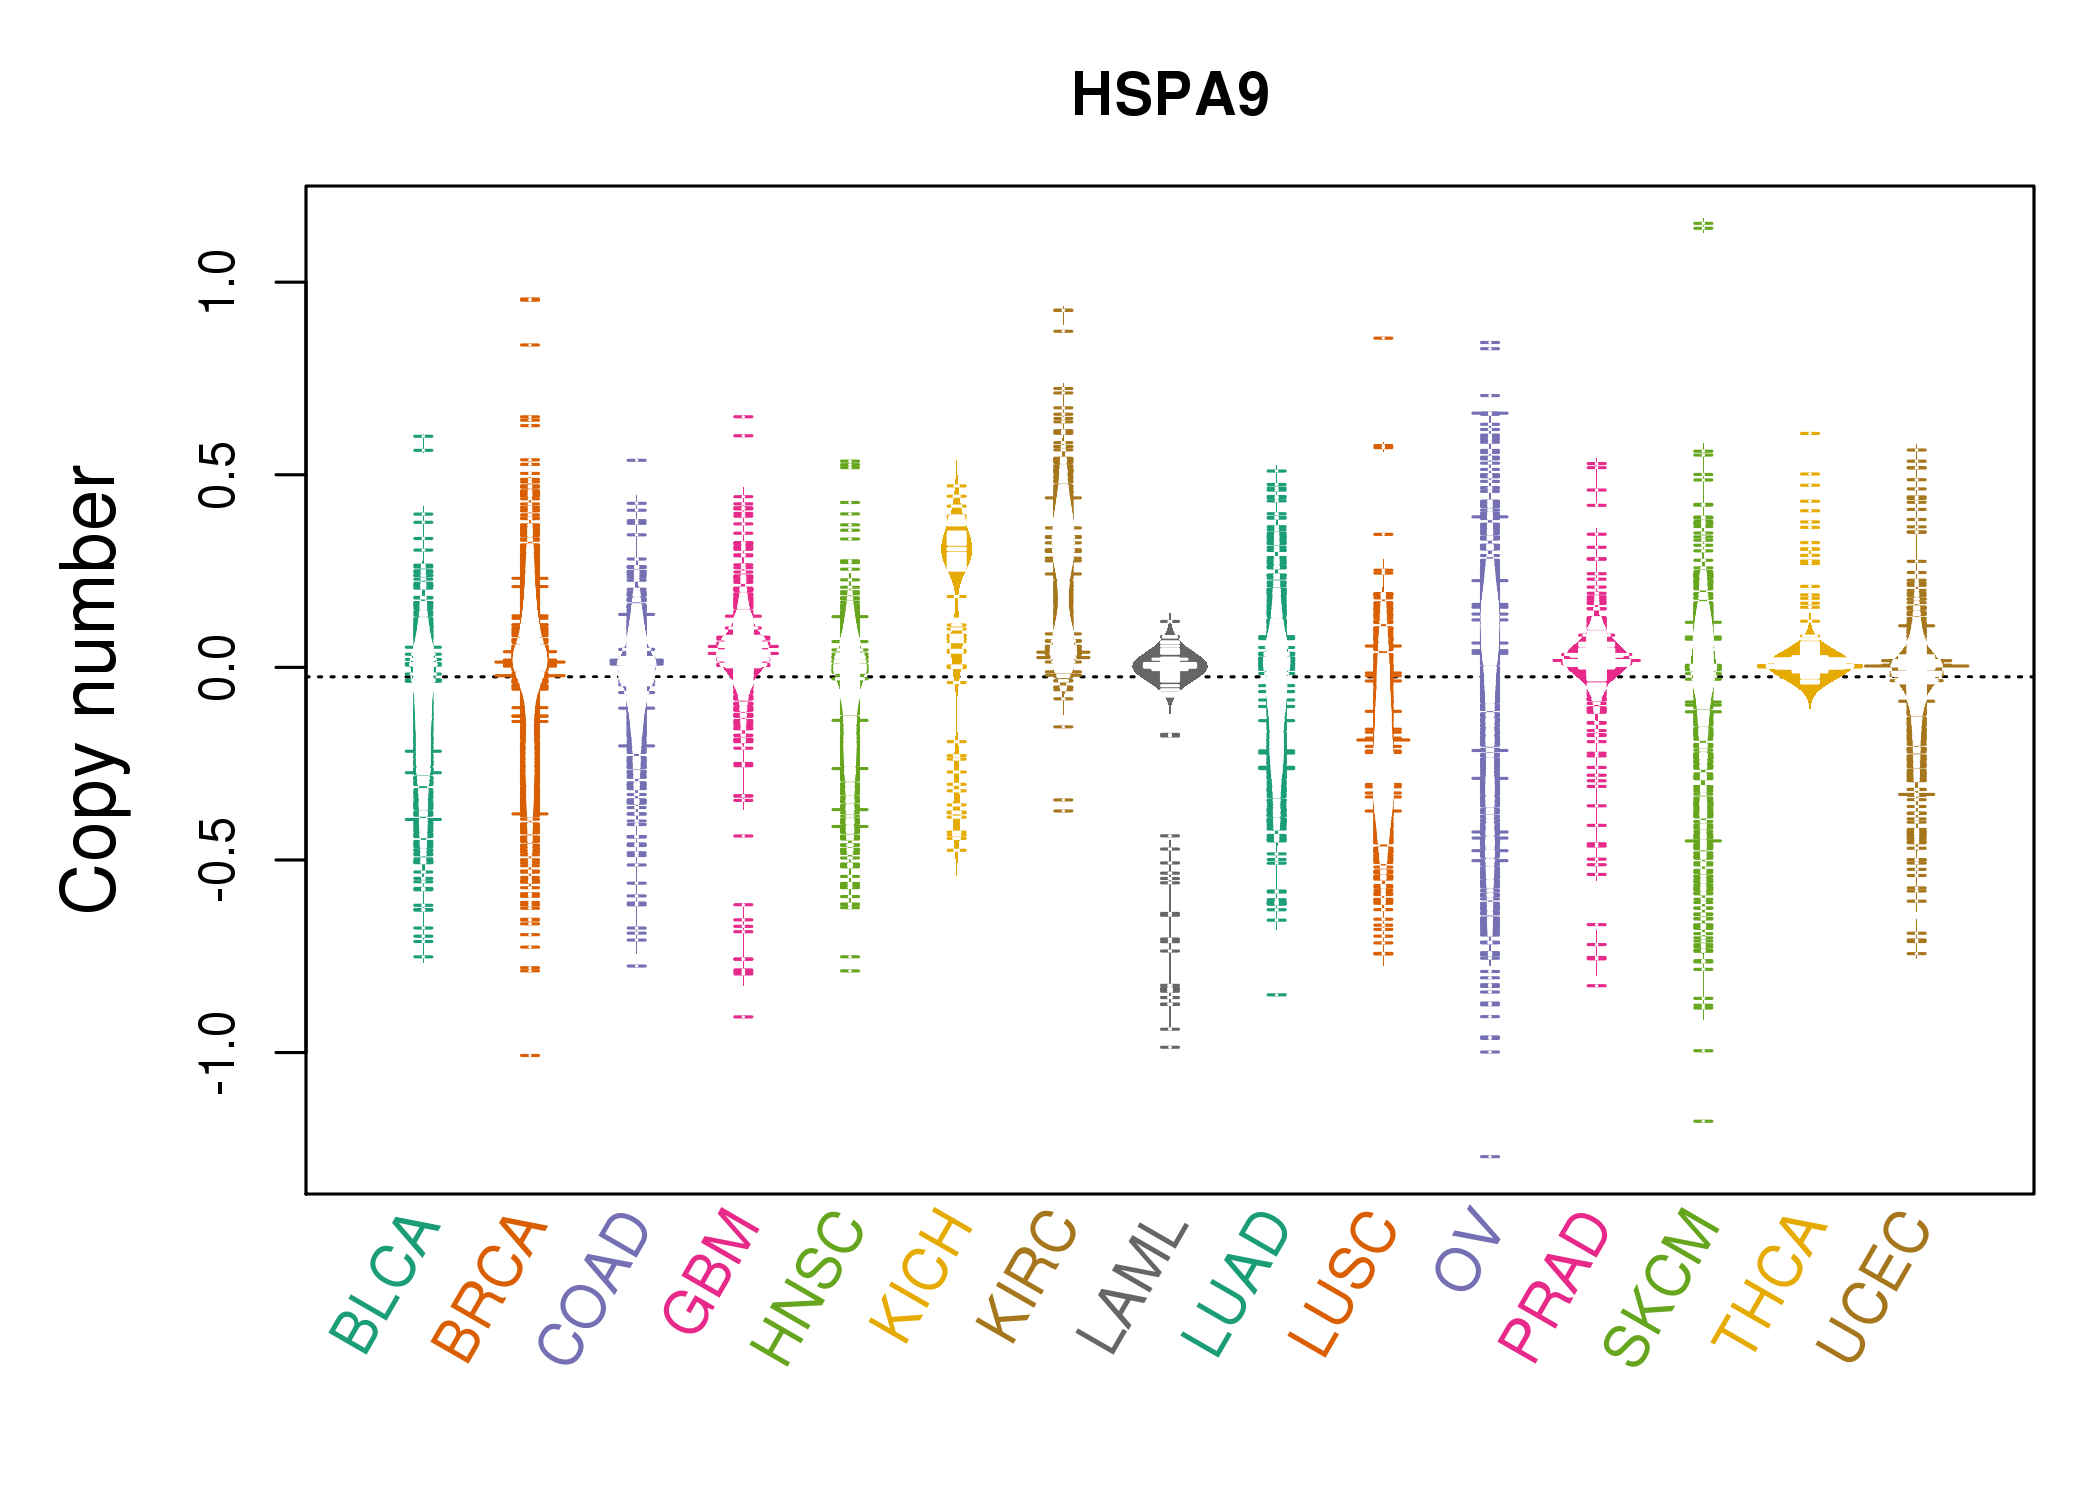 |
| cf) Tissue ID[Tissue type]: BLCA[Bladder Urothelial Carcinoma], BRCA[Breast invasive carcinoma], CESC[Cervical squamous cell carcinoma and endocervical adenocarcinoma], COAD[Colon adenocarcinoma], GBM[Glioblastoma multiforme], Glioma Low Grade, HNSC[Head and Neck squamous cell carcinoma], KICH[Kidney Chromophobe], KIRC[Kidney renal clear cell carcinoma], KIRP[Kidney renal papillary cell carcinoma], LAML[Acute Myeloid Leukemia], LUAD[Lung adenocarcinoma], LUSC[Lung squamous cell carcinoma], OV[Ovarian serous cystadenocarcinoma ], PAAD[Pancreatic adenocarcinoma], PRAD[Prostate adenocarcinoma], SKCM[Skin Cutaneous Melanoma], STAD[Stomach adenocarcinoma], THCA[Thyroid carcinoma], UCEC[Uterine Corpus Endometrial Carcinoma] |
| Top |
| Gene Expression for HSPA9 |
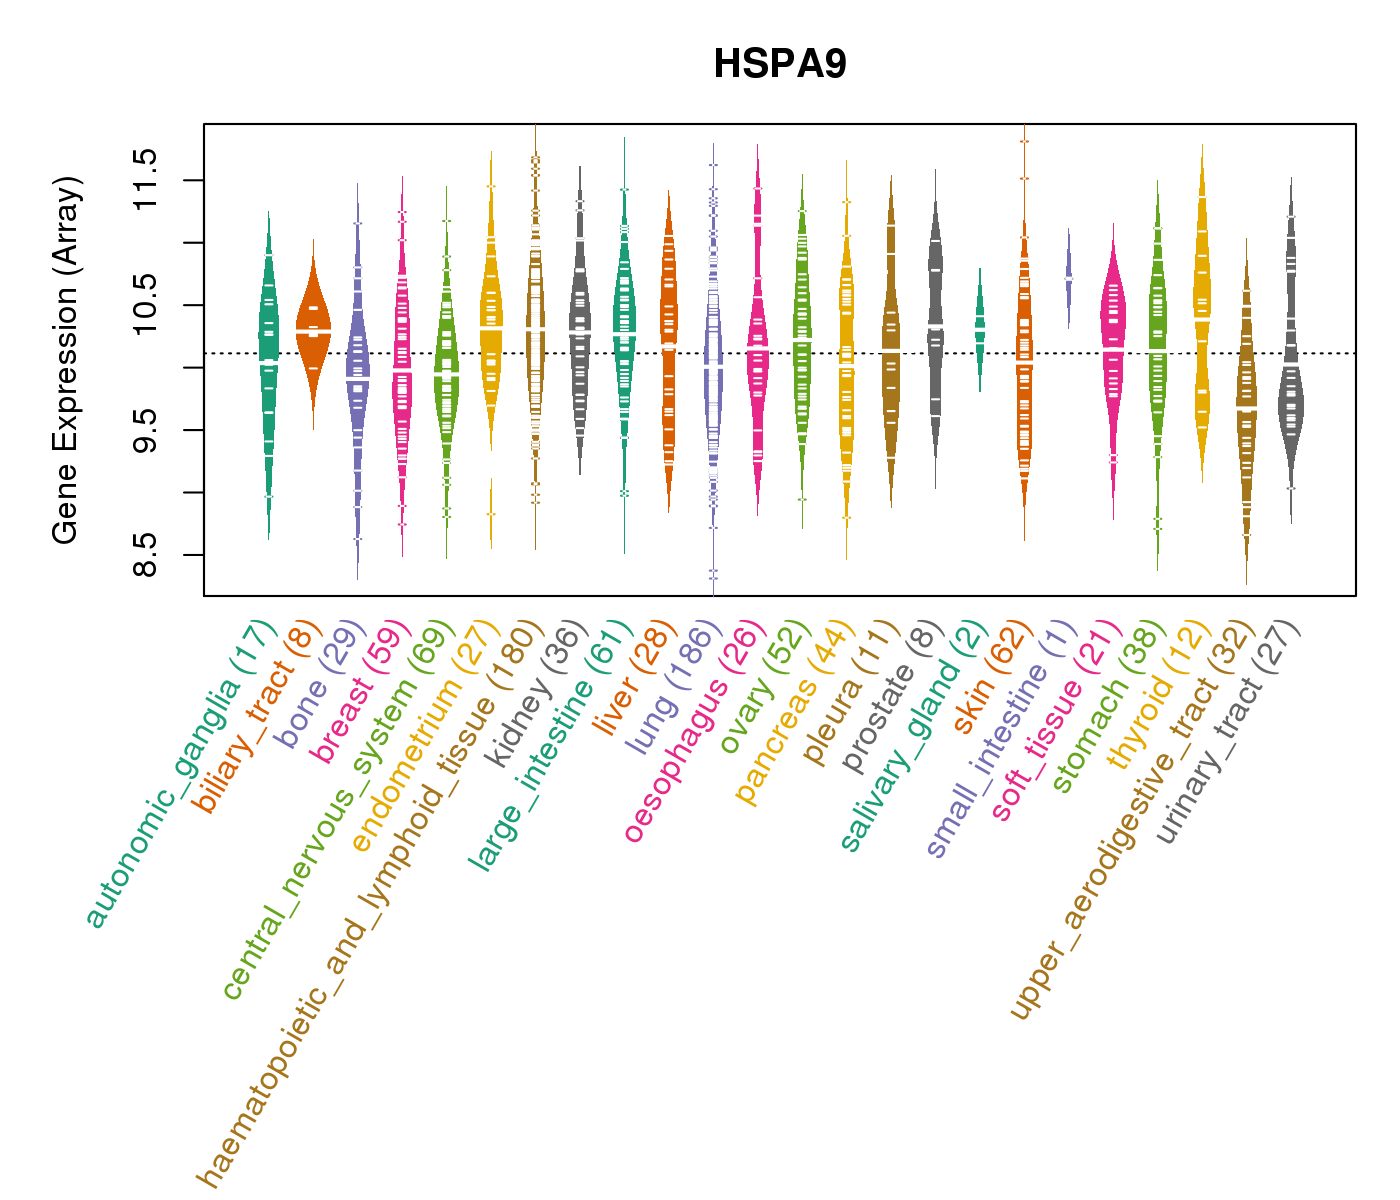
| * CCLE gene expression data were extracted from CCLE_Expression_Entrez_2012-10-18.res: Gene-centric RMA-normalized mRNA expression data. |
 |
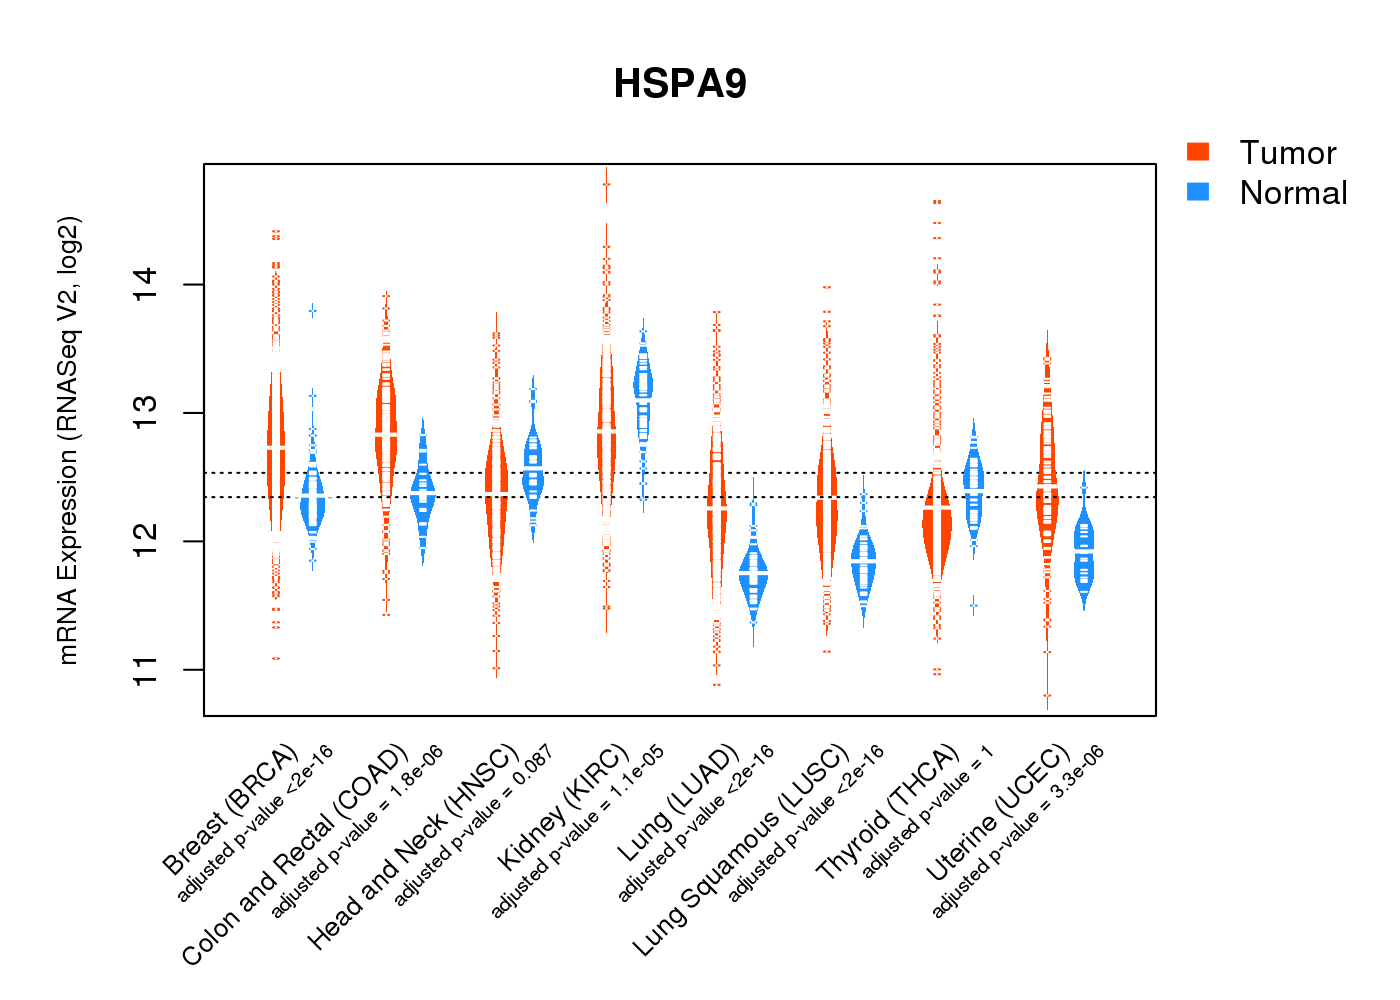
| * Normalized gene expression data of RNASeqV2 was extracted from TCGA using R package TCGA-Assembler. The URLs of all public data files on TCGA DCC data server were gathered at Jan-05-2015. Only eight cancer types have enough normal control samples for differential expression analysis. (t test, adjusted p<0.05 (using Benjamini-Hochberg FDR)) |
 |
| Top |
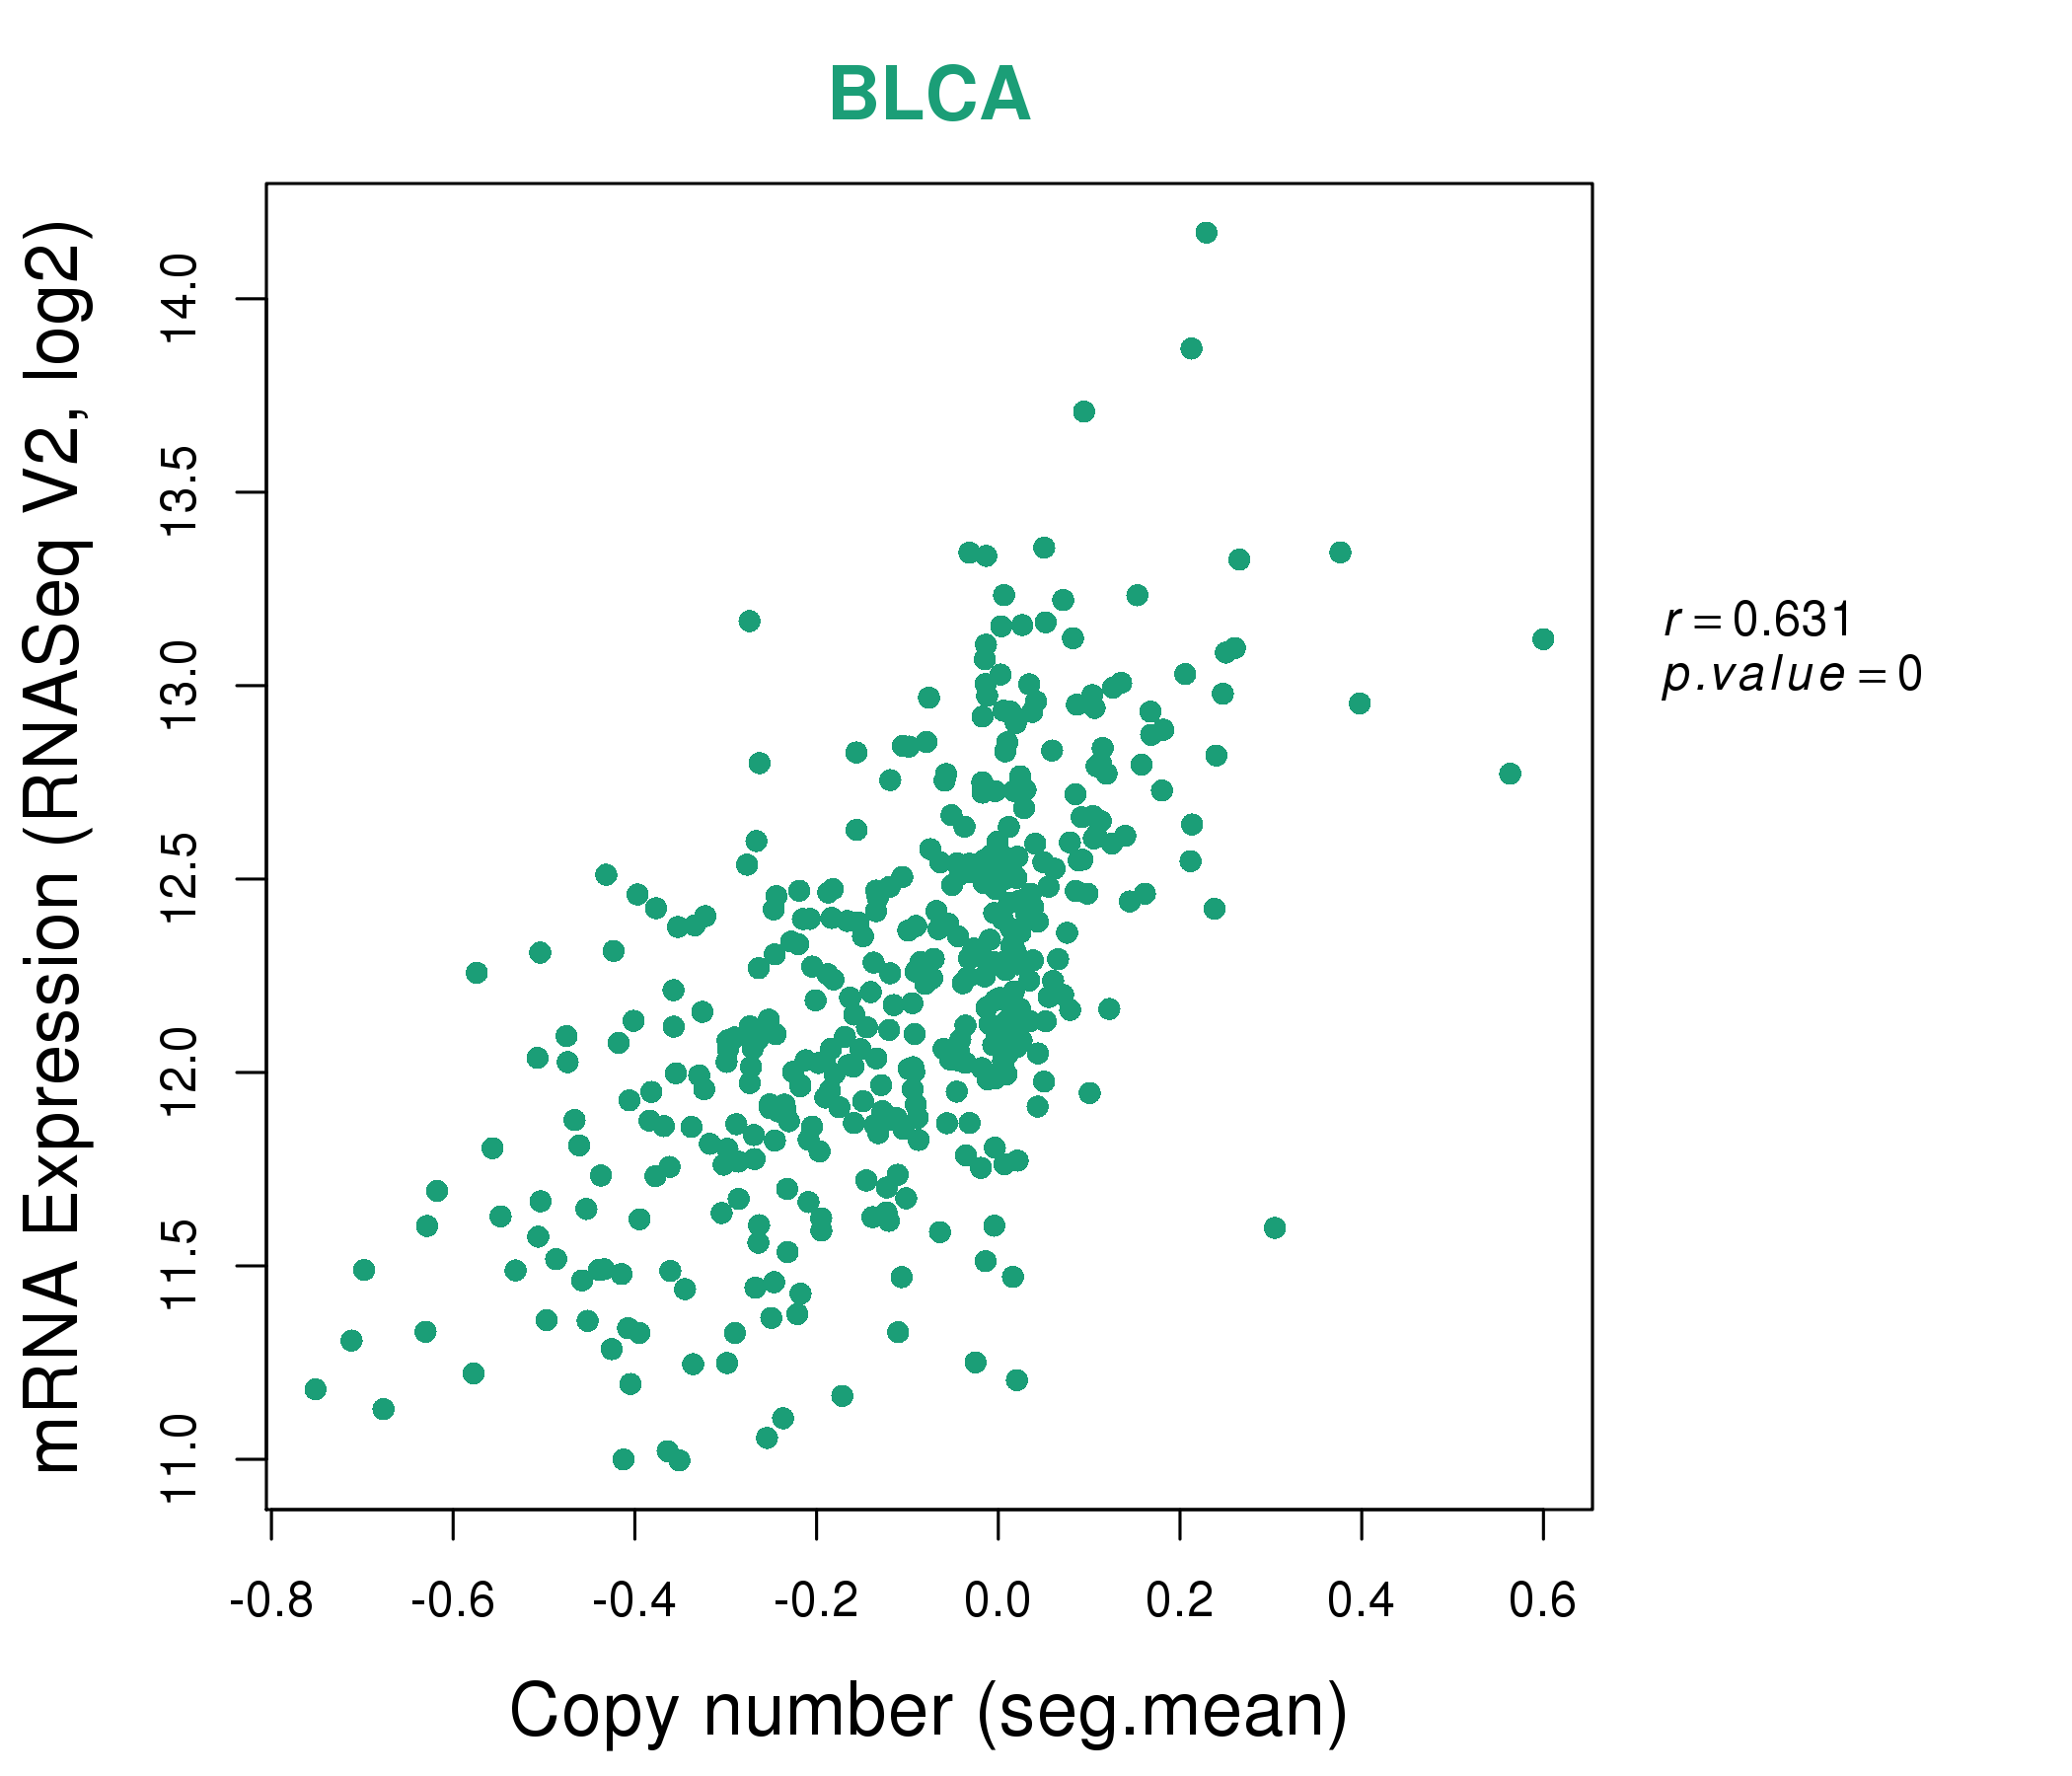
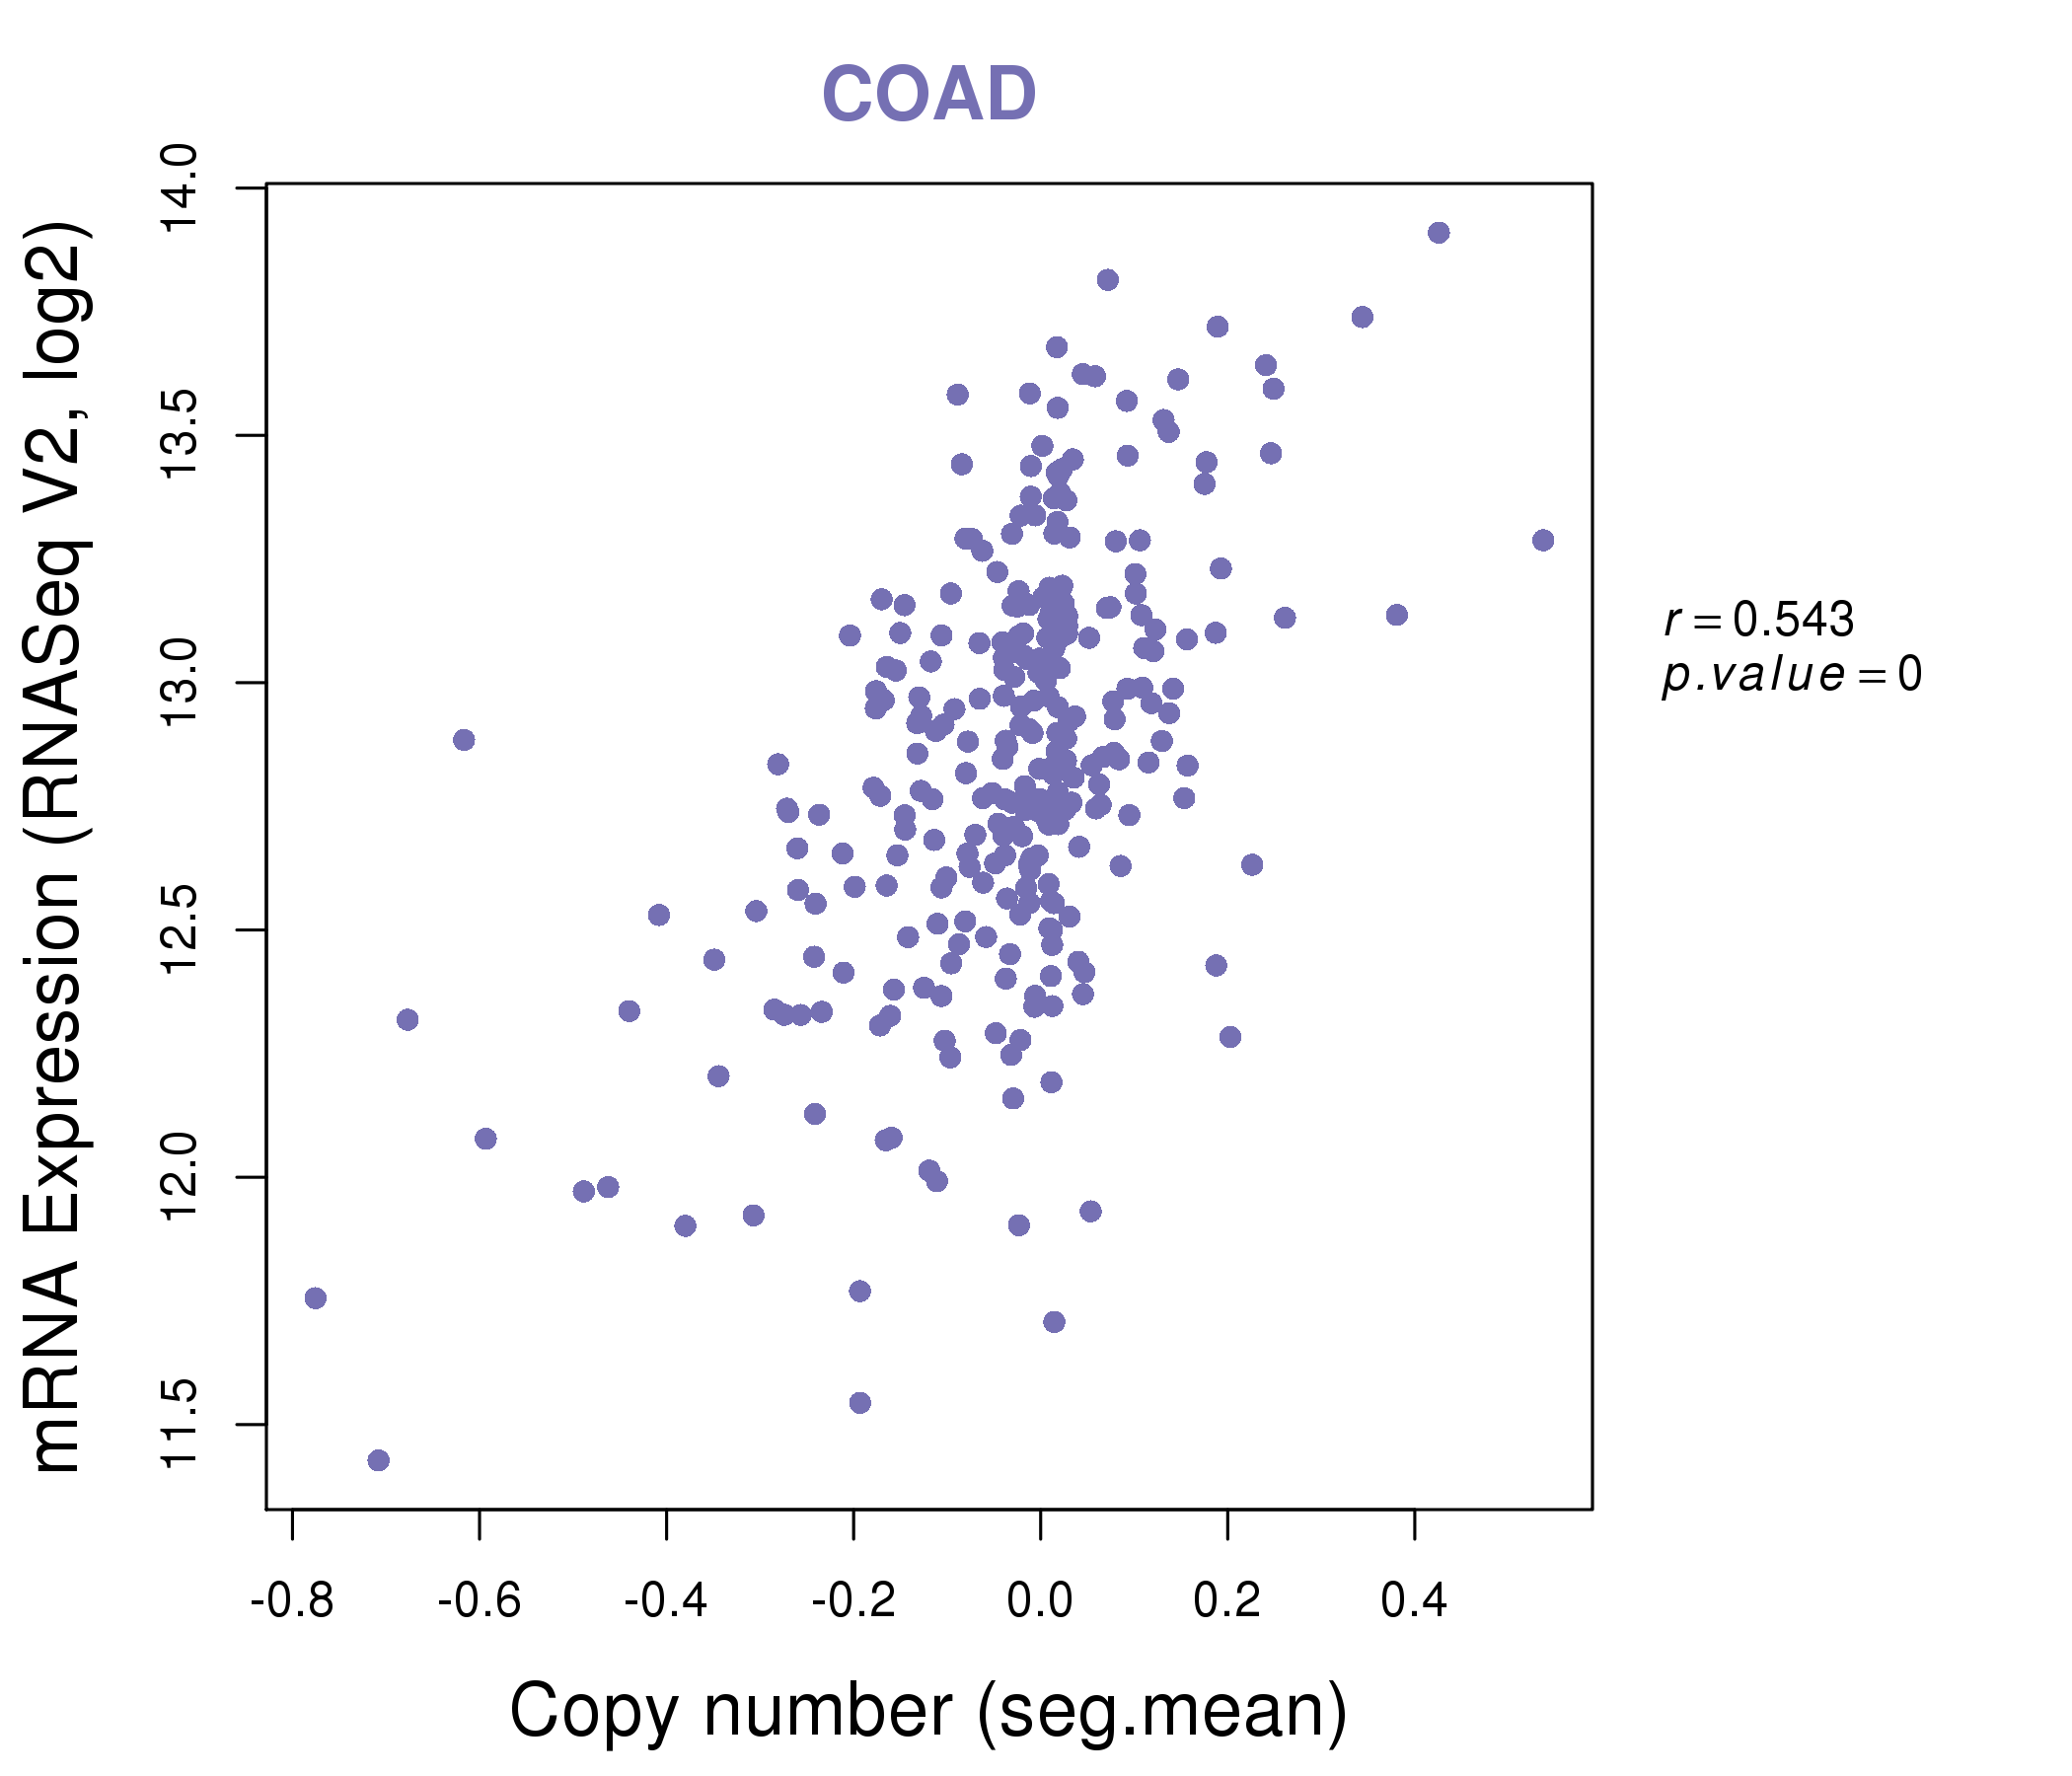
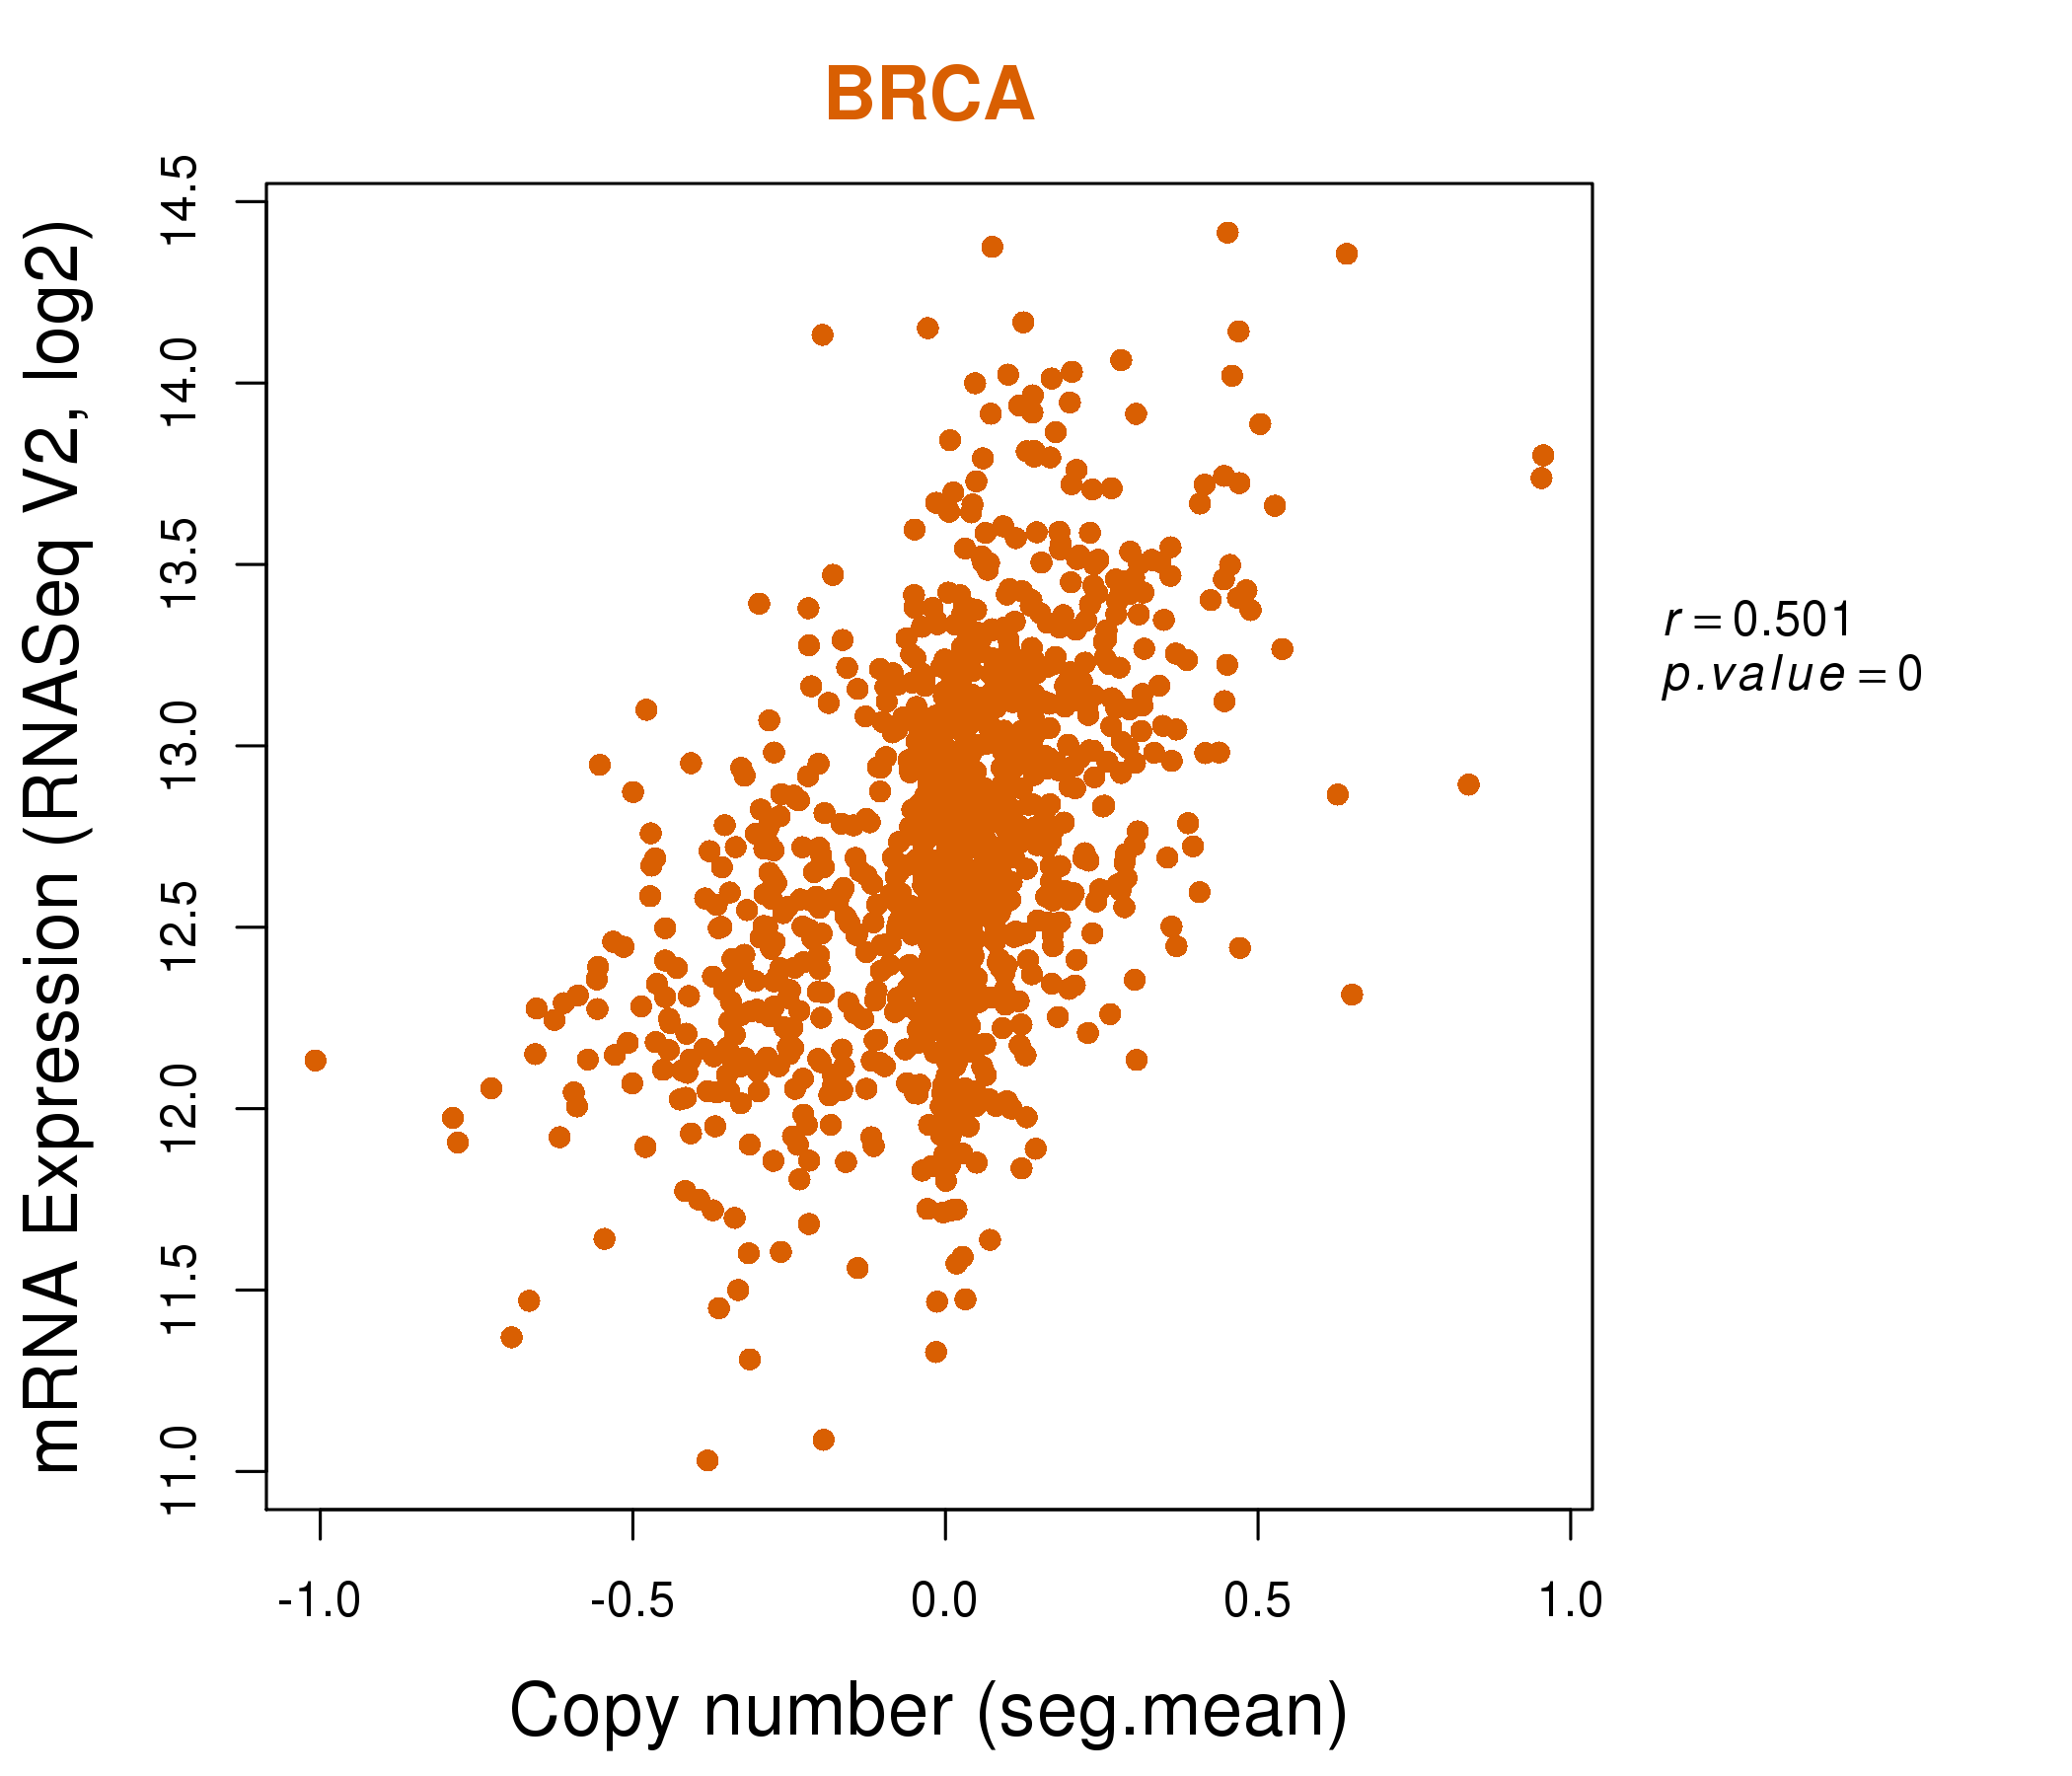
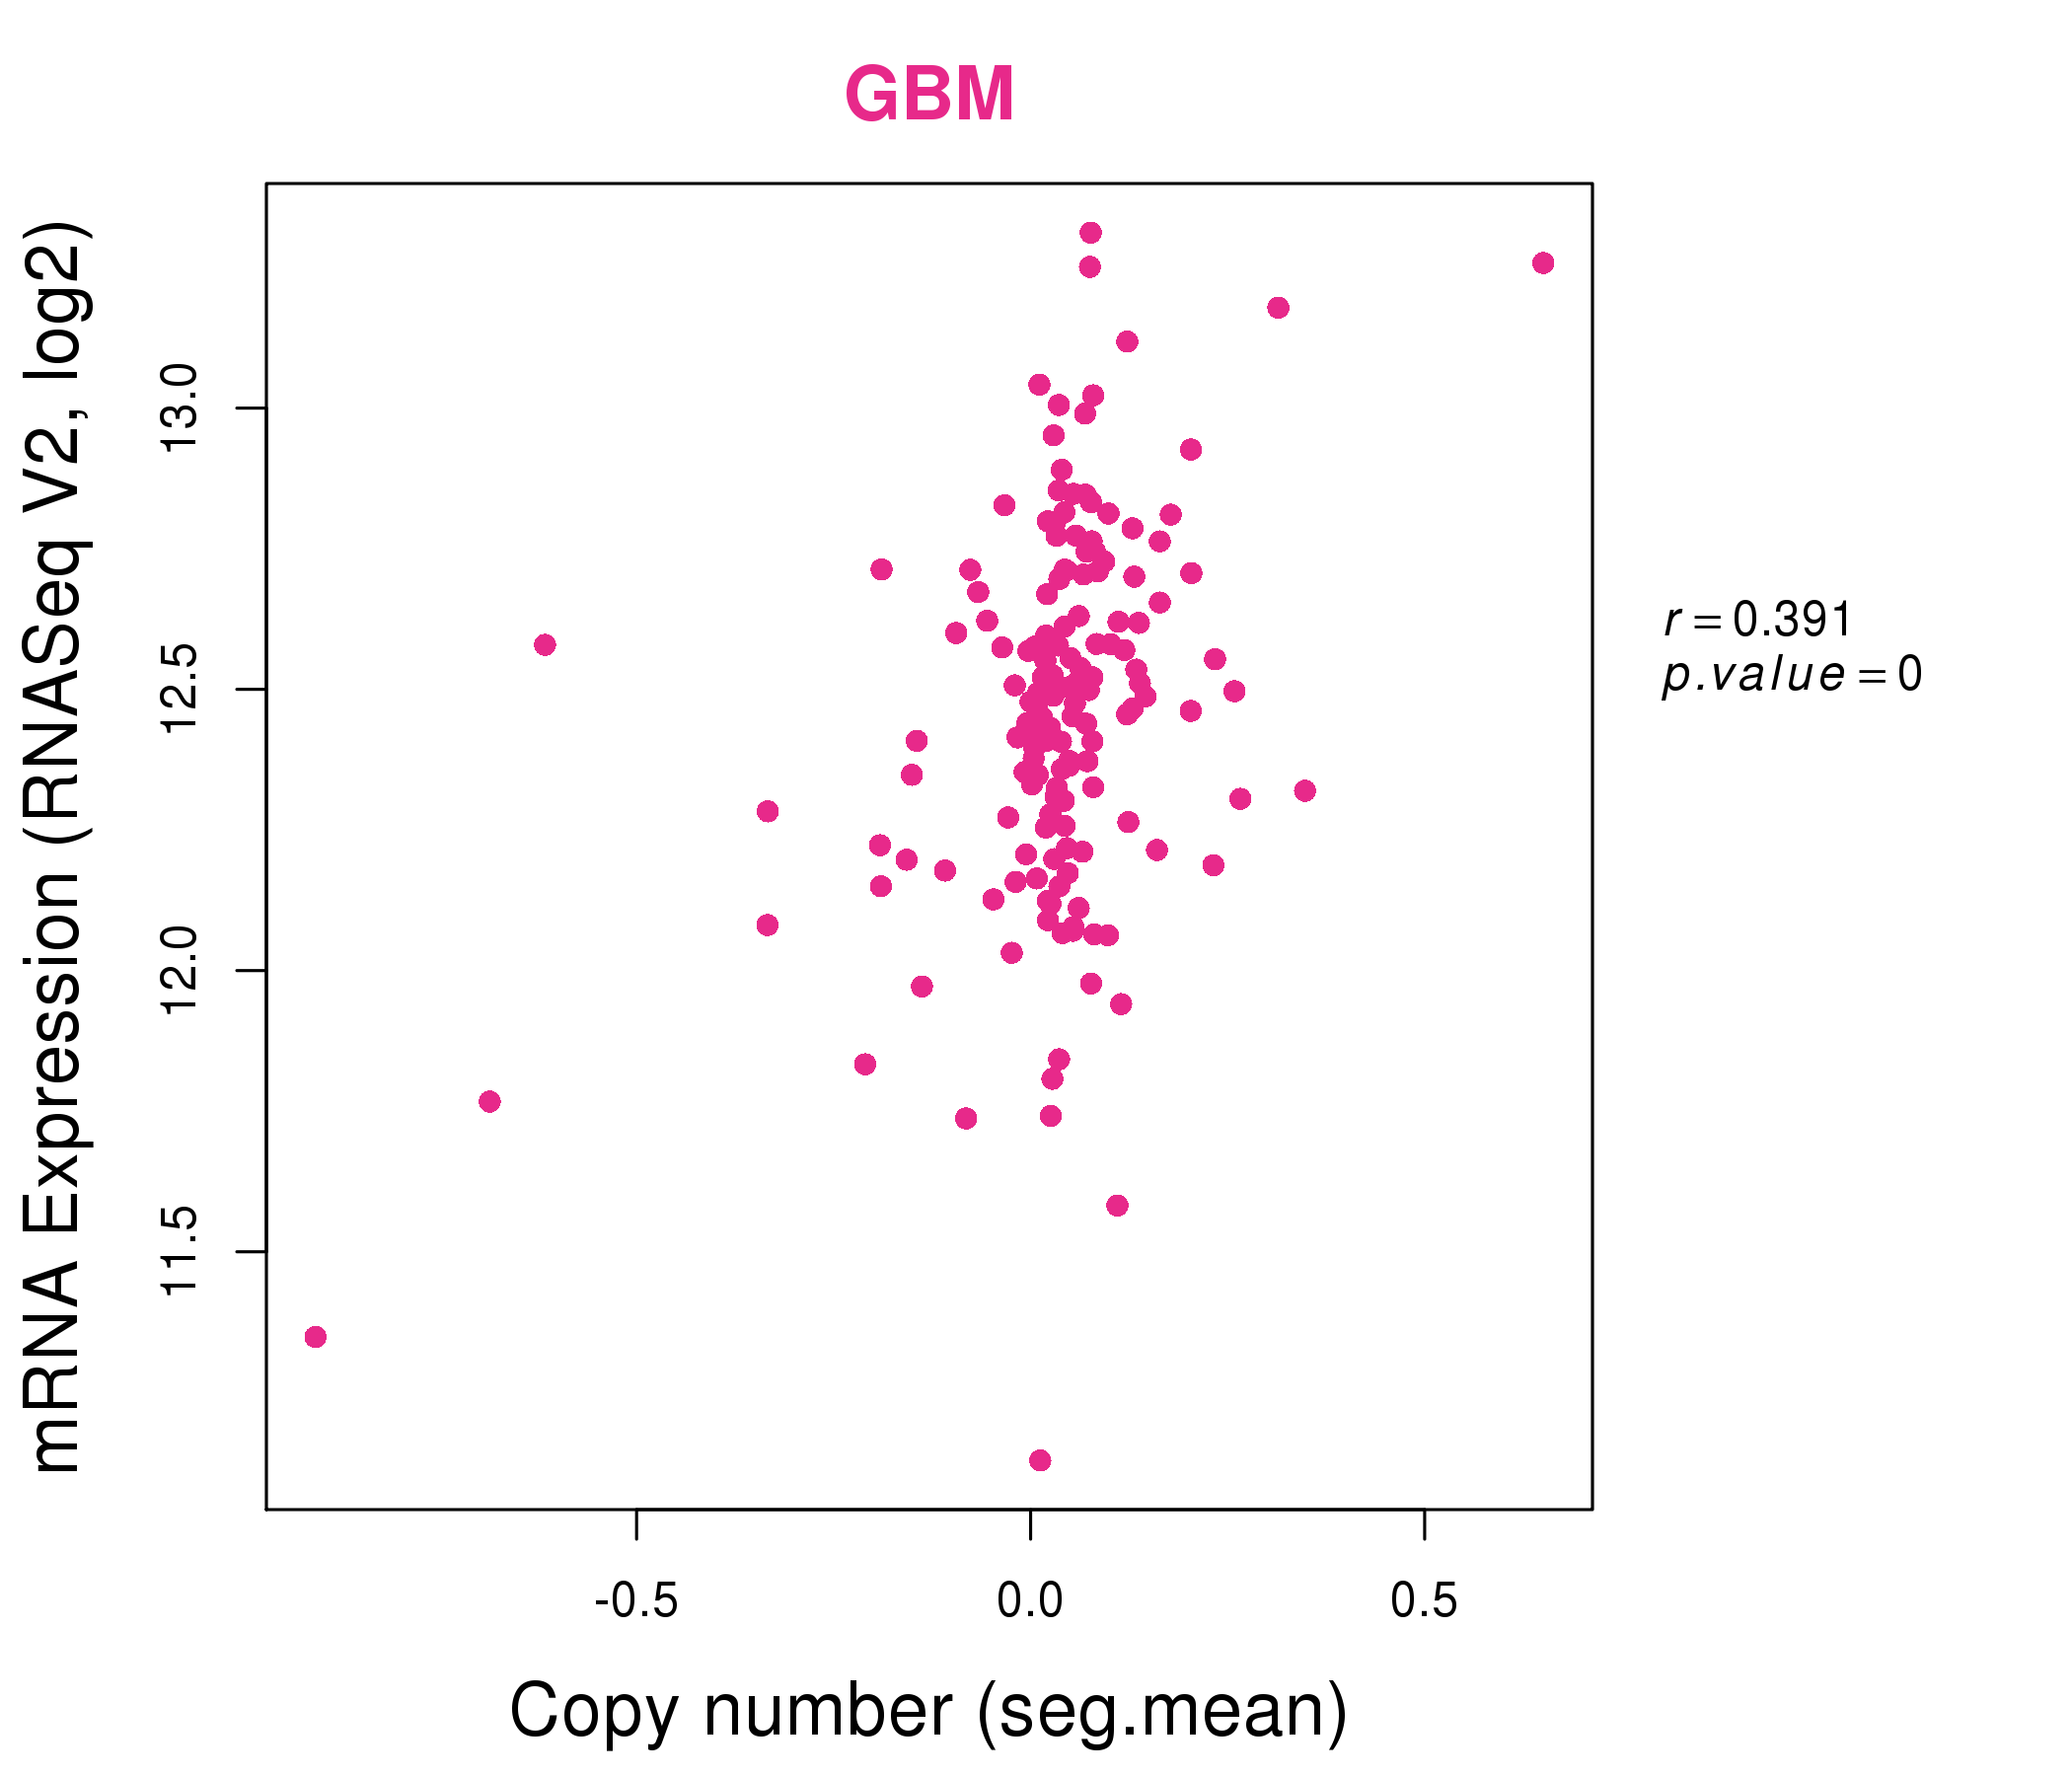
| * This plots show the correlation between CNV and gene expression. |
: Open all plots for all cancer types
 |
|
 |
|
| Top |
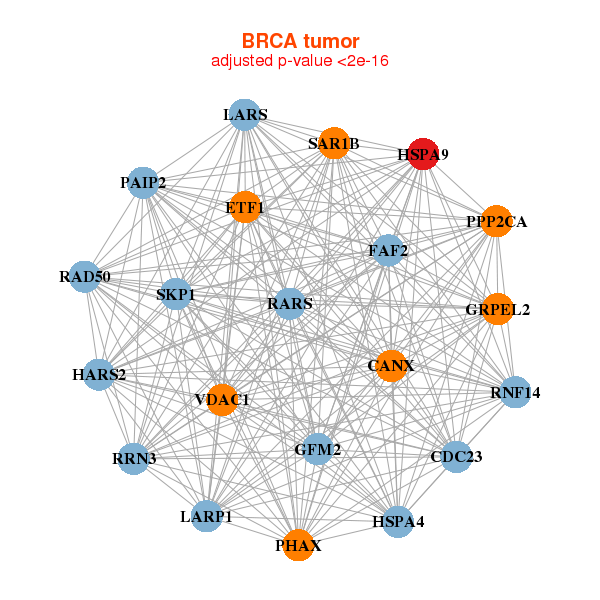
| Gene-Gene Network Information |
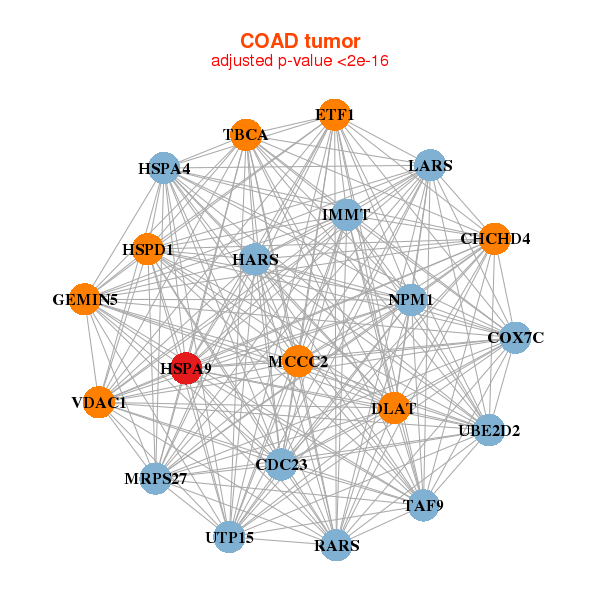
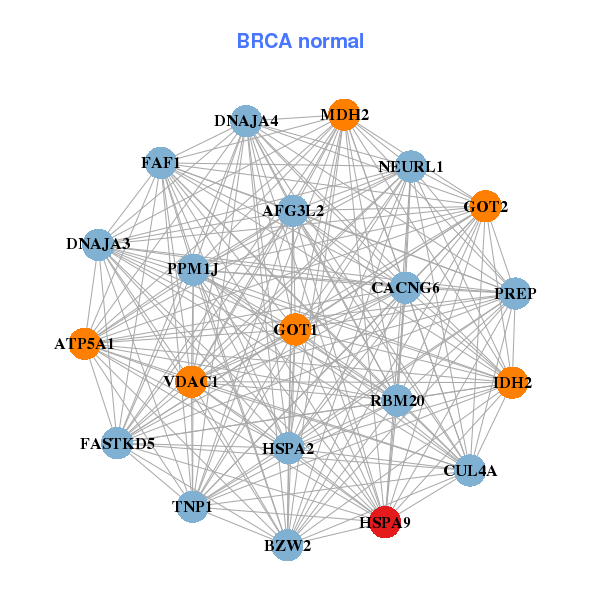
| * Co-Expression network figures were drawn using R package igraph. Only the top 20 genes with the highest correlations were shown. Red circle: input gene, orange circle: cell metabolism gene, sky circle: other gene |
: Open all plots for all cancer types
 |
|
| CANX,CDC23,ETF1,FAF2,GFM2,GRPEL2,HARS2, HSPA4,HSPA9,LARP1,LARS,PAIP2,PHAX,PPP2CA, RAD50,RARS,RNF14,RRN3,SAR1B,SKP1,VDAC1 | AFG3L2,ATP5A1,BZW2,CACNG6,CUL4A,DNAJA3,DNAJA4, FAF1,FASTKD5,GOT1,GOT2,HSPA2,HSPA9,IDH2, MDH2,NEURL1,PPM1J,PREP,RBM20,TNP1,VDAC1 |
 |
|
| CDC23,CHCHD4,COX7C,DLAT,ETF1,GEMIN5,HARS, HSPA4,HSPA9,HSPD1,IMMT,LARS,MCCC2,MRPS27, NPM1,RARS,TAF9,TBCA,UBE2D2,UTP15,VDAC1 | CDC25A,DARS2,DLAT,FUBP1,G3BP1,GAR1,HSPA9, HSPD1,LRPPRC,MCCC2,MCM4,MIPEP,NARS,NOL10, NOP14,PAICS,SFPQ,SRSF1,SLC5A6,SRPK1,STT3B |
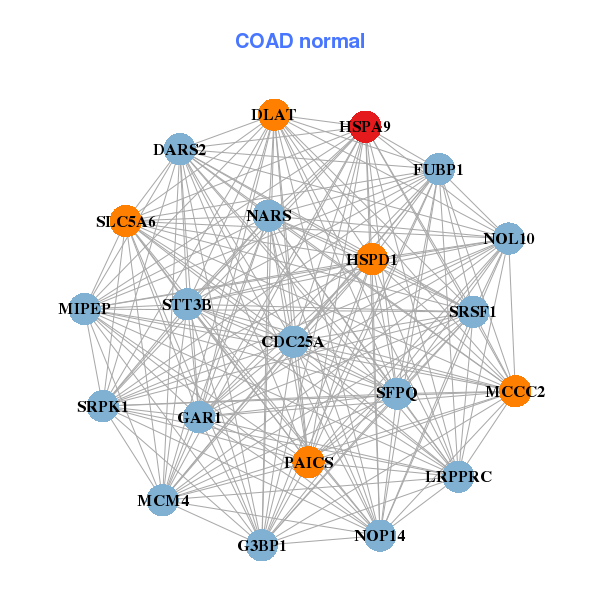
| * Co-Expression network figures were drawn using R package igraph. Only the top 20 genes with the highest correlations were shown. Red circle: input gene, orange circle: cell metabolism gene, sky circle: other gene |
: Open all plots for all cancer types
| Top |
: Open all interacting genes' information including KEGG pathway for all interacting genes from DAVID
| Top |
| Pharmacological Information for HSPA9 |
| There's no related Drug. |
| Top |
| Cross referenced IDs for HSPA9 |
| * We obtained these cross-references from Uniprot database. It covers 150 different DBs, 18 categories. http://www.uniprot.org/help/cross_references_section |
: Open all cross reference information
|
Copyright © 2016-Present - The Univsersity of Texas Health Science Center at Houston @ |