|
||||||||||||||||||||
| |
| Phenotypic Information (metabolism pathway, cancer, disease, phenome) |
| |
| |
| Gene-Gene Network Information: Co-Expression Network, Interacting Genes & KEGG |
| |
|


| Gene Summary for HSPB1 |
| Basic gene info. | Gene symbol | HSPB1 |
| Gene name | heat shock 27kDa protein 1 | |
| Synonyms | CMT2F|HEL-S-102|HMN2B|HS.76067|HSP27|HSP28|Hsp25|SRP27 | |
| Cytomap | UCSC genome browser: 7q11.23 | |
| Genomic location | chr7 :75931874-75933614 | |
| Type of gene | protein-coding | |
| RefGenes | NM_001540.3, | |
| Ensembl id | ENSG00000106211 | |
| Description | 28 kDa heat shock proteinHSP 27epididymis secretory protein Li 102estrogen-regulated 24 kDa proteinheat shock 27 kDa proteinheat shock 27kD protein 1heat shock protein beta-1stress-responsive protein 27 | |
| Modification date | 20141219 | |
| dbXrefs | MIM : 602195 | |
| HGNC : HGNC | ||
| Ensembl : ENSG00000106211 | ||
| HPRD : 09076 | ||
| Vega : OTTHUMG00000023228 | ||
| Protein | UniProt: P04792 go to UniProt's Cross Reference DB Table | |
| Expression | CleanEX: HS_HSPB1 | |
| BioGPS: 3315 | ||
| Gene Expression Atlas: ENSG00000106211 | ||
| The Human Protein Atlas: ENSG00000106211 | ||
| Pathway | NCI Pathway Interaction Database: HSPB1 | |
| KEGG: HSPB1 | ||
| REACTOME: HSPB1 | ||
| ConsensusPathDB | ||
| Pathway Commons: HSPB1 | ||
| Metabolism | MetaCyc: HSPB1 | |
| HUMANCyc: HSPB1 | ||
| Regulation | Ensembl's Regulation: ENSG00000106211 | |
| miRBase: chr7 :75,931,874-75,933,614 | ||
| TargetScan: NM_001540 | ||
| cisRED: ENSG00000106211 | ||
| Context | iHOP: HSPB1 | |
| cancer metabolism search in PubMed: HSPB1 | ||
| UCL Cancer Institute: HSPB1 | ||
| Assigned class in ccmGDB | A - This gene has a literature evidence and it belongs to cancer gene. | |
| References showing role of HSPB1 in cancer cell metabolism | 1. Sun X, Ou Z, Xie M, Kang R, Fan Y, et al. (2015) HSPB1 as a novel regulator of ferroptotic cancer cell death. Oncogene. doi: 10.1038/onc.2015.32. go to article | |
| Top |
| Phenotypic Information for HSPB1(metabolism pathway, cancer, disease, phenome) |
| Cancer | CGAP: HSPB1 |
| Familial Cancer Database: HSPB1 | |
| * This gene is included in those cancer gene databases. |
|
|
|
|
|
| . | ||||||||||||||
Oncogene 1 | Significant driver gene in | |||||||||||||||||||
| cf) number; DB name 1 Oncogene; http://nar.oxfordjournals.org/content/35/suppl_1/D721.long, 2 Tumor Suppressor gene; https://bioinfo.uth.edu/TSGene/, 3 Cancer Gene Census; http://www.nature.com/nrc/journal/v4/n3/abs/nrc1299.html, 4 CancerGenes; http://nar.oxfordjournals.org/content/35/suppl_1/D721.long, 5 Network of Cancer Gene; http://ncg.kcl.ac.uk/index.php, 1Therapeutic Vulnerabilities in Cancer; http://cbio.mskcc.org/cancergenomics/statius/ |
| REACTOME_METABOLISM_OF_MRNA REACTOME_METABOLISM_OF_RNA | |
| OMIM | 602195; gene. 602195; gene. 606595; phenotype. 606595; phenotype. 608634; phenotype. 608634; phenotype. |
| Orphanet | 139525; Distal hereditary motor neuropathy type 2. 139525; Distal hereditary motor neuropathy type 2. 99940; Autosomal dominant Charcot-Marie-Tooth disease type 2F. 99940; Autosomal dominant Charcot-Marie-Tooth disease type 2F. |
| Disease | KEGG Disease: HSPB1 |
| MedGen: HSPB1 (Human Medical Genetics with Condition) | |
| ClinVar: HSPB1 | |
| Phenotype | MGI: HSPB1 (International Mouse Phenotyping Consortium) |
| PhenomicDB: HSPB1 | |
| Mutations for HSPB1 |
| * Under tables are showing count per each tissue to give us broad intuition about tissue specific mutation patterns.You can go to the detailed page for each mutation database's web site. |
| There's no structural variation information in COSMIC data for this gene. |
| * From mRNA Sanger sequences, Chitars2.0 arranged chimeric transcripts. This table shows HSPB1 related fusion information. |
| ID | Head Gene | Tail Gene | Accession | Gene_a | qStart_a | qEnd_a | Chromosome_a | tStart_a | tEnd_a | Gene_a | qStart_a | qEnd_a | Chromosome_a | tStart_a | tEnd_a |
| AA903814 | HSPB1 | 1 | 85 | 7 | 75933533 | 75933895 | EGR1 | 77 | 212 | 5 | 137801706 | 137802528 | |
| AJ710478 | SKP1 | 2 | 257 | 5 | 133496716 | 133509692 | HSPB1 | 257 | 365 | 7 | 75932016 | 75932124 | |
| BU737515 | HSPB1 | 19 | 94 | 7 | 75933537 | 75933612 | STXBP1 | 89 | 413 | 9 | 130454104 | 130454428 | |
| DA893722 | TNNC2 | 1 | 173 | 20 | 44453224 | 44455951 | HSPB1 | 172 | 475 | 7 | 75932242 | 75933388 | |
| CD387519 | HSPB1 | 24 | 228 | 7 | 75931990 | 75932194 | UBE2M | 226 | 934 | 19 | 59067367 | 59069801 | |
| DA283619 | HSPB1 | 1 | 113 | 7 | 75931992 | 75932104 | RAPGEF5 | 112 | 575 | 7 | 22159500 | 22159963 | |
| N36356 | RMRP | 2 | 252 | 9 | 35657753 | 35658003 | HSPB1 | 249 | 529 | 7 | 75932236 | 75933353 | |
| AI470274 | HSPB1 | 8 | 65 | 7 | 75933548 | 75933605 | FARP2 | 58 | 202 | 2 | 242382597 | 242382741 | |
| R77849 | GJC1 | 1 | 224 | 17 | 42878774 | 42878996 | HSPB1 | 220 | 298 | 7 | 75933535 | 75933612 | |
| Z23090 | XPO5 | 460 | 484 | 6 | 43506601 | 43506625 | HSPB1 | 478 | 1231 | 7 | 75932016 | 75933612 | |
| AI609727 | HSPB1 | 1 | 417 | 7 | 75932066 | 75933611 | HSPB1 | 412 | 459 | 7 | 75933328 | 75933375 | |
| BU631277 | HSPB1 | 25 | 94 | 7 | 75933535 | 75933603 | WASF1 | 87 | 586 | 6 | 110423249 | 110426758 | |
| DA537518 | HSPB1 | 1 | 99 | 7 | 75931994 | 75932092 | OBSL1 | 84 | 540 | 2 | 220432891 | 220435250 | |
| AI123558 | HSPB1 | 4 | 69 | 7 | 75933544 | 75933609 | DDX17 | 57 | 418 | 22 | 38884189 | 38884549 | |
| AI801539 | HSPB1 | 24 | 169 | 7 | 75933457 | 75933602 | HSPB1 | 165 | 488 | 7 | 75932071 | 75932394 | |
| CA336509 | HSPB1 | 2 | 78 | 7 | 75932992 | 75933068 | KRT19 | 74 | 186 | 17 | 39679869 | 39679981 | |
| Top |
| There's no copy number variation information in COSMIC data for this gene. |
| Top |
|
 |
| Top |
| Stat. for Non-Synonymous SNVs (# total SNVs=6) | (# total SNVs=2) |
 |  |
(# total SNVs=0) | (# total SNVs=0) |
| Top |
| * When you move the cursor on each content, you can see more deailed mutation information on the Tooltip. Those are primary_site,primary_histology,mutation(aa),pubmedID. |
| GRCh37 position | Mutation(aa) | Unique sampleID count |
| chr7:75933416-75933416 | p.P182S | 1 |
| chr7:75933446-75933446 | p.G192W | 1 |
| chr7:75932036-75932036 | p.E3Q | 1 |
| chr7:75933484-75933484 | p.A204A | 1 |
| chr7:75932058-75932058 | p.L10H | 1 |
| chr7:75932122-75932122 | p.Q31Q | 1 |
| chr7:75932270-75932270 | p.L81I | 1 |
| chr7:75932376-75932376 | p.G116V | 1 |
| chr7:75933134-75933134 | p.R127Q | 1 |
| chr7:75933348-75933348 | p.P159H | 1 |
| Top |
|
 |
| Point Mutation/ Tissue ID | 1 | 2 | 3 | 4 | 5 | 6 | 7 | 8 | 9 | 10 | 11 | 12 | 13 | 14 | 15 | 16 | 17 | 18 | 19 | 20 |
| # sample | 2 | 1 | 2 | 1 | 2 | 1 | ||||||||||||||
| # mutation | 2 | 1 | 2 | 1 | 2 | 1 | ||||||||||||||
| nonsynonymous SNV | 1 | 1 | 1 | 2 | ||||||||||||||||
| synonymous SNV | 1 | 2 | 1 |
| cf) Tissue ID; Tissue type (1; BLCA[Bladder Urothelial Carcinoma], 2; BRCA[Breast invasive carcinoma], 3; CESC[Cervical squamous cell carcinoma and endocervical adenocarcinoma], 4; COAD[Colon adenocarcinoma], 5; GBM[Glioblastoma multiforme], 6; Glioma Low Grade, 7; HNSC[Head and Neck squamous cell carcinoma], 8; KICH[Kidney Chromophobe], 9; KIRC[Kidney renal clear cell carcinoma], 10; KIRP[Kidney renal papillary cell carcinoma], 11; LAML[Acute Myeloid Leukemia], 12; LUAD[Lung adenocarcinoma], 13; LUSC[Lung squamous cell carcinoma], 14; OV[Ovarian serous cystadenocarcinoma ], 15; PAAD[Pancreatic adenocarcinoma], 16; PRAD[Prostate adenocarcinoma], 17; SKCM[Skin Cutaneous Melanoma], 18:STAD[Stomach adenocarcinoma], 19:THCA[Thyroid carcinoma], 20:UCEC[Uterine Corpus Endometrial Carcinoma]) |
| Top |
| * We represented just top 10 SNVs. When you move the cursor on each content, you can see more deailed mutation information on the Tooltip. Those are primary_site, primary_histology, mutation(aa), pubmedID. |
| Genomic Position | Mutation(aa) | Unique sampleID count |
| chr7:75932058 | p.L10H | 1 |
| chr7:75932122 | p.Q31Q | 1 |
| chr7:75932270 | p.L81I | 1 |
| chr7:75933373 | p.A167A | 1 |
| chr7:75933382 | p.P170P | 1 |
| chr7:75933408 | p.I179N | 1 |
| chr7:75933416 | p.P182S | 1 |
| chr7:75933446 | p.G192W | 1 |
| chr7:75933484 | p.A204A | 1 |
| * Copy number data were extracted from TCGA using R package TCGA-Assembler. The URLs of all public data files on TCGA DCC data server were gathered on Jan-05-2015. Function ProcessCNAData in TCGA-Assembler package was used to obtain gene-level copy number value which is calculated as the average copy number of the genomic region of a gene. |
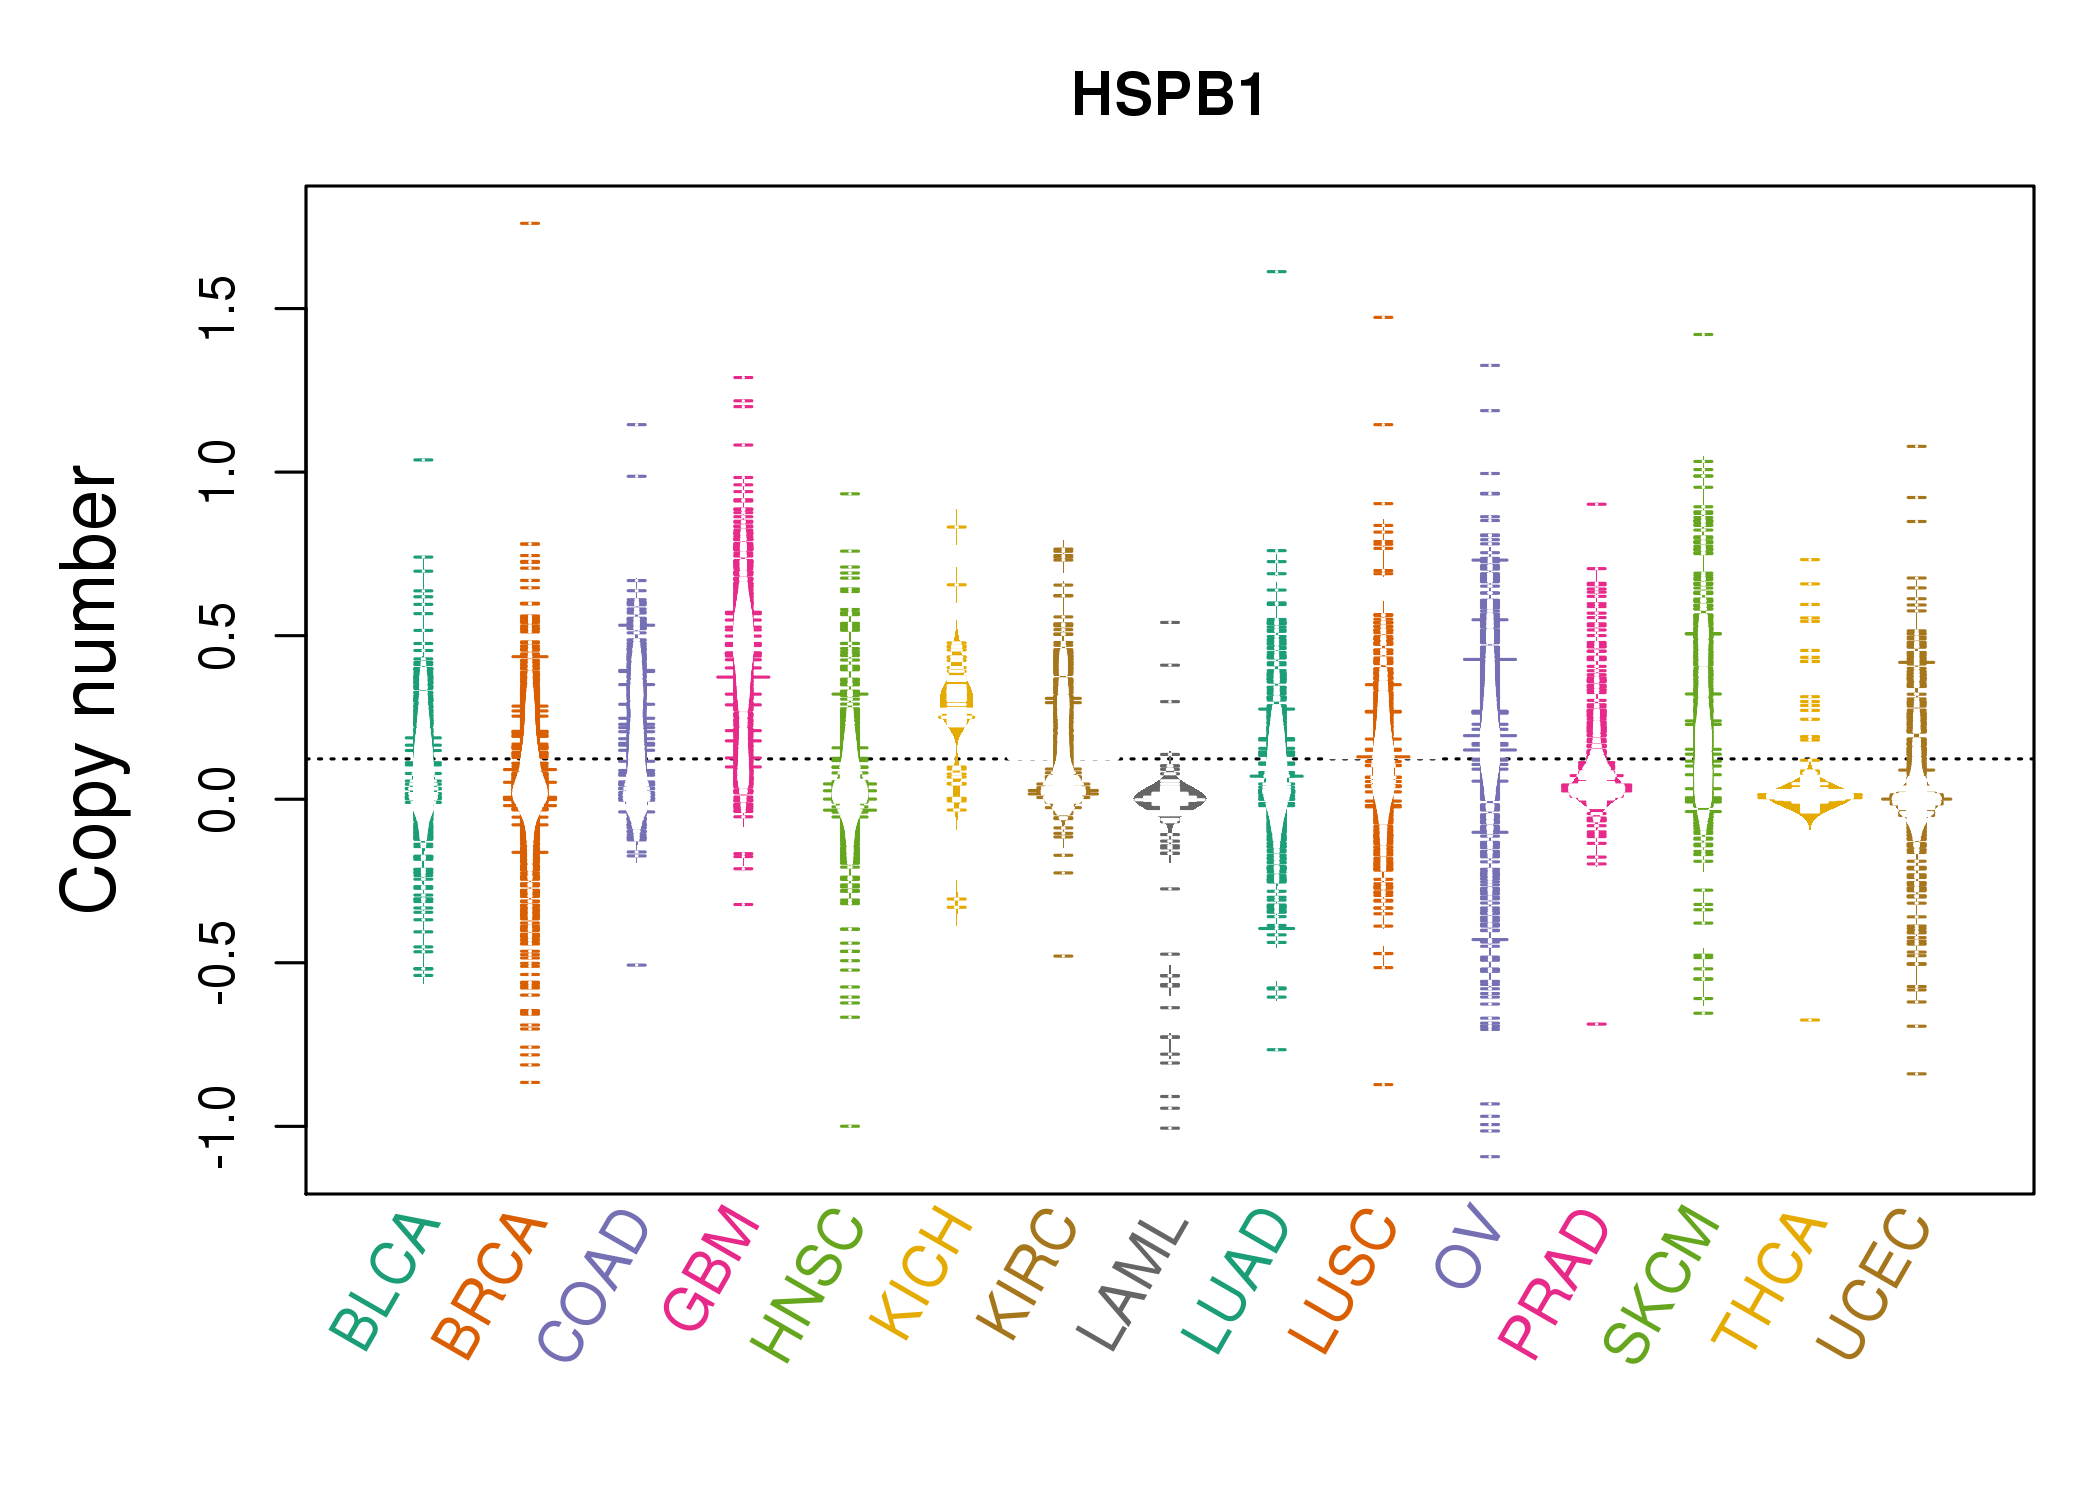 |
| cf) Tissue ID[Tissue type]: BLCA[Bladder Urothelial Carcinoma], BRCA[Breast invasive carcinoma], CESC[Cervical squamous cell carcinoma and endocervical adenocarcinoma], COAD[Colon adenocarcinoma], GBM[Glioblastoma multiforme], Glioma Low Grade, HNSC[Head and Neck squamous cell carcinoma], KICH[Kidney Chromophobe], KIRC[Kidney renal clear cell carcinoma], KIRP[Kidney renal papillary cell carcinoma], LAML[Acute Myeloid Leukemia], LUAD[Lung adenocarcinoma], LUSC[Lung squamous cell carcinoma], OV[Ovarian serous cystadenocarcinoma ], PAAD[Pancreatic adenocarcinoma], PRAD[Prostate adenocarcinoma], SKCM[Skin Cutaneous Melanoma], STAD[Stomach adenocarcinoma], THCA[Thyroid carcinoma], UCEC[Uterine Corpus Endometrial Carcinoma] |
| Top |
| Gene Expression for HSPB1 |
| * CCLE gene expression data were extracted from CCLE_Expression_Entrez_2012-10-18.res: Gene-centric RMA-normalized mRNA expression data. |
 |
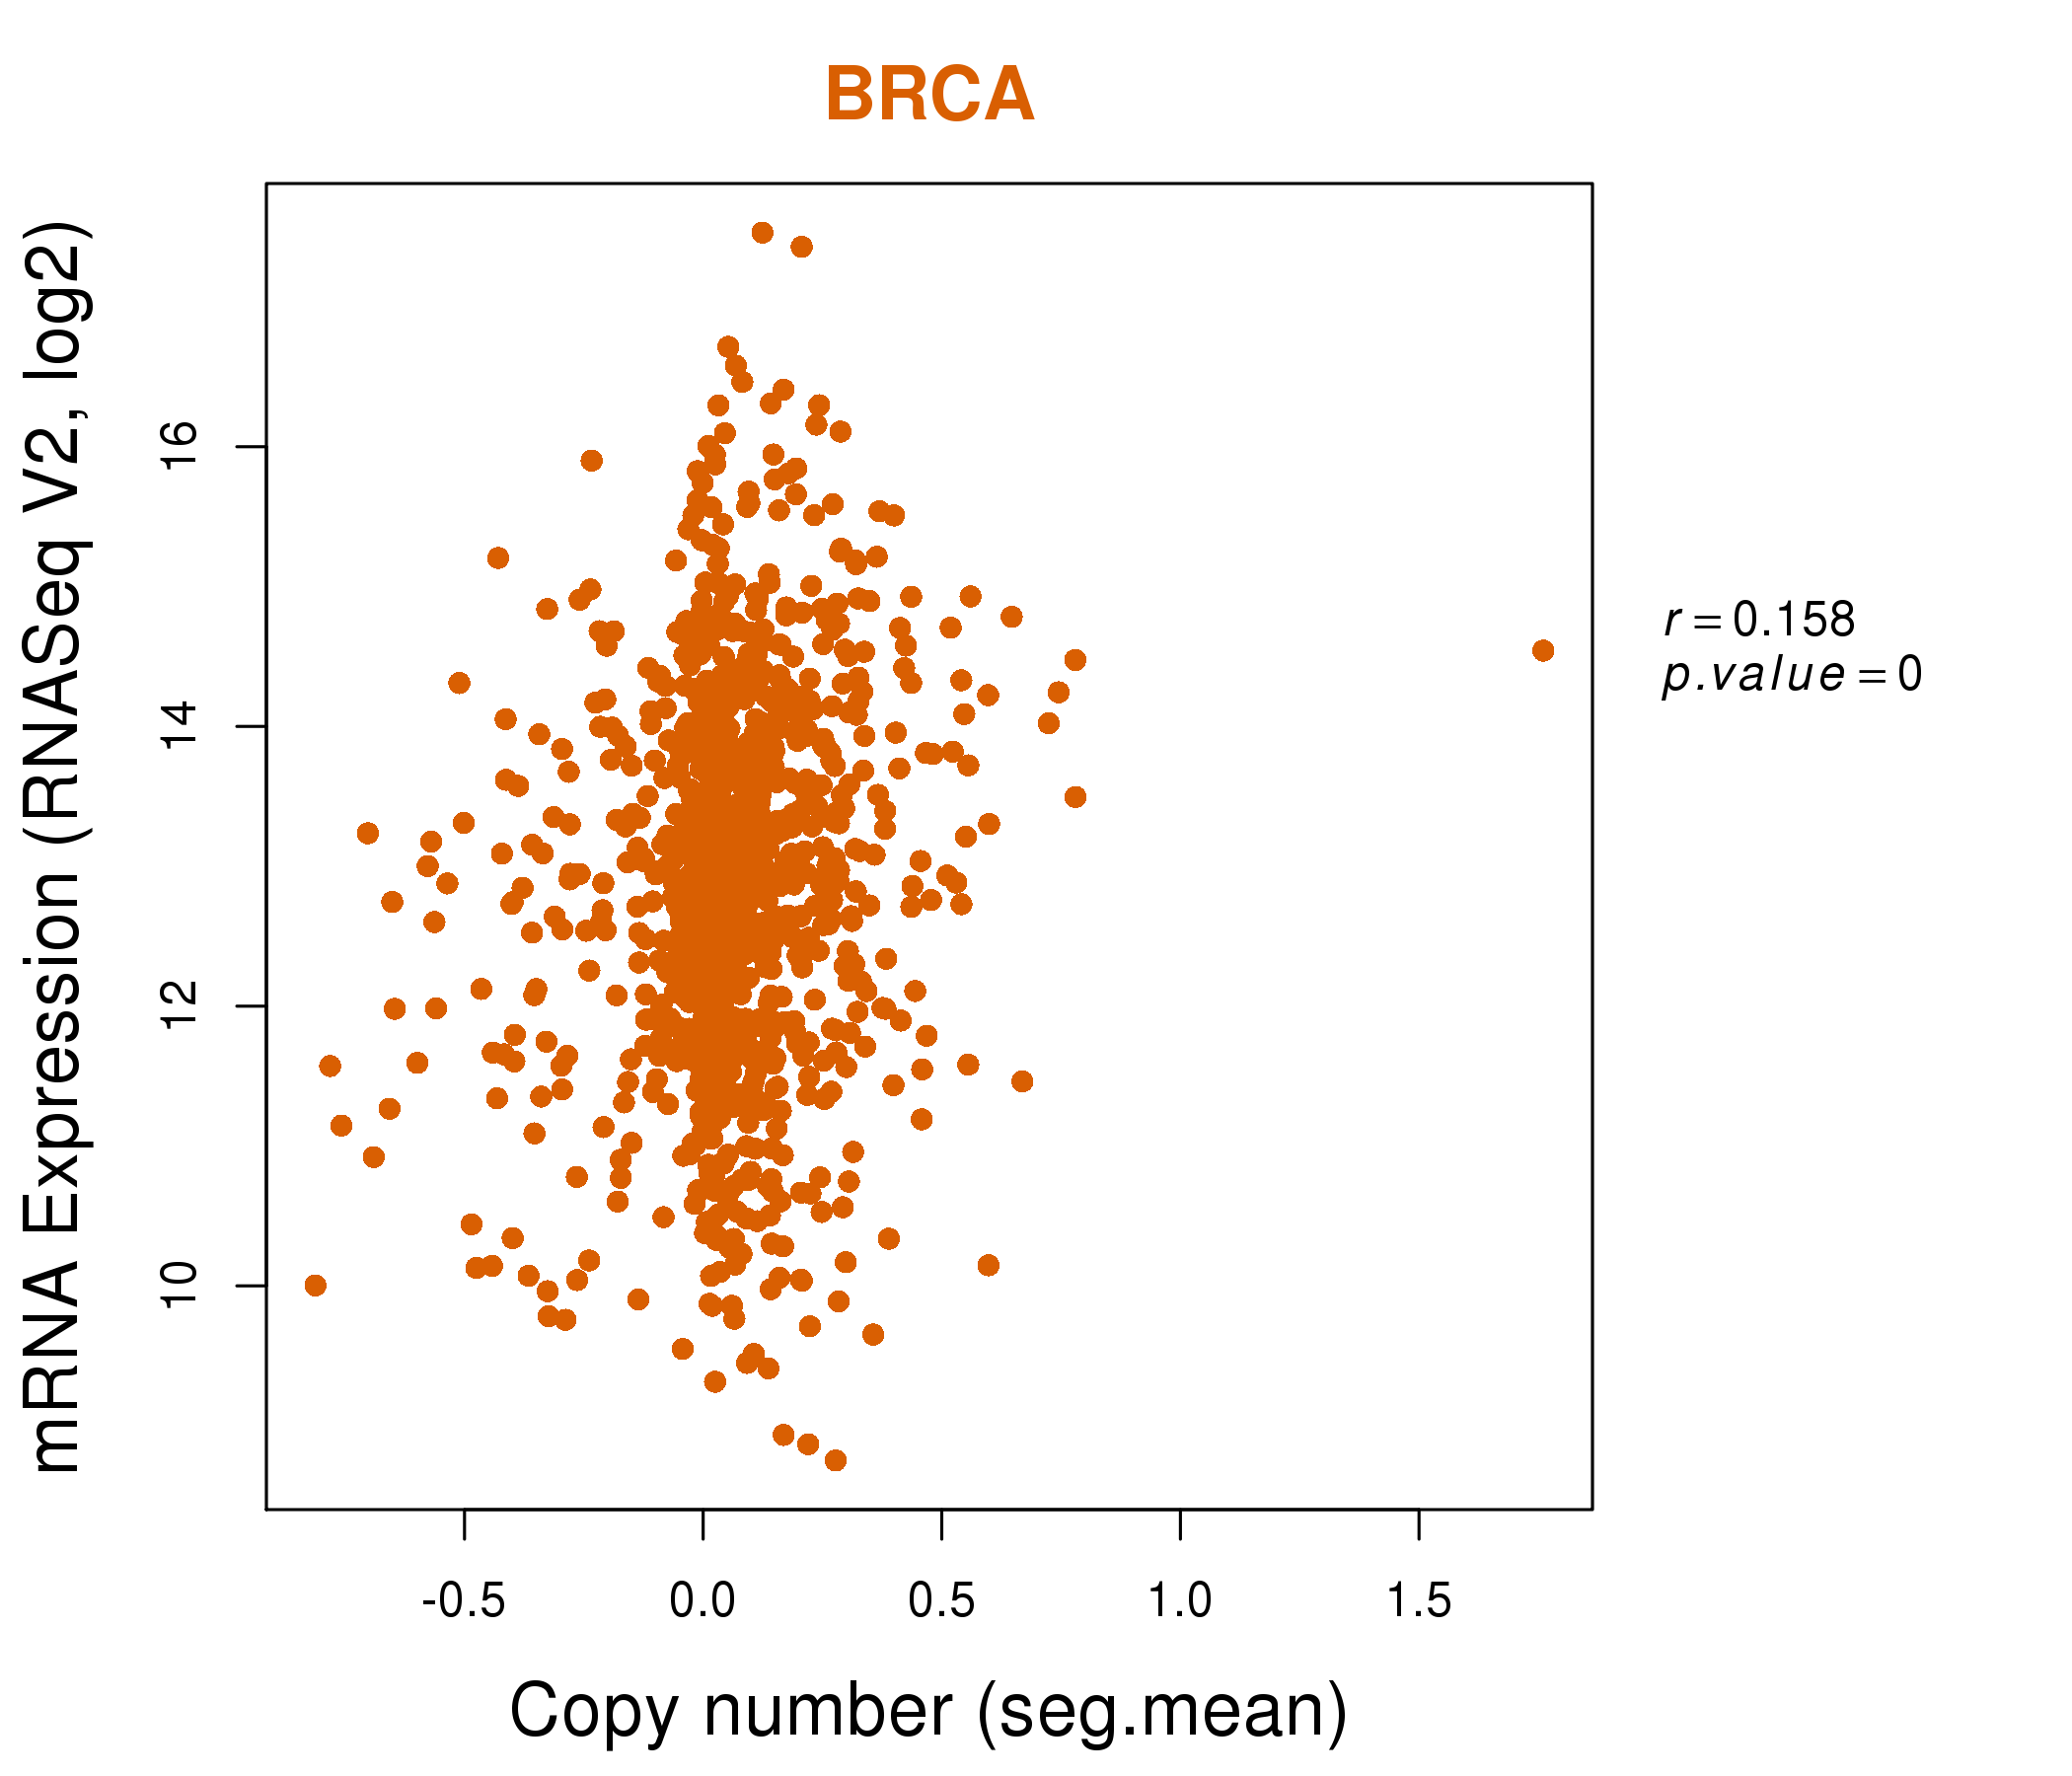
| * Normalized gene expression data of RNASeqV2 was extracted from TCGA using R package TCGA-Assembler. The URLs of all public data files on TCGA DCC data server were gathered at Jan-05-2015. Only eight cancer types have enough normal control samples for differential expression analysis. (t test, adjusted p<0.05 (using Benjamini-Hochberg FDR)) |
 |
| Top |
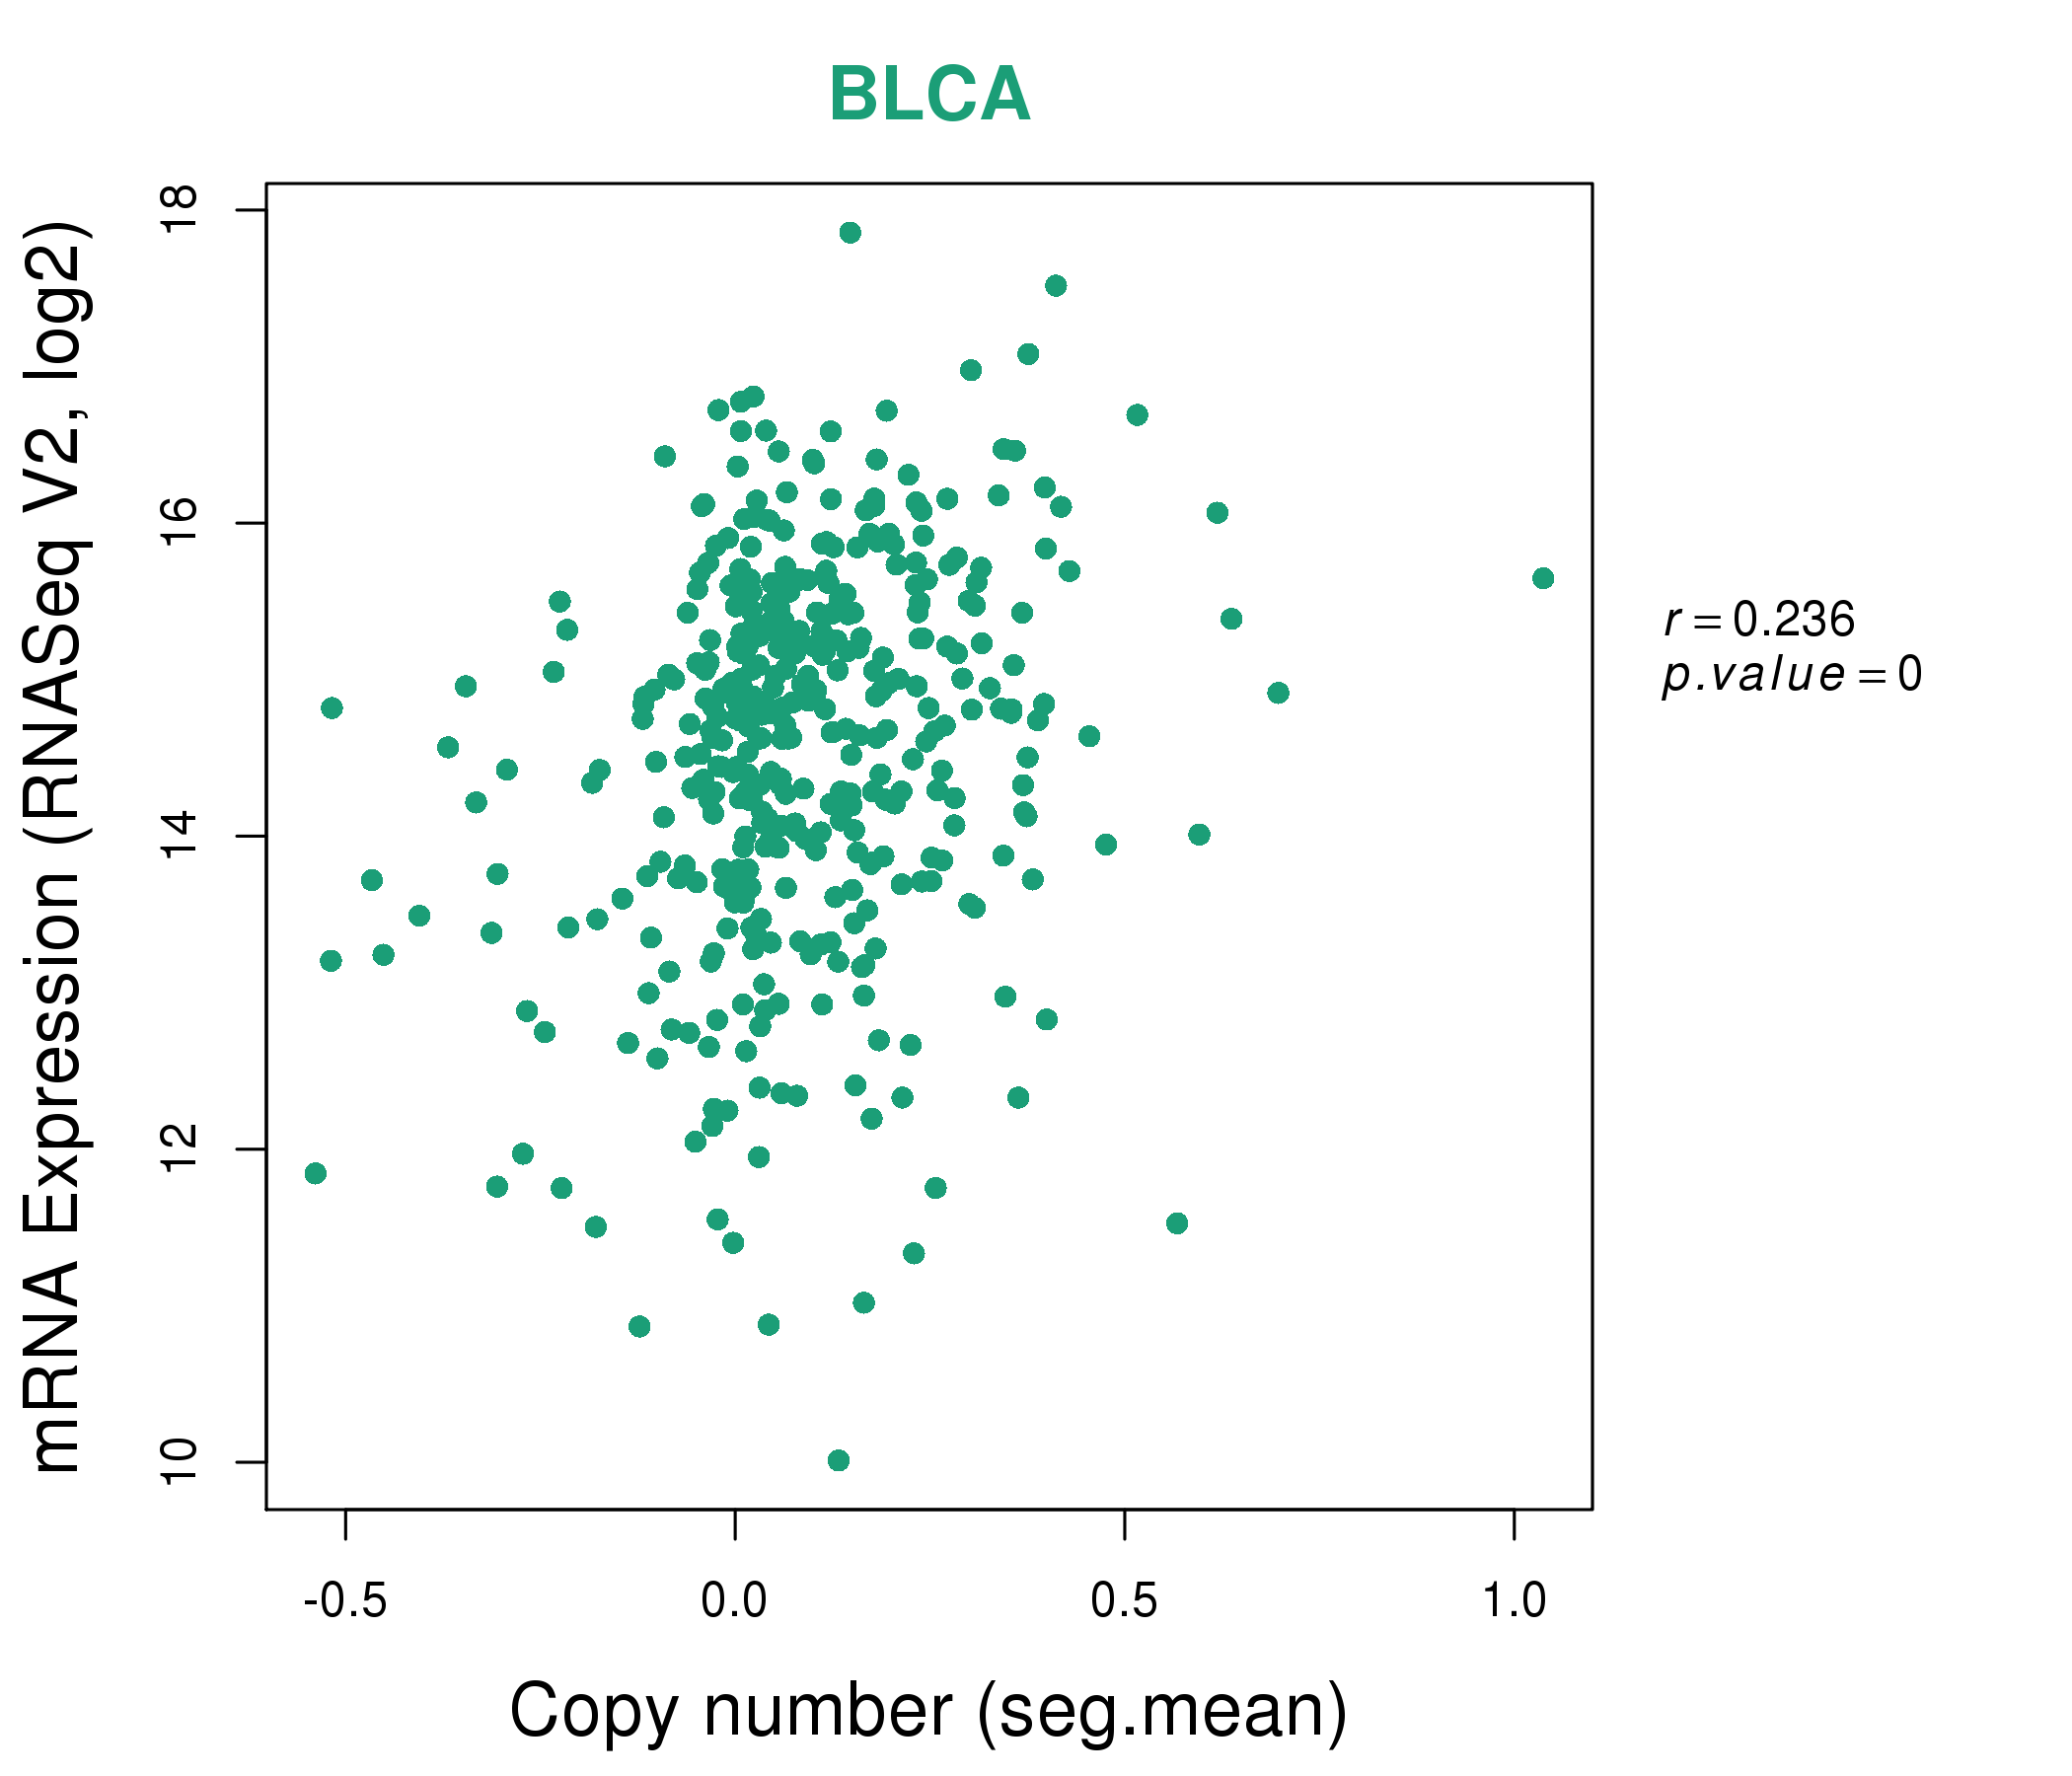
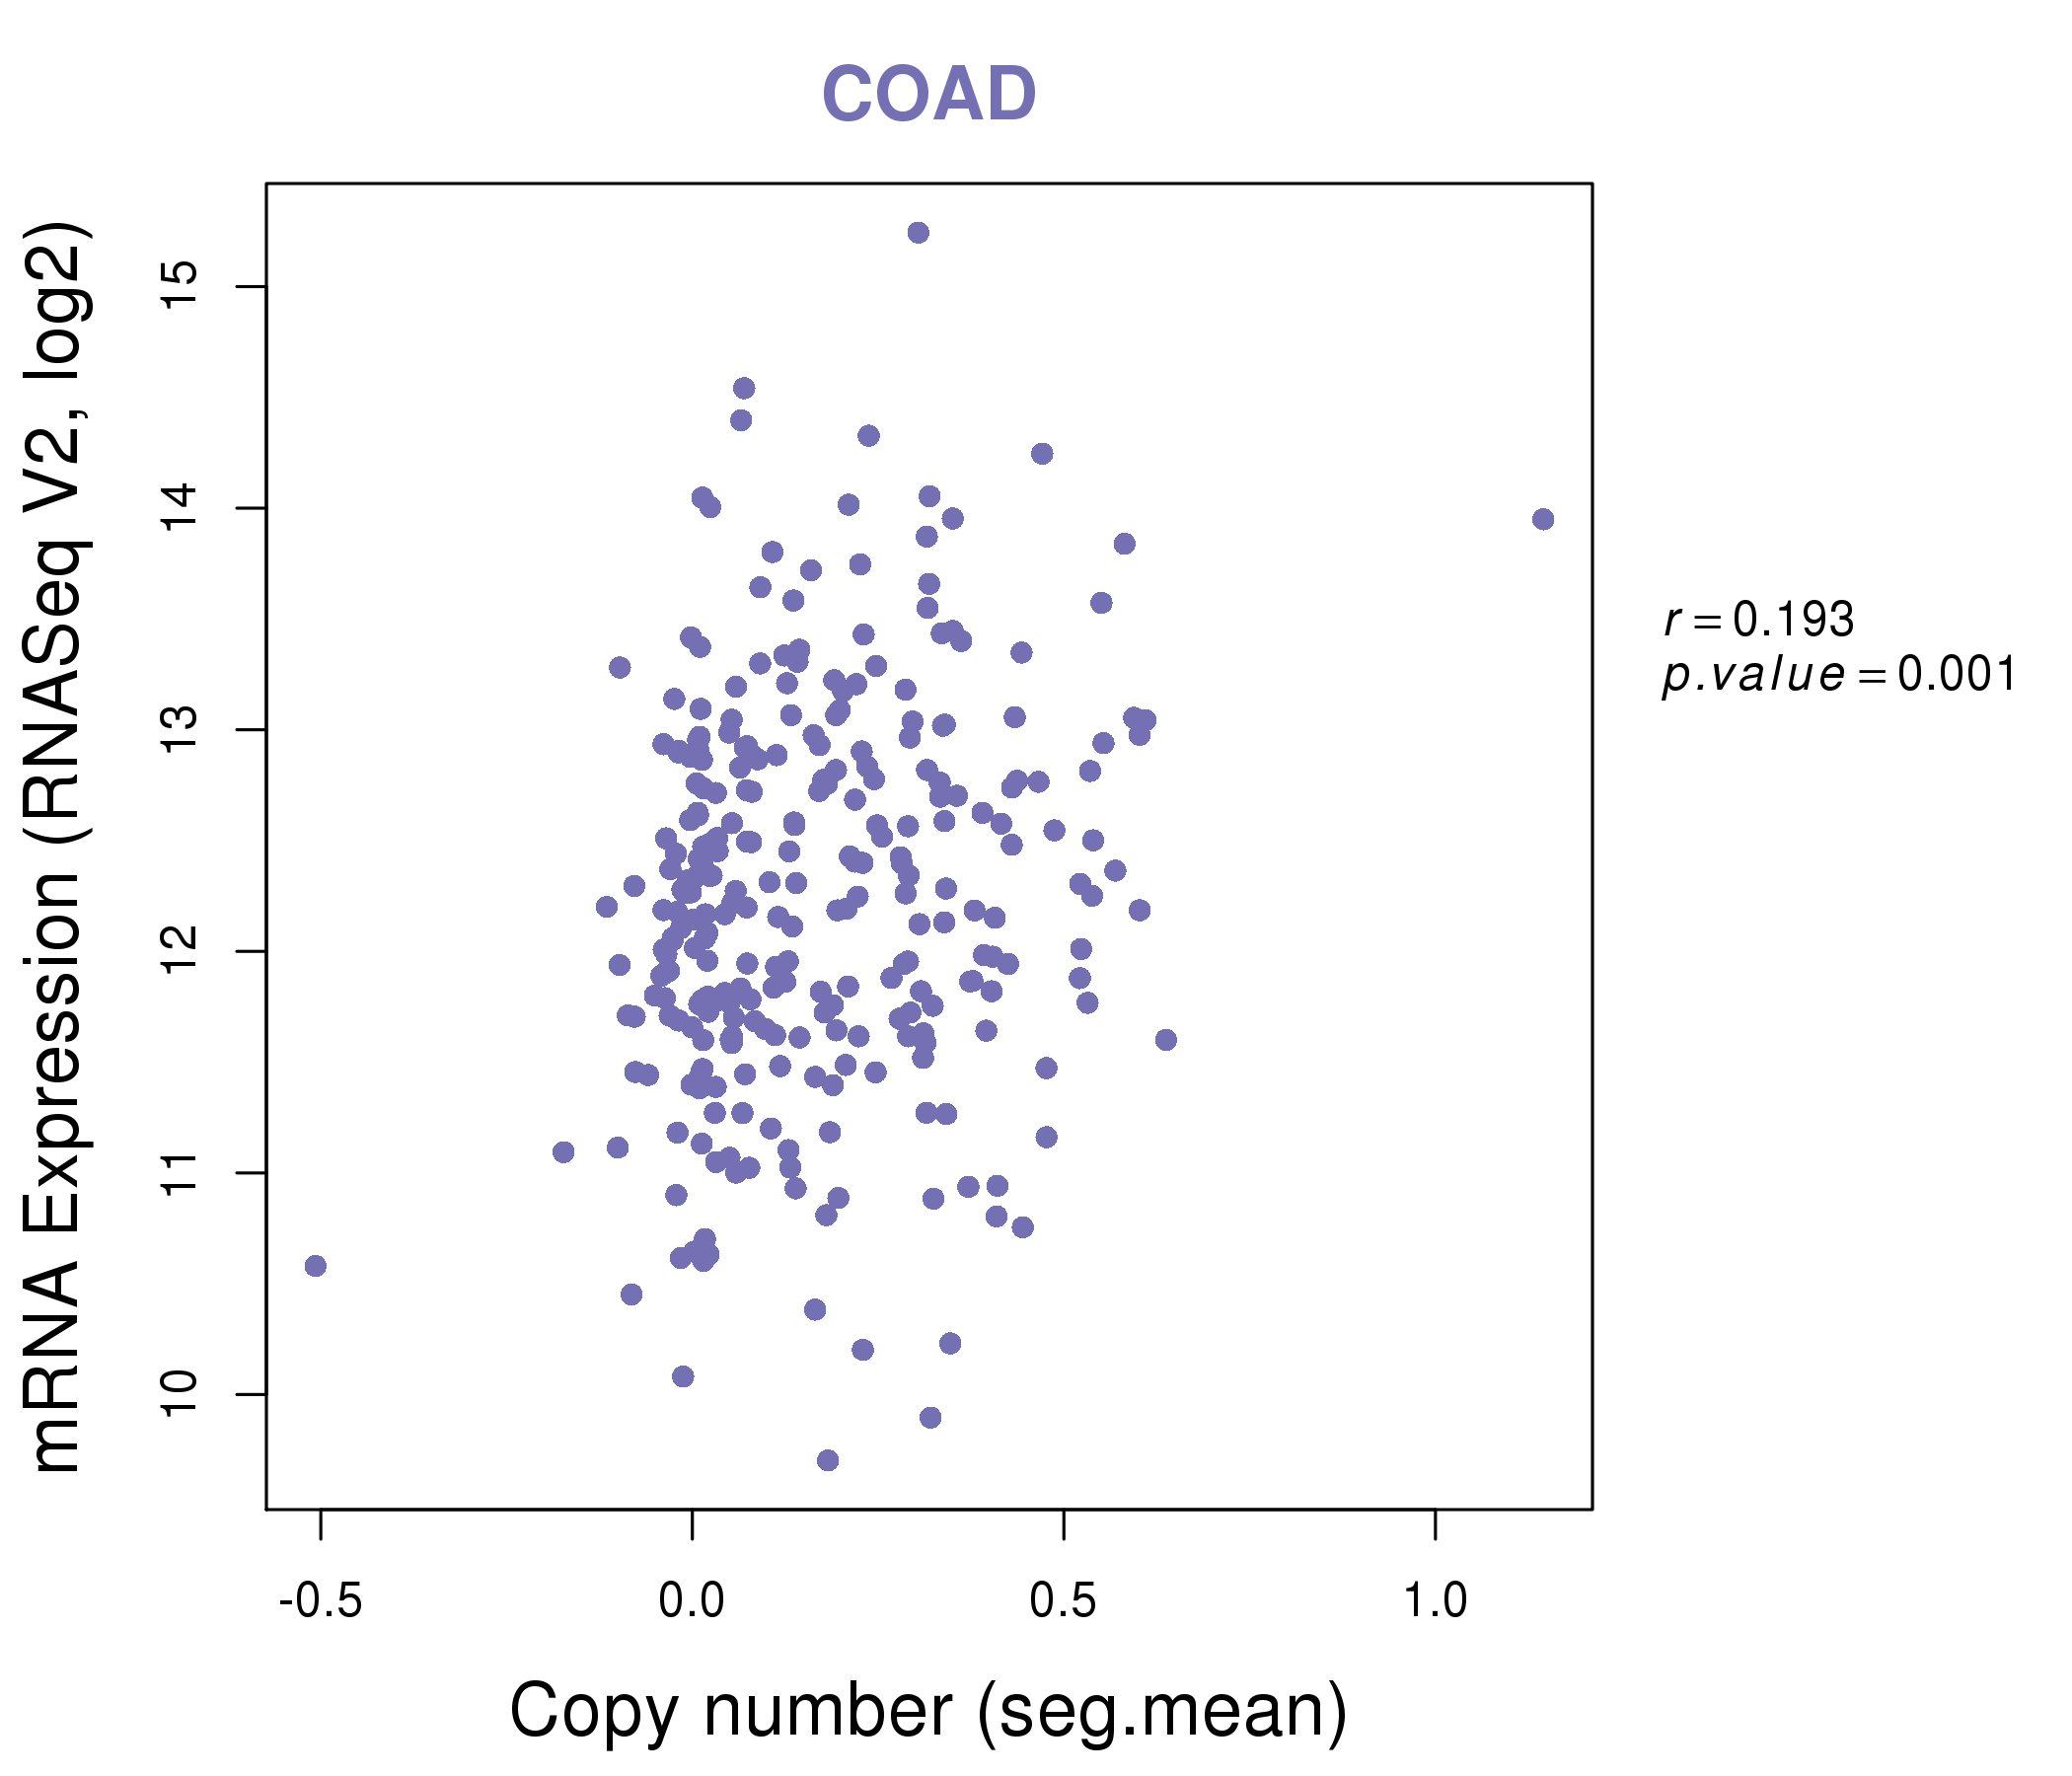
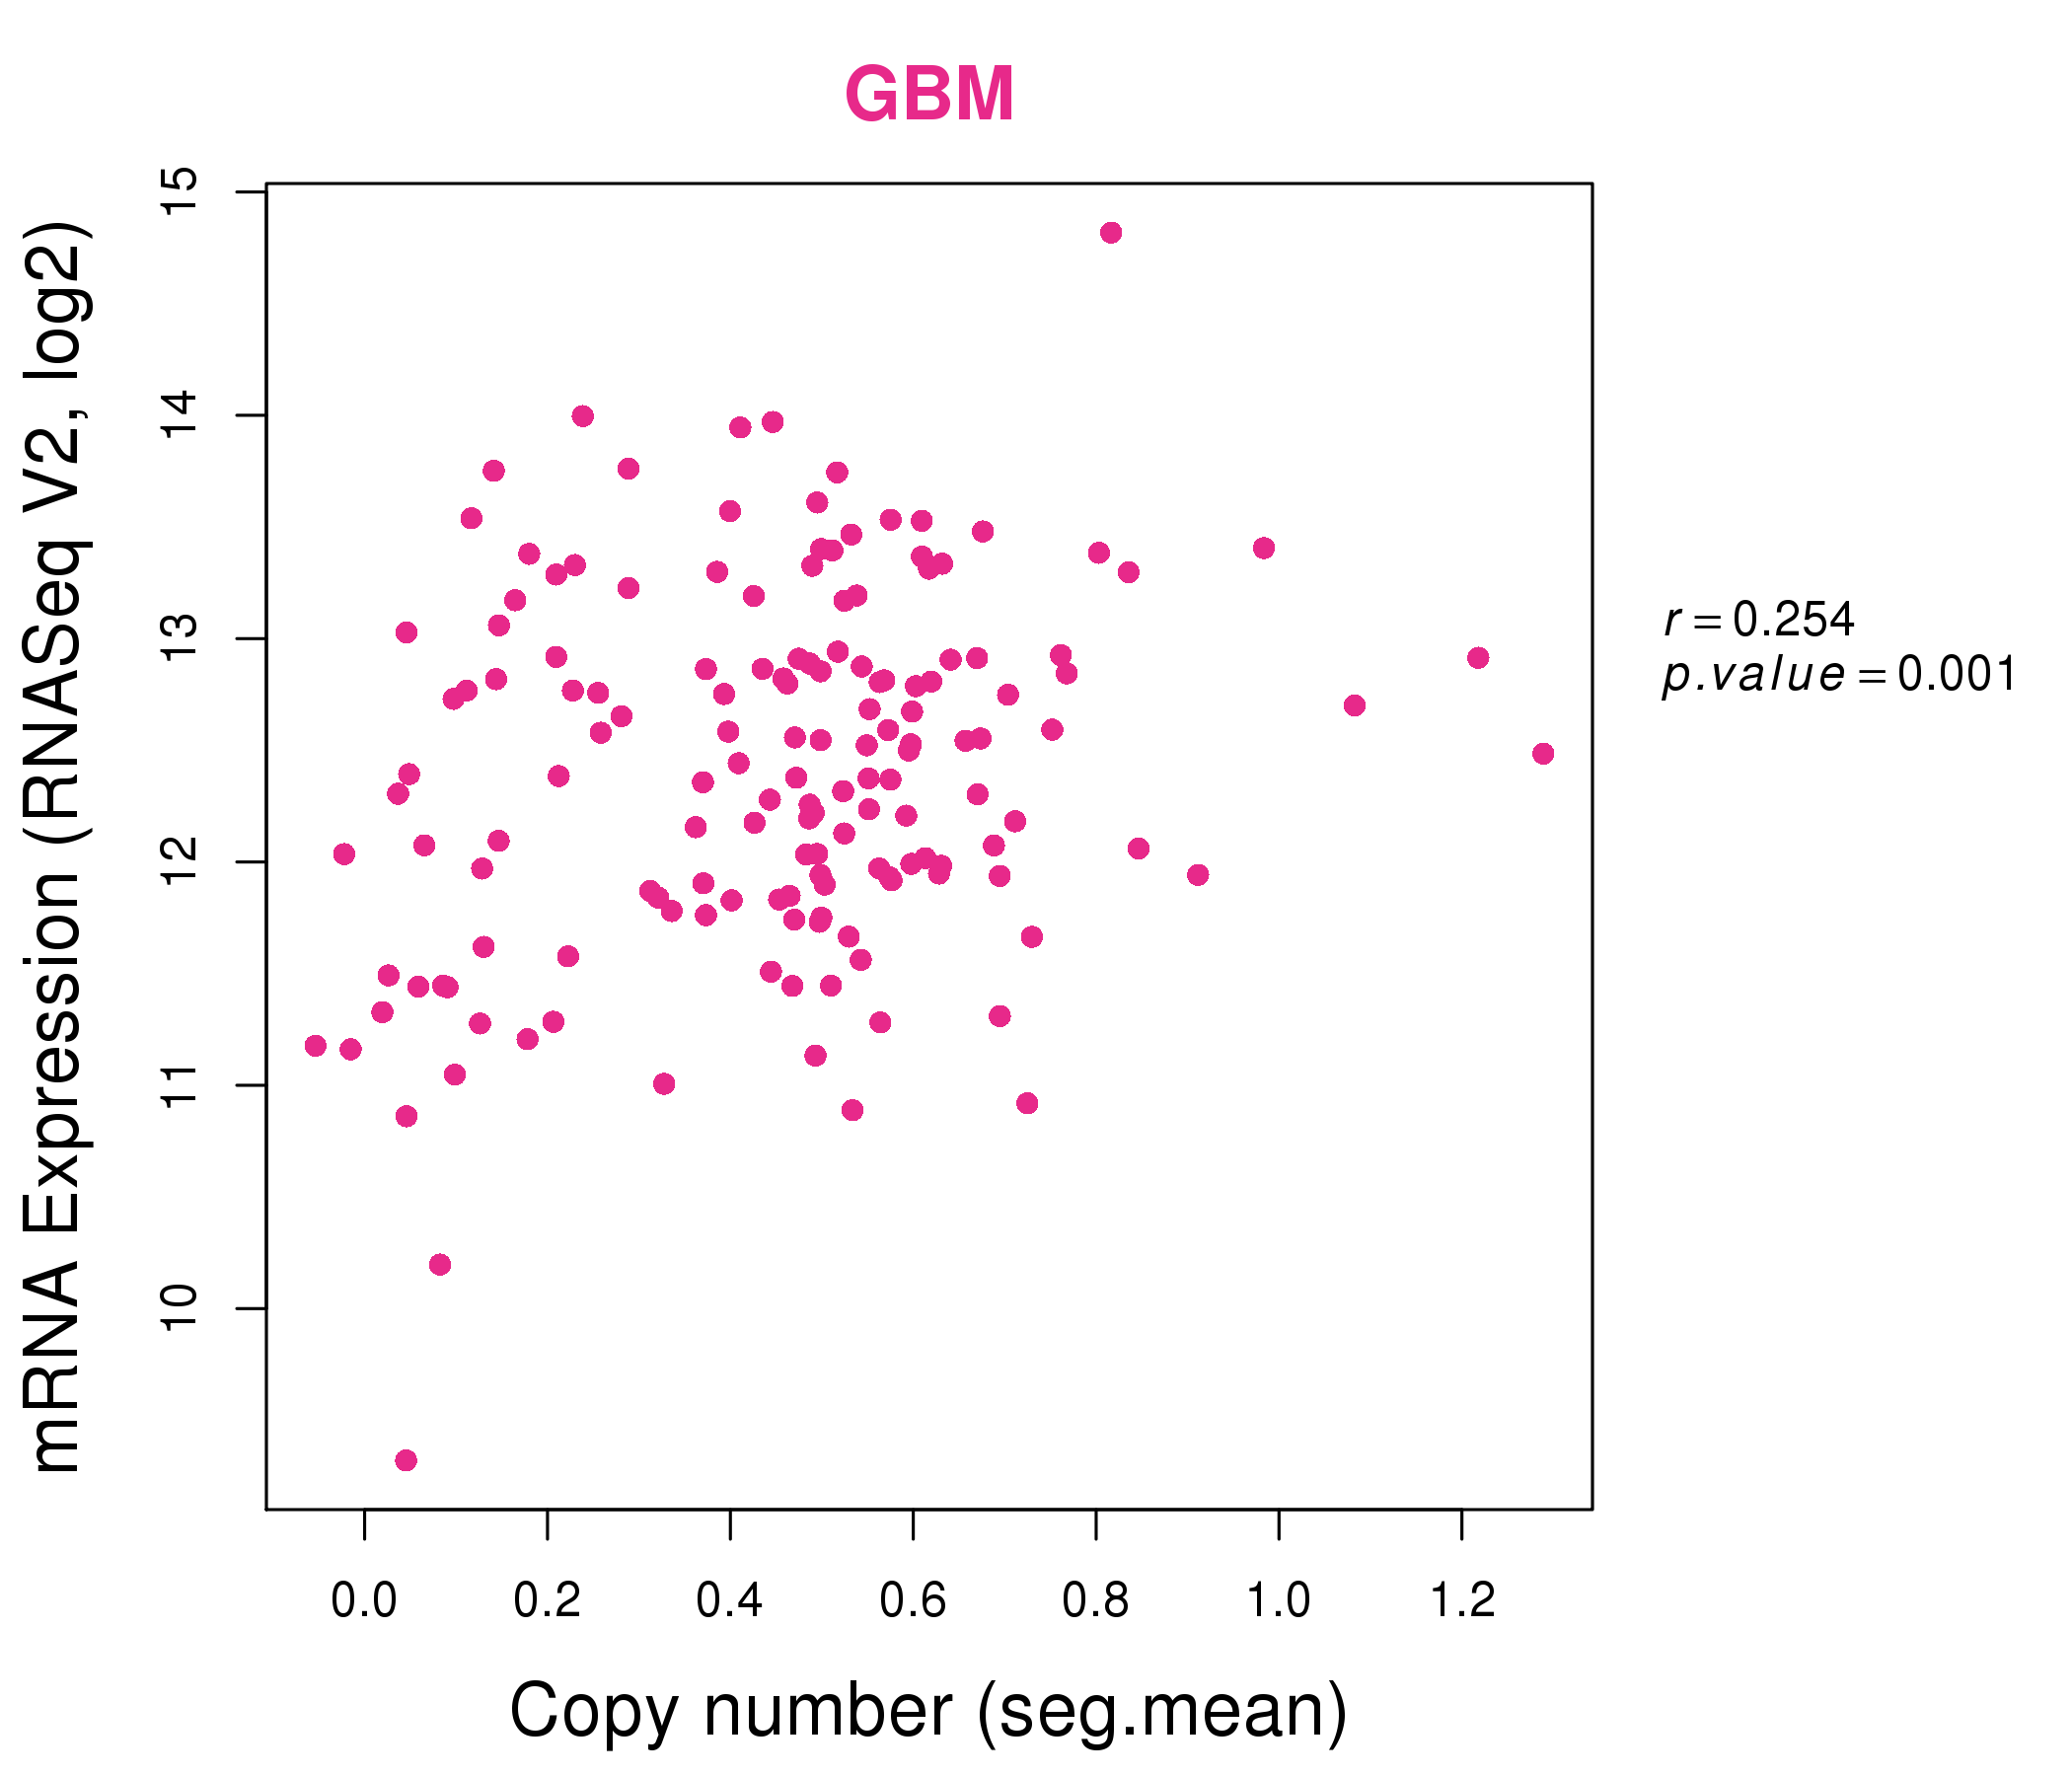
| * This plots show the correlation between CNV and gene expression. |
: Open all plots for all cancer types
 |
|
 |
|
| Top |
| Gene-Gene Network Information |
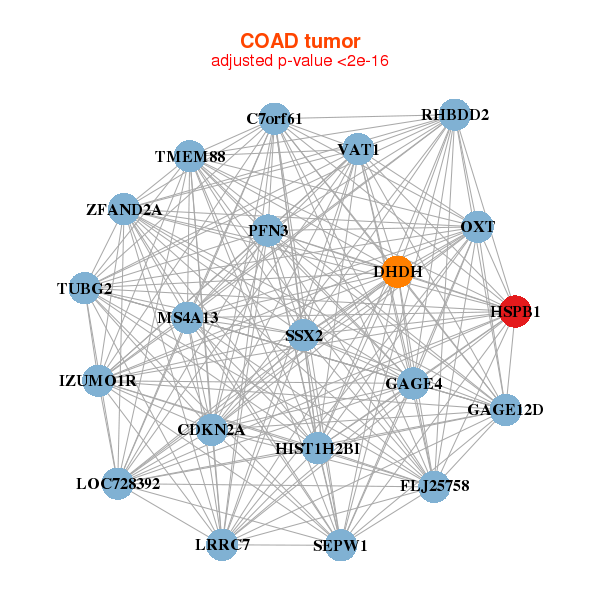
| * Co-Expression network figures were drawn using R package igraph. Only the top 20 genes with the highest correlations were shown. Red circle: input gene, orange circle: cell metabolism gene, sky circle: other gene |
: Open all plots for all cancer types
 |
| ||||
| BLOC1S1,BOLA2,C12orf10,IFT43,C16orf13,TSR3,ECI1, MZT2B,FAM173A,FAM195A,HSPB1,JOSD2,MRPL28,MRPS34, NDUFA2,NDUFB10,NOSIP,NUBP2,TCEB2,PAM16,ZNHIT1 | ARAF,COX17,COX8A,DEXI,ENDOG,HCFC1R1,HSPB1, LSM10,LINC00116,NDUFB10,NDUFB2,NDUFS7,NDUFS8,PGP, PHPT1,SEPW1,SLC16A3,SLC25A11,EMC6,UBAC1,UQCR10 | ||||
 |
| ||||
| C7orf61,CDKN2A,DHDH,FLJ25758,IZUMO1R,GAGE12D,GAGE4, HIST1H2BI,HSPB1,LOC728392,LRRC7,MS4A13,OXT,PFN3, RHBDD2,SEPW1,SSX2,TMEM88,TUBG2,VAT1,ZFAND2A | ACTG2,CCDC136,CNN1,CTNNA3,CTXN1,DES,DMPK, DNAJB5,FAM46B,FLNA,FLNC,HSPB1,HSPB7,ILDR2, KY,LDB3,PDLIM7,PYGM,SLC2A4,SMTN,TAGLN |

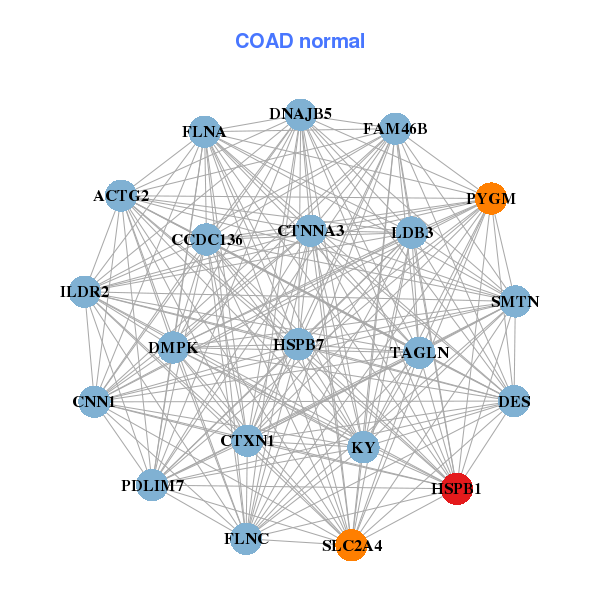
| * Co-Expression network figures were drawn using R package igraph. Only the top 20 genes with the highest correlations were shown. Red circle: input gene, orange circle: cell metabolism gene, sky circle: other gene |
: Open all plots for all cancer types
| Top |
: Open all interacting genes' information including KEGG pathway for all interacting genes from DAVID
| Top |
| Pharmacological Information for HSPB1 |
| DB Category | DB Name | DB's ID and Url link |
| Chemistry | BindingDB | P04792; -. |
| Chemistry | ChEMBL | CHEMBL5976; -. |
| Chemistry | BindingDB | P04792; -. |
| Chemistry | ChEMBL | CHEMBL5976; -. |
| Organism-specific databases | PharmGKB | PA29511; -. |
| Organism-specific databases | PharmGKB | PA29511; -. |
| Organism-specific databases | CTD | 3315; -. |
| Organism-specific databases | CTD | 3315; -. |
| * Gene Centered Interaction Network. |
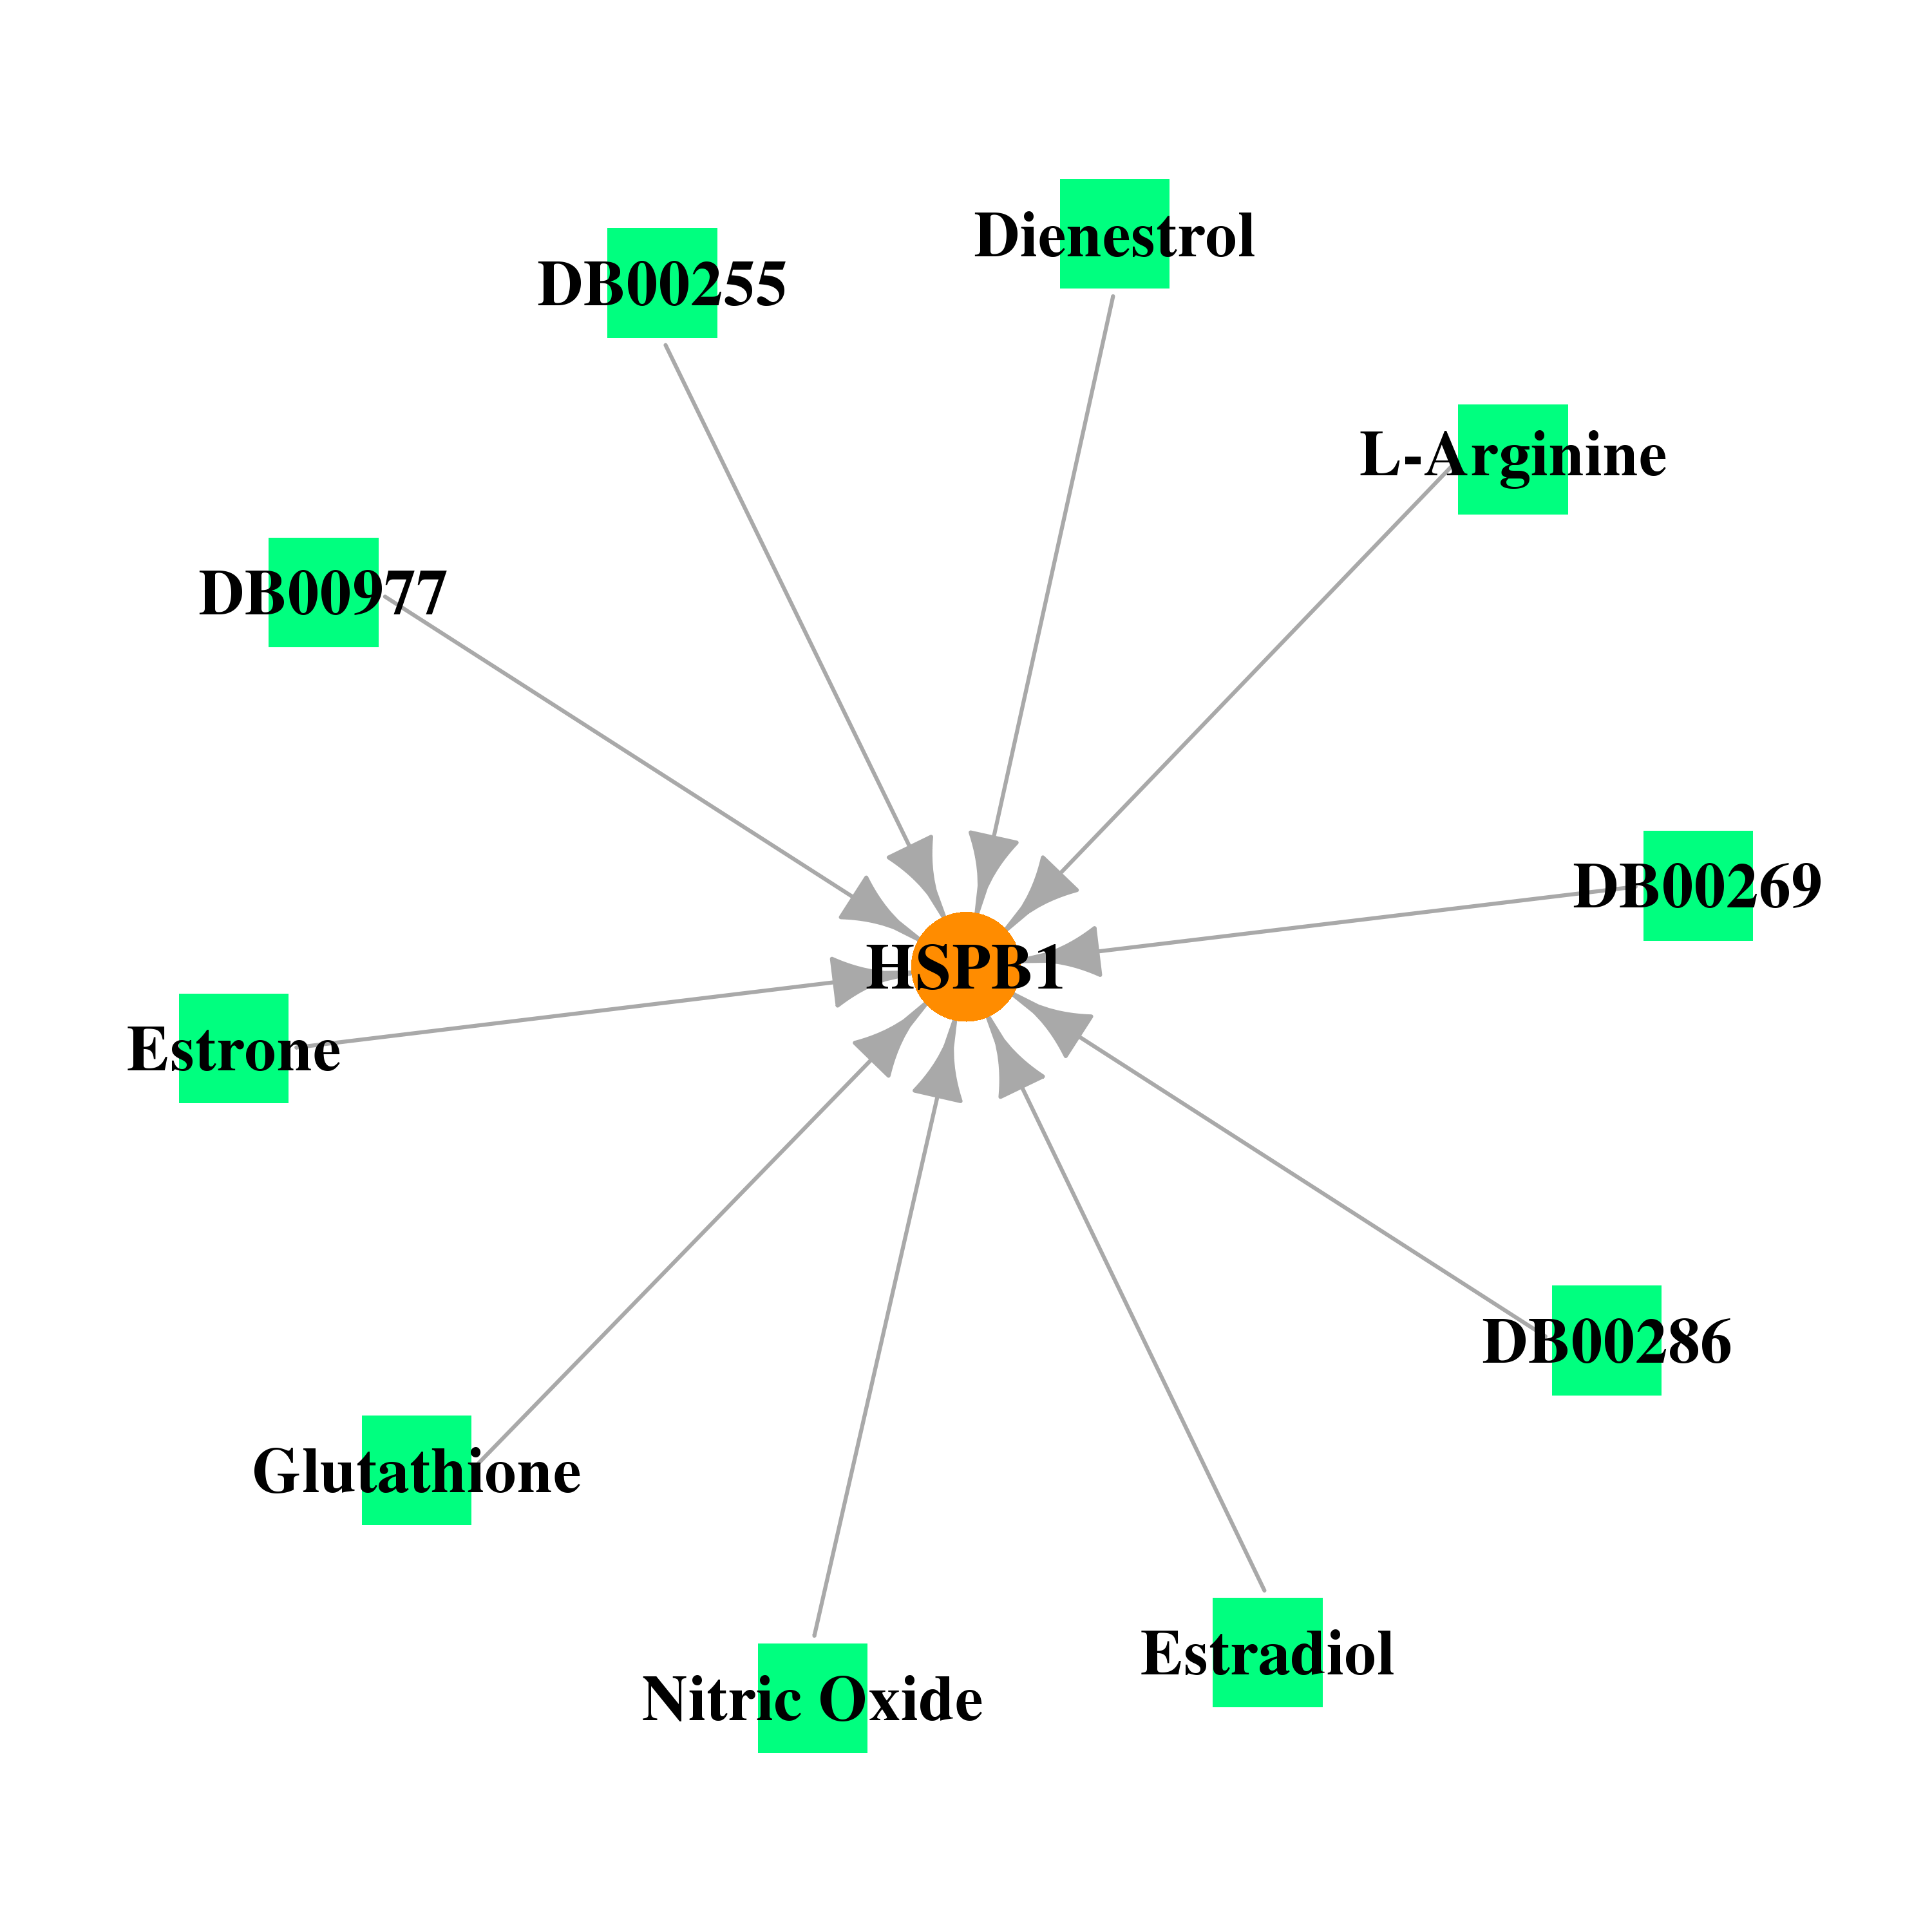 |
| * Drug Centered Interaction Network. |
| DrugBank ID | Target Name | Drug Groups | Generic Name | Drug Centered Network | Drug Structure |
| DB00125 | heat shock 27kDa protein 1 | approved; nutraceutical | L-Arginine |  |  |
| DB00435 | heat shock 27kDa protein 1 | approved | Nitric Oxide | 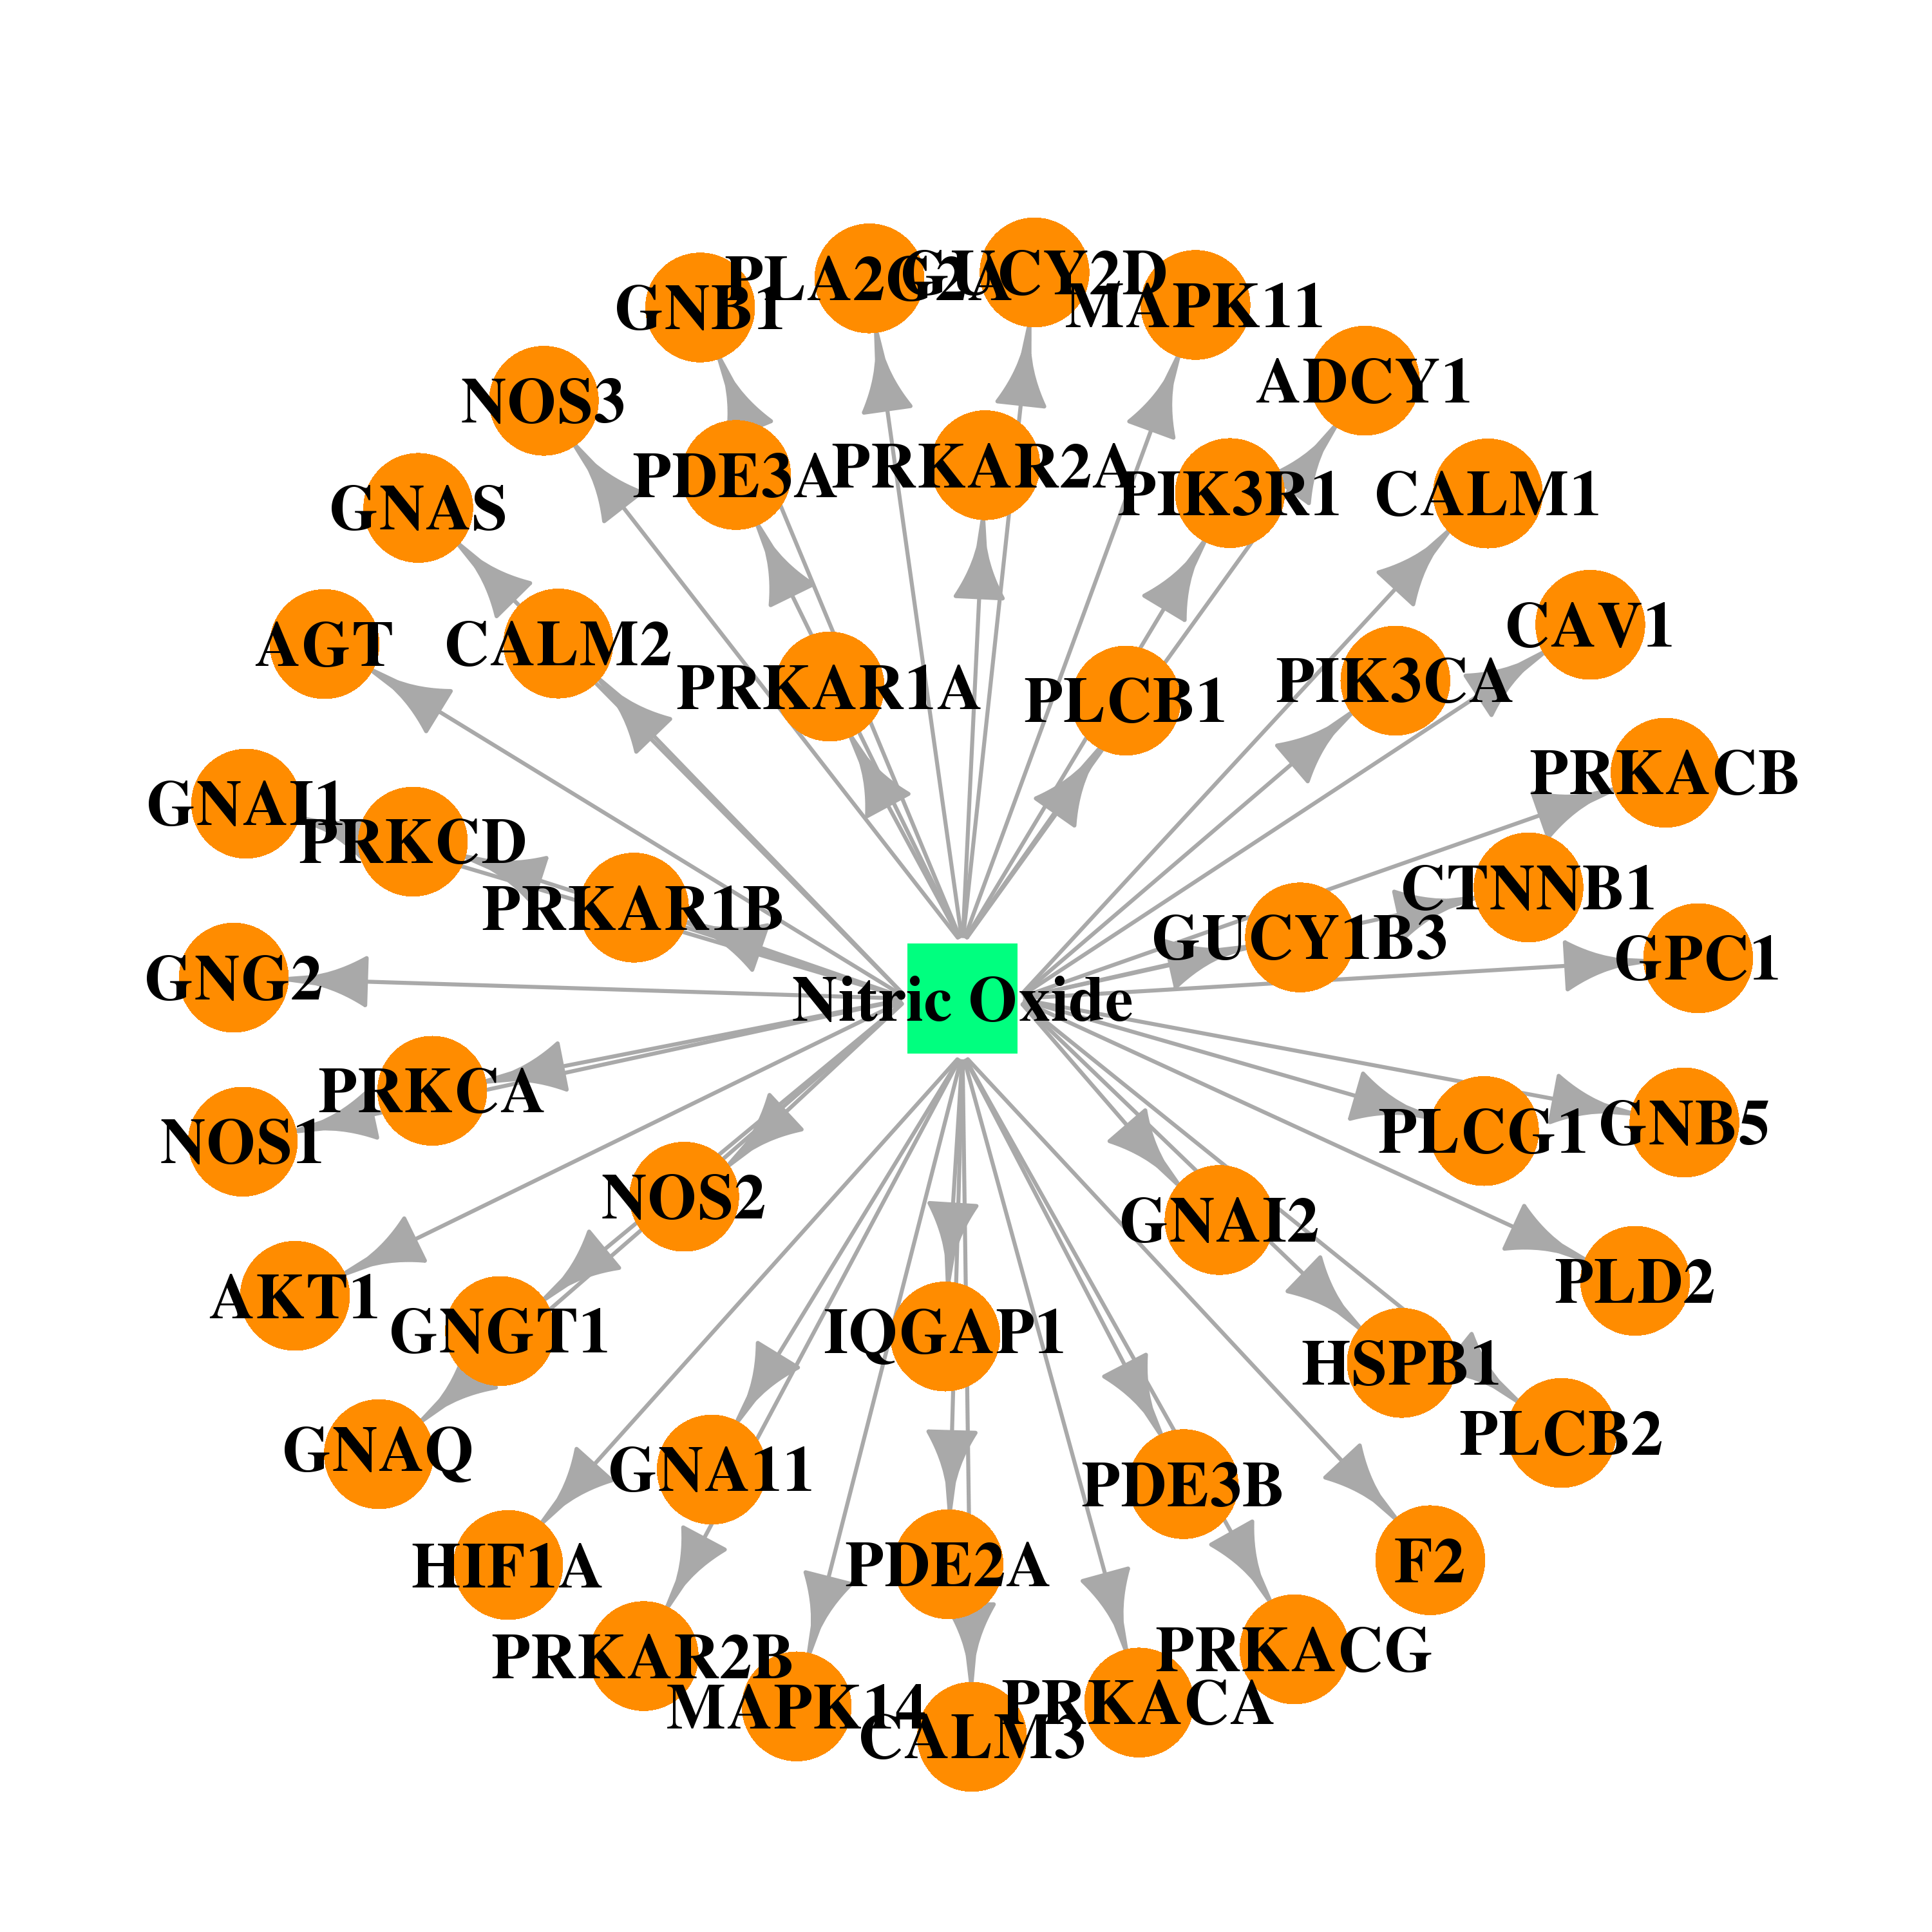 |  |
| DB00269 | heat shock 27kDa protein 1 | approved | Chlorotrianisene | 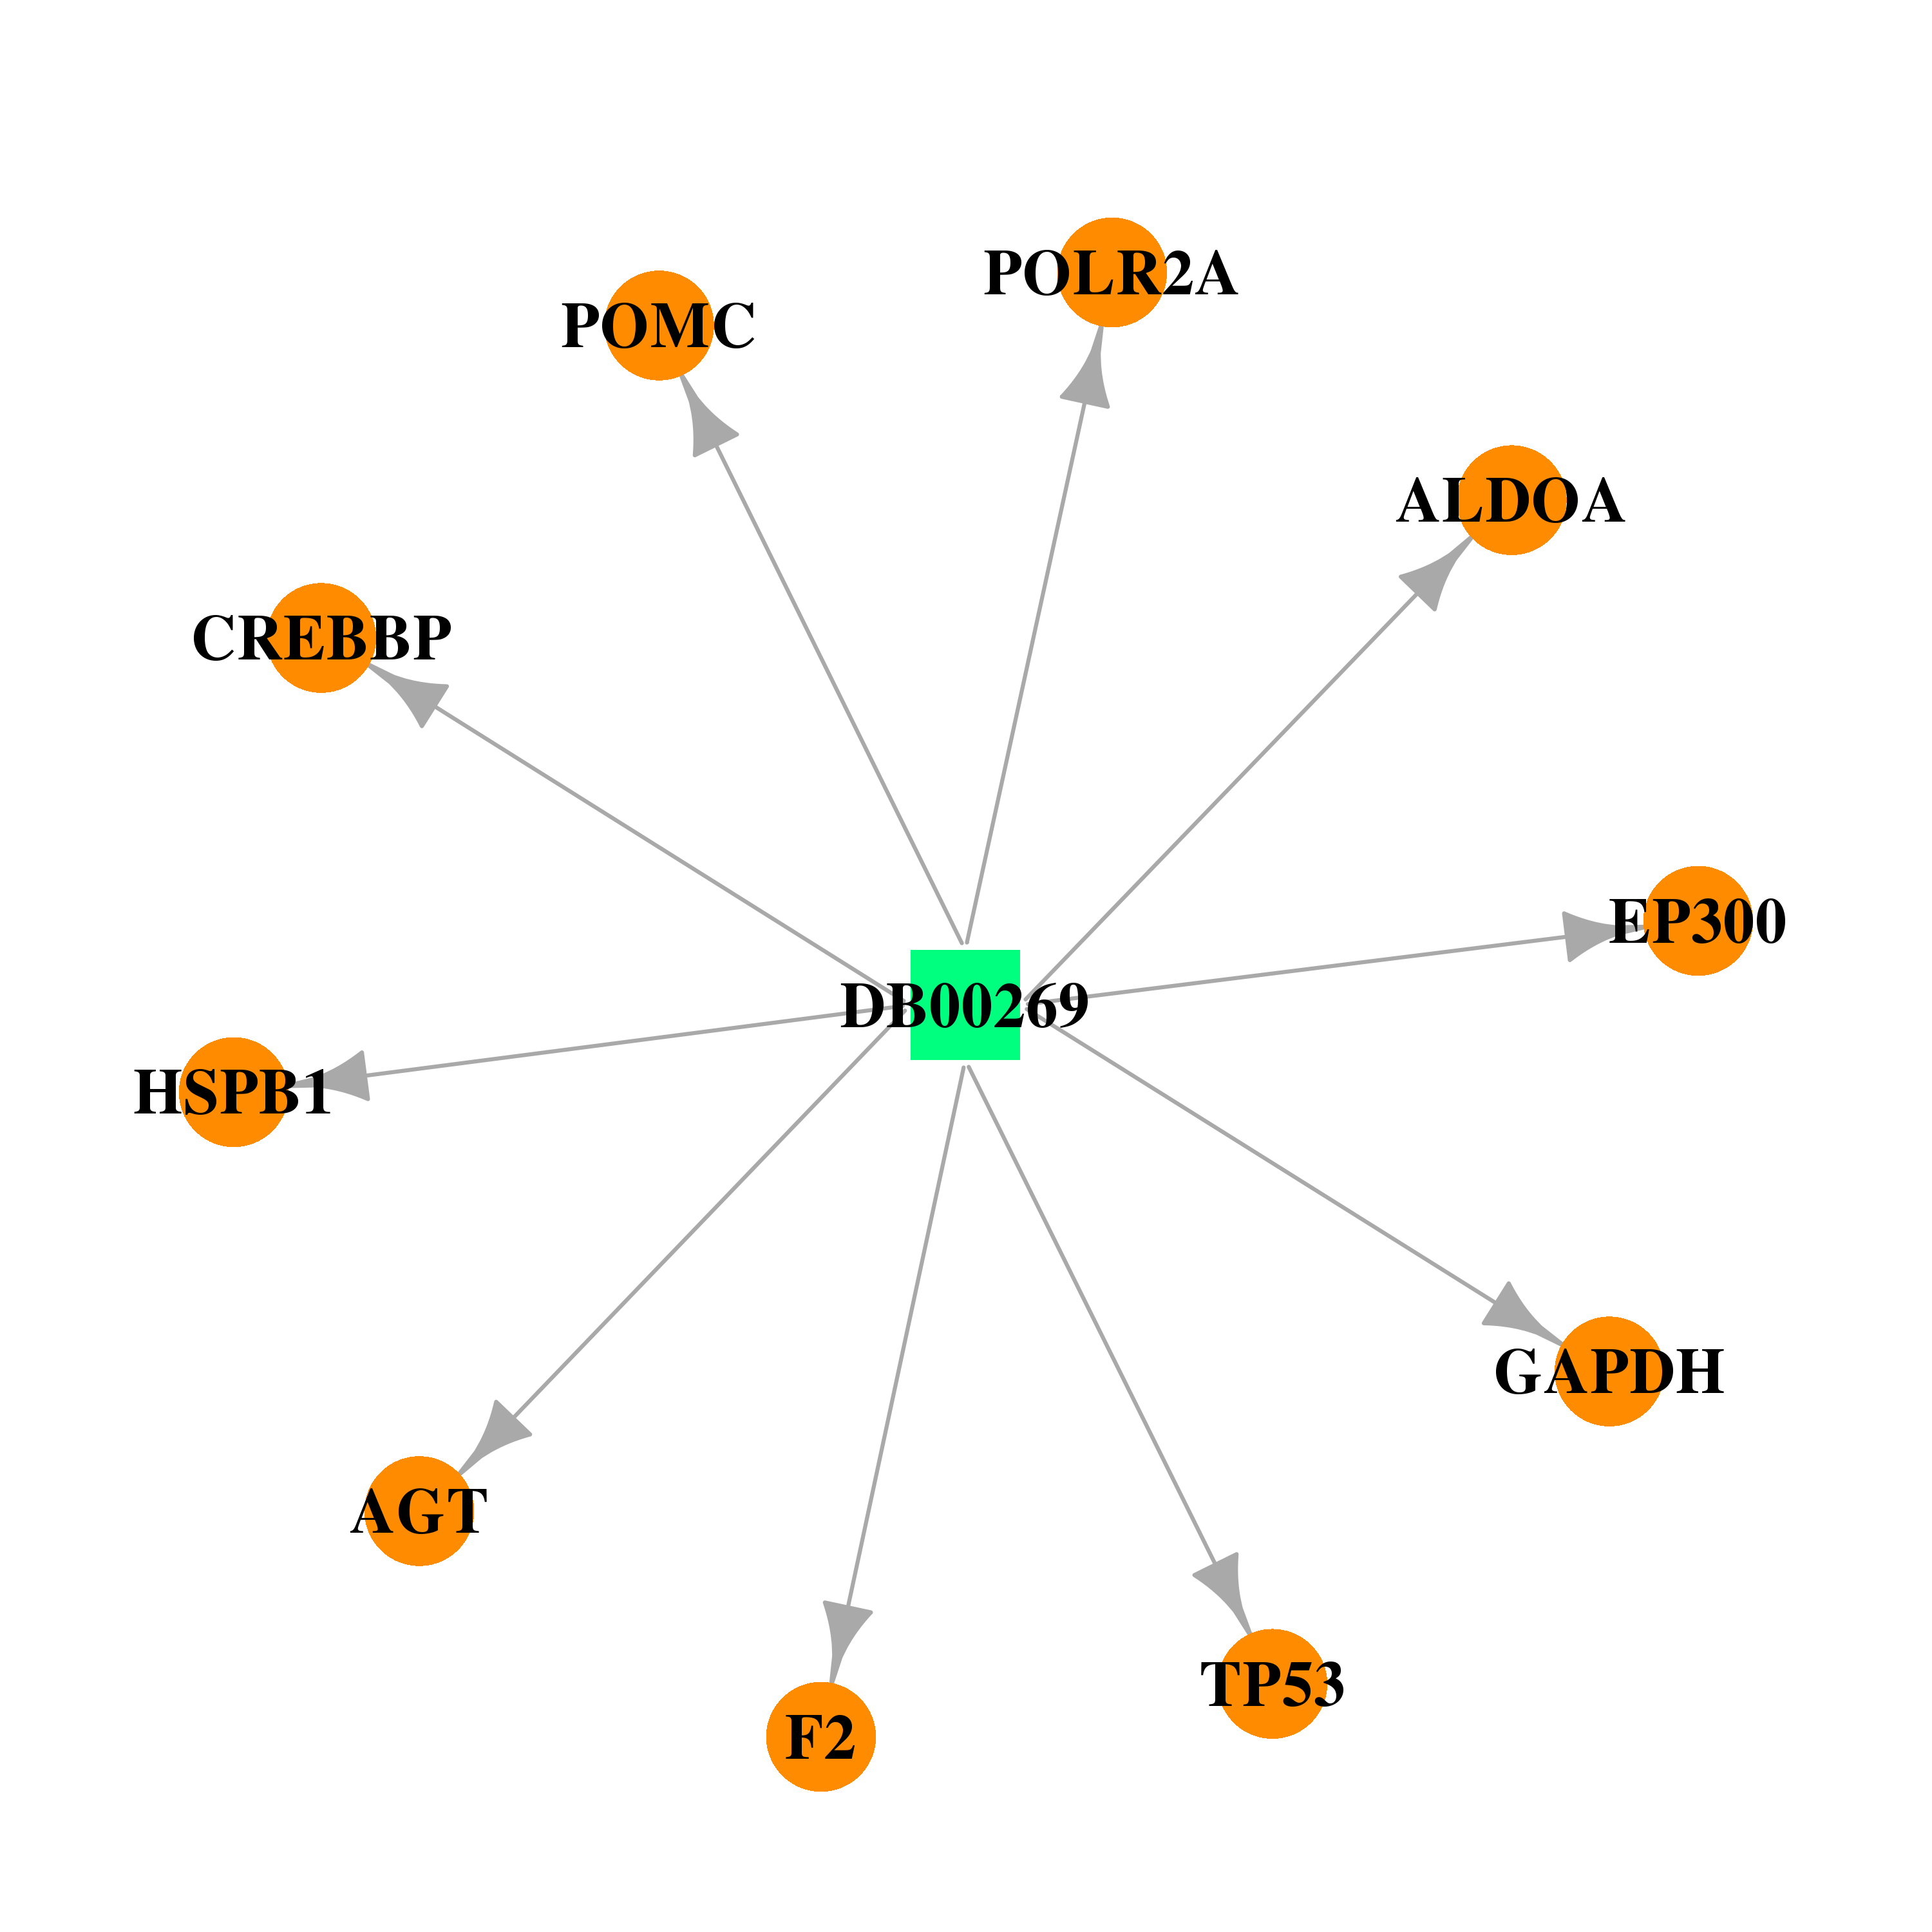 |  |
| DB00286 | heat shock 27kDa protein 1 | approved | Conjugated Estrogens | 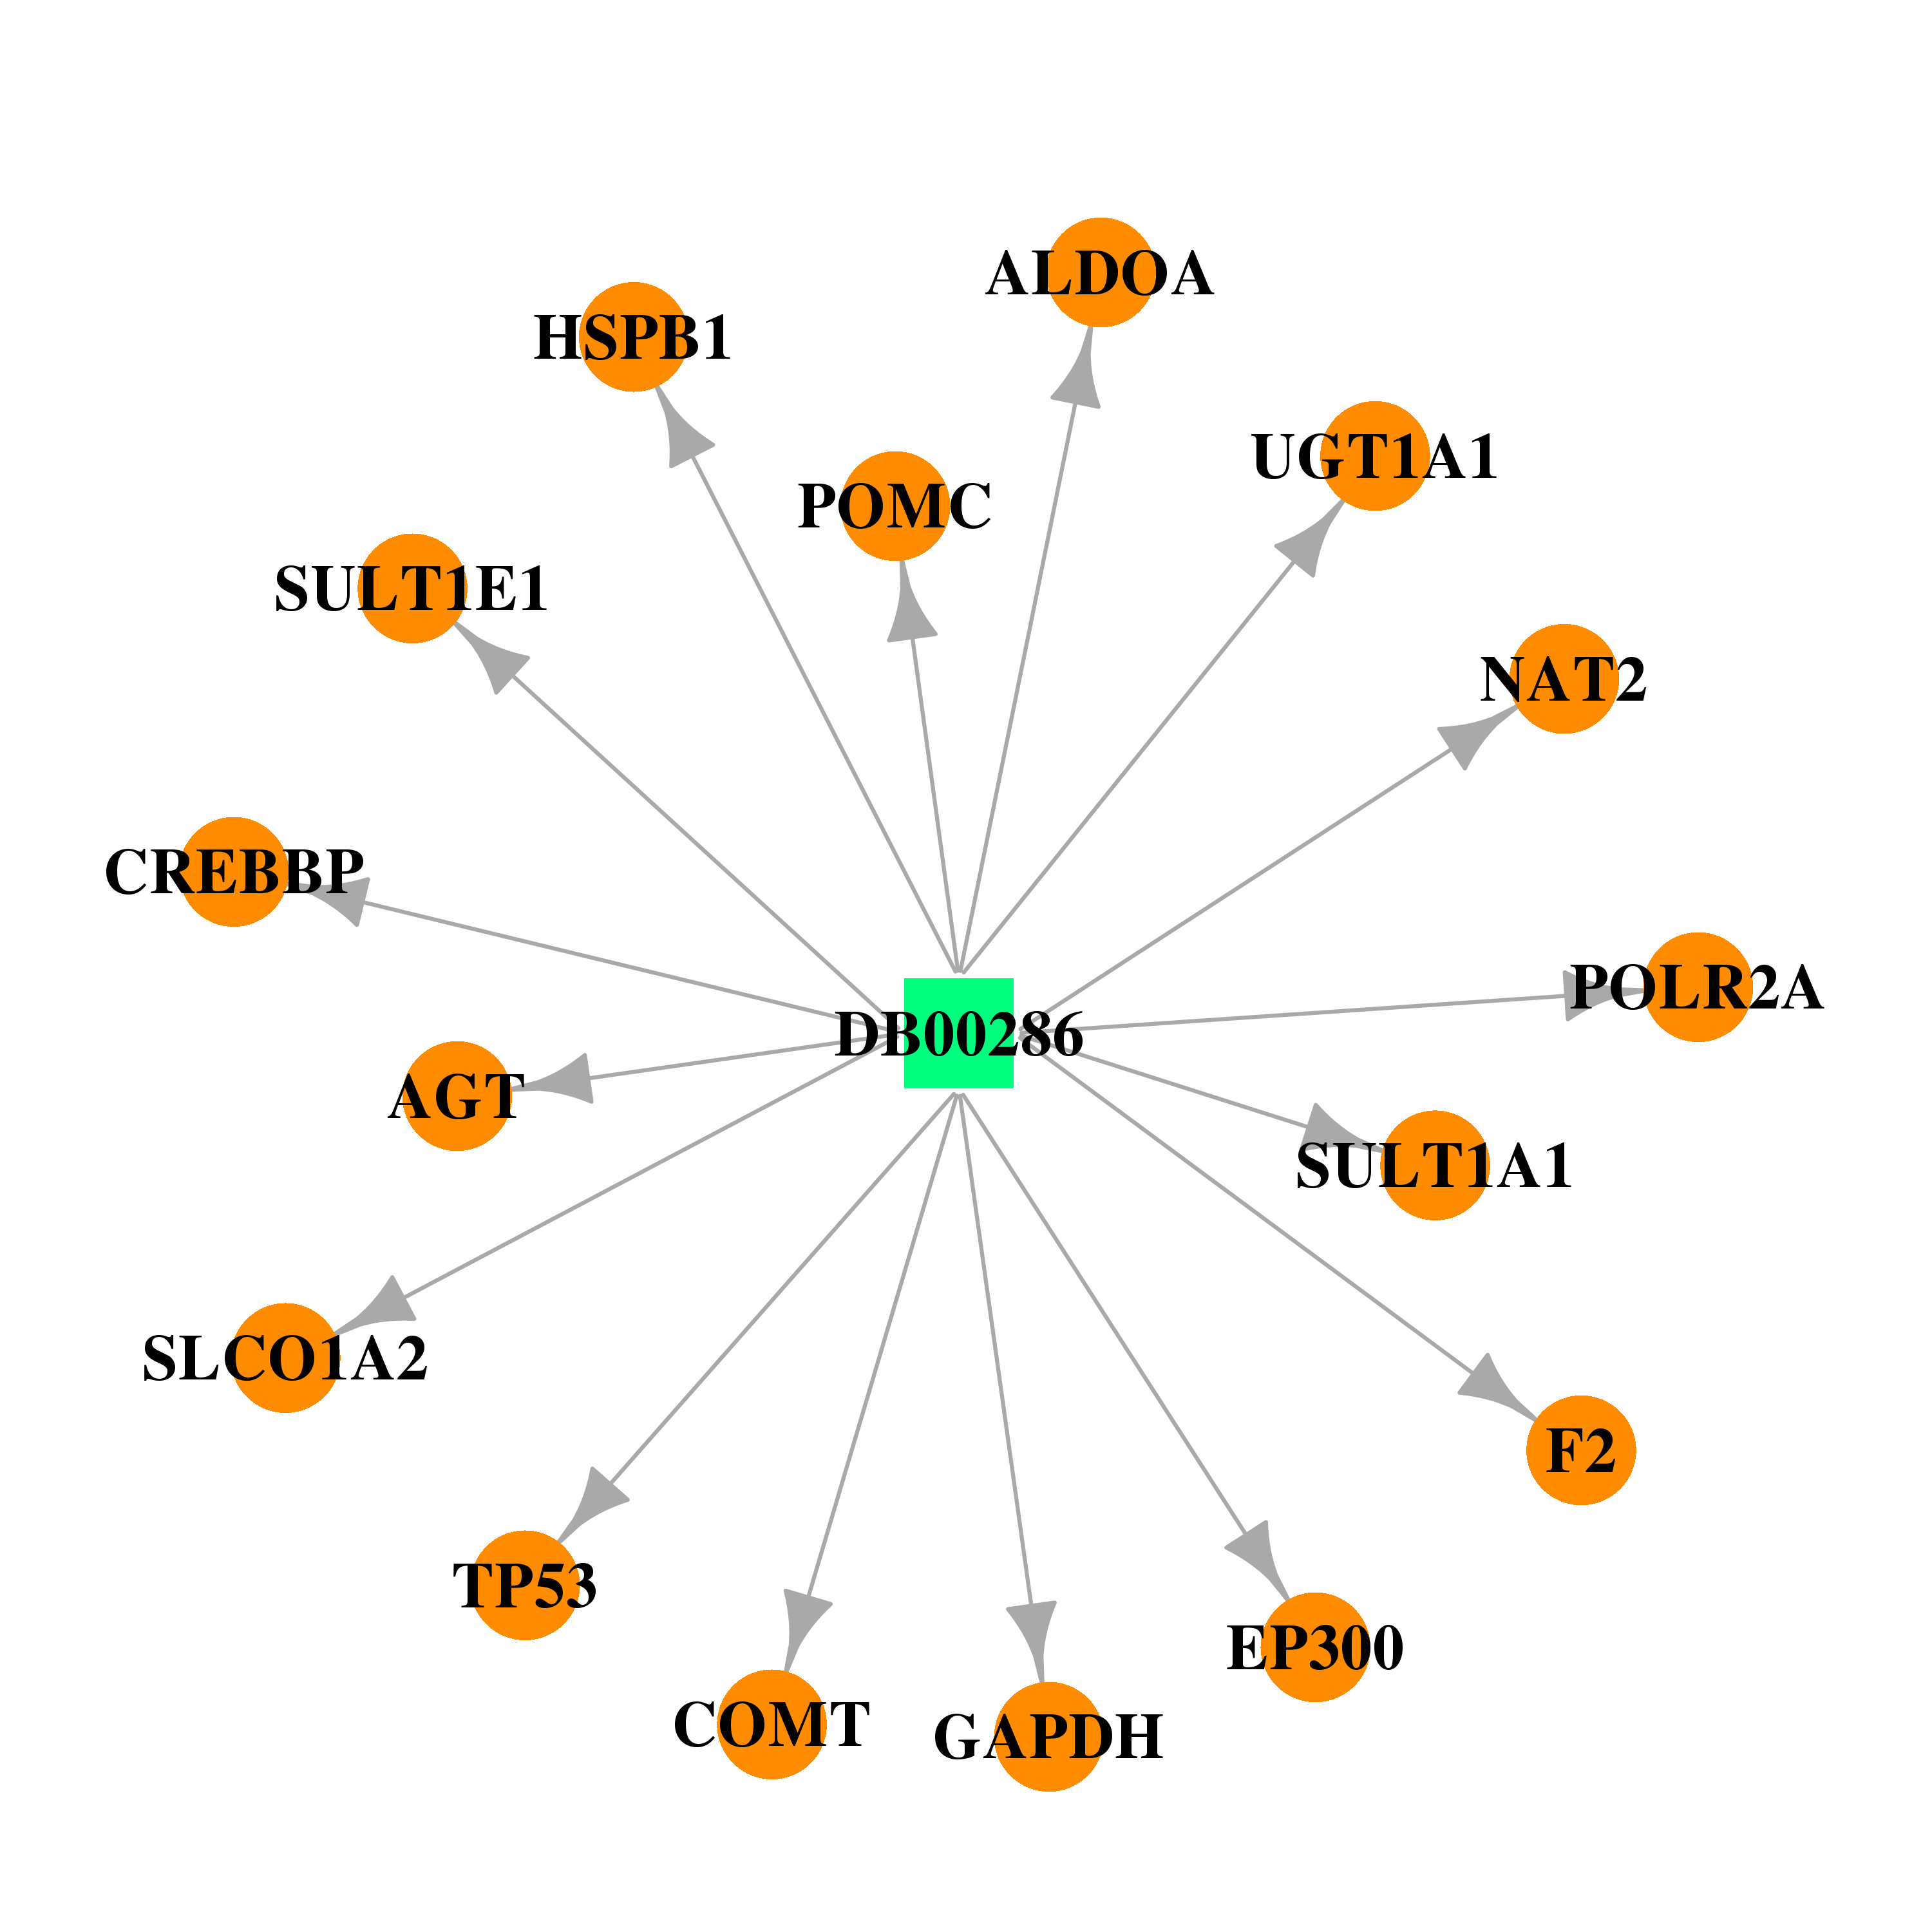 |  |
| DB00890 | heat shock 27kDa protein 1 | approved | Dienestrol | 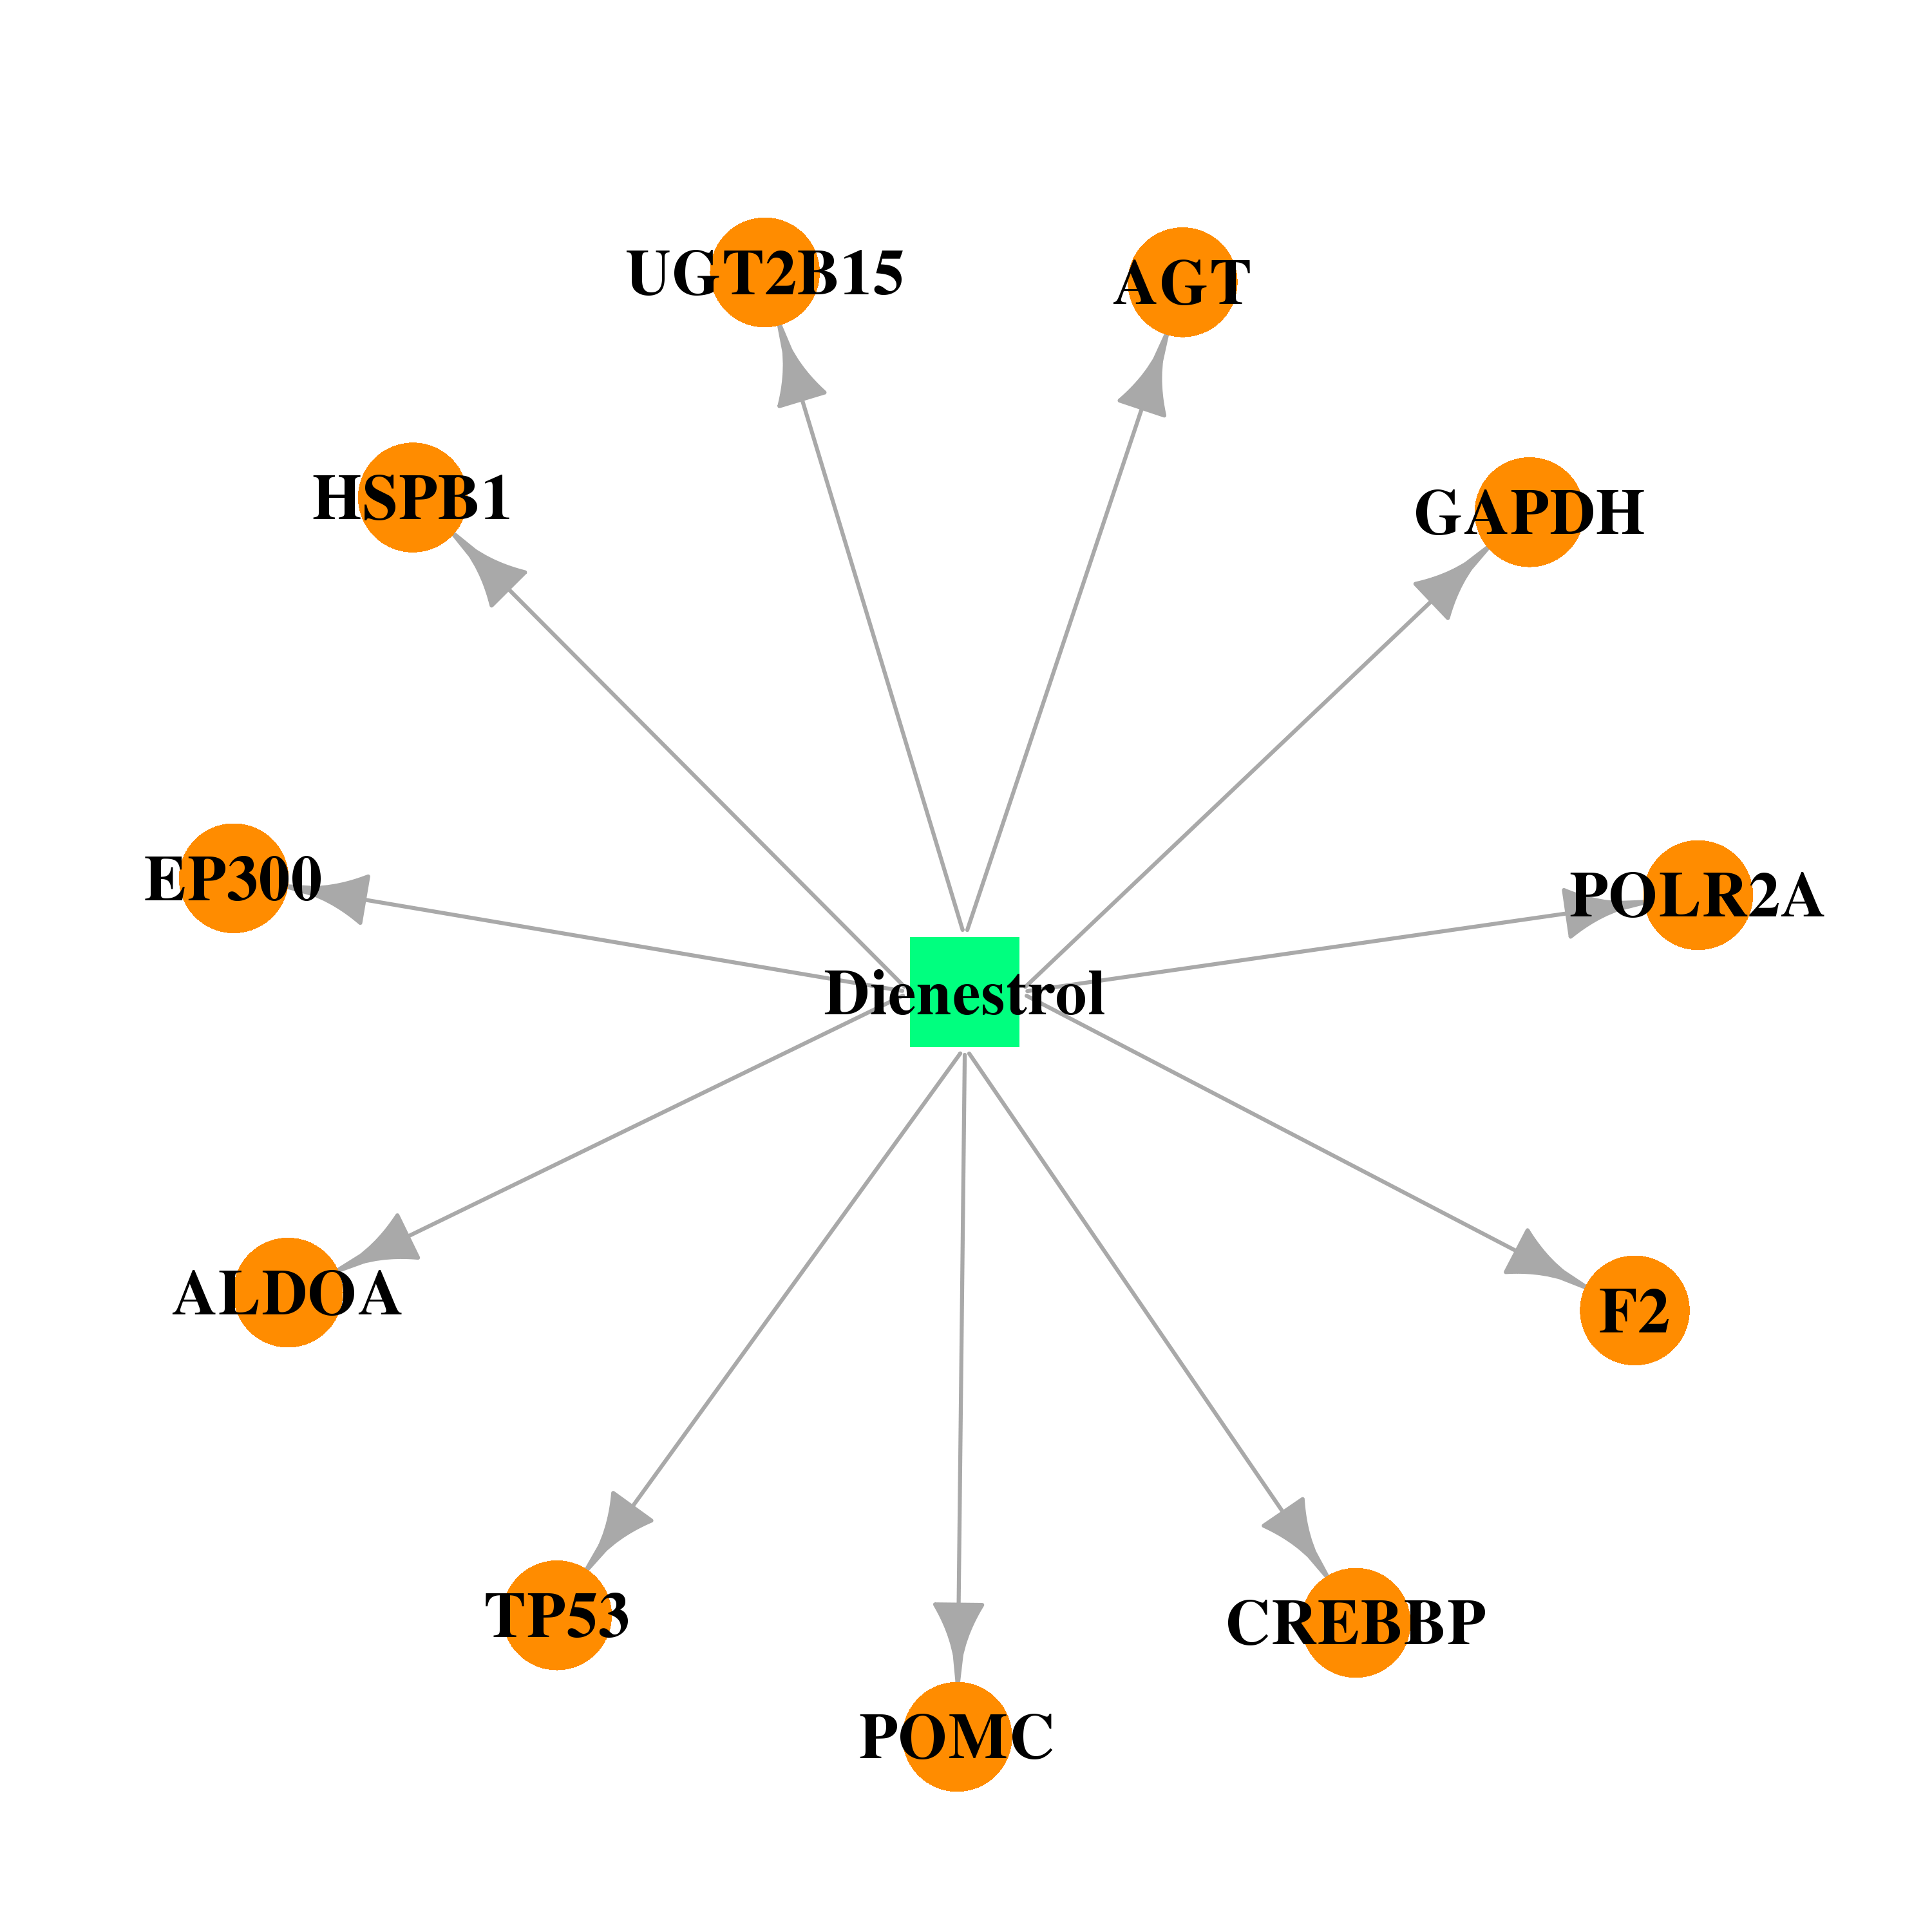 | 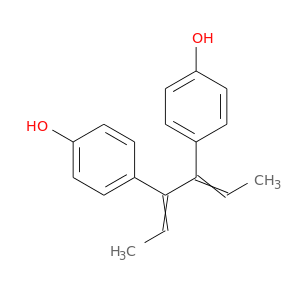 |
| DB00255 | heat shock 27kDa protein 1 | approved | Diethylstilbestrol |  |  |
| DB00783 | heat shock 27kDa protein 1 | approved; investigational | Estradiol | 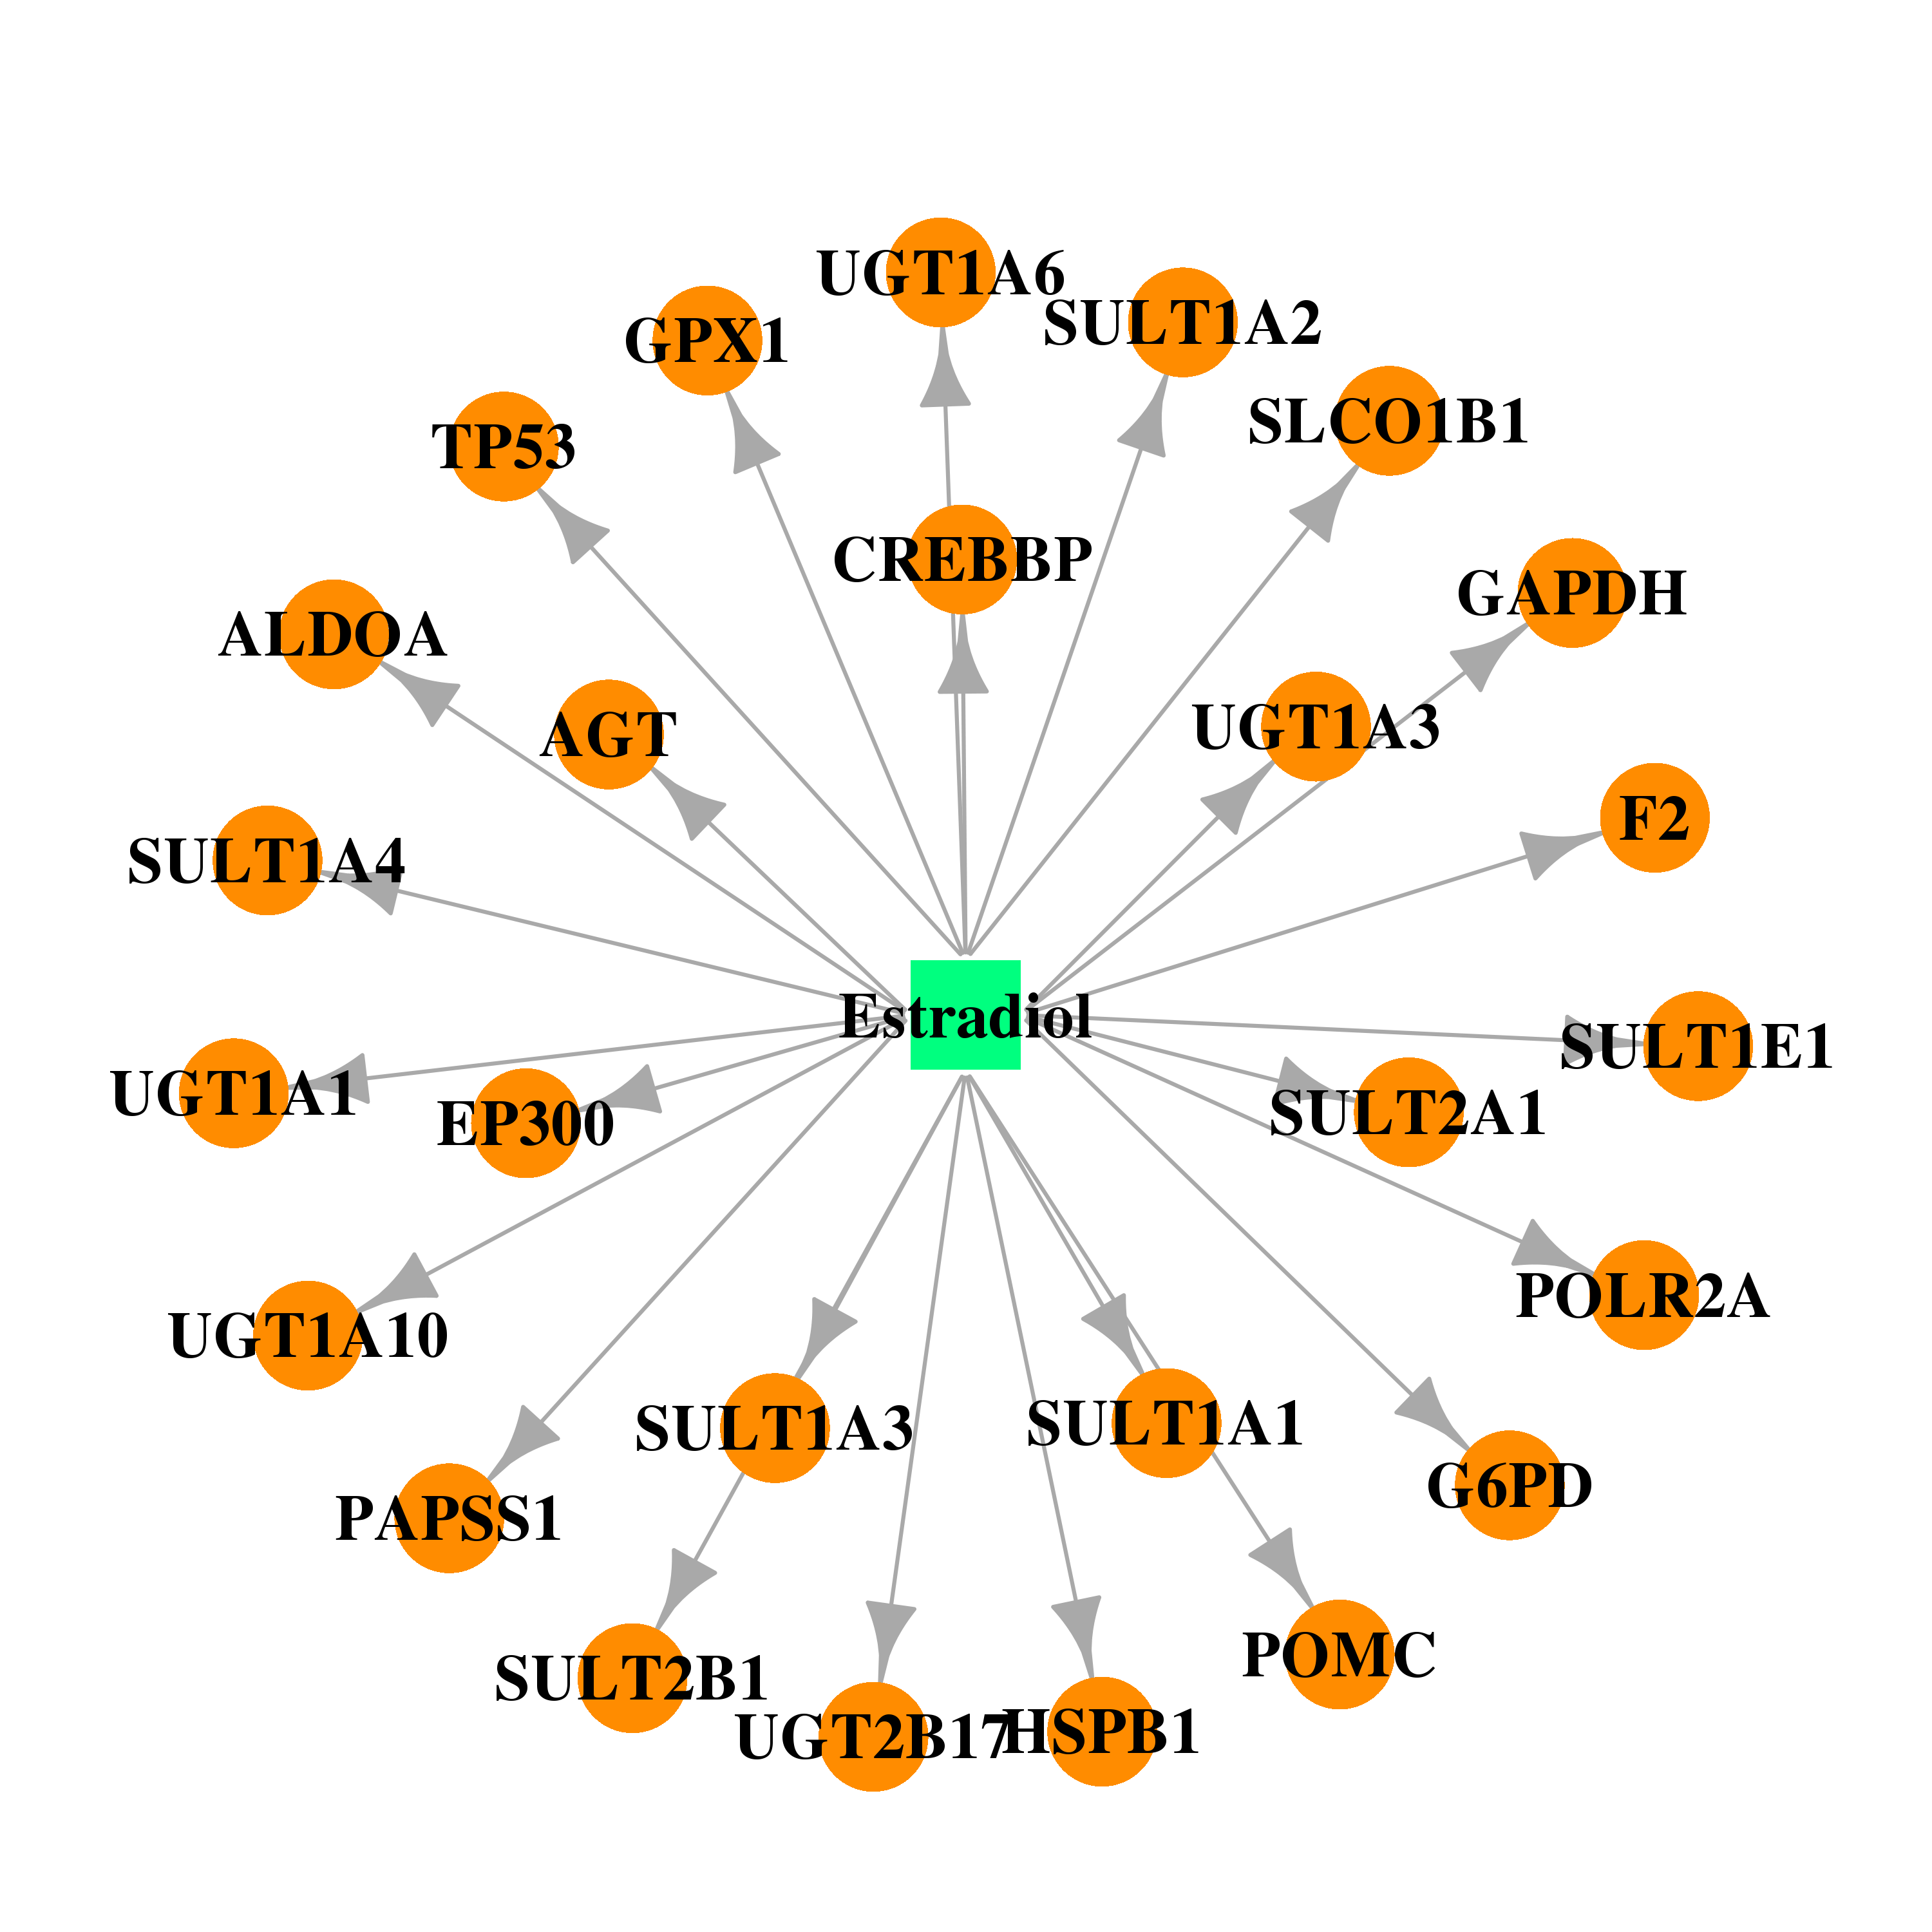 | 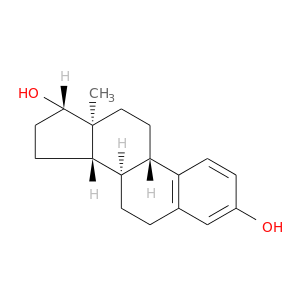 |
| DB00655 | heat shock 27kDa protein 1 | approved | Estrone | 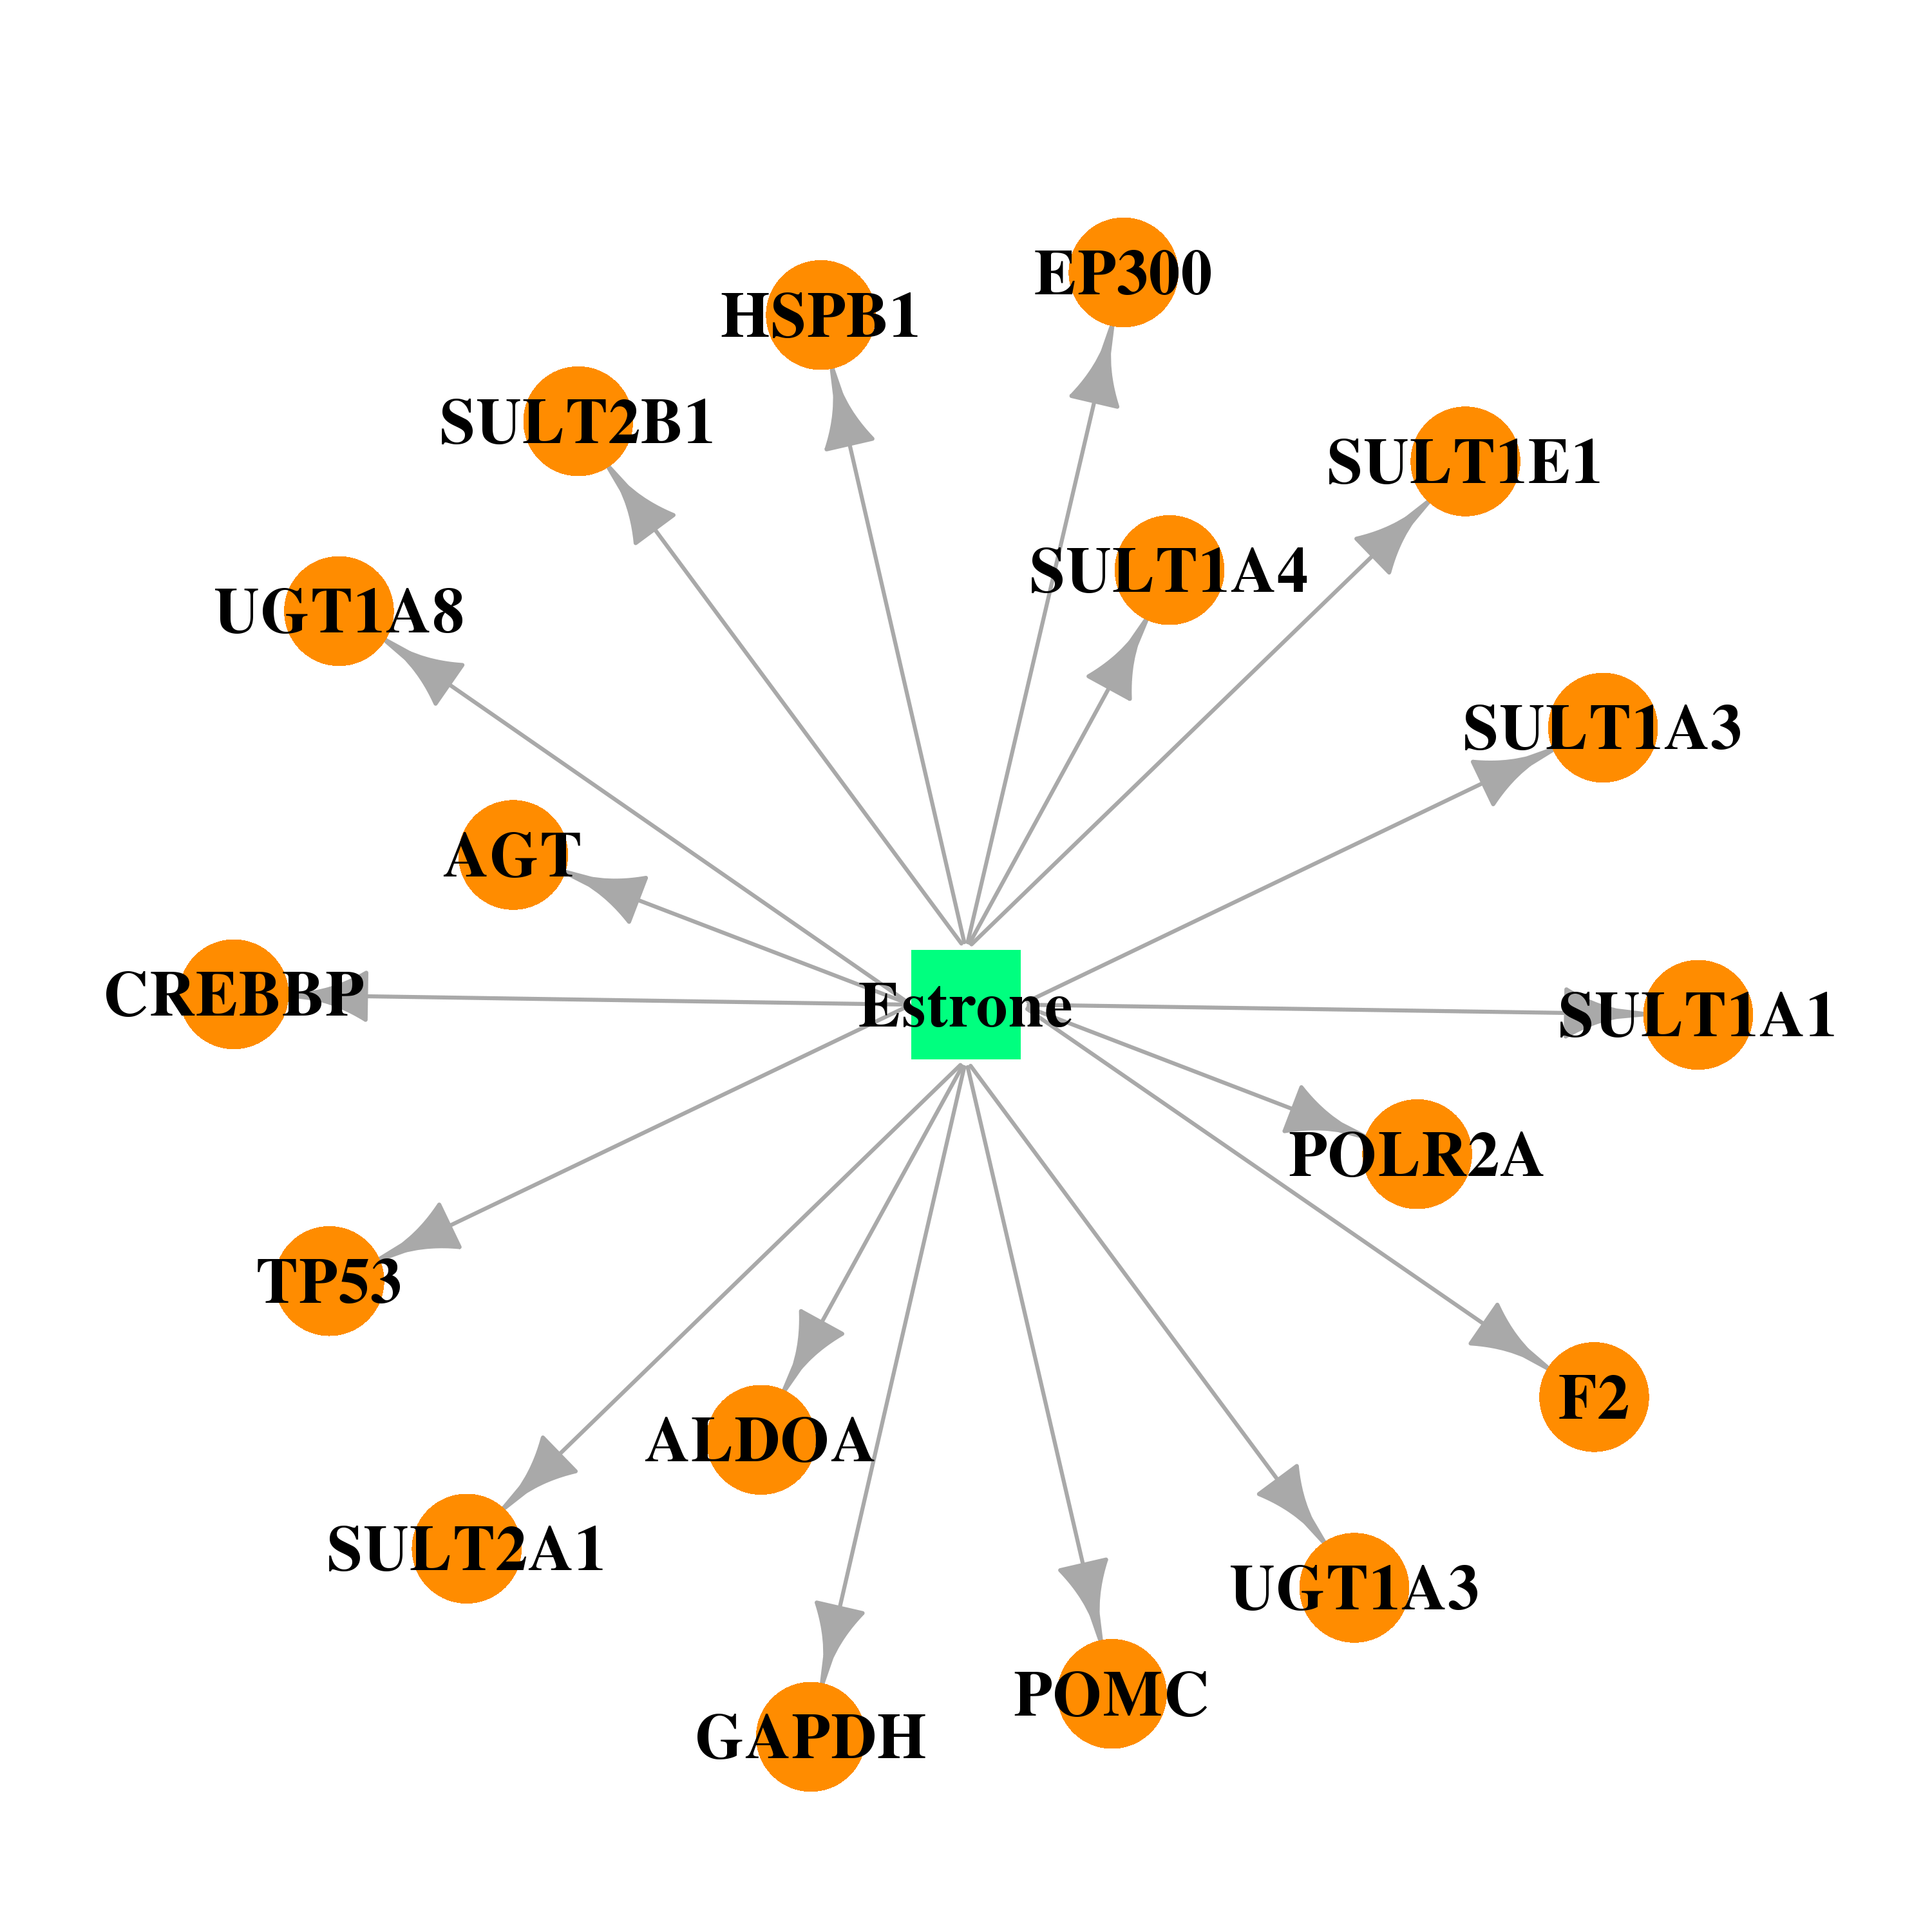 | 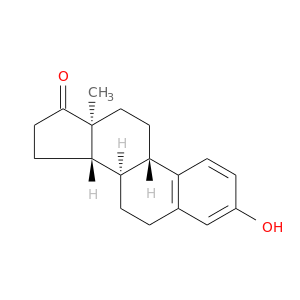 |
| DB00977 | heat shock 27kDa protein 1 | approved | Ethinyl Estradiol | 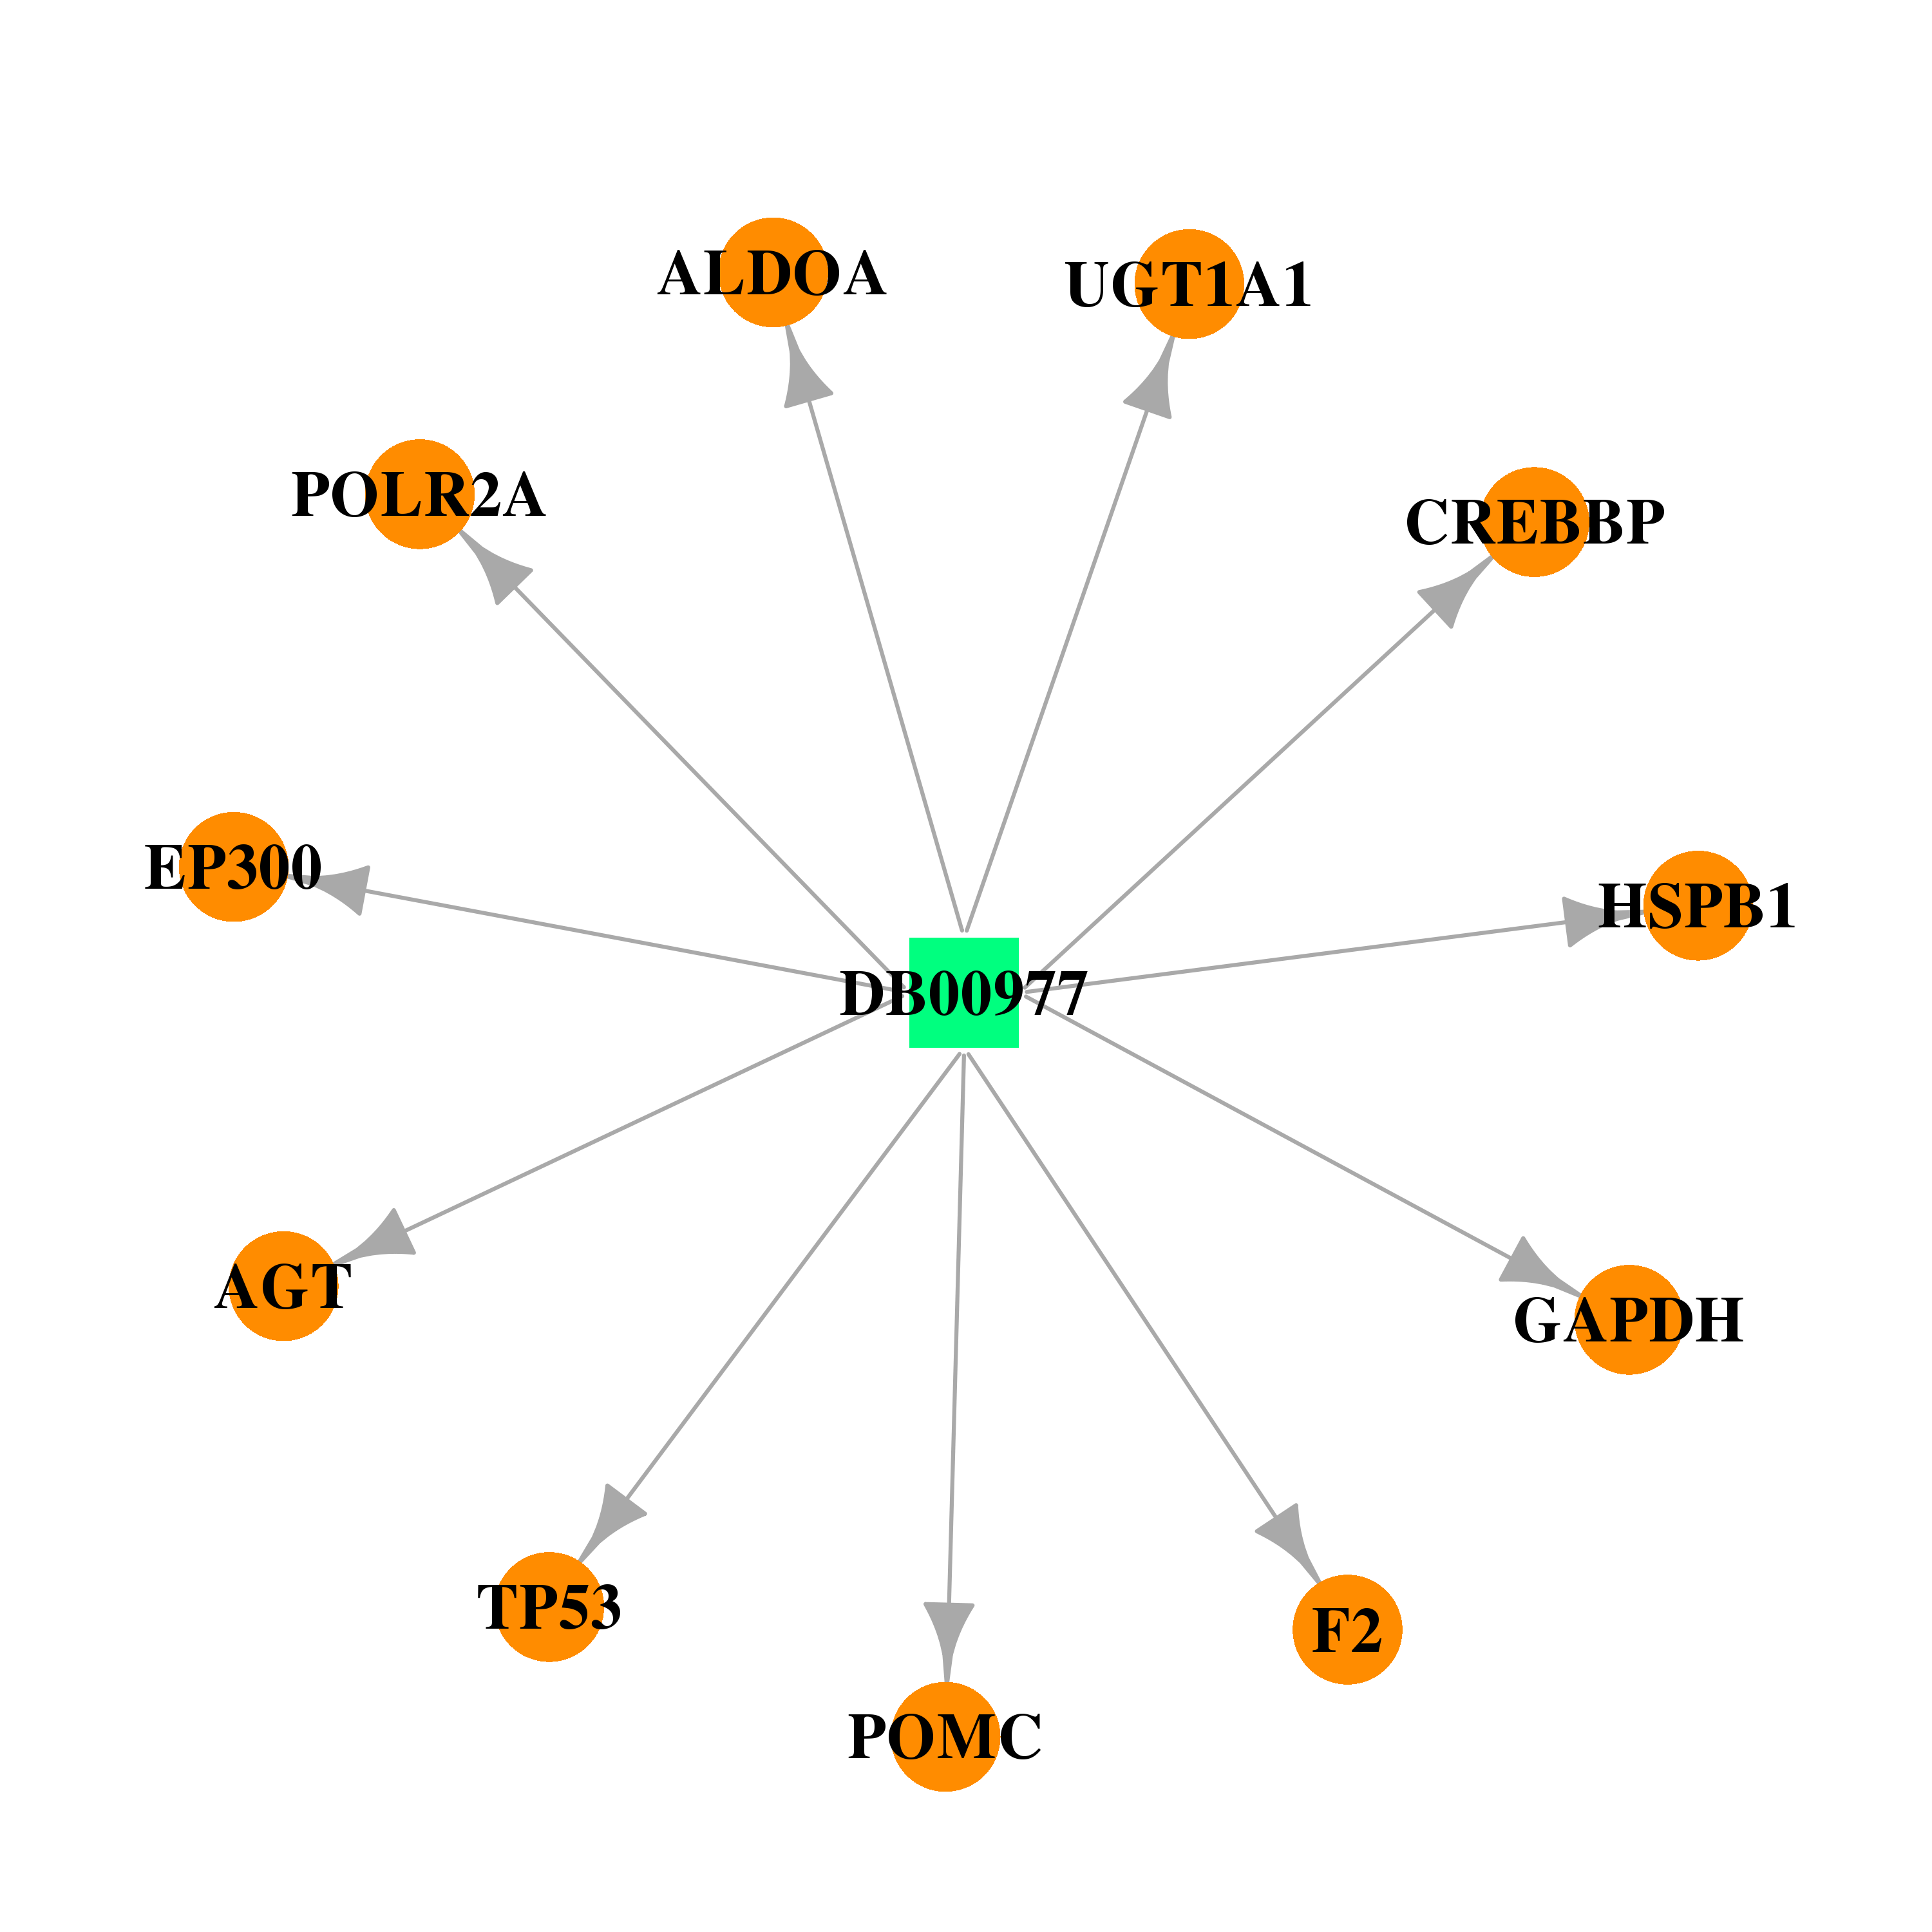 |  |
| DB00143 | heat shock 27kDa protein 1 | approved; nutraceutical | Glutathione |  |  |
| Top |
| Cross referenced IDs for HSPB1 |
| * We obtained these cross-references from Uniprot database. It covers 150 different DBs, 18 categories. http://www.uniprot.org/help/cross_references_section |
: Open all cross reference information
|
Copyright © 2016-Present - The Univsersity of Texas Health Science Center at Houston @ |