|
||||||||||||||||||||||||||||||||||||||||||||||||||||||||||||||||||||||||||||||||||||||||||||||||||||||||||||||||||||||||||||||||||||||||||||||||||||||||||||||||||||||||||||||||||||||||||||||||||||||||||||||||||||||||||||||||||||||||||||||||||||||||||||||||||||||||||||||||||||||||||||||||||||||||||||||||||||||||||
| |
| Phenotypic Information (metabolism pathway, cancer, disease, phenome) |
| |
| |
| Gene-Gene Network Information: Co-Expression Network, Interacting Genes & KEGG |
| |
|


| Gene Summary for HSPG2 |
| Top |
| Phenotypic Information for HSPG2(metabolism pathway, cancer, disease, phenome) |
| Cancer | CGAP: HSPG2 |
| Familial Cancer Database: HSPG2 | |
| * This gene is included in those cancer gene databases. |
|
|
|
|
|
| . | ||||||||||||||||||||||||||||||||||||||||||||||||||||||||||||||||||||||||||||||||||||||||||||||||||||||||||||||||||||||||||||||||||||||||||||||||||||||||||||||||||||||||||||||||||||||||||||||||||||||||||||||||||||||||||||||||||||||||||||||||||||||||||||||||||||||||||||||||||||||||||||||||||||||||||||||||||||
Oncogene 1 | Significant driver gene in | |||||||||||||||||||||||||||||||||||||||||||||||||||||||||||||||||||||||||||||||||||||||||||||||||||||||||||||||||||||||||||||||||||||||||||||||||||||||||||||||||||||||||||||||||||||||||||||||||||||||||||||||||||||||||||||||||||||||||||||||||||||||||||||||||||||||||||||||||||||||||||||||||||||||||||||||||||||||||
| cf) number; DB name 1 Oncogene; http://nar.oxfordjournals.org/content/35/suppl_1/D721.long, 2 Tumor Suppressor gene; https://bioinfo.uth.edu/TSGene/, 3 Cancer Gene Census; http://www.nature.com/nrc/journal/v4/n3/abs/nrc1299.html, 4 CancerGenes; http://nar.oxfordjournals.org/content/35/suppl_1/D721.long, 5 Network of Cancer Gene; http://ncg.kcl.ac.uk/index.php, 1Therapeutic Vulnerabilities in Cancer; http://cbio.mskcc.org/cancergenomics/statius/ |
| REACTOME_METABOLISM_OF_LIPIDS_AND_LIPOPROTEINS REACTOME_METABOLISM_OF_CARBOHYDRATES REACTOME_LIPOPROTEIN_METABOLISM | |
| OMIM | |
| Orphanet | |
| Disease | KEGG Disease: HSPG2 |
| MedGen: HSPG2 (Human Medical Genetics with Condition) | |
| ClinVar: HSPG2 | |
| Phenotype | MGI: HSPG2 (International Mouse Phenotyping Consortium) |
| PhenomicDB: HSPG2 | |
| Mutations for HSPG2 |
| * Under tables are showing count per each tissue to give us broad intuition about tissue specific mutation patterns.You can go to the detailed page for each mutation database's web site. |
| - Statistics for Tissue and Mutation type | Top |
 |
| - For Inter-chromosomal Variations |
| * Inter-chromosomal variantions includes 'interchromosomal amplicon to amplicon', 'interchromosomal amplicon to non-amplified dna', 'interchromosomal insertion', 'Interchromosomal unknown type'. |
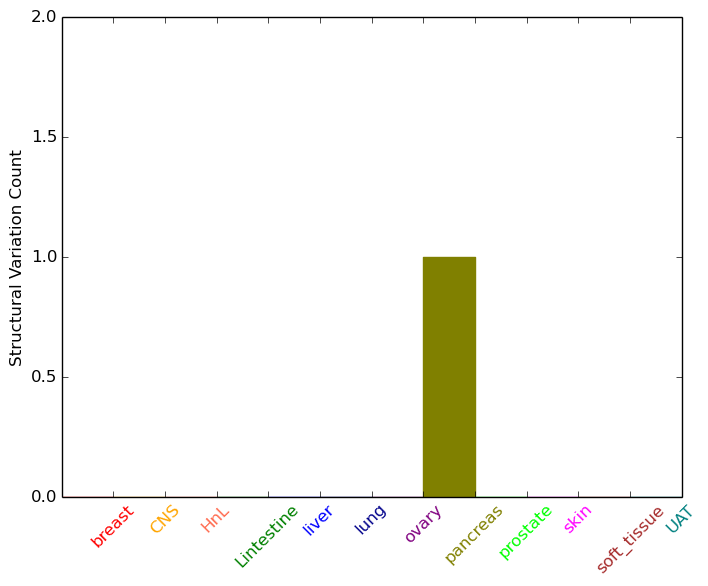 |
| - For Intra-chromosomal Variations |
| There's no intra-chromosomal structural variation. |
| Sample | Symbol_a | Chr_a | Start_a | End_a | Symbol_b | Chr_b | Start_b | End_b |
| cf) Tissue number; Tissue name (1;Breast, 2;Central_nervous_system, 3;Haematopoietic_and_lymphoid_tissue, 4;Large_intestine, 5;Liver, 6;Lung, 7;Ovary, 8;Pancreas, 9;Prostate, 10;Skin, 11;Soft_tissue, 12;Upper_aerodigestive_tract) |
| * From mRNA Sanger sequences, Chitars2.0 arranged chimeric transcripts. This table shows HSPG2 related fusion information. |
| ID | Head Gene | Tail Gene | Accession | Gene_a | qStart_a | qEnd_a | Chromosome_a | tStart_a | tEnd_a | Gene_a | qStart_a | qEnd_a | Chromosome_a | tStart_a | tEnd_a |
| CD676182 | HSPG2 | 1 | 208 | 1 | 22212789 | 22212997 | MOV10 | 204 | 625 | 1 | 113242372 | 113243187 | |
| AW604468 | HSPG2 | 25 | 340 | 1 | 22241959 | 22242274 | HSPG2 | 337 | 650 | 1 | 22206711 | 22207023 | |
| AW855179 | EIF3B | 32 | 348 | 7 | 2405457 | 2405778 | HSPG2 | 336 | 416 | 1 | 22178575 | 22178654 | |
| BE927253 | HSPG2 | 20 | 339 | 1 | 22206705 | 22207023 | HSPG2 | 336 | 646 | 1 | 22241964 | 22242274 | |
| Top |
| Mutation type/ Tissue ID | brca | cns | cerv | endome | haematopo | kidn | Lintest | liver | lung | ns | ovary | pancre | prost | skin | stoma | thyro | urina | |||
| Total # sample | 1 | |||||||||||||||||||
| GAIN (# sample) | 1 | |||||||||||||||||||
| LOSS (# sample) |
| cf) Tissue ID; Tissue type (1; Breast, 2; Central_nervous_system, 3; Cervix, 4; Endometrium, 5; Haematopoietic_and_lymphoid_tissue, 6; Kidney, 7; Large_intestine, 8; Liver, 9; Lung, 10; NS, 11; Ovary, 12; Pancreas, 13; Prostate, 14; Skin, 15; Stomach, 16; Thyroid, 17; Urinary_tract) |
| Top |
|
 |
| Top |
| Stat. for Non-Synonymous SNVs (# total SNVs=244) | (# total SNVs=105) |
 | 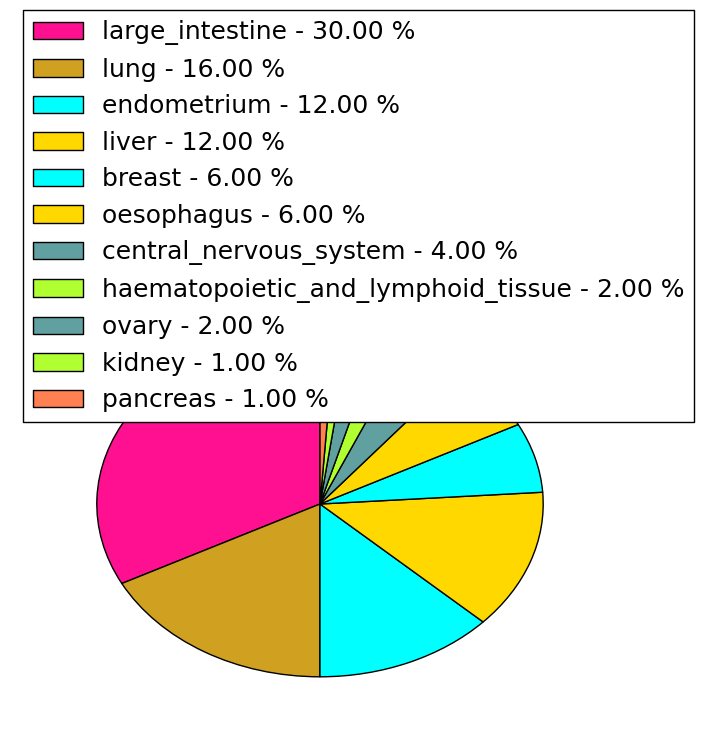 |
(# total SNVs=5) | (# total SNVs=1) |
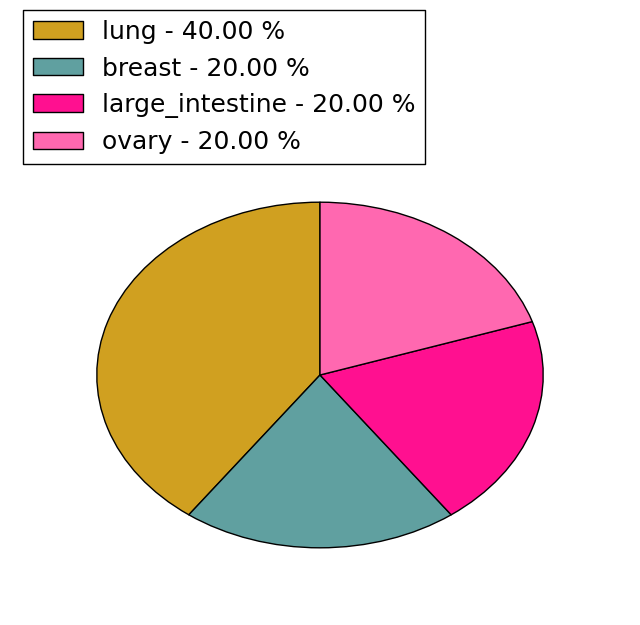 | 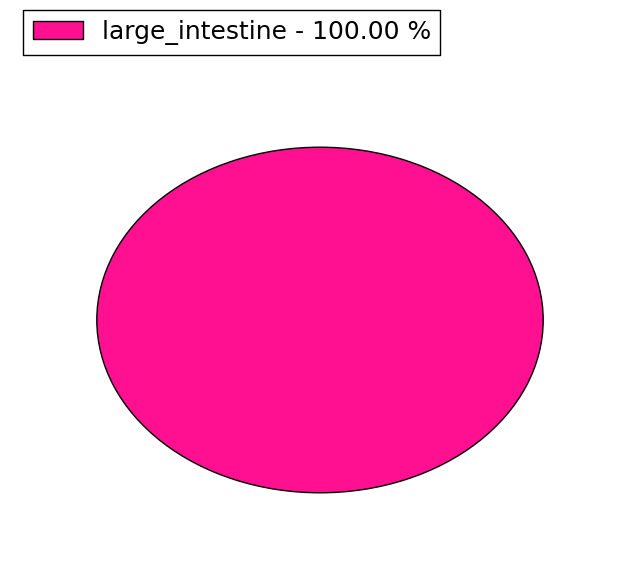 |
| Top |
| * When you move the cursor on each content, you can see more deailed mutation information on the Tooltip. Those are primary_site,primary_histology,mutation(aa),pubmedID. |
| GRCh37 position | Mutation(aa) | Unique sampleID count |
| chr1:22149935-22149935 | p.S4350S | 11 |
| chr1:22191454-22191454 | p.A1503V | 7 |
| chr1:22176683-22176683 | p.L2433V | 4 |
| chr1:22165987-22165987 | p.H3256Y | 3 |
| chr1:22174253-22174253 | p.V2652M | 3 |
| chr1:22222458-22222458 | p.D67D | 3 |
| chr1:22150680-22150680 | p.G4278V | 3 |
| chr1:22214000-22214000 | p.A291T | 3 |
| chr1:22182404-22182404 | p.A1859A | 3 |
| chr1:22214554-22214554 | p.Q194* | 3 |
| Top |
|
 |
| Point Mutation/ Tissue ID | 1 | 2 | 3 | 4 | 5 | 6 | 7 | 8 | 9 | 10 | 11 | 12 | 13 | 14 | 15 | 16 | 17 | 18 | 19 | 20 |
| # sample | 9 | 8 | 3 | 23 | 7 | 13 | 2 | 10 | 2 | 2 | 28 | 16 | 12 | 5 | 35 | 29 | 25 | |||
| # mutation | 13 | 8 | 3 | 24 | 7 | 14 | 2 | 10 | 2 | 2 | 32 | 16 | 12 | 5 | 44 | 36 | 38 | |||
| nonsynonymous SNV | 7 | 6 | 1 | 15 | 7 | 9 | 2 | 9 | 1 | 1 | 25 | 11 | 9 | 4 | 25 | 23 | 25 | |||
| synonymous SNV | 6 | 2 | 2 | 9 | 5 | 1 | 1 | 1 | 7 | 5 | 3 | 1 | 19 | 13 | 13 |
| cf) Tissue ID; Tissue type (1; BLCA[Bladder Urothelial Carcinoma], 2; BRCA[Breast invasive carcinoma], 3; CESC[Cervical squamous cell carcinoma and endocervical adenocarcinoma], 4; COAD[Colon adenocarcinoma], 5; GBM[Glioblastoma multiforme], 6; Glioma Low Grade, 7; HNSC[Head and Neck squamous cell carcinoma], 8; KICH[Kidney Chromophobe], 9; KIRC[Kidney renal clear cell carcinoma], 10; KIRP[Kidney renal papillary cell carcinoma], 11; LAML[Acute Myeloid Leukemia], 12; LUAD[Lung adenocarcinoma], 13; LUSC[Lung squamous cell carcinoma], 14; OV[Ovarian serous cystadenocarcinoma ], 15; PAAD[Pancreatic adenocarcinoma], 16; PRAD[Prostate adenocarcinoma], 17; SKCM[Skin Cutaneous Melanoma], 18:STAD[Stomach adenocarcinoma], 19:THCA[Thyroid carcinoma], 20:UCEC[Uterine Corpus Endometrial Carcinoma]) |
| Top |
| * We represented just top 10 SNVs. When you move the cursor on each content, you can see more deailed mutation information on the Tooltip. Those are primary_site, primary_histology, mutation(aa), pubmedID. |
| Genomic Position | Mutation(aa) | Unique sampleID count |
| chr1:22214000 | p.R2698L,HSPG2 | 2 |
| chr1:22206927 | p.V1659M,HSPG2 | 2 |
| chr1:22183650 | p.I3831I,HSPG2 | 2 |
| chr1:22173921 | p.A291T,HSPG2 | 2 |
| chr1:22203098 | p.V2653M,HSPG2 | 2 |
| chr1:22191363 | p.R4087W,HSPG2 | 2 |
| chr1:22174253 | p.F912F,HSPG2 | 2 |
| chr1:22154901 | p.P1534P,HSPG2 | 2 |
| chr1:22168062 | p.I2635I,HSPG2 | 2 |
| chr1:22174305 | p.S709S,HSPG2 | 2 |
| * Copy number data were extracted from TCGA using R package TCGA-Assembler. The URLs of all public data files on TCGA DCC data server were gathered on Jan-05-2015. Function ProcessCNAData in TCGA-Assembler package was used to obtain gene-level copy number value which is calculated as the average copy number of the genomic region of a gene. |
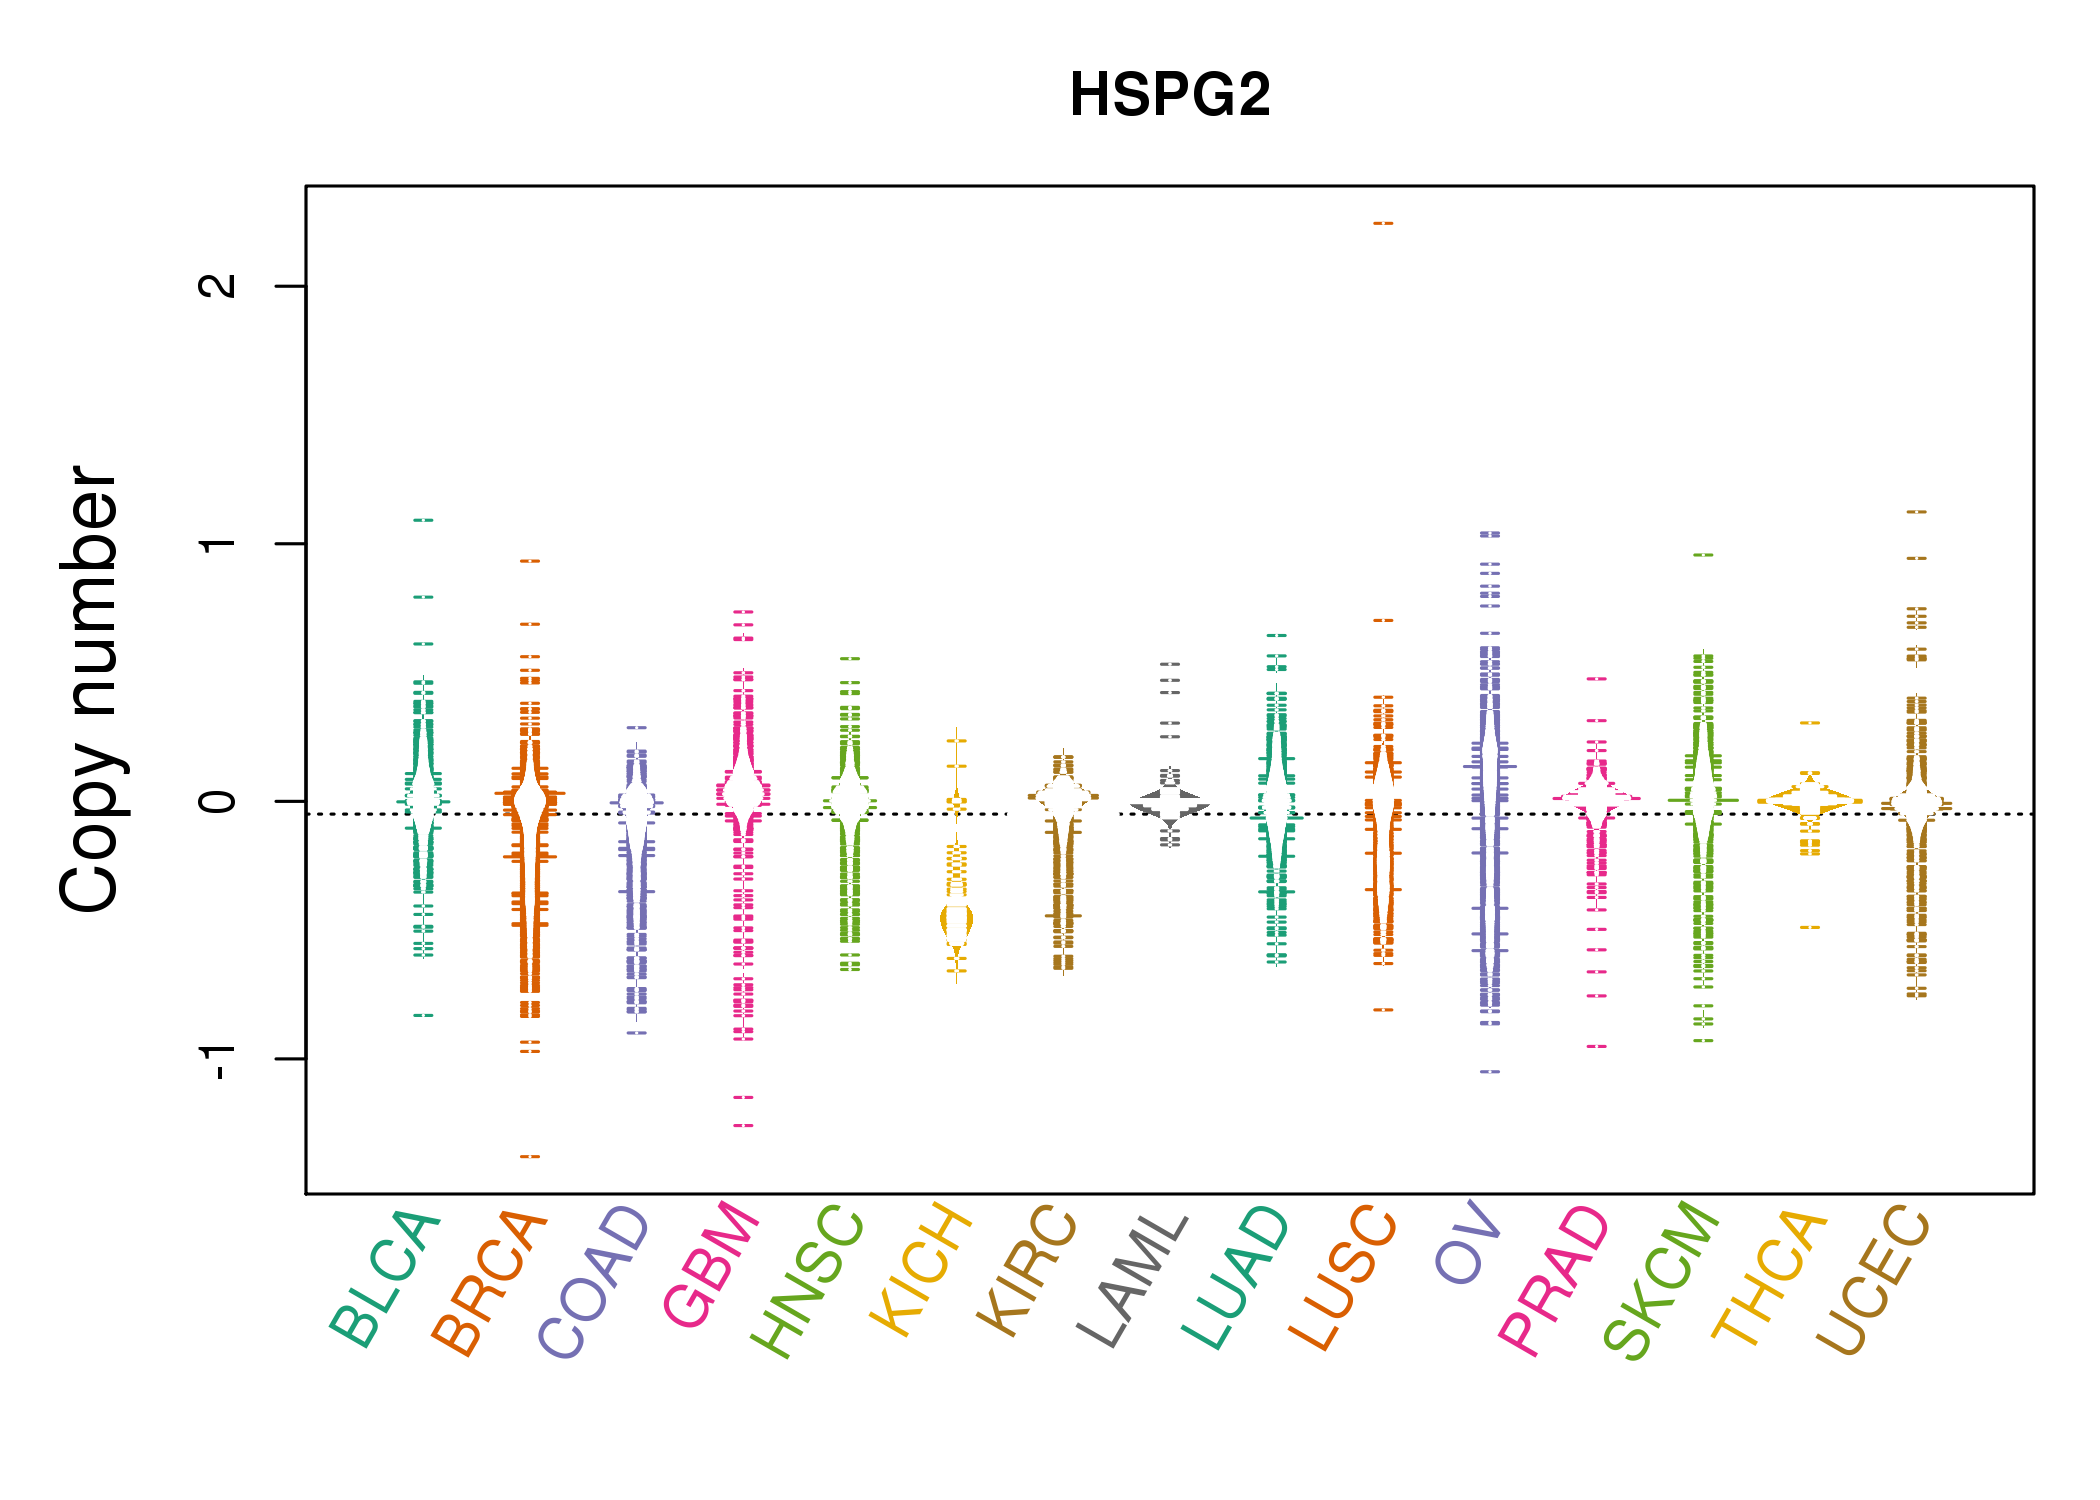 |
| cf) Tissue ID[Tissue type]: BLCA[Bladder Urothelial Carcinoma], BRCA[Breast invasive carcinoma], CESC[Cervical squamous cell carcinoma and endocervical adenocarcinoma], COAD[Colon adenocarcinoma], GBM[Glioblastoma multiforme], Glioma Low Grade, HNSC[Head and Neck squamous cell carcinoma], KICH[Kidney Chromophobe], KIRC[Kidney renal clear cell carcinoma], KIRP[Kidney renal papillary cell carcinoma], LAML[Acute Myeloid Leukemia], LUAD[Lung adenocarcinoma], LUSC[Lung squamous cell carcinoma], OV[Ovarian serous cystadenocarcinoma ], PAAD[Pancreatic adenocarcinoma], PRAD[Prostate adenocarcinoma], SKCM[Skin Cutaneous Melanoma], STAD[Stomach adenocarcinoma], THCA[Thyroid carcinoma], UCEC[Uterine Corpus Endometrial Carcinoma] |
| Top |
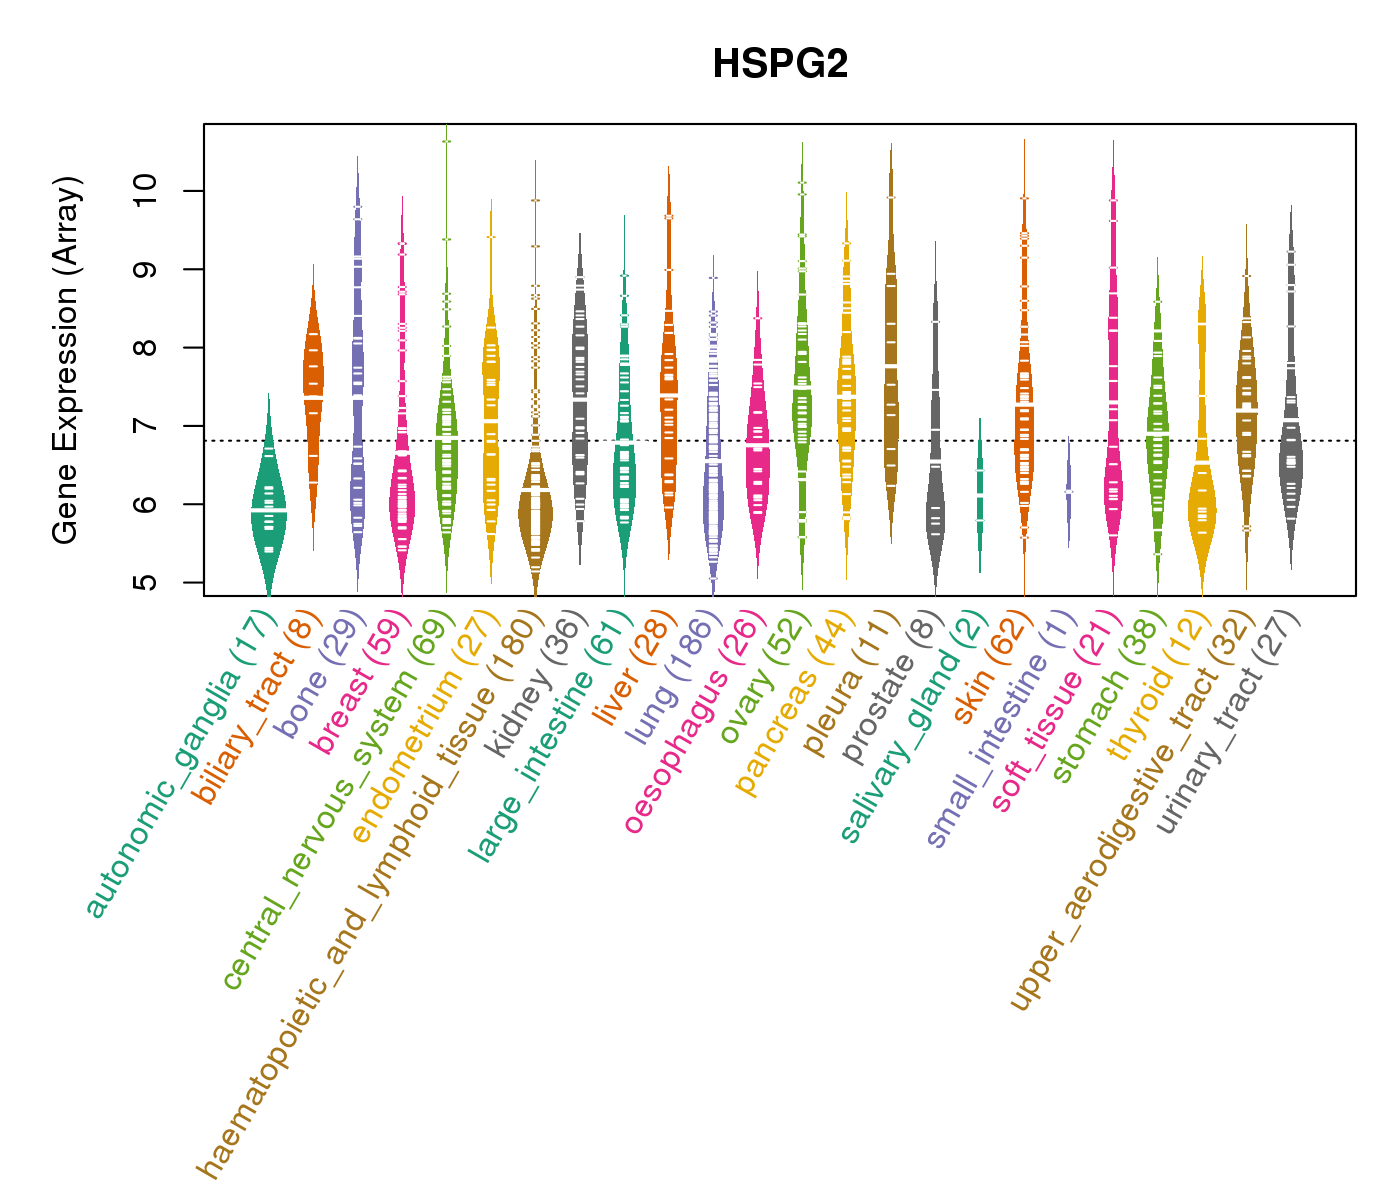
| Gene Expression for HSPG2 |
| * CCLE gene expression data were extracted from CCLE_Expression_Entrez_2012-10-18.res: Gene-centric RMA-normalized mRNA expression data. |
 |
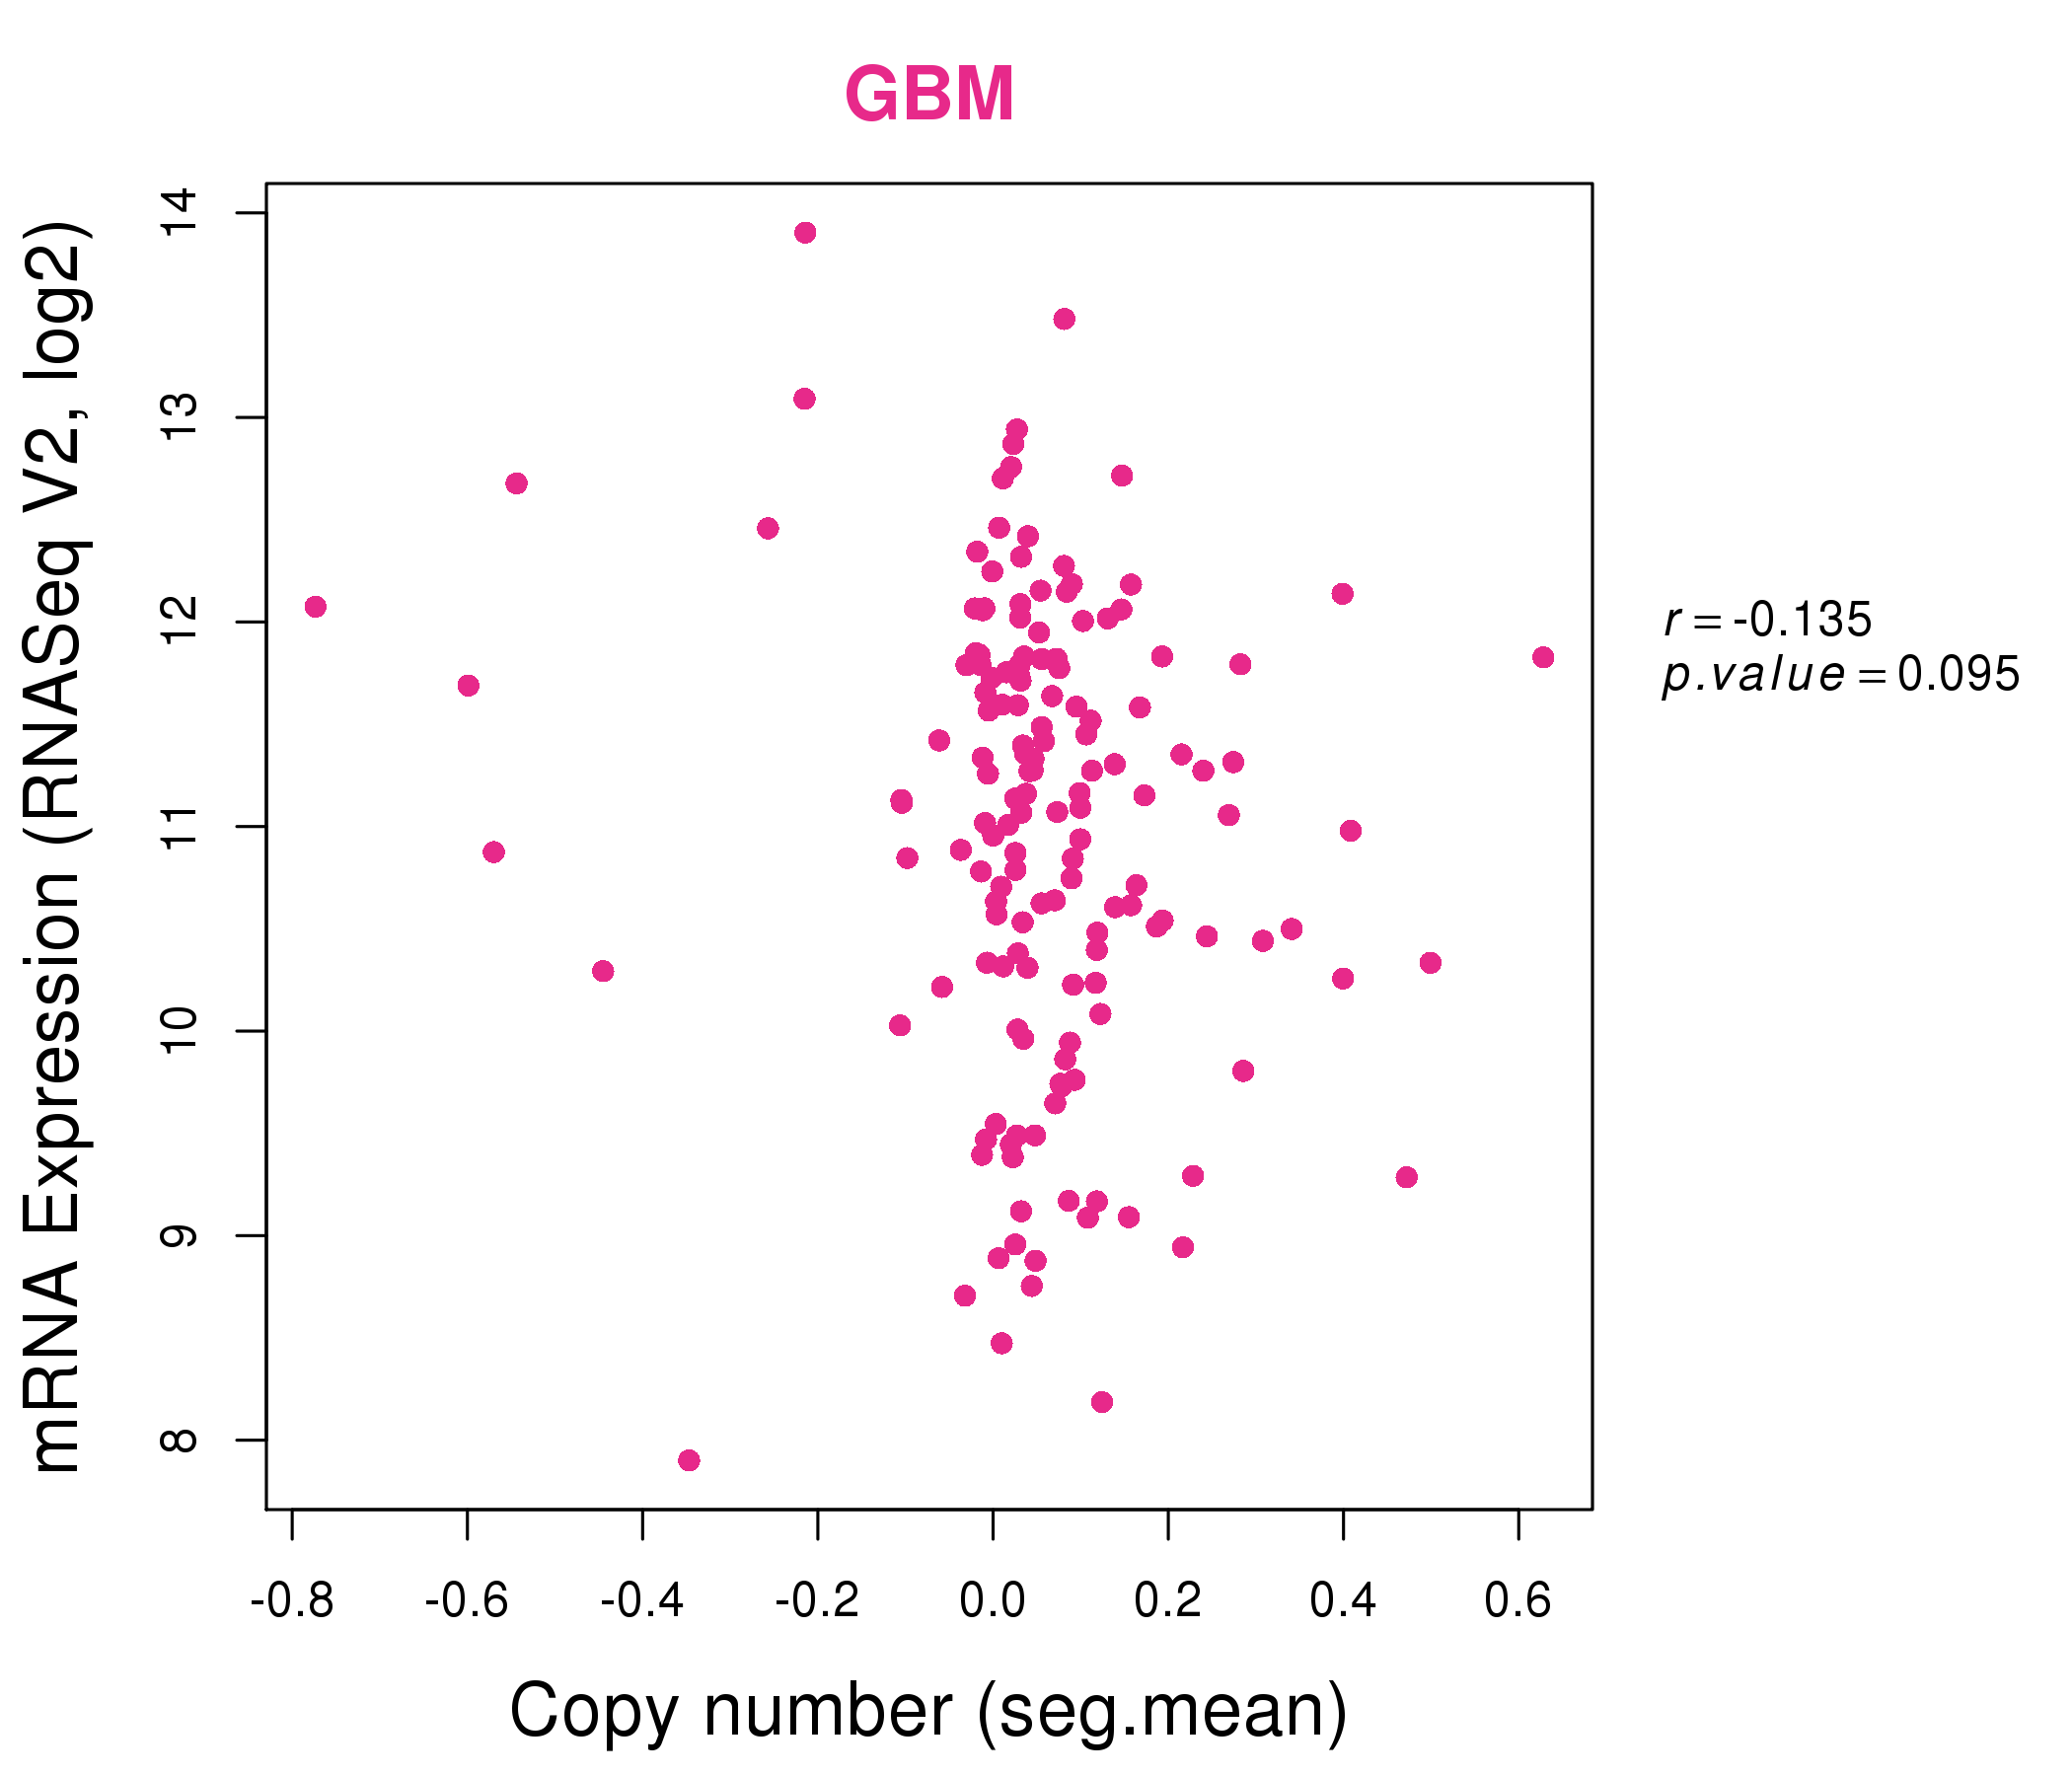
| * Normalized gene expression data of RNASeqV2 was extracted from TCGA using R package TCGA-Assembler. The URLs of all public data files on TCGA DCC data server were gathered at Jan-05-2015. Only eight cancer types have enough normal control samples for differential expression analysis. (t test, adjusted p<0.05 (using Benjamini-Hochberg FDR)) |
 |
| Top |
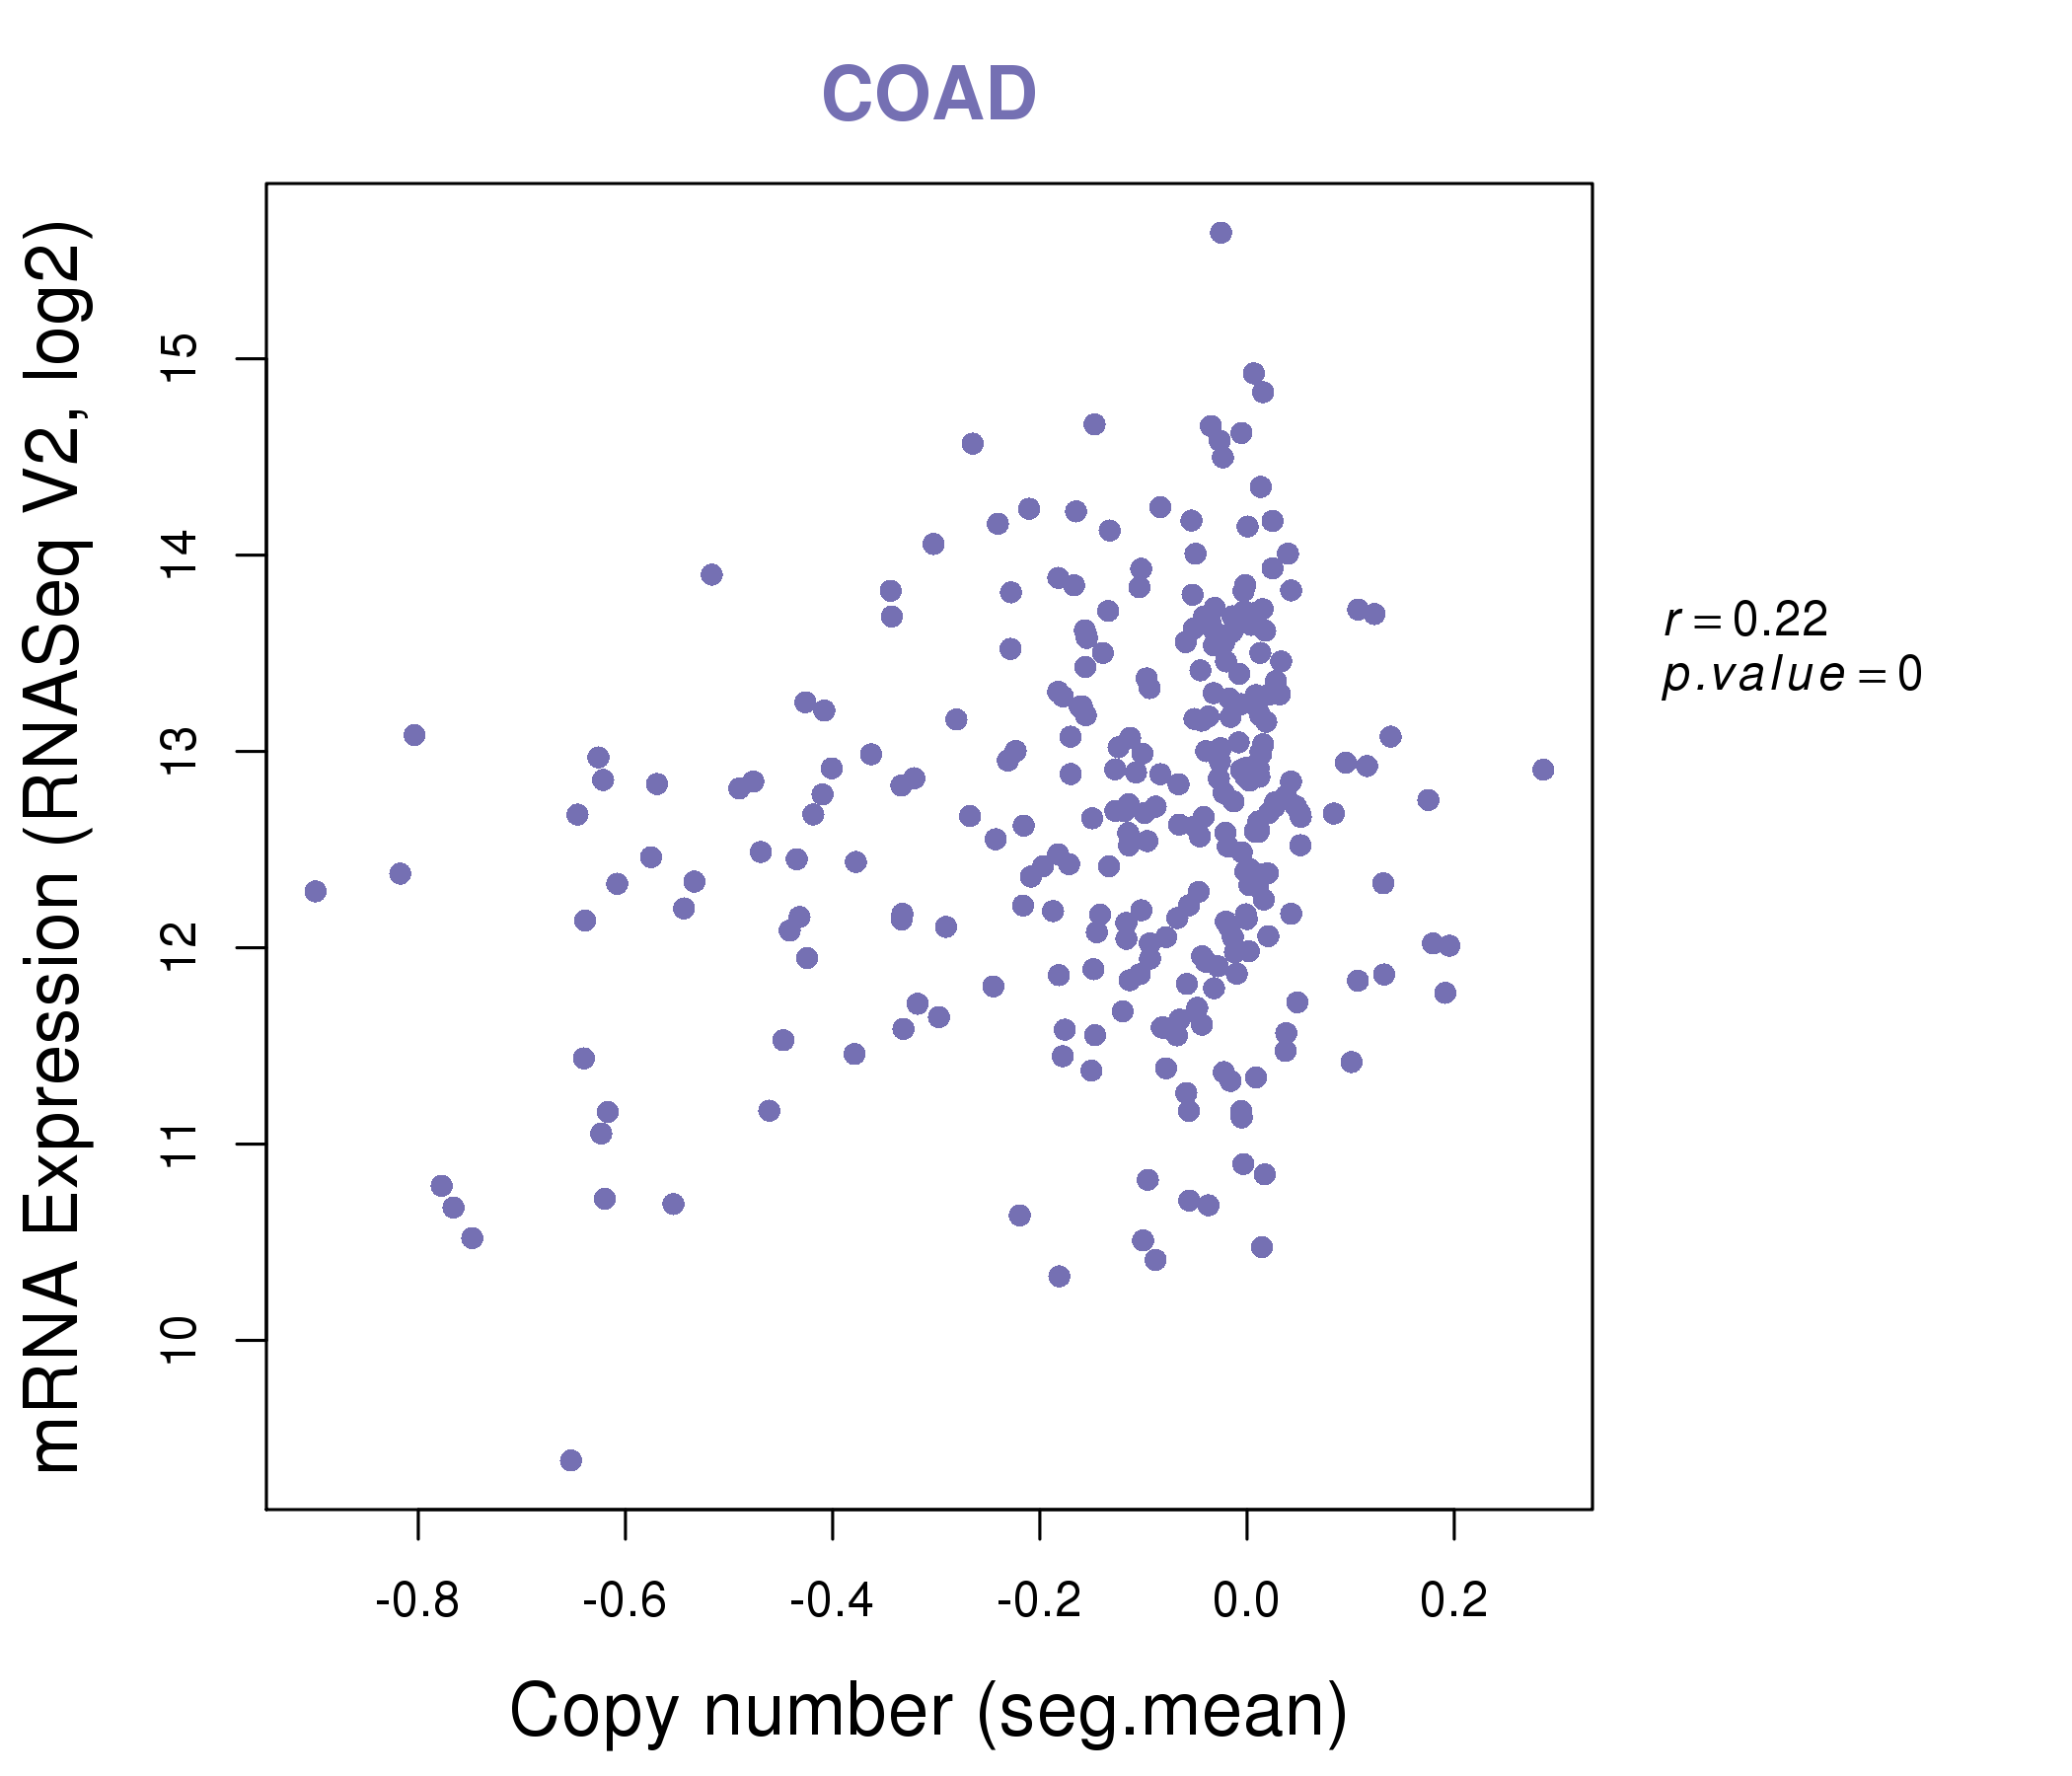
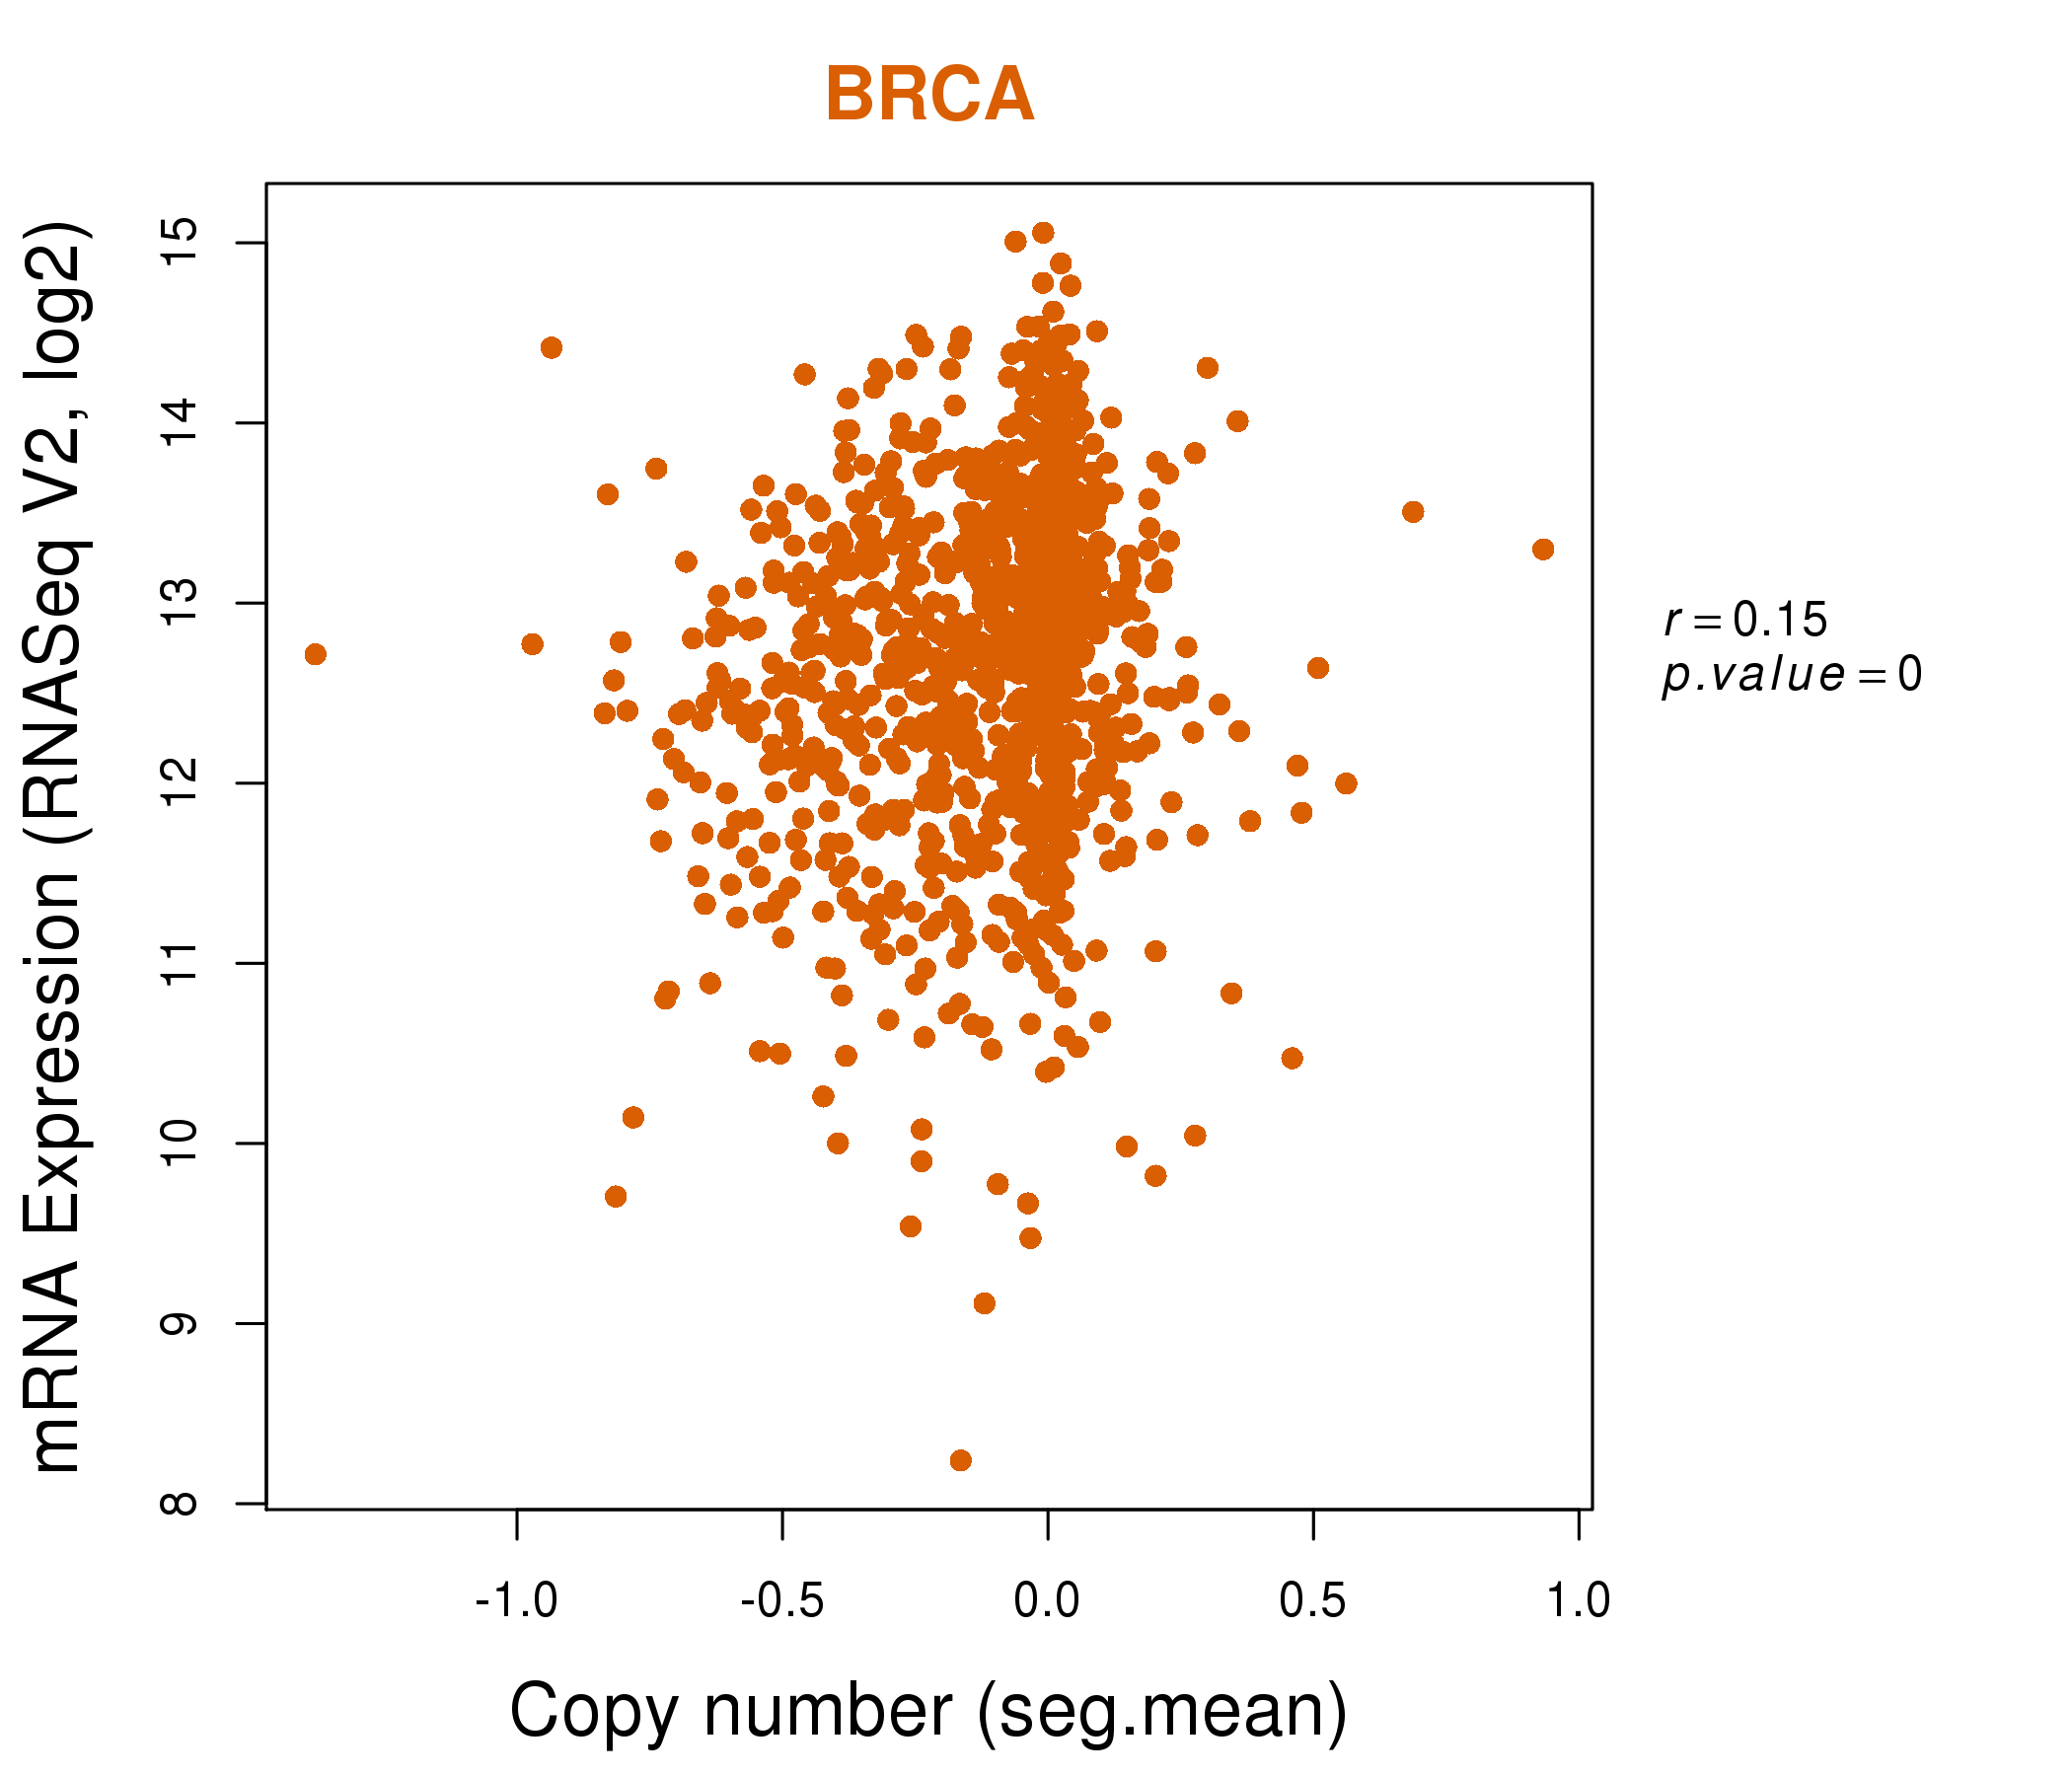
| * This plots show the correlation between CNV and gene expression. |
: Open all plots for all cancer types
 |
|
 |
|
| Top |
| Gene-Gene Network Information |
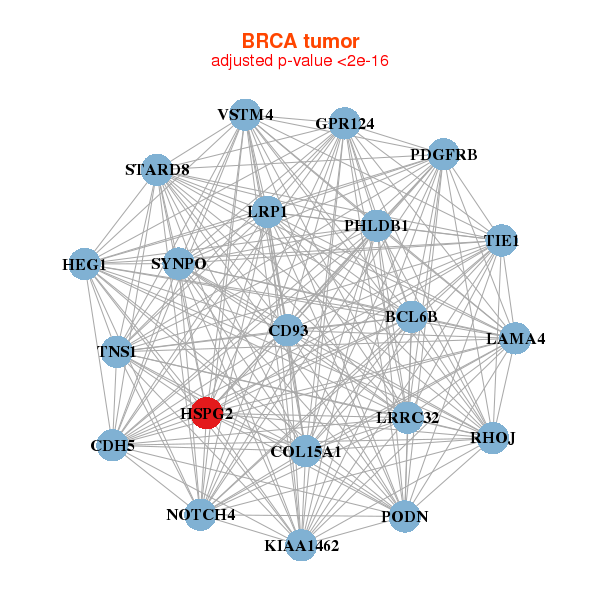
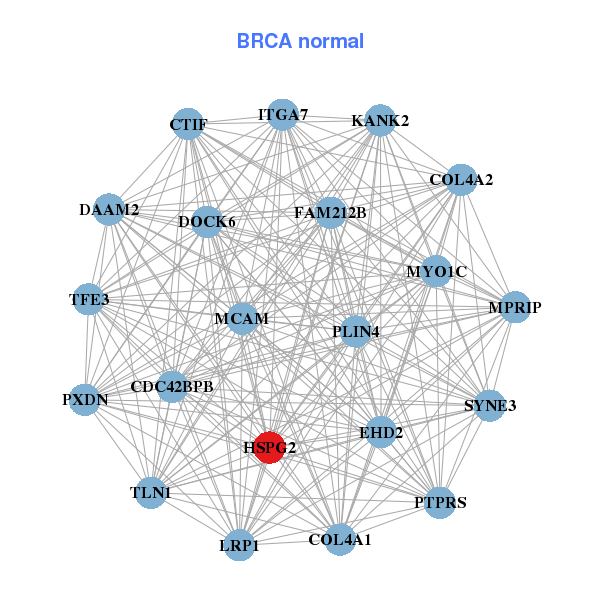
| * Co-Expression network figures were drawn using R package igraph. Only the top 20 genes with the highest correlations were shown. Red circle: input gene, orange circle: cell metabolism gene, sky circle: other gene |
: Open all plots for all cancer types
 |
|
| BCL6B,VSTM4,CD93,CDH5,COL15A1,GPR124,HEG1, HSPG2,KIAA1462,LAMA4,LRP1,LRRC32,NOTCH4,PDGFRB, PHLDB1,PODN,RHOJ,STARD8,SYNPO,TIE1,TNS1 | SYNE3,FAM212B,CDC42BPB,COL4A1,COL4A2,DAAM2,DOCK6, EHD2,HSPG2,ITGA7,KANK2,CTIF,LRP1,MCAM, MPRIP,MYO1C,PLIN4,PTPRS,PXDN,TFE3,TLN1 |
 |
|
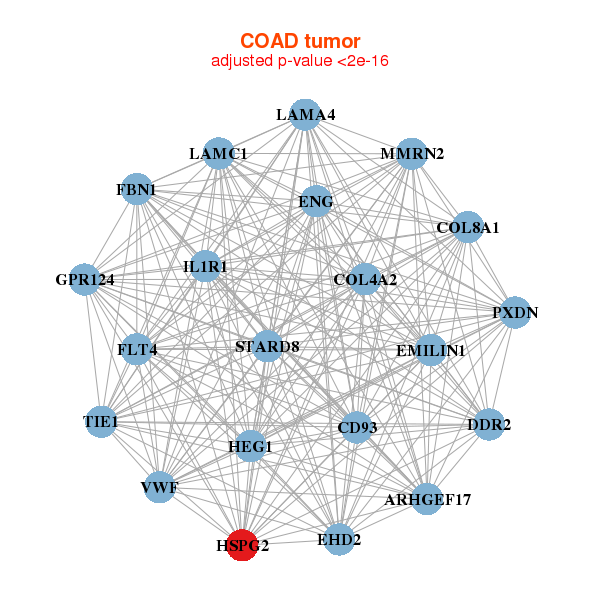
| ARHGEF17,CD93,COL4A2,COL8A1,DDR2,EHD2,EMILIN1, ENG,FBN1,FLT4,GPR124,HEG1,HSPG2,IL1R1, LAMA4,LAMC1,MMRN2,PXDN,STARD8,TIE1,VWF | AHDC1,AHNAK2,AR,CNTNAP1,COL15A1,COL4A1,COL4A2, DCHS1,FLNA,GLI2,HSPG2,IGSF9B,LDLRAD2,MAP1A, MICALL1,NACC2,NID1,PXDN,SETBP1,TLN1,VCL |
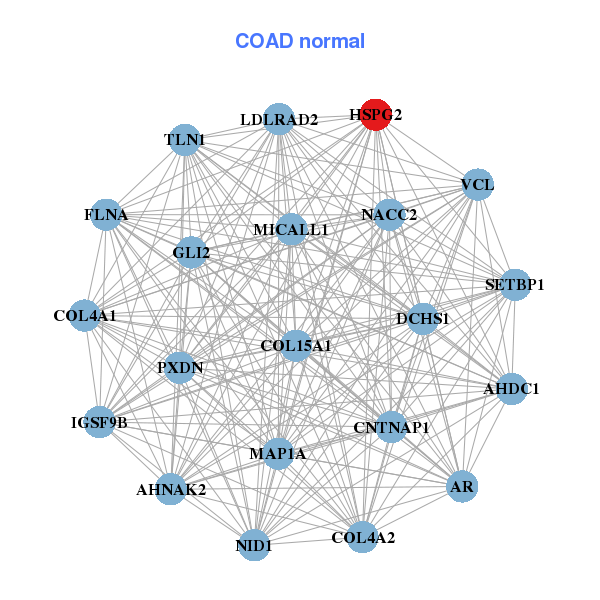
| * Co-Expression network figures were drawn using R package igraph. Only the top 20 genes with the highest correlations were shown. Red circle: input gene, orange circle: cell metabolism gene, sky circle: other gene |
: Open all plots for all cancer types
| Top |
: Open all interacting genes' information including KEGG pathway for all interacting genes from DAVID
| Top |
| Pharmacological Information for HSPG2 |
| There's no related Drug. |
| Top |
| Cross referenced IDs for HSPG2 |
| * We obtained these cross-references from Uniprot database. It covers 150 different DBs, 18 categories. http://www.uniprot.org/help/cross_references_section |
: Open all cross reference information
|
Copyright © 2016-Present - The Univsersity of Texas Health Science Center at Houston @ |