|
||||||||||||||||||||
| |
| Phenotypic Information (metabolism pathway, cancer, disease, phenome) |
| |
| |
| Gene-Gene Network Information: Co-Expression Network, Interacting Genes & KEGG |
| |
|


| Gene Summary for APOA1 |
| Basic gene info. | Gene symbol | APOA1 |
| Gene name | apolipoprotein A-I | |
| Synonyms | - | |
| Cytomap | UCSC genome browser: 11q23-q24 | |
| Genomic location | chr11 :116706468-116708338 | |
| Type of gene | protein-coding | |
| RefGenes | NM_000039.1, | |
| Ensembl id | ENSG00000118137 | |
| Description | apo-AI | |
| Modification date | 20141222 | |
| dbXrefs | MIM : 107680 | |
| HGNC : HGNC | ||
| Ensembl : ENSG00000118137 | ||
| HPRD : 02517 | ||
| Vega : OTTHUMG00000046112 | ||
| Protein | UniProt: P02647 go to UniProt's Cross Reference DB Table | |
| Expression | CleanEX: HS_APOA1 | |
| BioGPS: 335 | ||
| Gene Expression Atlas: ENSG00000118137 | ||
| The Human Protein Atlas: ENSG00000118137 | ||
| Pathway | NCI Pathway Interaction Database: APOA1 | |
| KEGG: APOA1 | ||
| REACTOME: APOA1 | ||
| ConsensusPathDB | ||
| Pathway Commons: APOA1 | ||
| Metabolism | MetaCyc: APOA1 | |
| HUMANCyc: APOA1 | ||
| Regulation | Ensembl's Regulation: ENSG00000118137 | |
| miRBase: chr11 :116,706,468-116,708,338 | ||
| TargetScan: NM_000039 | ||
| cisRED: ENSG00000118137 | ||
| Context | iHOP: APOA1 | |
| cancer metabolism search in PubMed: APOA1 | ||
| UCL Cancer Institute: APOA1 | ||
| Assigned class in ccmGDB | A - This gene has a literature evidence and it belongs to cancer gene. | |
| References showing role of APOA1 in cancer cell metabolism | 1. Guo X, Hao Y, Kamilijiang M, Hasimu A, Yuan J, et al. (2015) Potential predictive plasma biomarkers for cervical cancer by 2D-DIGE proteomics and Ingenuity Pathway Analysis. Tumour Biol 36: 1711-1720. doi: 10.1007/s13277-014-2772-5. go to article | |
| Top |
| Phenotypic Information for APOA1(metabolism pathway, cancer, disease, phenome) |
| Cancer | CGAP: APOA1 |
| Familial Cancer Database: APOA1 | |
| * This gene is included in those cancer gene databases. |
|
|
|
|
|
|
| ||||||||||||||
Oncogene 1 | Significant driver gene in | |||||||||||||||||||
| cf) number; DB name 1 Oncogene; http://nar.oxfordjournals.org/content/35/suppl_1/D721.long, 2 Tumor Suppressor gene; https://bioinfo.uth.edu/TSGene/, 3 Cancer Gene Census; http://www.nature.com/nrc/journal/v4/n3/abs/nrc1299.html, 4 CancerGenes; http://nar.oxfordjournals.org/content/35/suppl_1/D721.long, 5 Network of Cancer Gene; http://ncg.kcl.ac.uk/index.php, 1Therapeutic Vulnerabilities in Cancer; http://cbio.mskcc.org/cancergenomics/statius/ |
| REACTOME_METABOLISM_OF_LIPIDS_AND_LIPOPROTEINS REACTOME_LIPOPROTEIN_METABOLISM | |
| OMIM | 105200; phenotype. 107680; gene+phenotype. 205400; phenotype. 604091; phenotype. |
| Orphanet | 314701; Primary systemic amyloidosis. 425; Apolipoprotein A-I deficiency. 93560; Familial renal amyloidosis due to Apolipoprotein AI variant. |
| Disease | KEGG Disease: APOA1 |
| MedGen: APOA1 (Human Medical Genetics with Condition) | |
| ClinVar: APOA1 | |
| Phenotype | MGI: APOA1 (International Mouse Phenotyping Consortium) |
| PhenomicDB: APOA1 | |
| Mutations for APOA1 |
| * Under tables are showing count per each tissue to give us broad intuition about tissue specific mutation patterns.You can go to the detailed page for each mutation database's web site. |
| There's no structural variation information in COSMIC data for this gene. |
| * From mRNA Sanger sequences, Chitars2.0 arranged chimeric transcripts. This table shows APOA1 related fusion information. |
| ID | Head Gene | Tail Gene | Accession | Gene_a | qStart_a | qEnd_a | Chromosome_a | tStart_a | tEnd_a | Gene_a | qStart_a | qEnd_a | Chromosome_a | tStart_a | tEnd_a |
| BJ995037 | APOA1 | 1 | 351 | 11 | 116707015 | 116708338 | DRAP1 | 344 | 438 | 11 | 65686958 | 65687288 | |
| Top |
| There's no copy number variation information in COSMIC data for this gene. |
| Top |
|
 |
| Top |
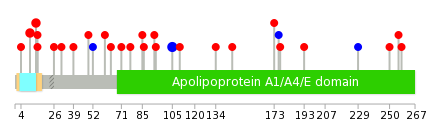
| Stat. for Non-Synonymous SNVs (# total SNVs=17) | (# total SNVs=1) |
 |  |
(# total SNVs=2) | (# total SNVs=0) |
 |
| Top |
| * When you move the cursor on each content, you can see more deailed mutation information on the Tooltip. Those are primary_site,primary_histology,mutation(aa),pubmedID. |
| GRCh37 position | Mutation(aa) | Unique sampleID count |
| chr11:116707013-116707013 | p.G105G | 3 |
| chr11:116708063-116708063 | p.T14M | 2 |
| chr11:116708076-116708076 | p.V10M | 2 |
| chr11:116707832-116707832 | p.Q29fs*7 | 2 |
| chr11:116708061-116708061 | p.G15W | 1 |
| chr11:116706810-116706810 | p.R173H | 1 |
| chr11:116707727-116707727 | p.K64E | 1 |
| chr11:116706895-116706895 | p.P145A | 1 |
| chr11:116707738-116707738 | p.S60F | 1 |
| chr11:116706927-116706927 | p.E134A | 1 |
| Top |
|
 |
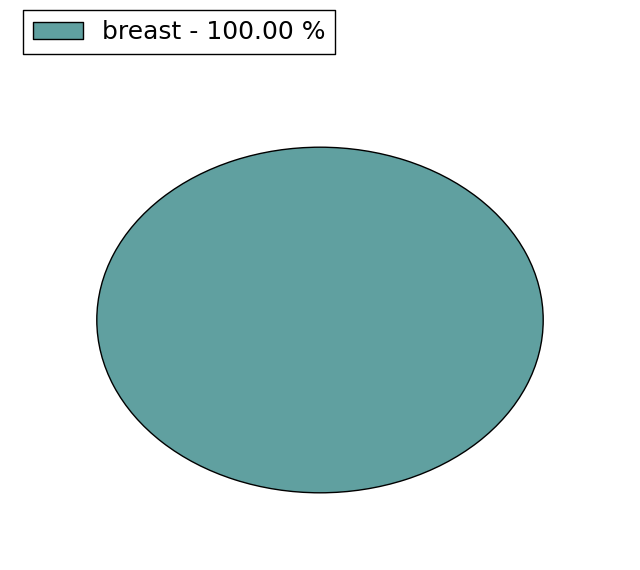
| Point Mutation/ Tissue ID | 1 | 2 | 3 | 4 | 5 | 6 | 7 | 8 | 9 | 10 | 11 | 12 | 13 | 14 | 15 | 16 | 17 | 18 | 19 | 20 |
| # sample | 1 | 1 | 3 | 3 | 6 | 2 | ||||||||||||||
| # mutation | 1 | 1 | 4 | 3 | 6 | 2 | ||||||||||||||
| nonsynonymous SNV | 1 | 3 | 2 | 6 | 2 | |||||||||||||||
| synonymous SNV | 1 | 1 | 1 |
| cf) Tissue ID; Tissue type (1; BLCA[Bladder Urothelial Carcinoma], 2; BRCA[Breast invasive carcinoma], 3; CESC[Cervical squamous cell carcinoma and endocervical adenocarcinoma], 4; COAD[Colon adenocarcinoma], 5; GBM[Glioblastoma multiforme], 6; Glioma Low Grade, 7; HNSC[Head and Neck squamous cell carcinoma], 8; KICH[Kidney Chromophobe], 9; KIRC[Kidney renal clear cell carcinoma], 10; KIRP[Kidney renal papillary cell carcinoma], 11; LAML[Acute Myeloid Leukemia], 12; LUAD[Lung adenocarcinoma], 13; LUSC[Lung squamous cell carcinoma], 14; OV[Ovarian serous cystadenocarcinoma ], 15; PAAD[Pancreatic adenocarcinoma], 16; PRAD[Prostate adenocarcinoma], 17; SKCM[Skin Cutaneous Melanoma], 18:STAD[Stomach adenocarcinoma], 19:THCA[Thyroid carcinoma], 20:UCEC[Uterine Corpus Endometrial Carcinoma]) |
| Top |
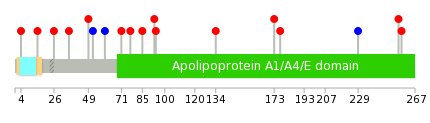
| * We represented just top 10 SNVs. When you move the cursor on each content, you can see more deailed mutation information on the Tooltip. Those are primary_site, primary_histology, mutation(aa), pubmedID. |
| Genomic Position | Mutation(aa) | Unique sampleID count |
| chr11:116707050 | p.R85L | 1 |
| chr11:116707074 | p.V77A | 1 |
| chr11:116707098 | p.L71I | 1 |
| chr11:116707117 | p.S60S | 1 |
| chr11:116706556 | p.D52D | 1 |
| chr11:116707737 | p.S49N | 1 |
| chr11:116706562 | p.K36N | 1 |
| chr11:116707761 | p.E26K | 1 |
| chr11:116706641 | p.E258Q | 1 |
| chr11:116707771 | p.G15V | 1 |
| * Copy number data were extracted from TCGA using R package TCGA-Assembler. The URLs of all public data files on TCGA DCC data server were gathered on Jan-05-2015. Function ProcessCNAData in TCGA-Assembler package was used to obtain gene-level copy number value which is calculated as the average copy number of the genomic region of a gene. |
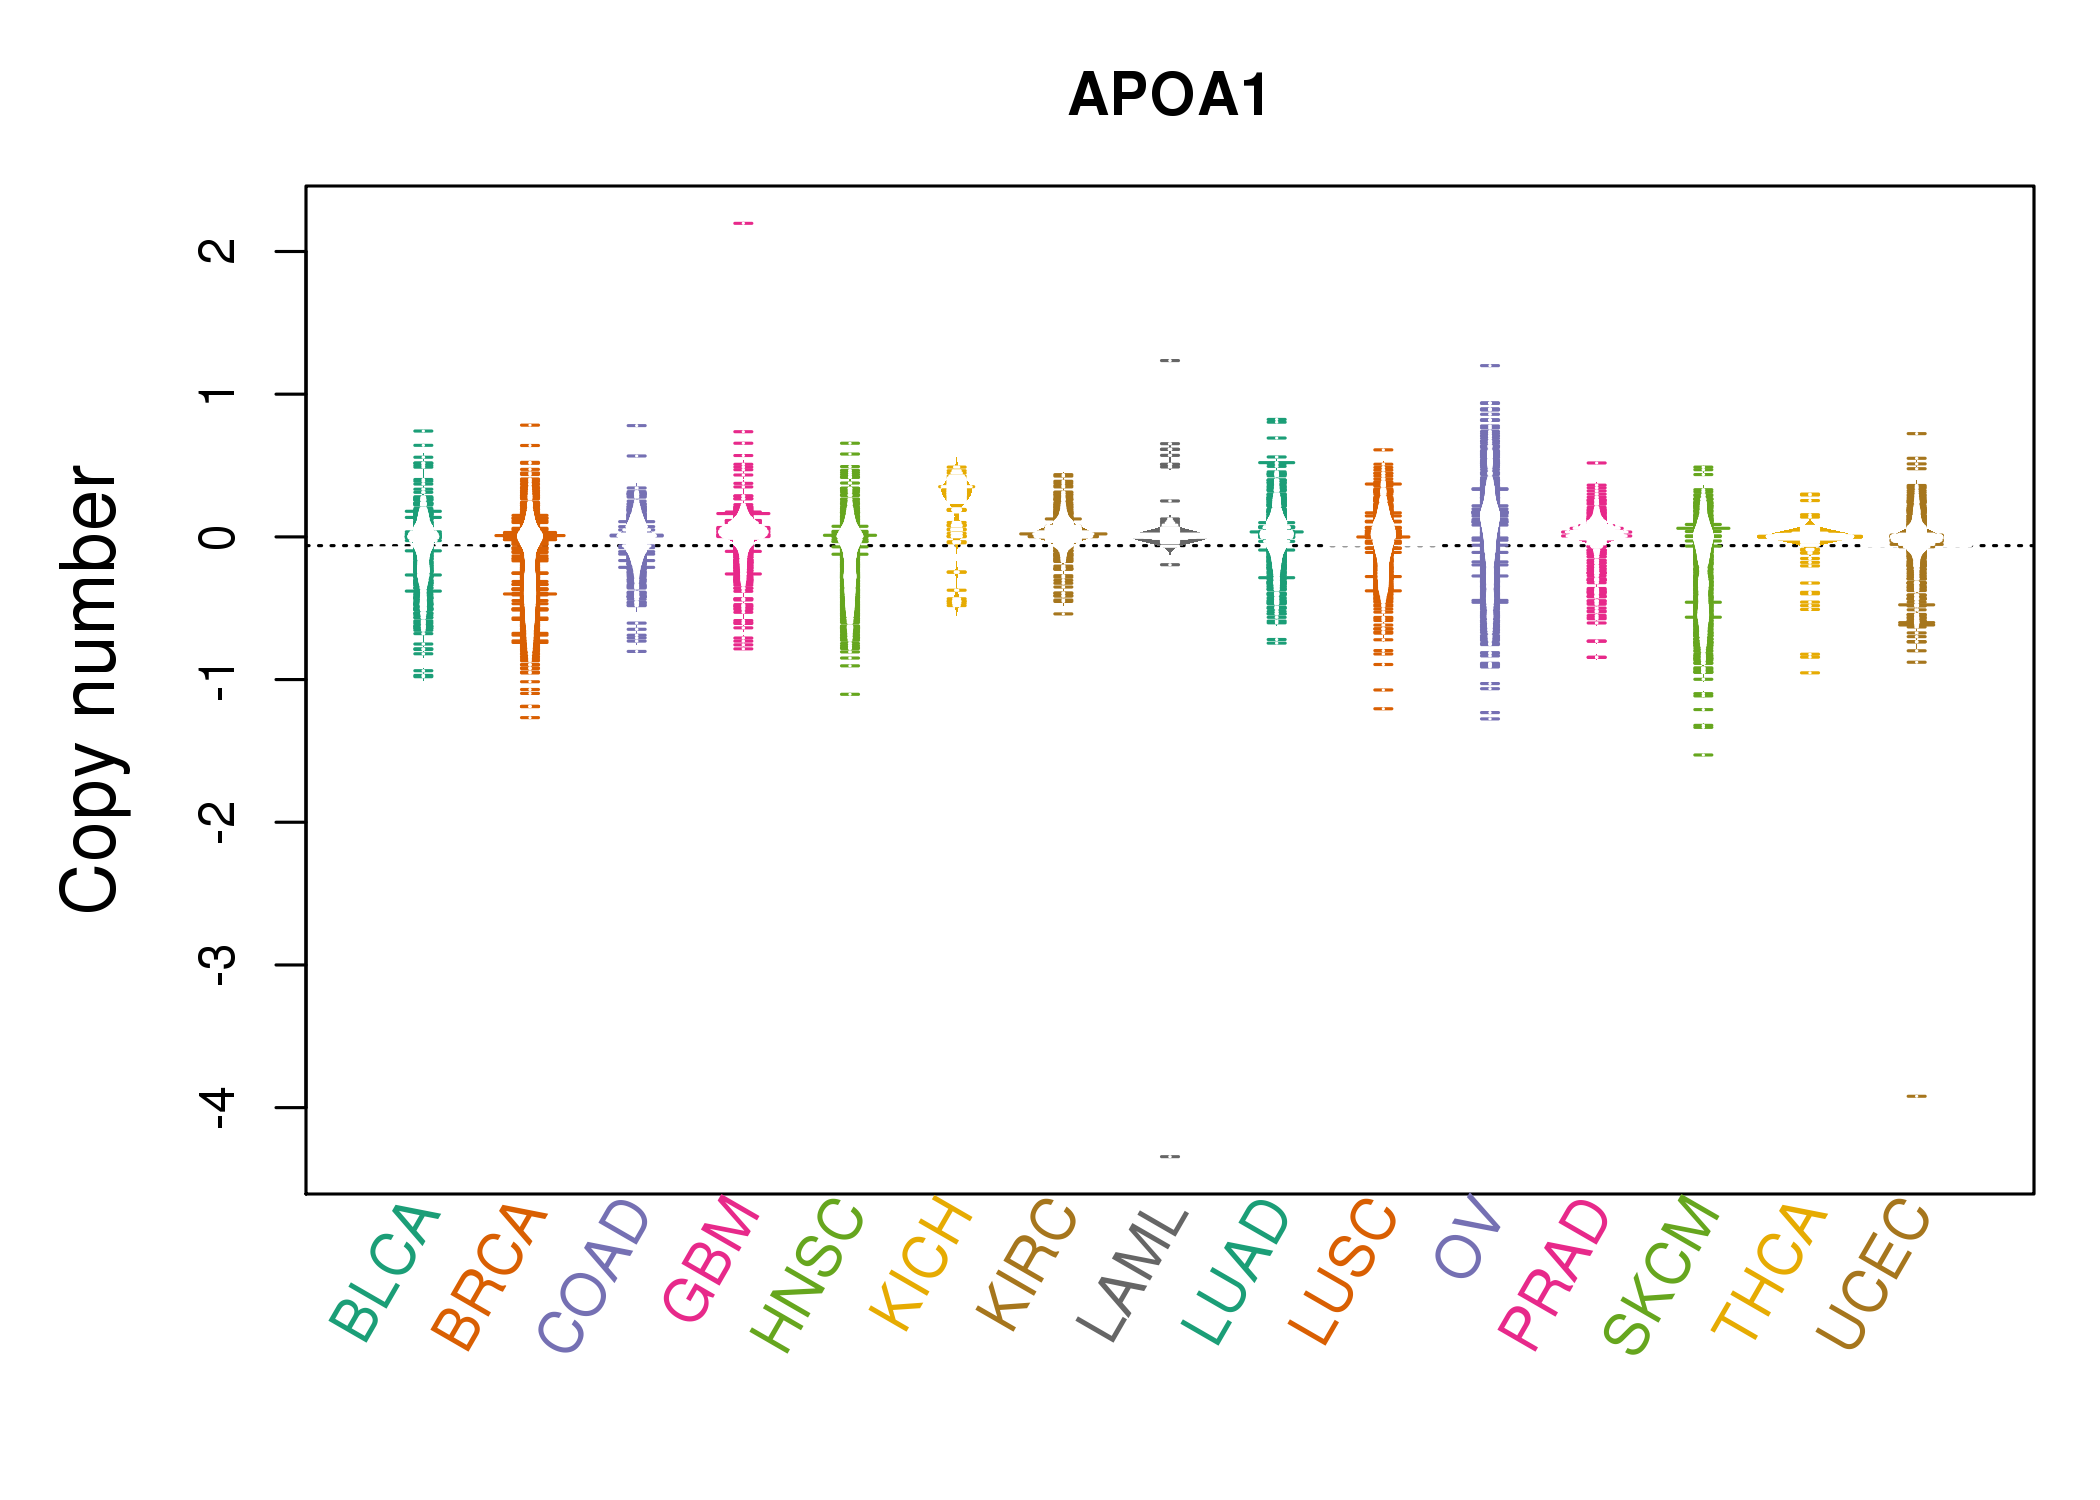 |
| cf) Tissue ID[Tissue type]: BLCA[Bladder Urothelial Carcinoma], BRCA[Breast invasive carcinoma], CESC[Cervical squamous cell carcinoma and endocervical adenocarcinoma], COAD[Colon adenocarcinoma], GBM[Glioblastoma multiforme], Glioma Low Grade, HNSC[Head and Neck squamous cell carcinoma], KICH[Kidney Chromophobe], KIRC[Kidney renal clear cell carcinoma], KIRP[Kidney renal papillary cell carcinoma], LAML[Acute Myeloid Leukemia], LUAD[Lung adenocarcinoma], LUSC[Lung squamous cell carcinoma], OV[Ovarian serous cystadenocarcinoma ], PAAD[Pancreatic adenocarcinoma], PRAD[Prostate adenocarcinoma], SKCM[Skin Cutaneous Melanoma], STAD[Stomach adenocarcinoma], THCA[Thyroid carcinoma], UCEC[Uterine Corpus Endometrial Carcinoma] |
| Top |
| Gene Expression for APOA1 |
| * CCLE gene expression data were extracted from CCLE_Expression_Entrez_2012-10-18.res: Gene-centric RMA-normalized mRNA expression data. |
 |
| * Normalized gene expression data of RNASeqV2 was extracted from TCGA using R package TCGA-Assembler. The URLs of all public data files on TCGA DCC data server were gathered at Jan-05-2015. Only eight cancer types have enough normal control samples for differential expression analysis. (t test, adjusted p<0.05 (using Benjamini-Hochberg FDR)) |
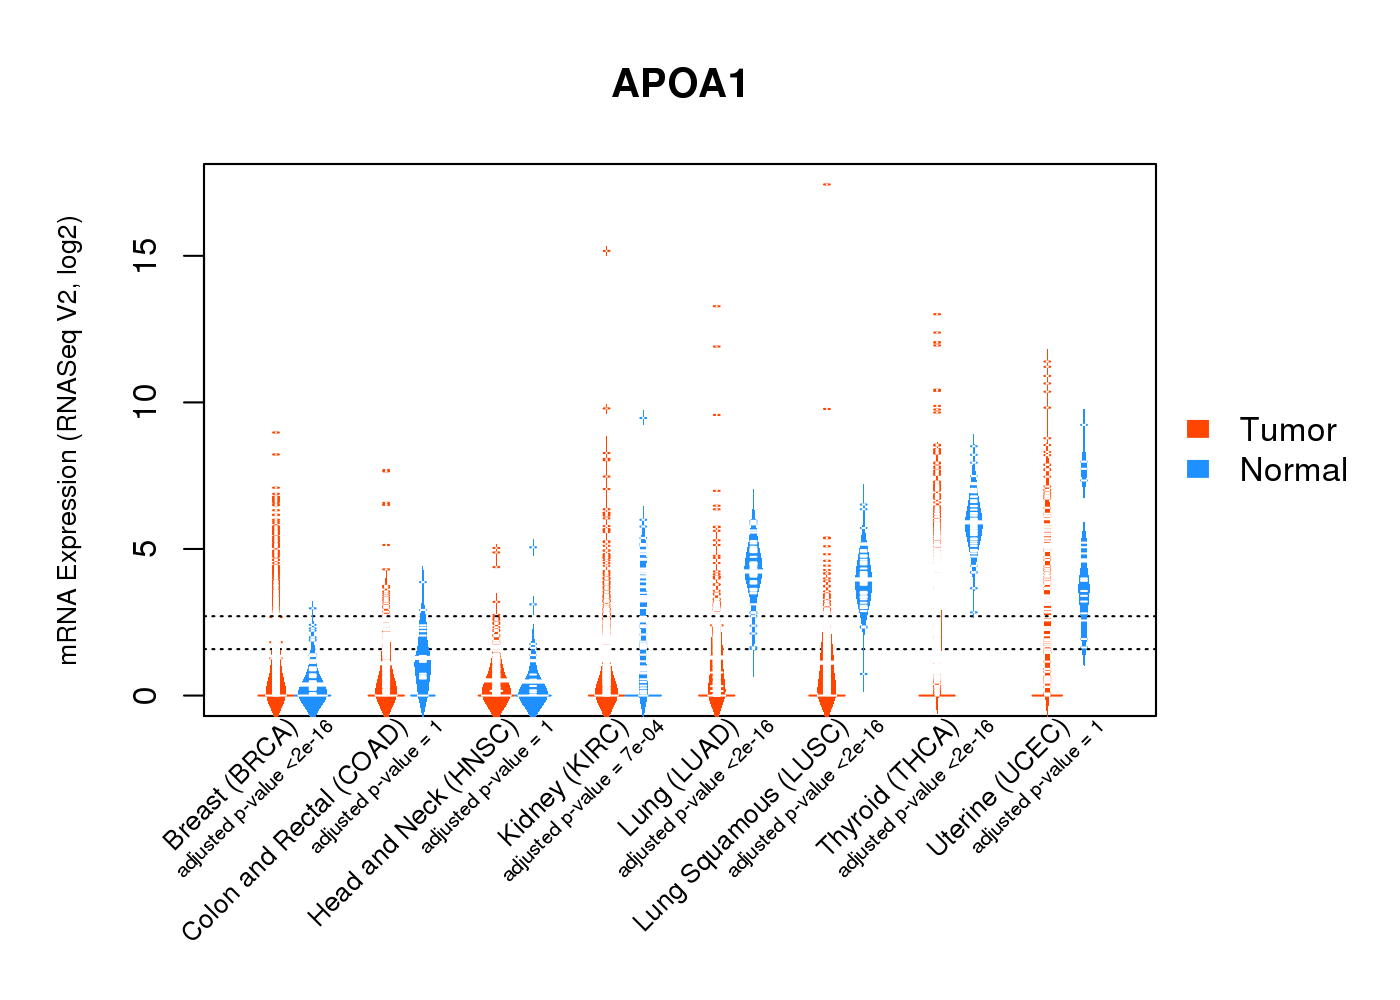 |
| Top |
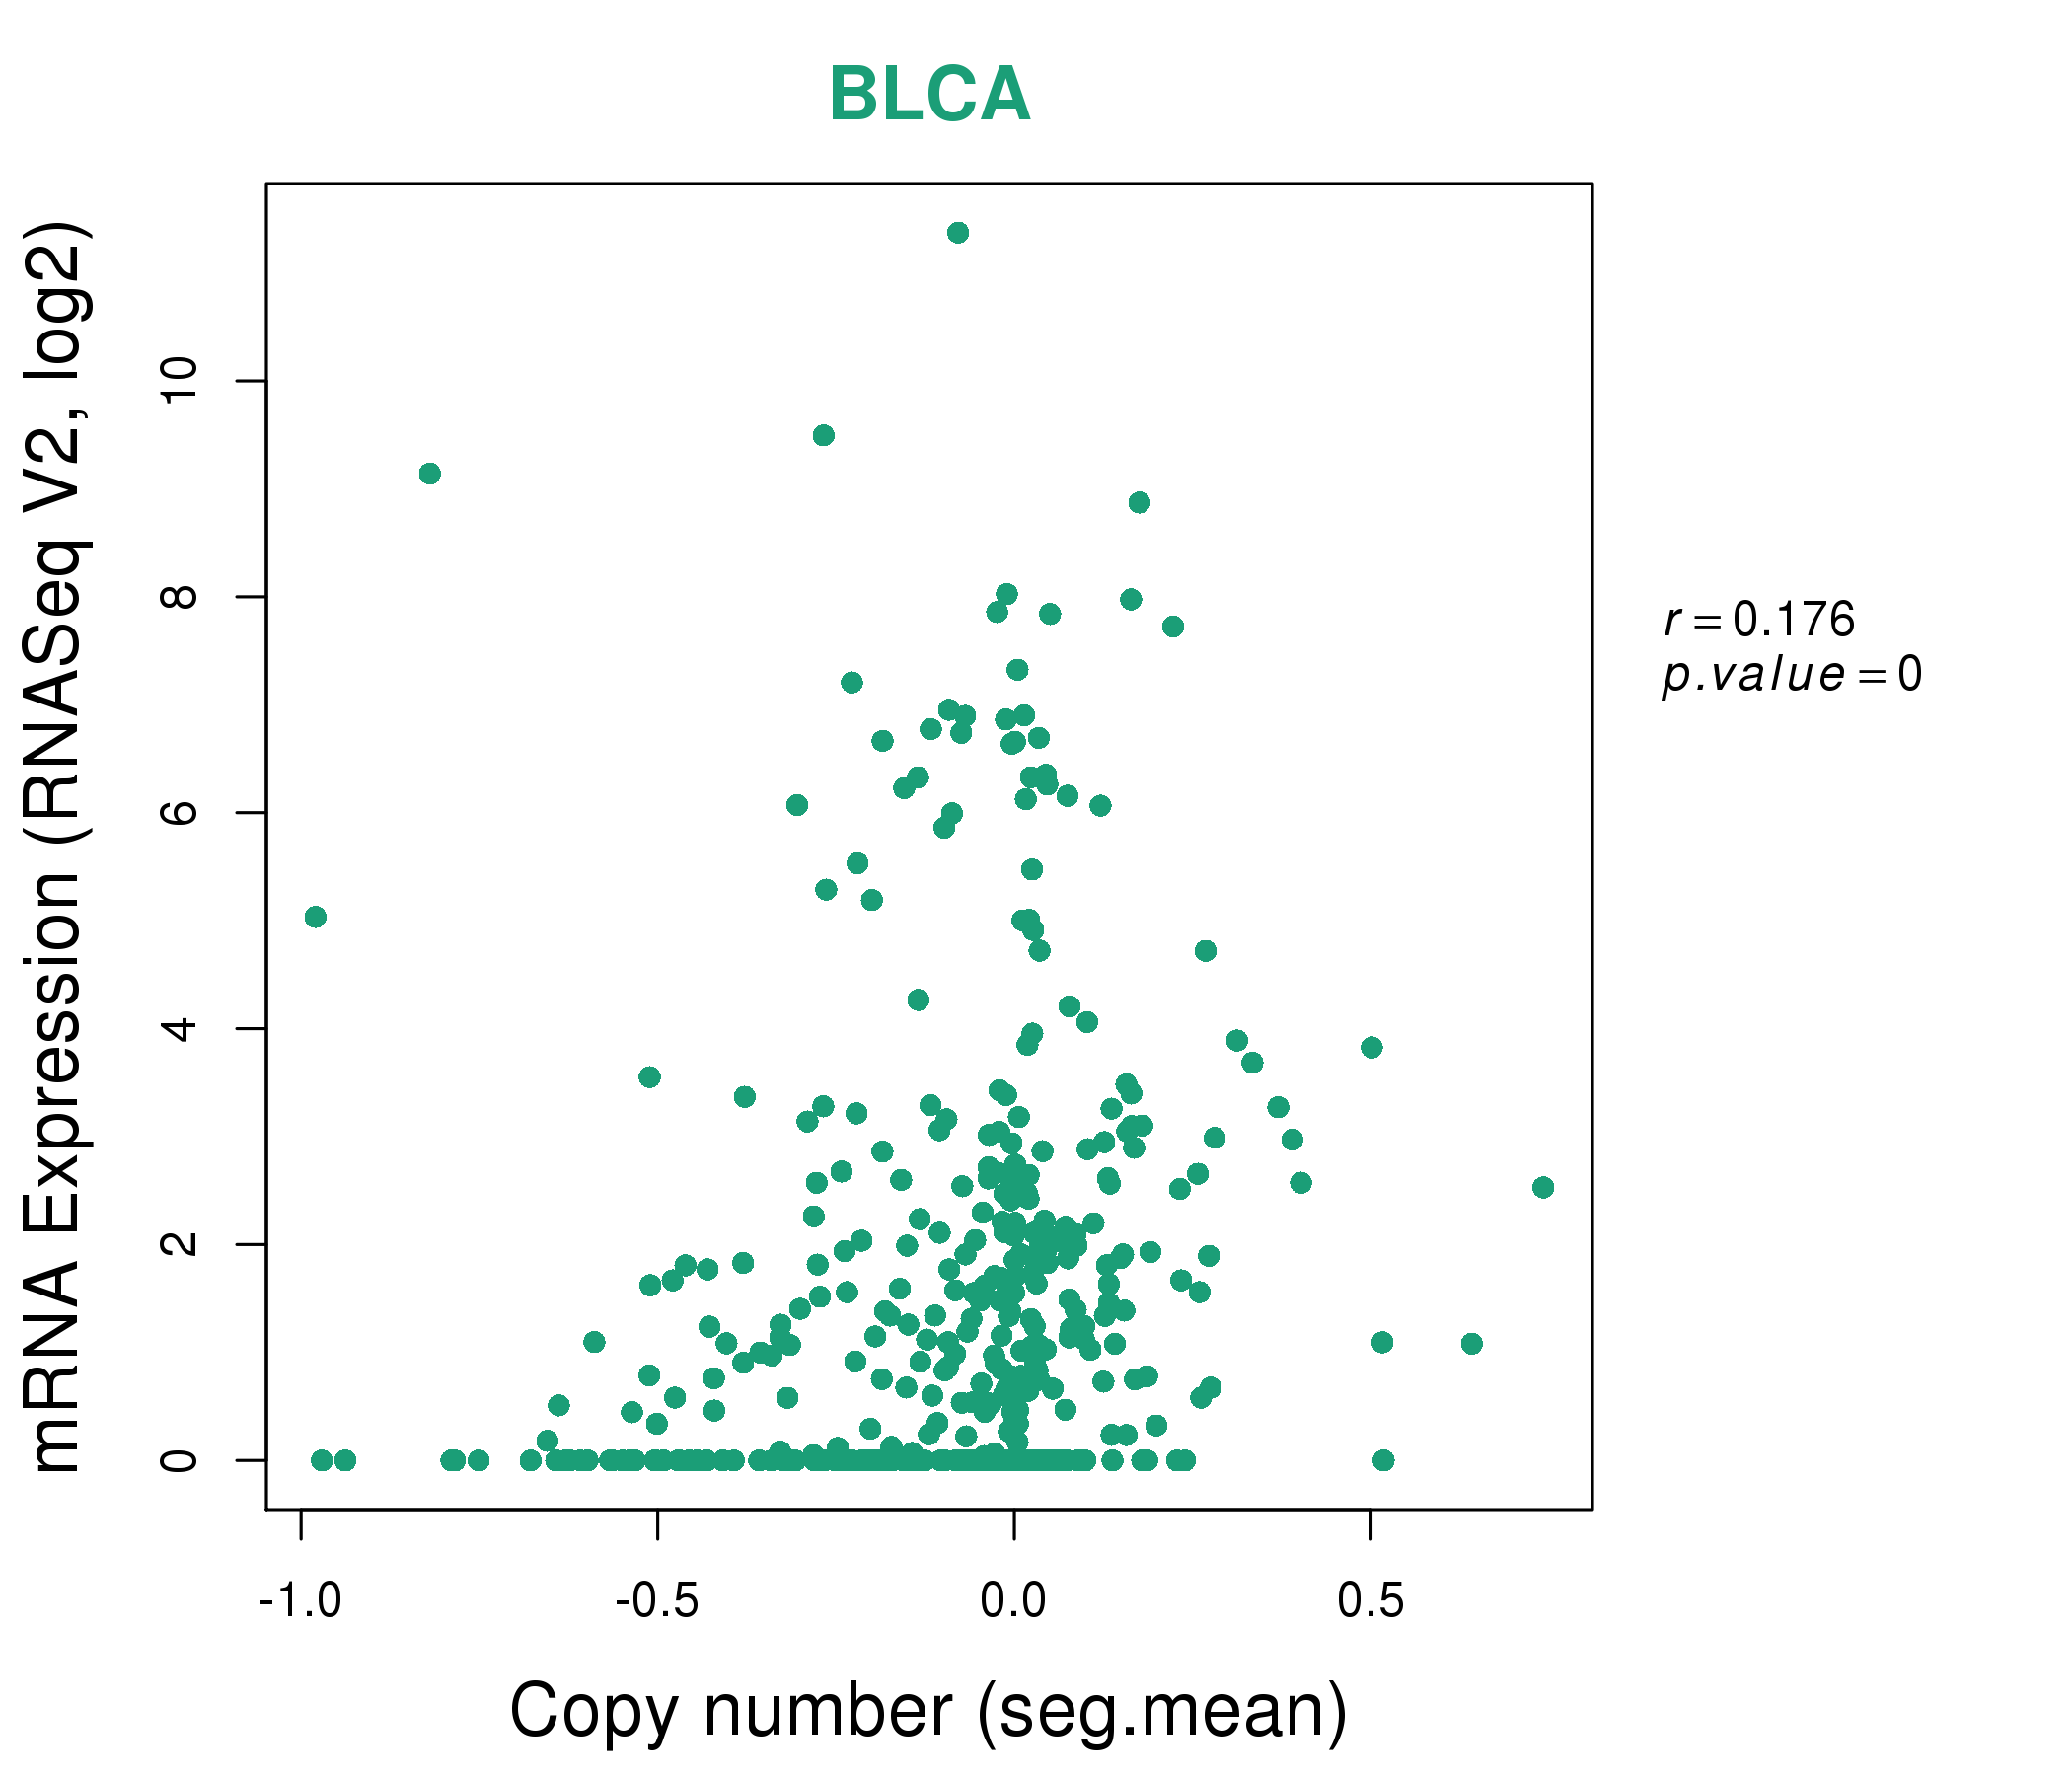
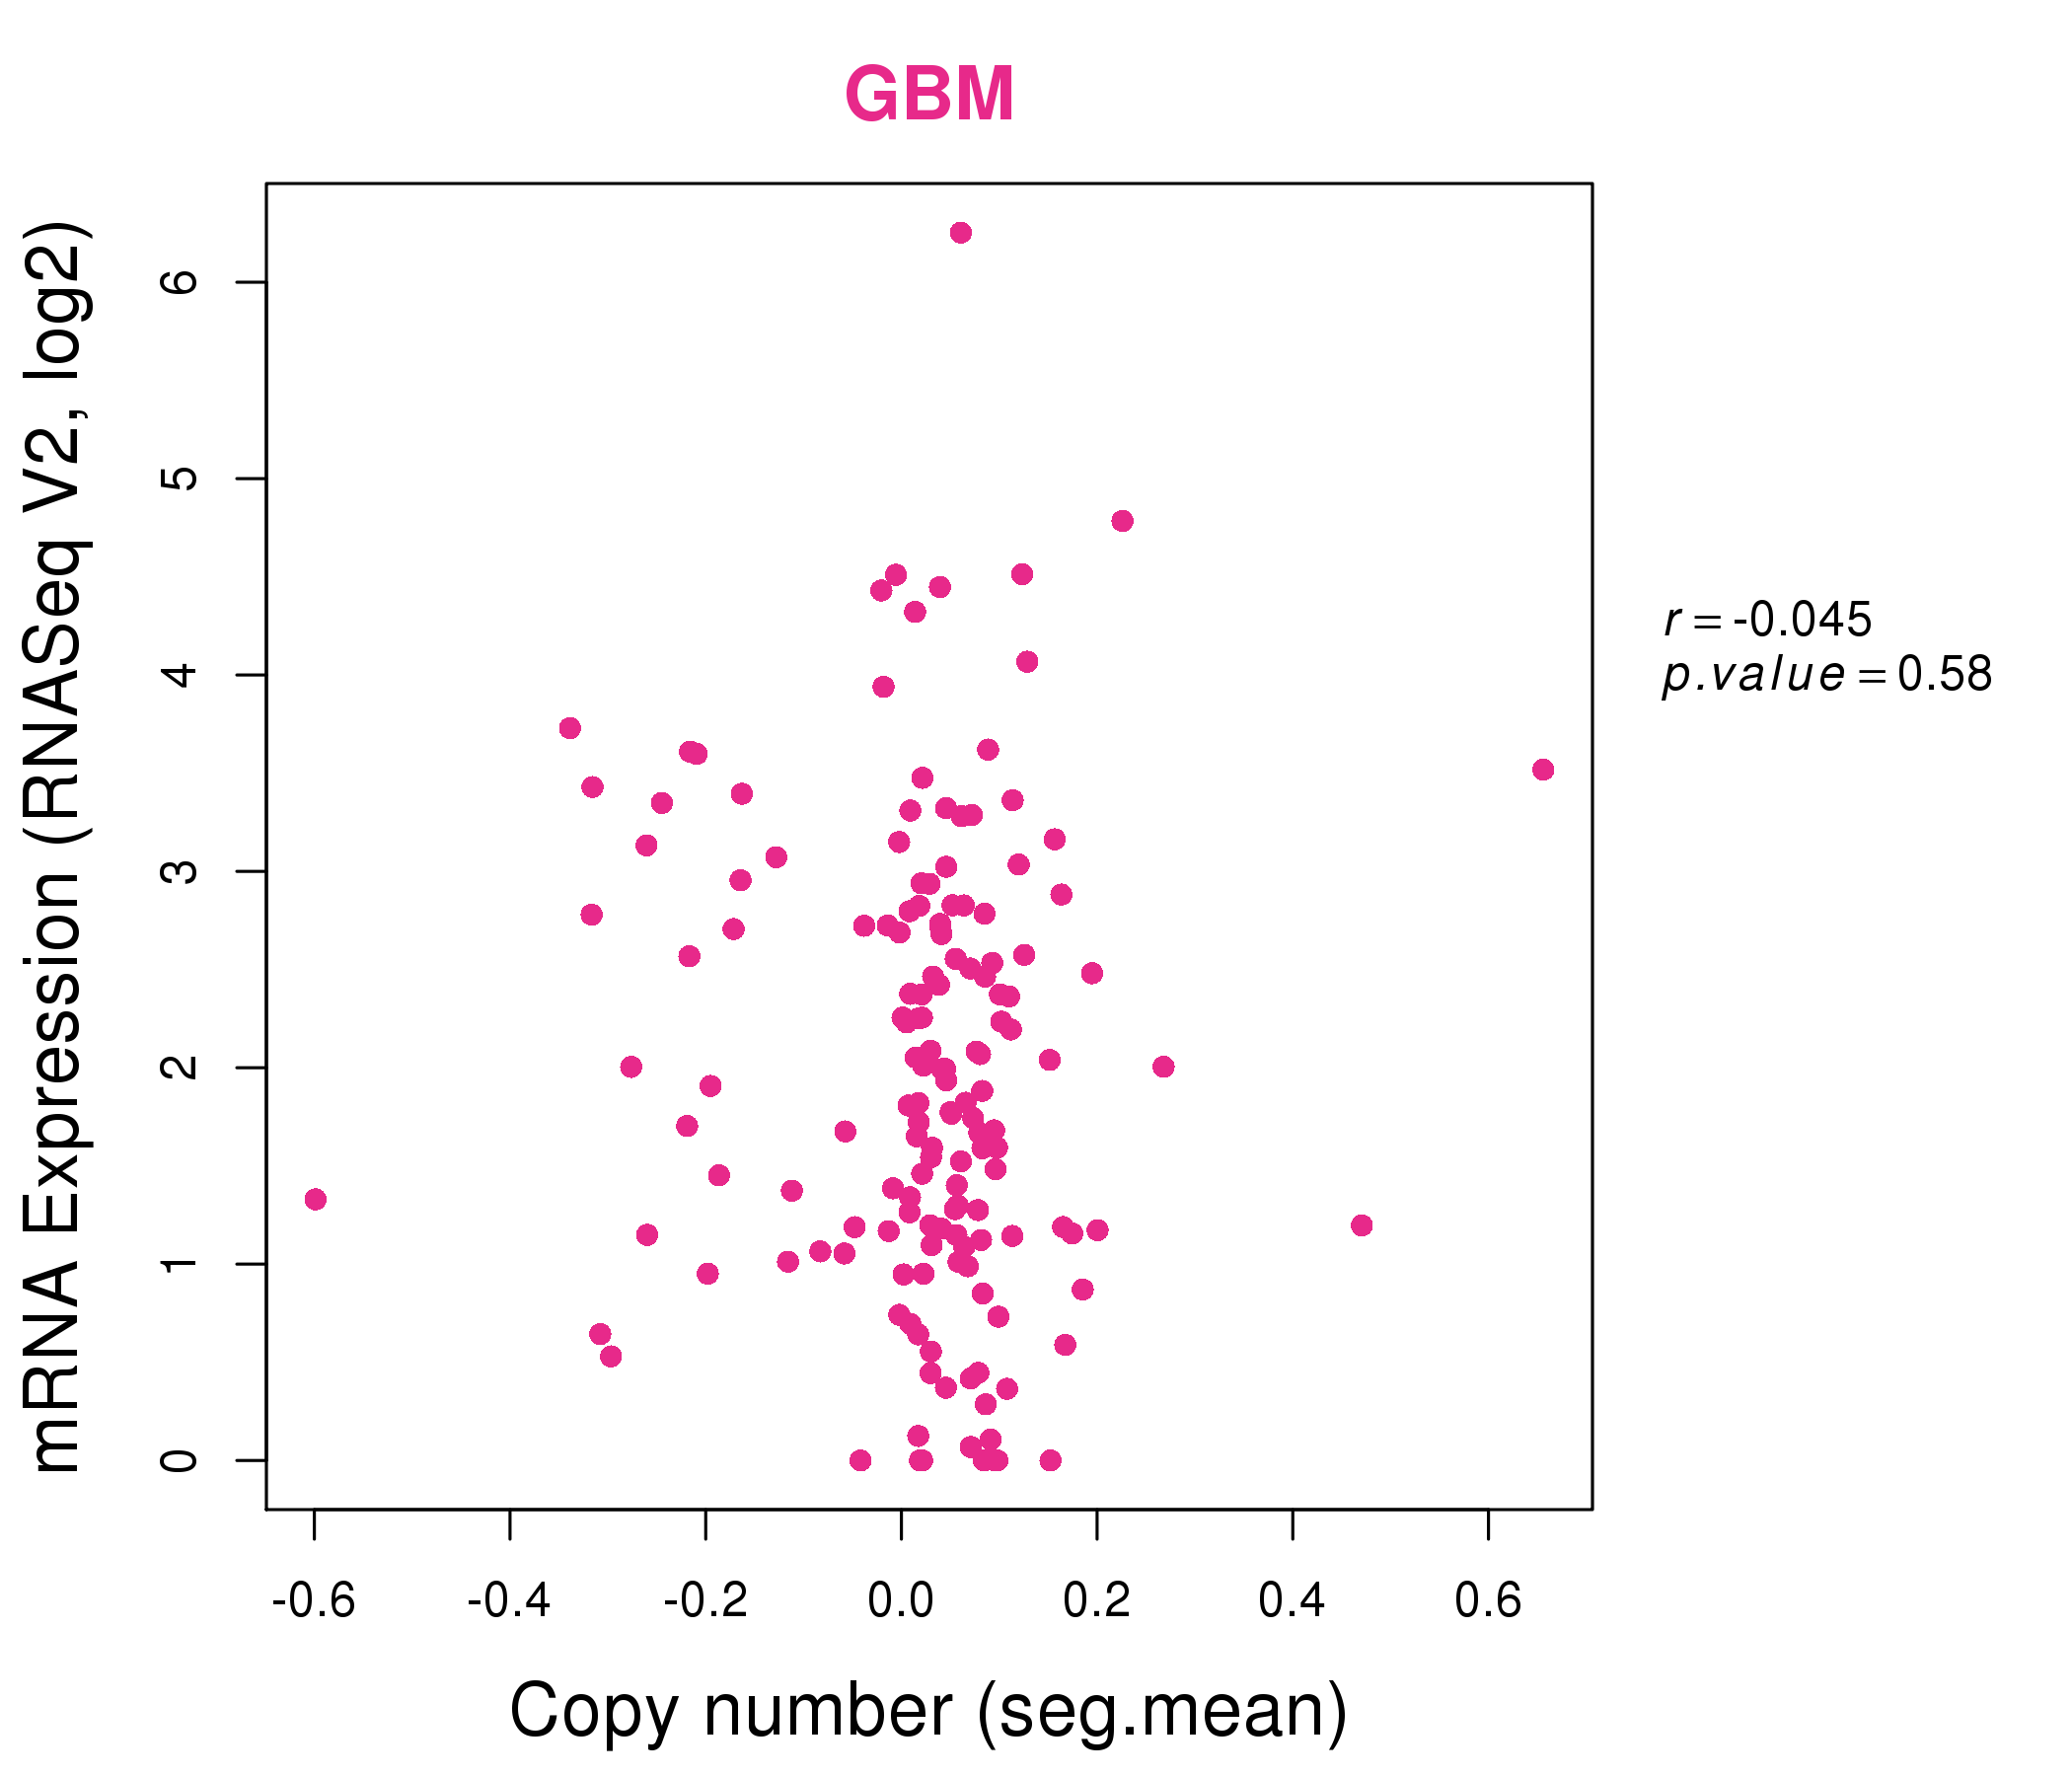
| * This plots show the correlation between CNV and gene expression. |
: Open all plots for all cancer types
 |
|
 |
|

| Top |
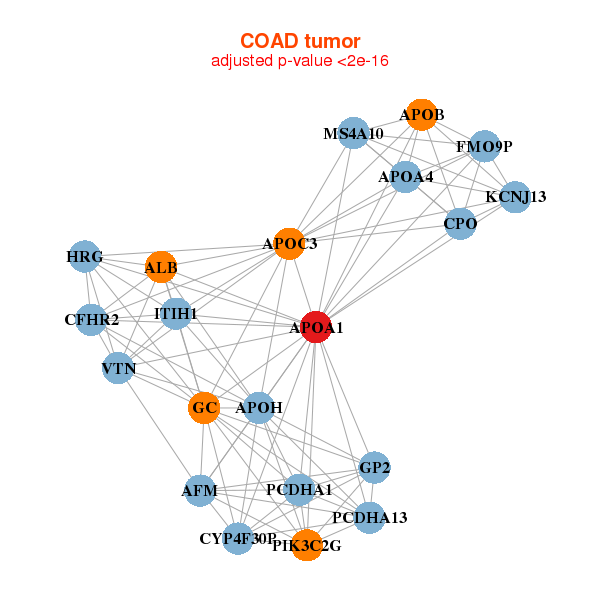
| Gene-Gene Network Information |
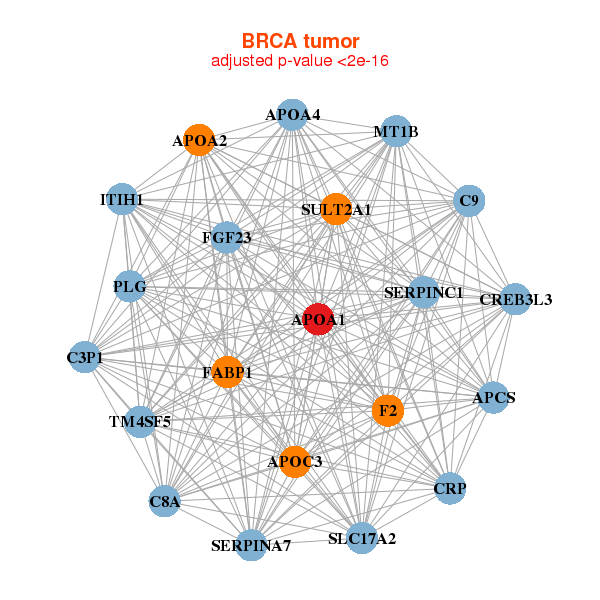
| * Co-Expression network figures were drawn using R package igraph. Only the top 20 genes with the highest correlations were shown. Red circle: input gene, orange circle: cell metabolism gene, sky circle: other gene |
: Open all plots for all cancer types
 |
| ||||
| APCS,APOA1,APOA2,APOA4,APOC3,C3P1,C8A, C9,CREB3L3,CRP,F2,FABP1,FGF23,ITIH1, MT1B,PLG,SERPINA7,SERPINC1,SLC17A2,SULT2A1,TM4SF5 | AP2S1,APOA1,ARPC5L,LBHD1___C11orf98,MIEN1,CFL1,CHCHD1, HM13,LENG9,MRPL17,MRPL27,MYEOV2,NR2F6,PPP1CA, PPP4C,PSMC4,REEP4,SAMD1,TMEM8A,TXNL4A,YIF1B | ||||
 |
| ||||
| AFM,ALB,APOA1,APOA4,APOB,APOC3,APOH, CYP4F30P,CFHR2,CPO,FMO9P,GC,GP2,HRG, ITIH1,KCNJ13,MS4A10,PCDHA13,PCDHA1,PIK3C2G,VTN | AADAC,APOA1,APOA4,APOB,APOC3,C17orf78,CPO, CRISP1,FAM99A,FAM99B,GSTA5,KCNJ13,LCE3E,LOC388428, MOS,ONECUT3,OR10H1,OR10H5,OR4N5,PWAR4___F2RL3___PAWR,SPANXN3 |


| * Co-Expression network figures were drawn using R package igraph. Only the top 20 genes with the highest correlations were shown. Red circle: input gene, orange circle: cell metabolism gene, sky circle: other gene |
: Open all plots for all cancer types
| Top |
: Open all interacting genes' information including KEGG pathway for all interacting genes from DAVID
| Top |
| Pharmacological Information for APOA1 |
| DB Category | DB Name | DB's ID and Url link |
| Chemistry | ChEMBL | CHEMBL5984; -. |
| Organism-specific databases | PharmGKB | PA49; -. |
| Organism-specific databases | CTD | 335; -. |
| * Gene Centered Interaction Network. |
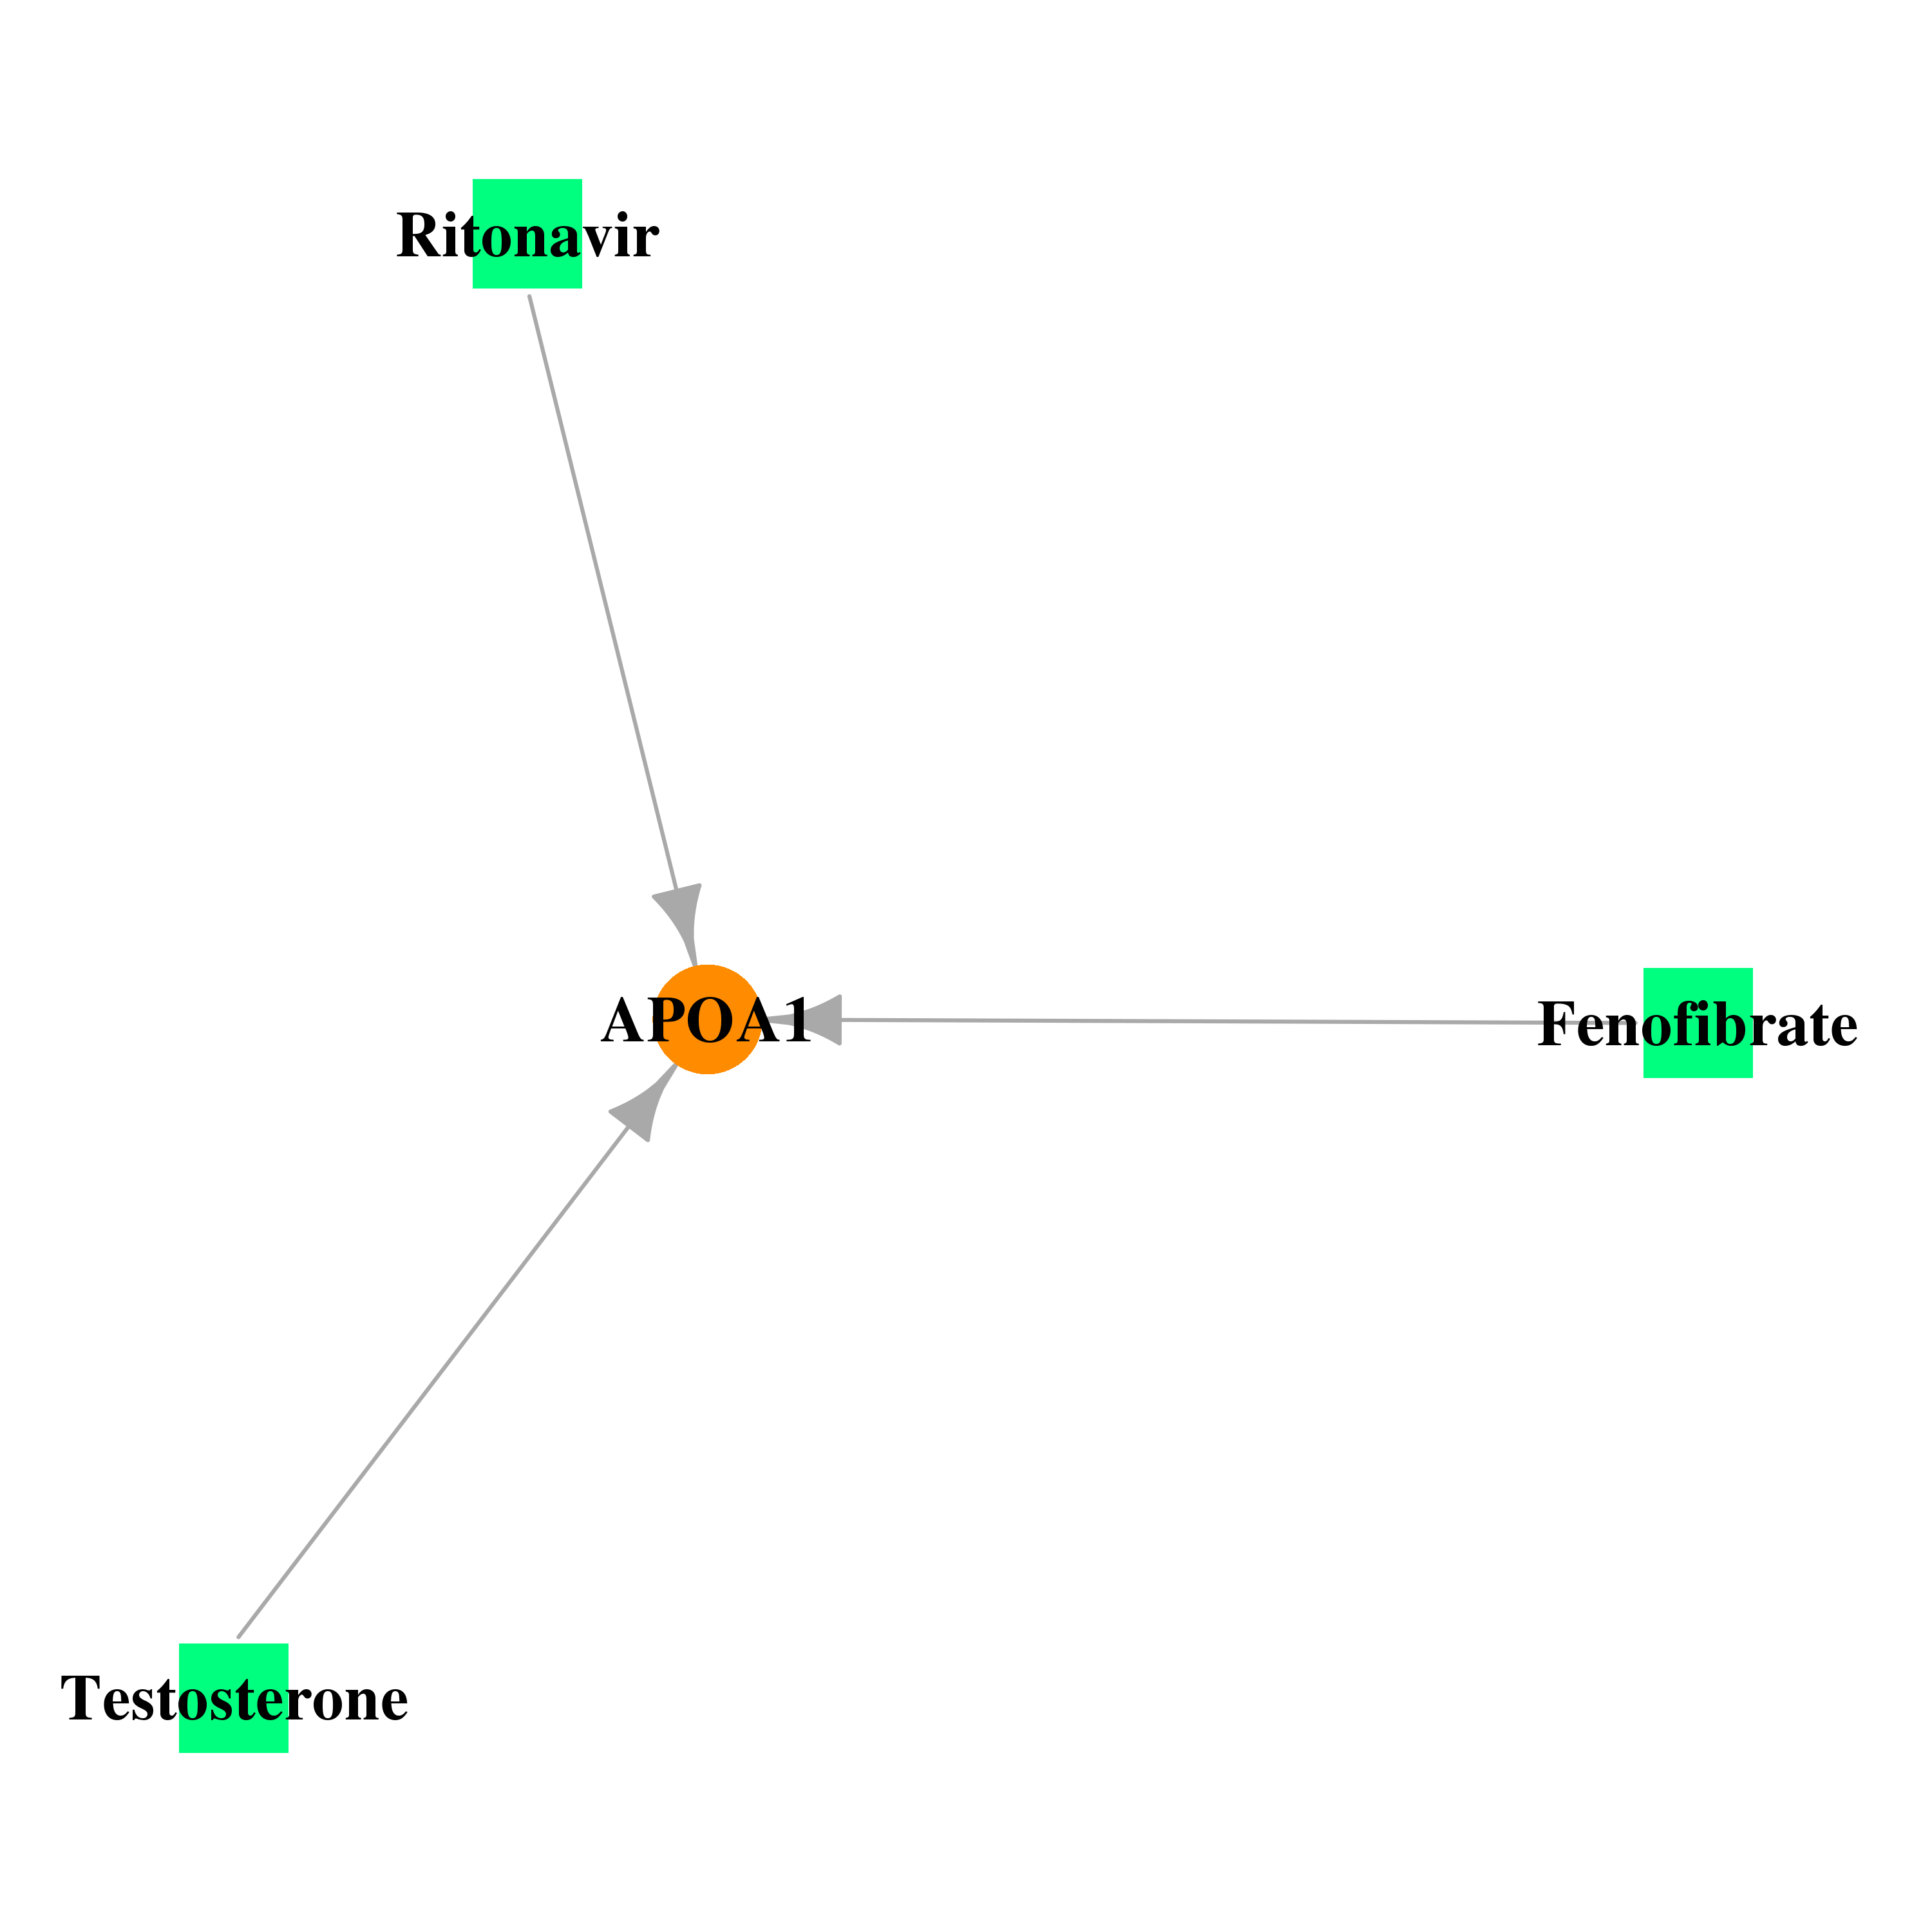 |
| * Drug Centered Interaction Network. |
| DrugBank ID | Target Name | Drug Groups | Generic Name | Drug Centered Network | Drug Structure |
| DB01039 | apolipoprotein A-I | approved | Fenofibrate | 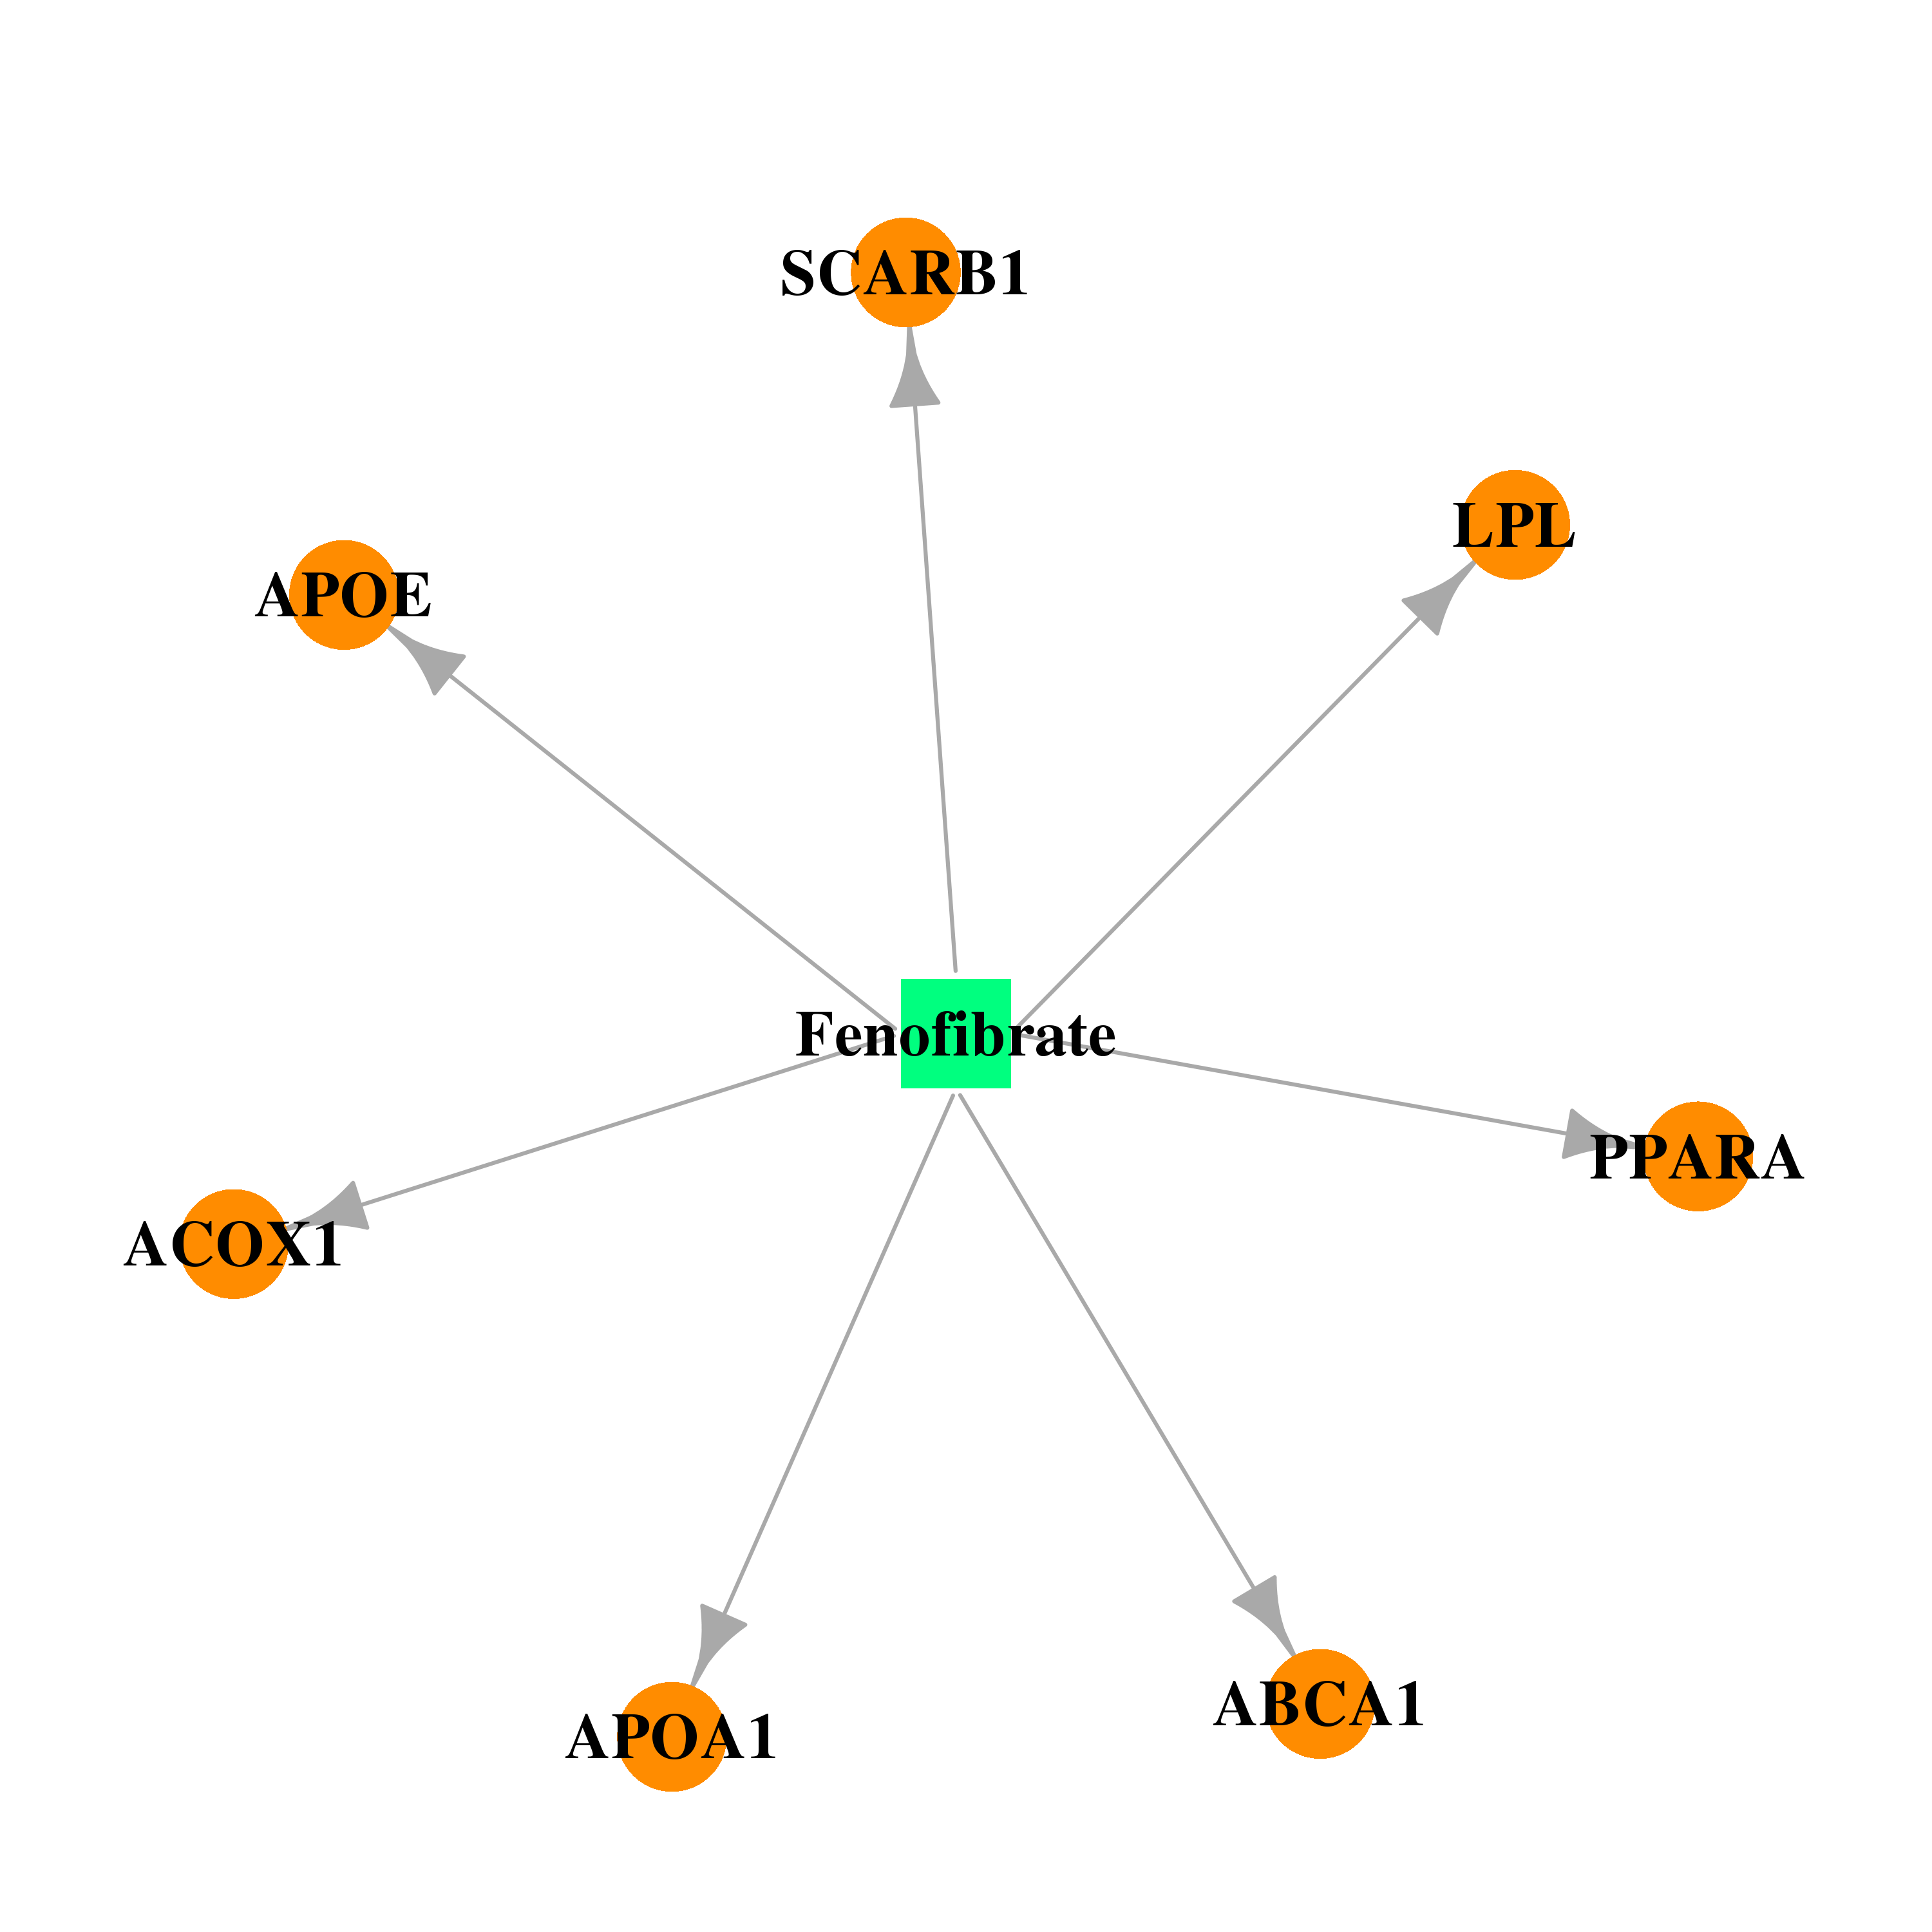 | 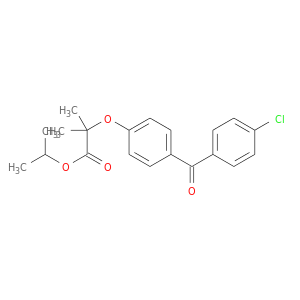 |
| DB00503 | apolipoprotein A-I | approved; investigational | Ritonavir | 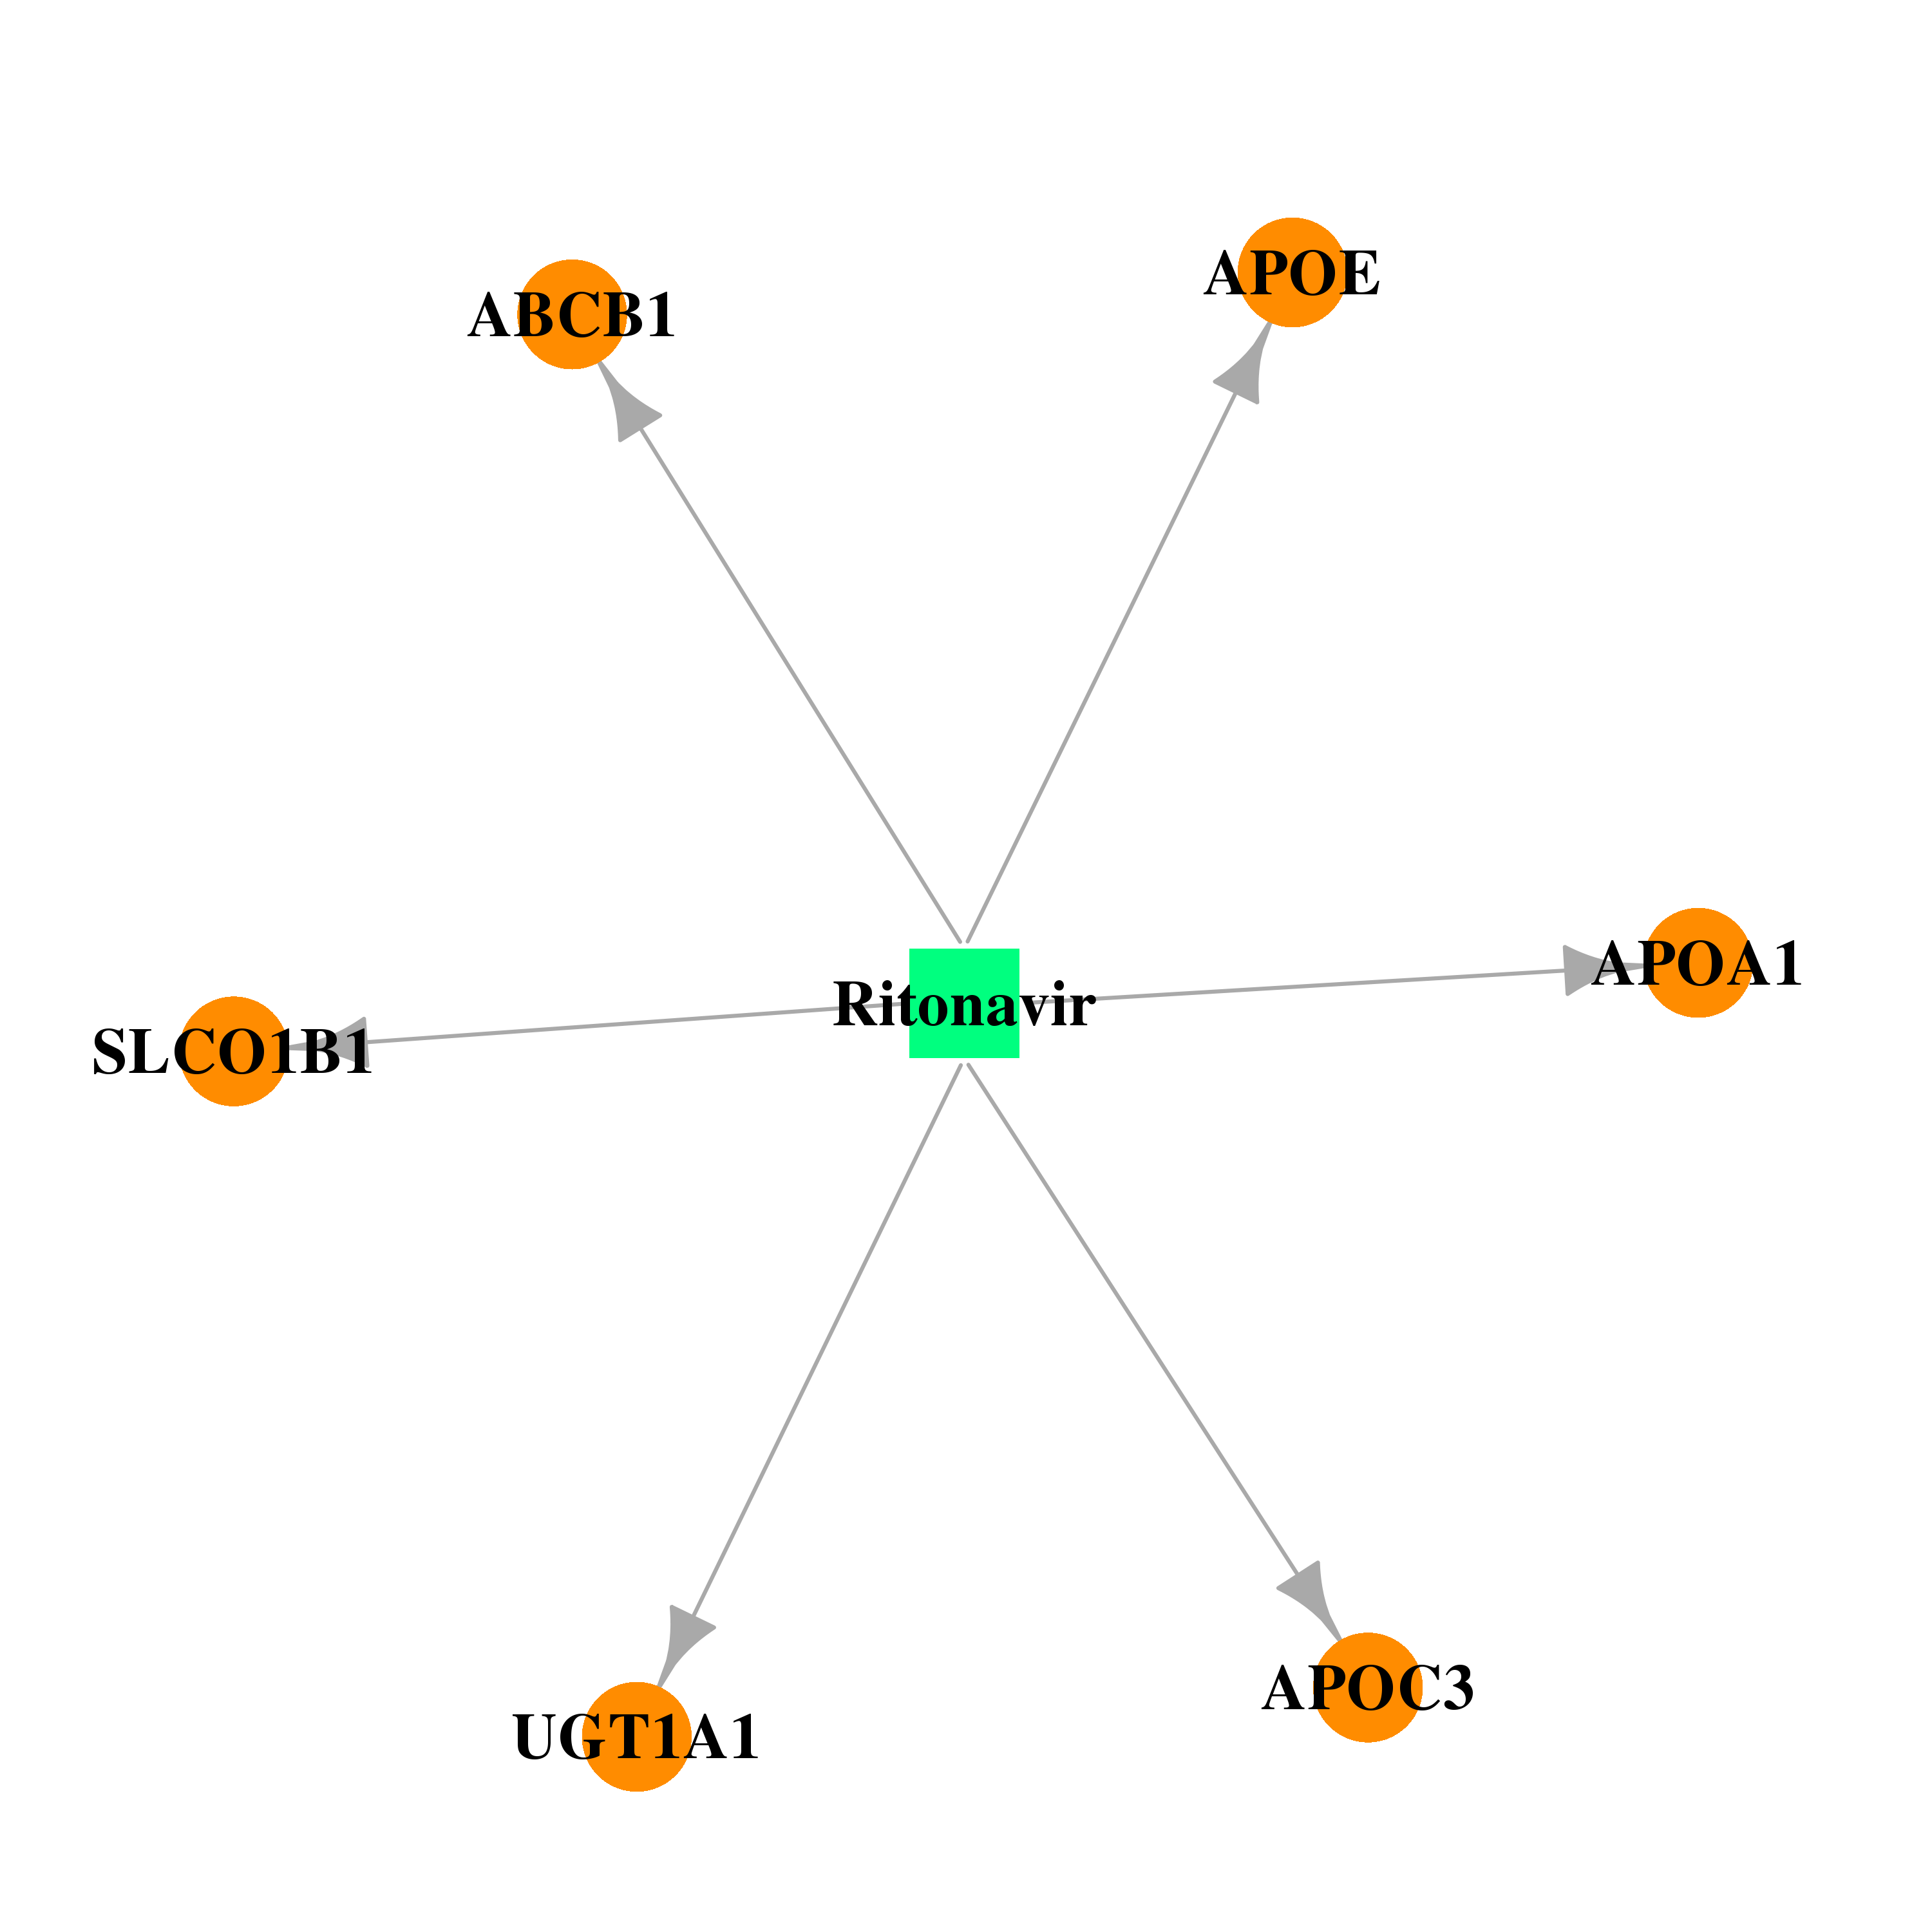 | 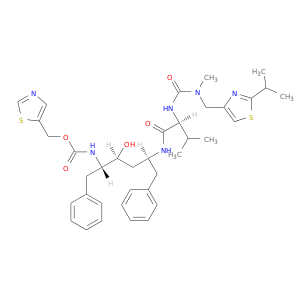 |
| DB00624 | apolipoprotein A-I | approved; investigational | Testosterone | 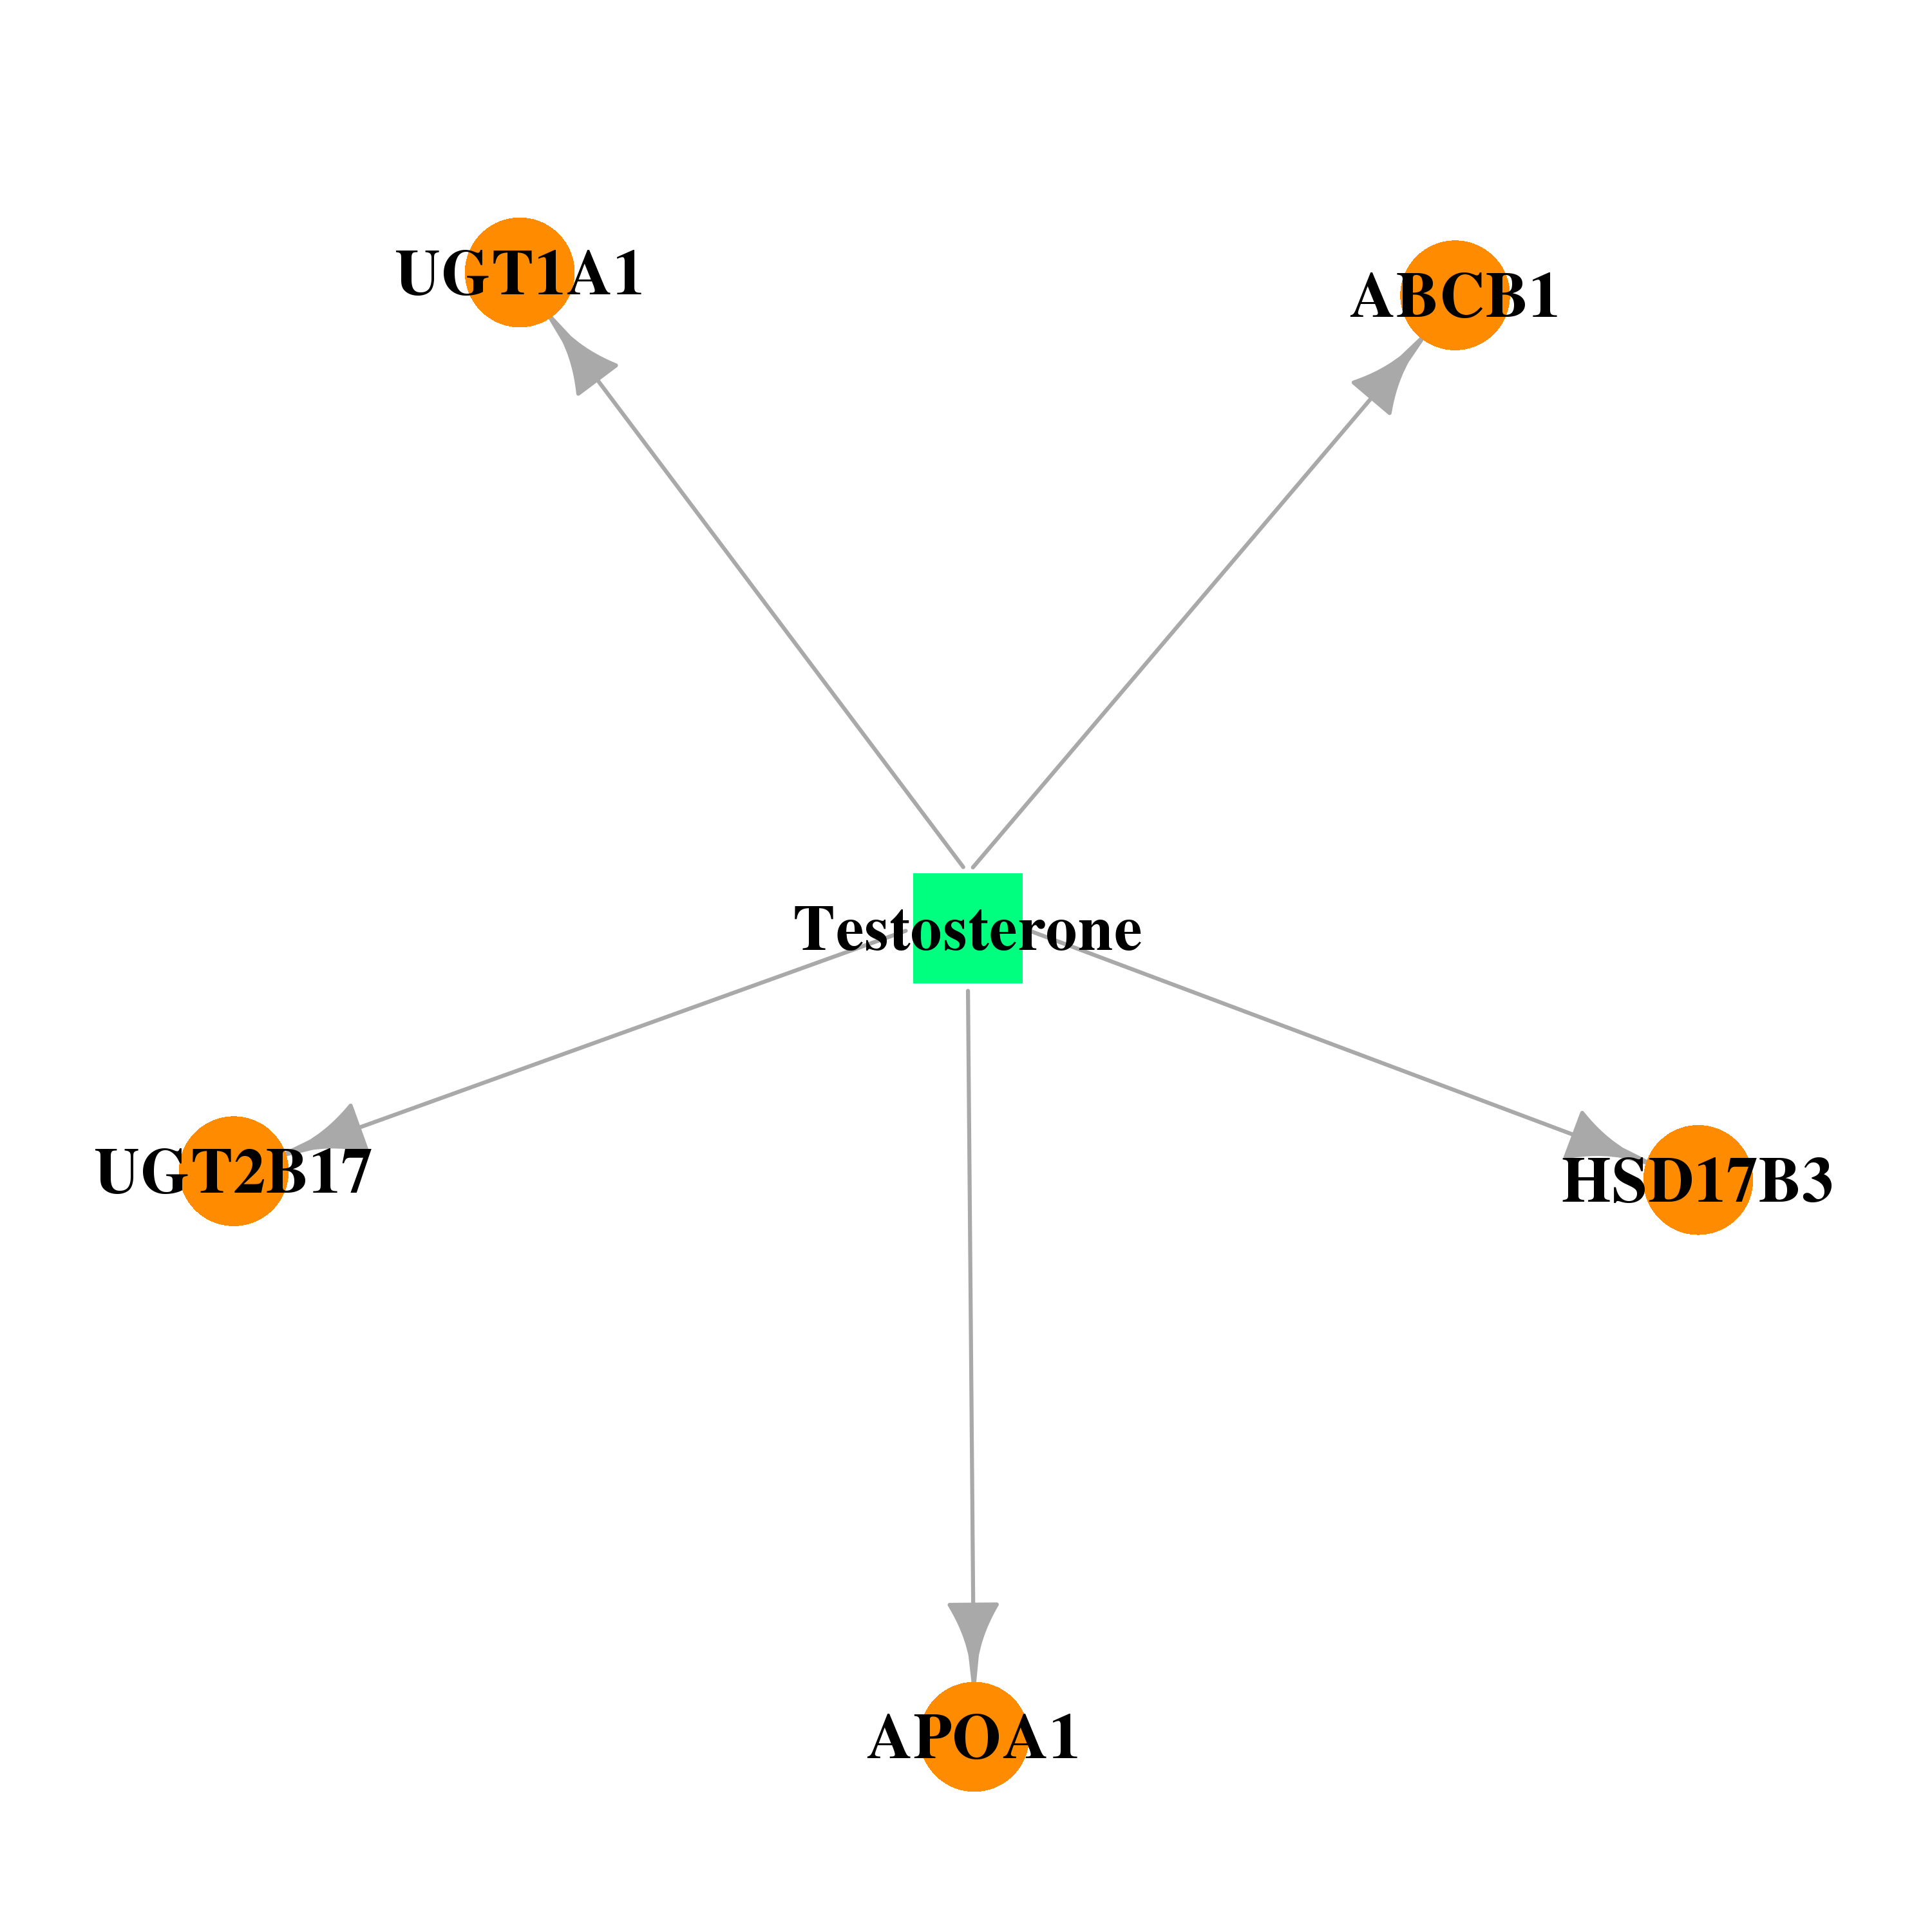 | 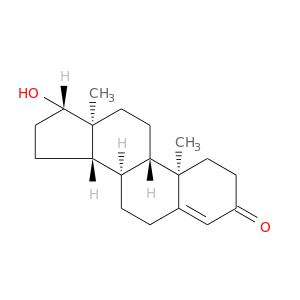 |
| Top |
| Cross referenced IDs for APOA1 |
| * We obtained these cross-references from Uniprot database. It covers 150 different DBs, 18 categories. http://www.uniprot.org/help/cross_references_section |
: Open all cross reference information
|
Copyright © 2016-Present - The Univsersity of Texas Health Science Center at Houston @ |