|
||||||||||||||||||||
| |
| Phenotypic Information (metabolism pathway, cancer, disease, phenome) |
| |
| |
| Gene-Gene Network Information: Co-Expression Network, Interacting Genes & KEGG |
| |
|


| Gene Summary for APOA2 |
| Basic gene info. | Gene symbol | APOA2 |
| Gene name | apolipoprotein A-II | |
| Synonyms | Apo-AII|ApoA-II|apoAII | |
| Cytomap | UCSC genome browser: 1q23.3 | |
| Genomic location | chr1 :161192082-161193418 | |
| Type of gene | protein-coding | |
| RefGenes | NM_001643.1, | |
| Ensembl id | ENSG00000158874 | |
| Description | apolipoprotein A2 | |
| Modification date | 20141207 | |
| dbXrefs | MIM : 107670 | |
| HGNC : HGNC | ||
| Ensembl : ENSG00000158874 | ||
| HPRD : 00129 | ||
| Vega : OTTHUMG00000034346 | ||
| Protein | UniProt: P02652 go to UniProt's Cross Reference DB Table | |
| Expression | CleanEX: HS_APOA2 | |
| BioGPS: 336 | ||
| Gene Expression Atlas: ENSG00000158874 | ||
| The Human Protein Atlas: ENSG00000158874 | ||
| Pathway | NCI Pathway Interaction Database: APOA2 | |
| KEGG: APOA2 | ||
| REACTOME: APOA2 | ||
| ConsensusPathDB | ||
| Pathway Commons: APOA2 | ||
| Metabolism | MetaCyc: APOA2 | |
| HUMANCyc: APOA2 | ||
| Regulation | Ensembl's Regulation: ENSG00000158874 | |
| miRBase: chr1 :161,192,082-161,193,418 | ||
| TargetScan: NM_001643 | ||
| cisRED: ENSG00000158874 | ||
| Context | iHOP: APOA2 | |
| cancer metabolism search in PubMed: APOA2 | ||
| UCL Cancer Institute: APOA2 | ||
| Assigned class in ccmGDB | B - This gene belongs to cancer gene. | |
| Top |
| Phenotypic Information for APOA2(metabolism pathway, cancer, disease, phenome) |
| Cancer | CGAP: APOA2 |
| Familial Cancer Database: APOA2 | |
| * This gene is included in those cancer gene databases. |
|
|
|
|
|
| . | ||||||||||||||
Oncogene 1 | Significant driver gene in | |||||||||||||||||||
| cf) number; DB name 1 Oncogene; http://nar.oxfordjournals.org/content/35/suppl_1/D721.long, 2 Tumor Suppressor gene; https://bioinfo.uth.edu/TSGene/, 3 Cancer Gene Census; http://www.nature.com/nrc/journal/v4/n3/abs/nrc1299.html, 4 CancerGenes; http://nar.oxfordjournals.org/content/35/suppl_1/D721.long, 5 Network of Cancer Gene; http://ncg.kcl.ac.uk/index.php, 1Therapeutic Vulnerabilities in Cancer; http://cbio.mskcc.org/cancergenomics/statius/ |
| REACTOME_METABOLISM_OF_LIPIDS_AND_LIPOPROTEINS REACTOME_LIPOPROTEIN_METABOLISM | |
| OMIM | 107670; gene+phenotype. |
| Orphanet | 238269; Familial renal amyloidosis due to Apolipoprotein AII variant. |
| Disease | KEGG Disease: APOA2 |
| MedGen: APOA2 (Human Medical Genetics with Condition) | |
| ClinVar: APOA2 | |
| Phenotype | MGI: APOA2 (International Mouse Phenotyping Consortium) |
| PhenomicDB: APOA2 | |
| Mutations for APOA2 |
| * Under tables are showing count per each tissue to give us broad intuition about tissue specific mutation patterns.You can go to the detailed page for each mutation database's web site. |
| There's no structural variation information in COSMIC data for this gene. |
| * From mRNA Sanger sequences, Chitars2.0 arranged chimeric transcripts. This table shows APOA2 related fusion information. |
| ID | Head Gene | Tail Gene | Accession | Gene_a | qStart_a | qEnd_a | Chromosome_a | tStart_a | tEnd_a | Gene_a | qStart_a | qEnd_a | Chromosome_a | tStart_a | tEnd_a |
| BG562889 | SAA1 | 1 | 266 | 11 | 18287811 | 18290879 | APOA2 | 266 | 518 | 1 | 161192152 | 161192799 | |
| AI064980 | DEFA1 | 1 | 480 | 8 | 6854300 | 6856718 | APOA2 | 469 | 601 | 1 | 161192236 | 161192764 | |
| AF063569 | APOA2 | 20 | 274 | 1 | 161192082 | 161192731 | PFKFB2 | 267 | 604 | 1 | 207221981 | 207222316 | |
| AI110694 | APOA2 | 20 | 274 | 1 | 161192082 | 161192731 | PFKFB2 | 267 | 604 | 1 | 207221981 | 207222316 | |
| AI207725 | APOA2 | 1 | 470 | 1 | 161192082 | 161193414 | SND1 | 466 | 601 | 7 | 127732510 | 127732645 | |
| AI336287 | FHL3 | 9 | 410 | 1 | 38462445 | 38462846 | APOA2 | 407 | 460 | 1 | 161192762 | 161192815 | |
| AI064779 | APOA2 | 21 | 494 | 1 | 161192082 | 161193418 | PNP | 492 | 553 | 14 | 20944930 | 20944991 | |
| AF090896 | APOA2 | 20 | 274 | 1 | 161192082 | 161192731 | PFKFB2 | 267 | 2907 | 1 | 207219676 | 207222316 | |
| Top |
| There's no copy number variation information in COSMIC data for this gene. |
| Top |
|
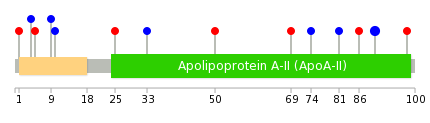 |
| Top |
| Stat. for Non-Synonymous SNVs (# total SNVs=5) | (# total SNVs=4) |
 |  |
(# total SNVs=0) | (# total SNVs=0) |
| Top |
| * When you move the cursor on each content, you can see more deailed mutation information on the Tooltip. Those are primary_site,primary_histology,mutation(aa),pubmedID. |
| GRCh37 position | Mutation(aa) | Unique sampleID count |
| chr1:161192228-161192228 | p.F90F | 3 |
| chr1:161192819-161192819 | p.A25E | 1 |
| chr1:161192205-161192205 | p.A98D | 1 |
| chr1:161193162-161193162 | p.L10L | 1 |
| chr1:161193167-161193167 | p.L9L | 1 |
| chr1:161192240-161192240 | p.F86L | 1 |
| chr1:161193179-161193179 | p.A5T | 1 |
| chr1:161192255-161192255 | p.T81T | 1 |
| chr1:161193180-161193180 | p.L4L | 1 |
| chr1:161192260-161192260 | p.G80* | 1 |
| Top |
|
 |
| Point Mutation/ Tissue ID | 1 | 2 | 3 | 4 | 5 | 6 | 7 | 8 | 9 | 10 | 11 | 12 | 13 | 14 | 15 | 16 | 17 | 18 | 19 | 20 |
| # sample | 1 | 1 | 1 | 2 | 2 | 2 | 3 | |||||||||||||
| # mutation | 1 | 1 | 1 | 3 | 2 | 2 | 3 | |||||||||||||
| nonsynonymous SNV | 1 | 1 | 1 | 1 | 2 | |||||||||||||||
| synonymous SNV | 3 | 2 | 1 | 1 |
| cf) Tissue ID; Tissue type (1; BLCA[Bladder Urothelial Carcinoma], 2; BRCA[Breast invasive carcinoma], 3; CESC[Cervical squamous cell carcinoma and endocervical adenocarcinoma], 4; COAD[Colon adenocarcinoma], 5; GBM[Glioblastoma multiforme], 6; Glioma Low Grade, 7; HNSC[Head and Neck squamous cell carcinoma], 8; KICH[Kidney Chromophobe], 9; KIRC[Kidney renal clear cell carcinoma], 10; KIRP[Kidney renal papillary cell carcinoma], 11; LAML[Acute Myeloid Leukemia], 12; LUAD[Lung adenocarcinoma], 13; LUSC[Lung squamous cell carcinoma], 14; OV[Ovarian serous cystadenocarcinoma ], 15; PAAD[Pancreatic adenocarcinoma], 16; PRAD[Prostate adenocarcinoma], 17; SKCM[Skin Cutaneous Melanoma], 18:STAD[Stomach adenocarcinoma], 19:THCA[Thyroid carcinoma], 20:UCEC[Uterine Corpus Endometrial Carcinoma]) |
| Top |
| * We represented just top 10 SNVs. When you move the cursor on each content, you can see more deailed mutation information on the Tooltip. Those are primary_site, primary_histology, mutation(aa), pubmedID. |
| Genomic Position | Mutation(aa) | Unique sampleID count |
| chr1:161192228 | p.F90F | 3 |
| chr1:161193191 | p.M1V | 1 |
| chr1:161192205 | p.A98D | 1 |
| chr1:161192214 | p.T95K | 1 |
| chr1:161192240 | p.F86L | 1 |
| chr1:161192255 | p.T81T | 1 |
| chr1:161192291 | p.K69N | 1 |
| chr1:161192312 | p.K62K | 1 |
| chr1:161192794 | p.L33L | 1 |
| chr1:161193167 | p.L9I | 1 |
| * Copy number data were extracted from TCGA using R package TCGA-Assembler. The URLs of all public data files on TCGA DCC data server were gathered on Jan-05-2015. Function ProcessCNAData in TCGA-Assembler package was used to obtain gene-level copy number value which is calculated as the average copy number of the genomic region of a gene. |
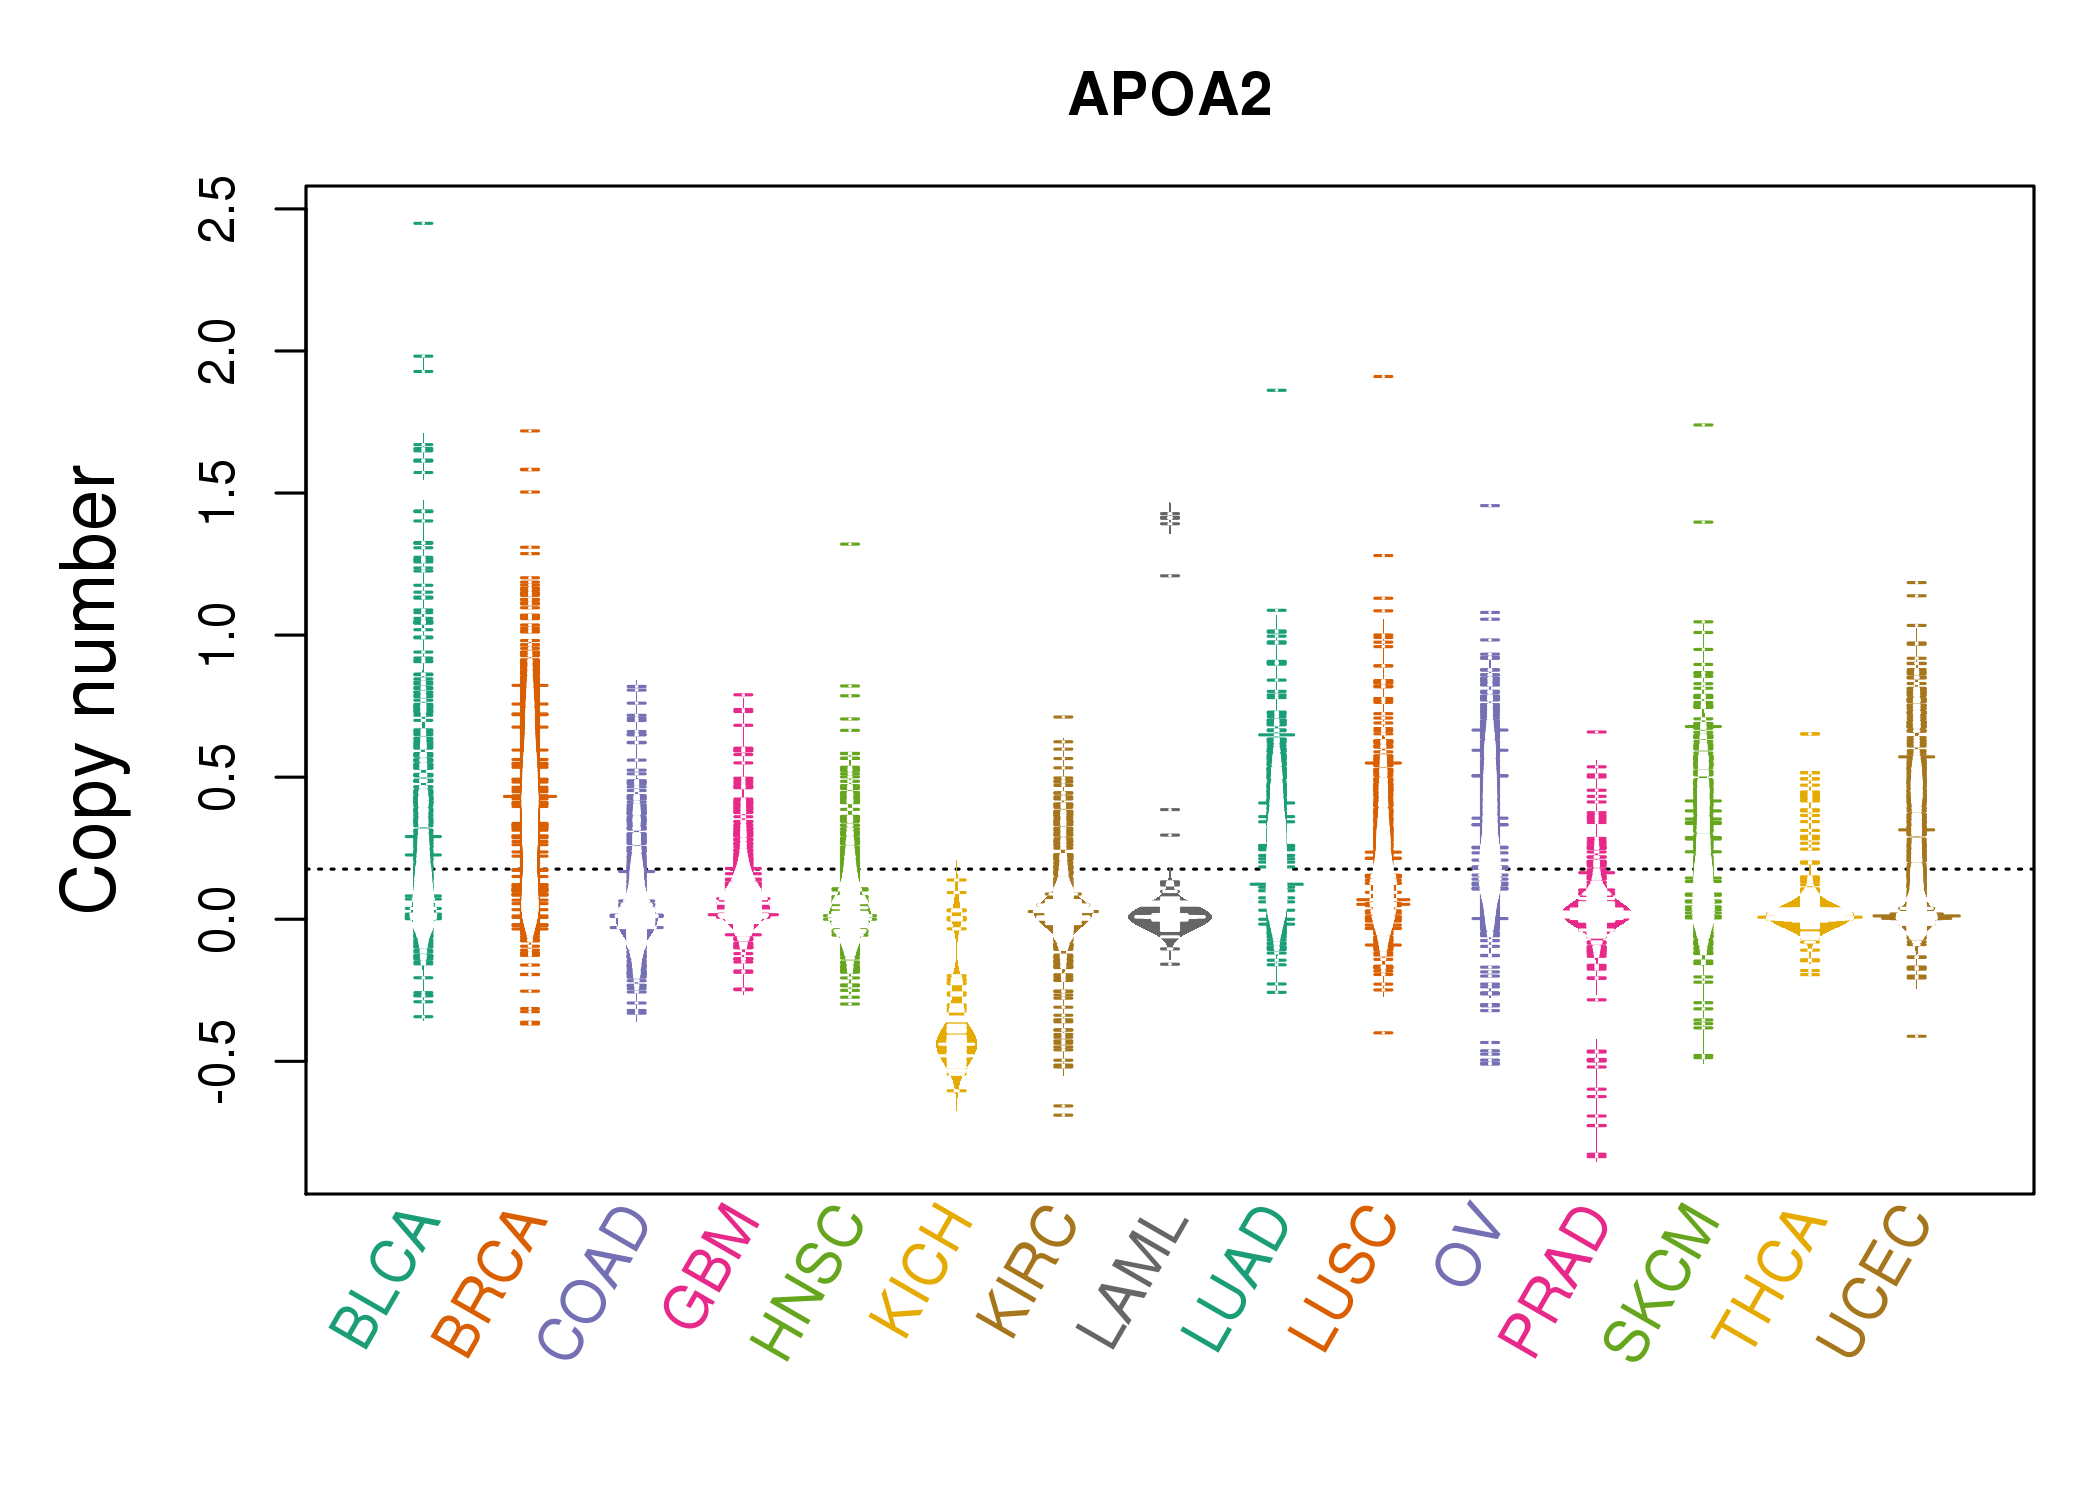 |
| cf) Tissue ID[Tissue type]: BLCA[Bladder Urothelial Carcinoma], BRCA[Breast invasive carcinoma], CESC[Cervical squamous cell carcinoma and endocervical adenocarcinoma], COAD[Colon adenocarcinoma], GBM[Glioblastoma multiforme], Glioma Low Grade, HNSC[Head and Neck squamous cell carcinoma], KICH[Kidney Chromophobe], KIRC[Kidney renal clear cell carcinoma], KIRP[Kidney renal papillary cell carcinoma], LAML[Acute Myeloid Leukemia], LUAD[Lung adenocarcinoma], LUSC[Lung squamous cell carcinoma], OV[Ovarian serous cystadenocarcinoma ], PAAD[Pancreatic adenocarcinoma], PRAD[Prostate adenocarcinoma], SKCM[Skin Cutaneous Melanoma], STAD[Stomach adenocarcinoma], THCA[Thyroid carcinoma], UCEC[Uterine Corpus Endometrial Carcinoma] |
| Top |
| Gene Expression for APOA2 |
| * CCLE gene expression data were extracted from CCLE_Expression_Entrez_2012-10-18.res: Gene-centric RMA-normalized mRNA expression data. |
 |
| * Normalized gene expression data of RNASeqV2 was extracted from TCGA using R package TCGA-Assembler. The URLs of all public data files on TCGA DCC data server were gathered at Jan-05-2015. Only eight cancer types have enough normal control samples for differential expression analysis. (t test, adjusted p<0.05 (using Benjamini-Hochberg FDR)) |
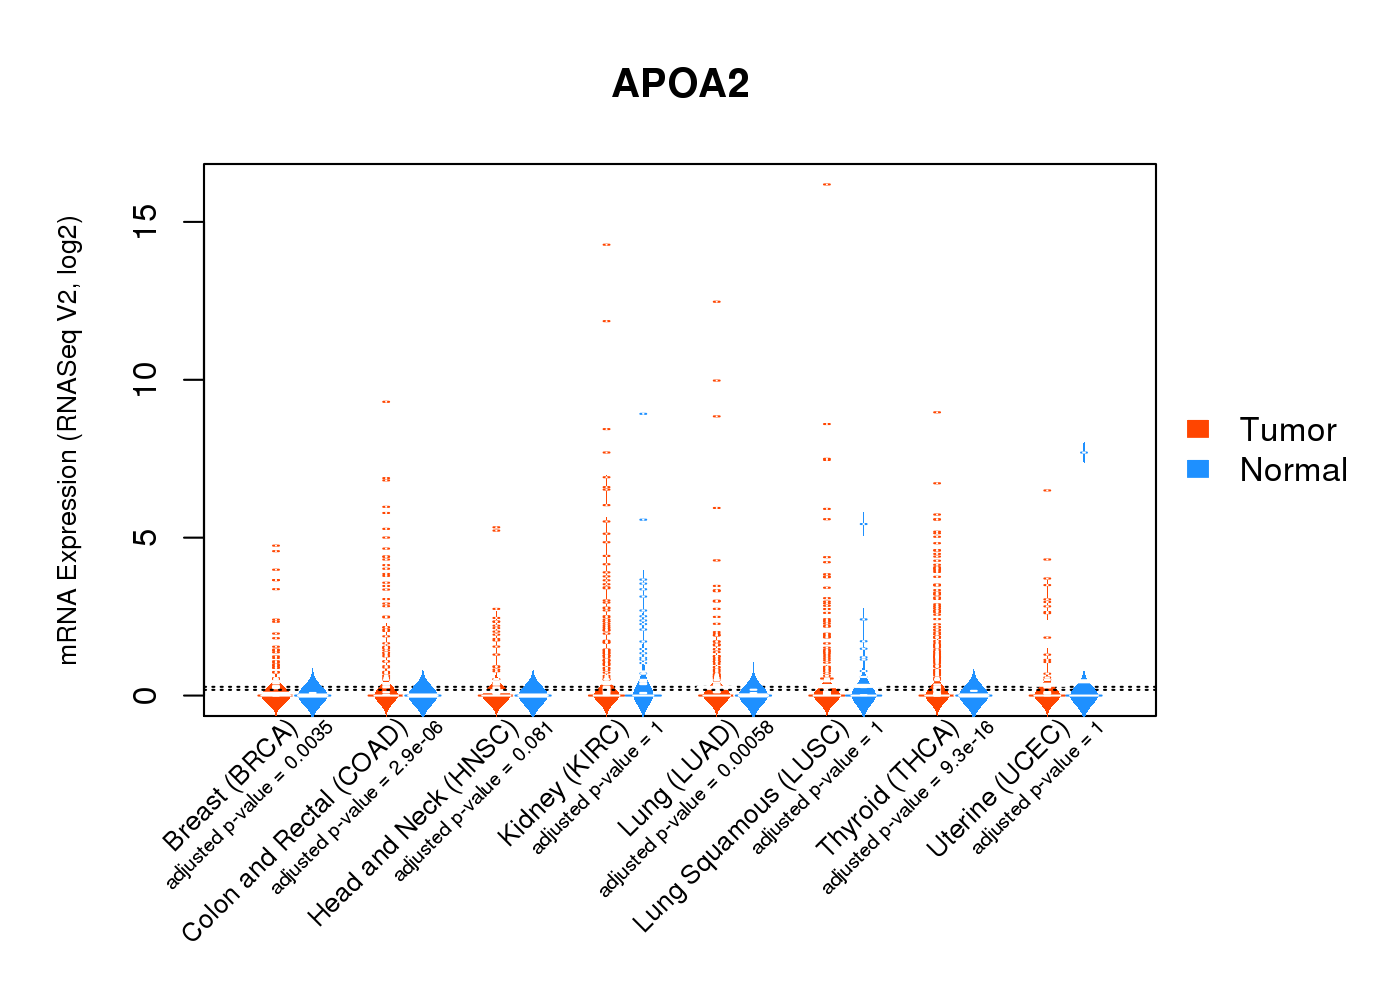 |
| Top |
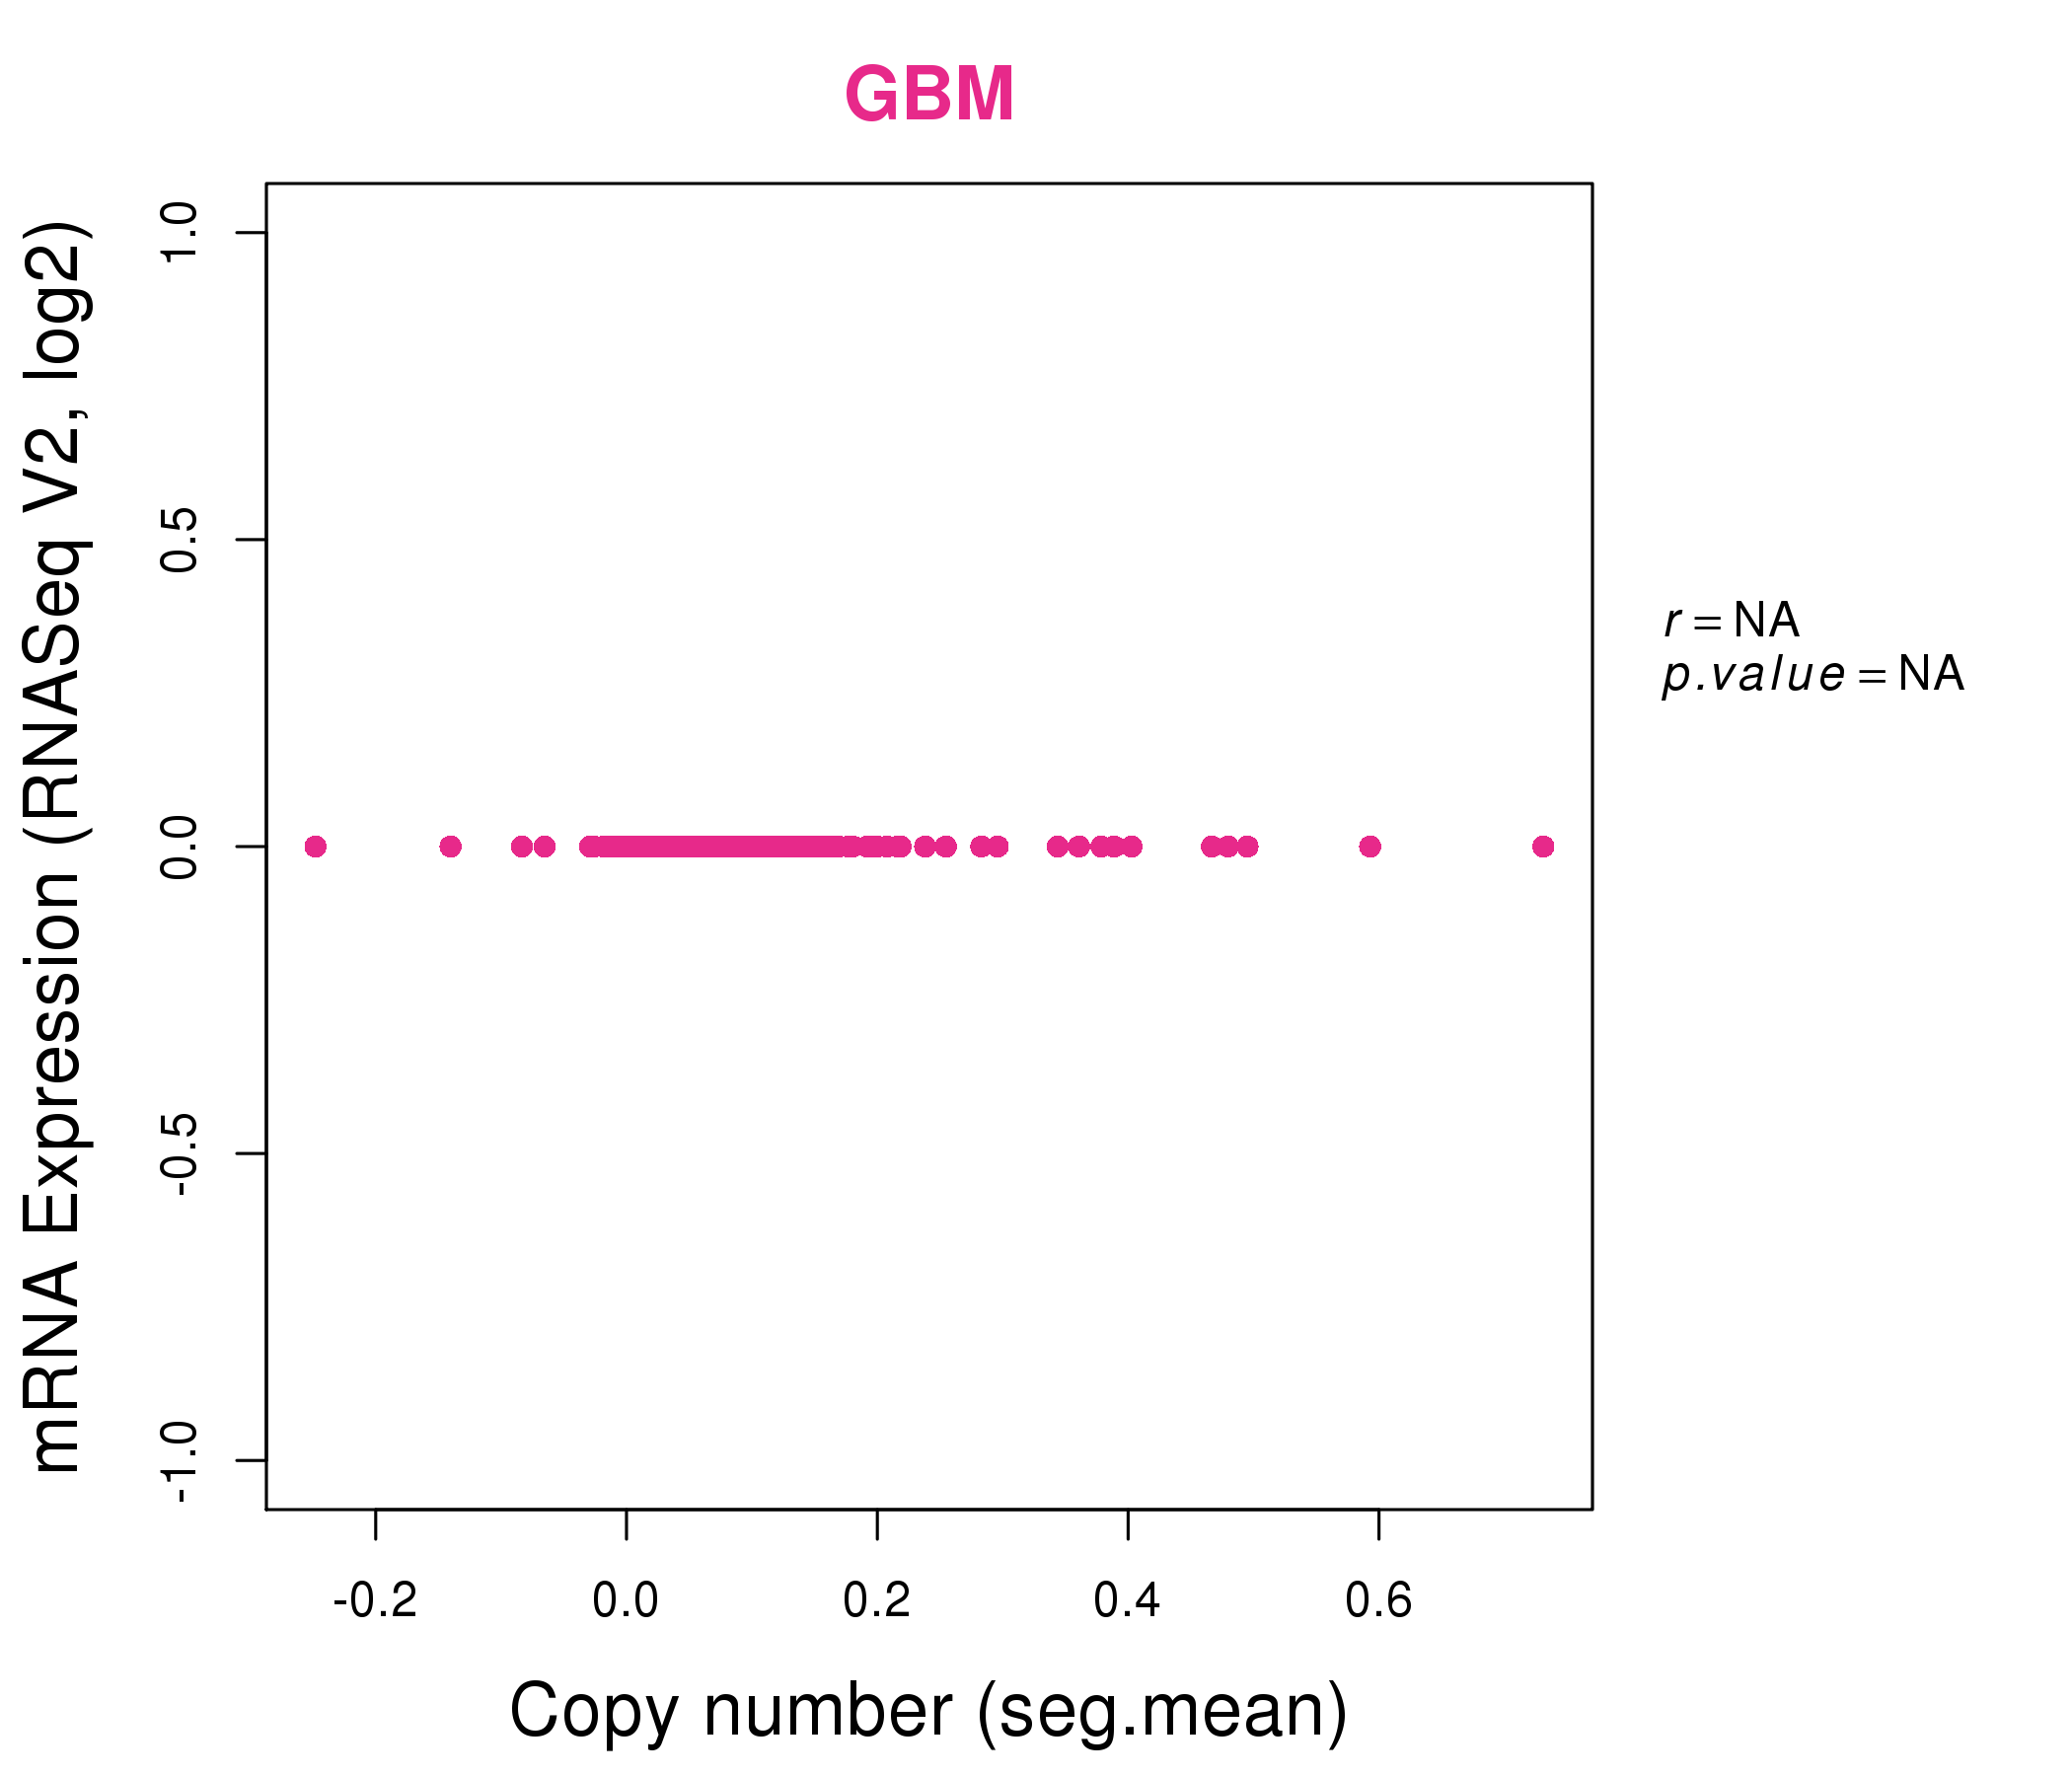
| * This plots show the correlation between CNV and gene expression. |
: Open all plots for all cancer types
 |
|
 |
|

| Top |
| Gene-Gene Network Information |
| * Co-Expression network figures were drawn using R package igraph. Only the top 20 genes with the highest correlations were shown. Red circle: input gene, orange circle: cell metabolism gene, sky circle: other gene |
: Open all plots for all cancer types
 |
|
| APCS,APOA2,APOA4,APOB,APOC3,ARG1,C8A, C9,CREB3L3,CRP,F2,FABP1,FGF23,HP, ITIH1,MT1B,PLG,SERPINA7,SERPINC1,SLC17A2,TM4SF5 | ACSM2B,APOA2,APOC3,APOL4,TBATA,CHGA,CYP3A5, DBH,DEFA5,GRAPL,IFNL3,KCNG4,LOC100133469,NDRG4, ORM2,PHOX2B,POU4F2,SLC18A1,SNORA14A,ST8SIA3,TH |
 |
|
| AMBP,APOA2,ATP4A,C1orf64,CHRND,DCT,F2, FAM71E2,GYPB,HHATL,HIST1H4G,IGDCC3,IGF2BP1,KLK2, MLANA,LINC00202-1,OC90,OR6C68,PLSCR5,SNAR-F,TXNDC8 | ALB,APCS,APOA2,C3P1,C8A,CFHR2,CFHR5, CYP4A22,DNAJB8,F13B,F9,FGG,HRG,KIR3DP1, KRTAP4-11,KRTAP5-3,LECT2,LOC100129935,LINC00160,OR1N1,SLC17A2 |


| * Co-Expression network figures were drawn using R package igraph. Only the top 20 genes with the highest correlations were shown. Red circle: input gene, orange circle: cell metabolism gene, sky circle: other gene |
: Open all plots for all cancer types
| Top |
: Open all interacting genes' information including KEGG pathway for all interacting genes from DAVID
| Top |
| Pharmacological Information for APOA2 |
| There's no related Drug. |
| Top |
| Cross referenced IDs for APOA2 |
| * We obtained these cross-references from Uniprot database. It covers 150 different DBs, 18 categories. http://www.uniprot.org/help/cross_references_section |
: Open all cross reference information
|
Copyright © 2016-Present - The Univsersity of Texas Health Science Center at Houston @ |