|
|||||||||||||||||||||||||||||||||||||||||||||||||||||||||||||||||||||||||||||||||||||||||||||||||||||||||||||||||||||||||||||||||||||||||||||||||||||||||||||||||||||||||||||||||||||||||||||||||||||||||||||||||||||||||||||||||||||||||||||||||||||||||||||||||||||||||||||||||||||||||||||||||||||||||||||||||||||||||||||||||||||||||||||||||||||||||||||||||||||
| |
| Phenotypic Information (metabolism pathway, cancer, disease, phenome) |
| |
| |
| Gene-Gene Network Information: Co-Expression Network, Interacting Genes & KEGG |
| |
|


| Gene Summary for APOB |
| Top |
| Phenotypic Information for APOB(metabolism pathway, cancer, disease, phenome) |
| Cancer | CGAP: APOB |
| Familial Cancer Database: APOB | |
| * This gene is included in those cancer gene databases. |
|
|
|
|
|
| . | |||||||||||||||||||||||||||||||||||||||||||||||||||||||||||||||||||||||||||||||||||||||||||||||||||||||||||||||||||||||||||||||||||||||||||||||||||||||||||||||||||||||||||||||||||||||||||||||||||||||||||||||||||||||||||||||||||||||||||||||||||||||||||||||||||||||||||||||||||||||||||||||||||||||||||||||||||||||||||||||||||||||||||||||||||||||||||||||
Oncogene 1 | Significant driver gene in | ||||||||||||||||||||||||||||||||||||||||||||||||||||||||||||||||||||||||||||||||||||||||||||||||||||||||||||||||||||||||||||||||||||||||||||||||||||||||||||||||||||||||||||||||||||||||||||||||||||||||||||||||||||||||||||||||||||||||||||||||||||||||||||||||||||||||||||||||||||||||||||||||||||||||||||||||||||||||||||||||||||||||||||||||||||||||||||||||||||
| cf) number; DB name 1 Oncogene; http://nar.oxfordjournals.org/content/35/suppl_1/D721.long, 2 Tumor Suppressor gene; https://bioinfo.uth.edu/TSGene/, 3 Cancer Gene Census; http://www.nature.com/nrc/journal/v4/n3/abs/nrc1299.html, 4 CancerGenes; http://nar.oxfordjournals.org/content/35/suppl_1/D721.long, 5 Network of Cancer Gene; http://ncg.kcl.ac.uk/index.php, 1Therapeutic Vulnerabilities in Cancer; http://cbio.mskcc.org/cancergenomics/statius/ |
| REACTOME_METABOLISM_OF_LIPIDS_AND_LIPOPROTEINS REACTOME_LIPOPROTEIN_METABOLISM | |
| OMIM | |
| Orphanet | |
| Disease | KEGG Disease: APOB |
| MedGen: APOB (Human Medical Genetics with Condition) | |
| ClinVar: APOB | |
| Phenotype | MGI: APOB (International Mouse Phenotyping Consortium) |
| PhenomicDB: APOB | |
| Mutations for APOB |
| * Under tables are showing count per each tissue to give us broad intuition about tissue specific mutation patterns.You can go to the detailed page for each mutation database's web site. |
| There's no structural variation information in COSMIC data for this gene. |
| * From mRNA Sanger sequences, Chitars2.0 arranged chimeric transcripts. This table shows APOB related fusion information. |
| ID | Head Gene | Tail Gene | Accession | Gene_a | qStart_a | qEnd_a | Chromosome_a | tStart_a | tEnd_a | Gene_a | qStart_a | qEnd_a | Chromosome_a | tStart_a | tEnd_a |
| BG562874 | APOB | 1 | 367 | 2 | 21227268 | 21228146 | ALB | 359 | 660 | 4 | 74279174 | 74280877 | |
| AI052800 | SUPT6H | 1 | 197 | 17 | 27029052 | 27029248 | APOB | 196 | 470 | 2 | 21234785 | 21235060 | |
| AF119905 | MALAT1 | 1 | 1173 | 11 | 65269439 | 65270612 | APOB | 1160 | 1719 | 2 | 21228718 | 21229276 | |
| BX091114 | APOB | 1 | 592 | 2 | 21261503 | 21262094 | SLBP | 586 | 718 | 4 | 1699179 | 1699311 | |
| BP238983 | DDX19B | 6 | 287 | 16 | 70405875 | 70406156 | APOB | 287 | 461 | 2 | 21226053 | 21227161 | |
| Top |
| Mutation type/ Tissue ID | brca | cns | cerv | endome | haematopo | kidn | Lintest | liver | lung | ns | ovary | pancre | prost | skin | stoma | thyro | urina | |||
| Total # sample | 1 | |||||||||||||||||||
| GAIN (# sample) | 1 | |||||||||||||||||||
| LOSS (# sample) |
| cf) Tissue ID; Tissue type (1; Breast, 2; Central_nervous_system, 3; Cervix, 4; Endometrium, 5; Haematopoietic_and_lymphoid_tissue, 6; Kidney, 7; Large_intestine, 8; Liver, 9; Lung, 10; NS, 11; Ovary, 12; Pancreas, 13; Prostate, 14; Skin, 15; Stomach, 16; Thyroid, 17; Urinary_tract) |
| Top |
|
 |
| Top |
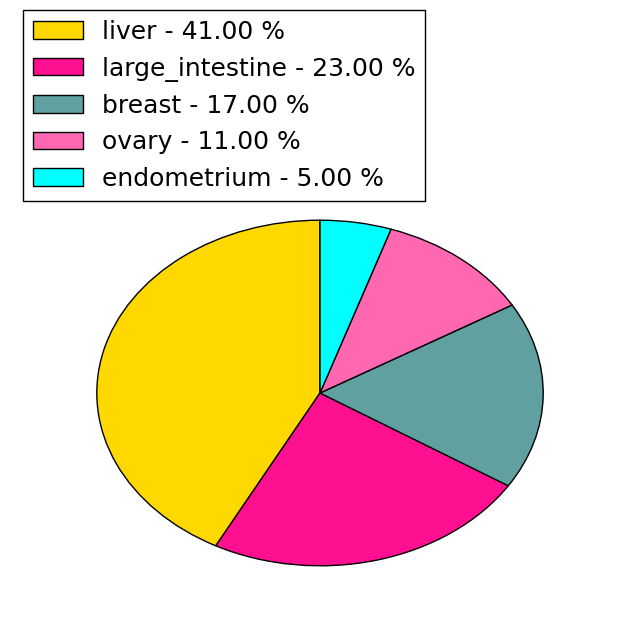
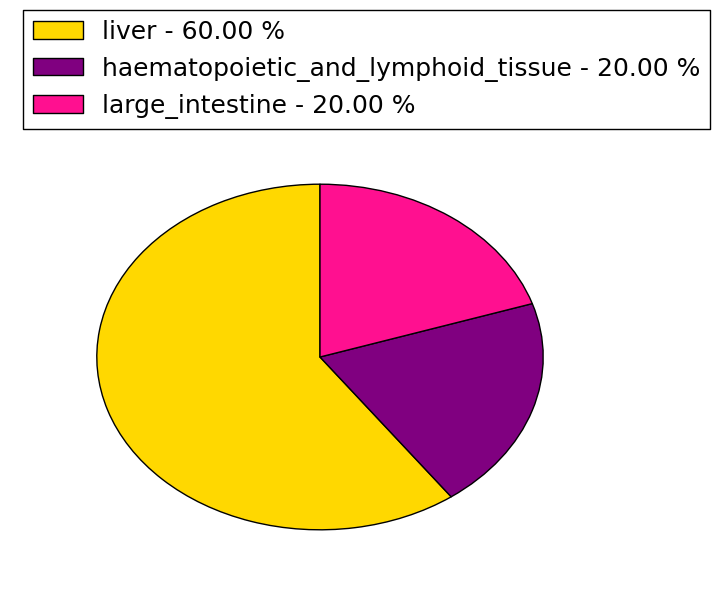
| Stat. for Non-Synonymous SNVs (# total SNVs=636) | (# total SNVs=204) |
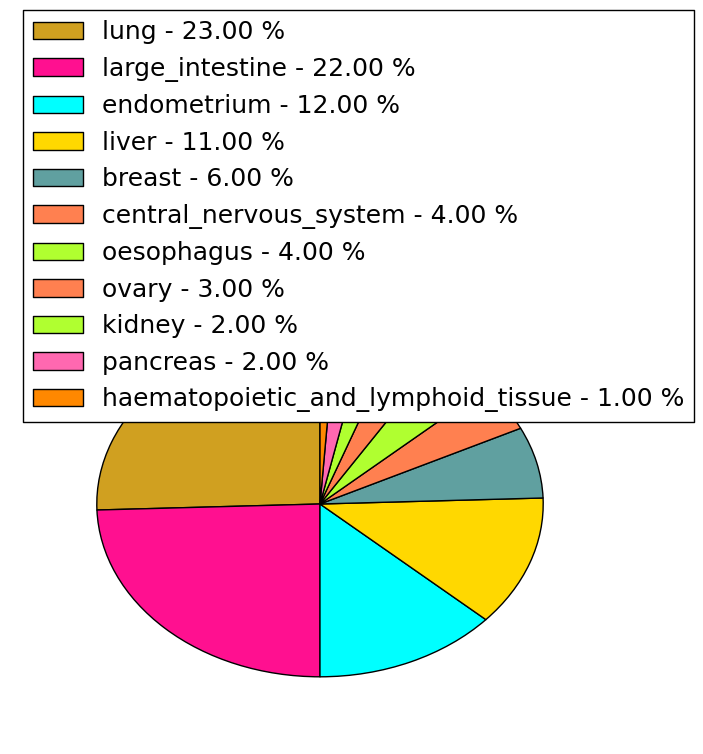 | 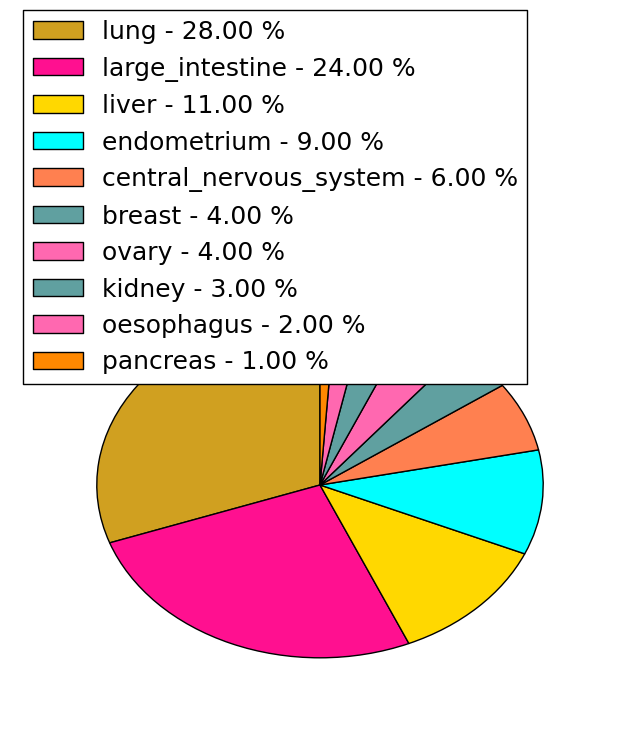 |
(# total SNVs=17) | (# total SNVs=5) |
 |  |
| Top |
| * When you move the cursor on each content, you can see more deailed mutation information on the Tooltip. Those are primary_site,primary_histology,mutation(aa),pubmedID. |
| GRCh37 position | Mutation(aa) | Unique sampleID count |
| chr2:21230434-21230434 | p.F3102L | 5 |
| chr2:21235202-21235202 | p.R1513Q | 5 |
| chr2:21235160-21235160 | p.L1527P | 5 |
| chr2:21230014-21230014 | p.L3242L | 4 |
| chr2:21230633-21230633 | p.S3036Y | 4 |
| chr2:21235442-21235442 | p.S1433L | 4 |
| chr2:21230565-21230565 | p.R3059C | 4 |
| chr2:21236086-21236086 | p.R1388C | 4 |
| chr2:21225563-21225563 | p.S4244F | 3 |
| chr2:21233155-21233155 | p.K2195K | 3 |
| Top |
|
 |
| Point Mutation/ Tissue ID | 1 | 2 | 3 | 4 | 5 | 6 | 7 | 8 | 9 | 10 | 11 | 12 | 13 | 14 | 15 | 16 | 17 | 18 | 19 | 20 |
| # sample | 12 | 24 | 5 | 82 | 15 | 29 | 16 | 2 | 2 | 87 | 37 | 22 | 1 | 4 | 105 | 35 | 4 | 38 | ||
| # mutation | 15 | 25 | 7 | 113 | 17 | 32 | 16 | 2 | 2 | 127 | 44 | 23 | 1 | 4 | 215 | 58 | 4 | 89 | ||
| nonsynonymous SNV | 10 | 18 | 7 | 72 | 13 | 25 | 10 | 1 | 2 | 93 | 26 | 16 | 1 | 4 | 149 | 41 | 4 | 70 | ||
| synonymous SNV | 5 | 7 | 42 | 4 | 7 | 6 | 1 | 34 | 18 | 7 | 66 | 17 | 19 |
| cf) Tissue ID; Tissue type (1; BLCA[Bladder Urothelial Carcinoma], 2; BRCA[Breast invasive carcinoma], 3; CESC[Cervical squamous cell carcinoma and endocervical adenocarcinoma], 4; COAD[Colon adenocarcinoma], 5; GBM[Glioblastoma multiforme], 6; Glioma Low Grade, 7; HNSC[Head and Neck squamous cell carcinoma], 8; KICH[Kidney Chromophobe], 9; KIRC[Kidney renal clear cell carcinoma], 10; KIRP[Kidney renal papillary cell carcinoma], 11; LAML[Acute Myeloid Leukemia], 12; LUAD[Lung adenocarcinoma], 13; LUSC[Lung squamous cell carcinoma], 14; OV[Ovarian serous cystadenocarcinoma ], 15; PAAD[Pancreatic adenocarcinoma], 16; PRAD[Prostate adenocarcinoma], 17; SKCM[Skin Cutaneous Melanoma], 18:STAD[Stomach adenocarcinoma], 19:THCA[Thyroid carcinoma], 20:UCEC[Uterine Corpus Endometrial Carcinoma]) |
| Top |
| * We represented just top 10 SNVs. When you move the cursor on each content, you can see more deailed mutation information on the Tooltip. Those are primary_site, primary_histology, mutation(aa), pubmedID. |
| Genomic Position | Mutation(aa) | Unique sampleID count |
| chr2:21230434 | p.F3102L | 6 |
| chr2:21235160 | p.L1527P | 5 |
| chr2:21235442 | p.S1433L | 4 |
| chr2:21230565 | p.F1328F | 3 |
| chr2:21227313 | p.E2079K | 3 |
| chr2:21225676 | p.G3972E | 3 |
| chr2:21229930 | p.R3059C | 3 |
| chr2:21233155 | p.E1976G | 3 |
| chr2:21225916 | p.A43V | 3 |
| chr2:21233813 | p.I4126I | 3 |
| * Copy number data were extracted from TCGA using R package TCGA-Assembler. The URLs of all public data files on TCGA DCC data server were gathered on Jan-05-2015. Function ProcessCNAData in TCGA-Assembler package was used to obtain gene-level copy number value which is calculated as the average copy number of the genomic region of a gene. |
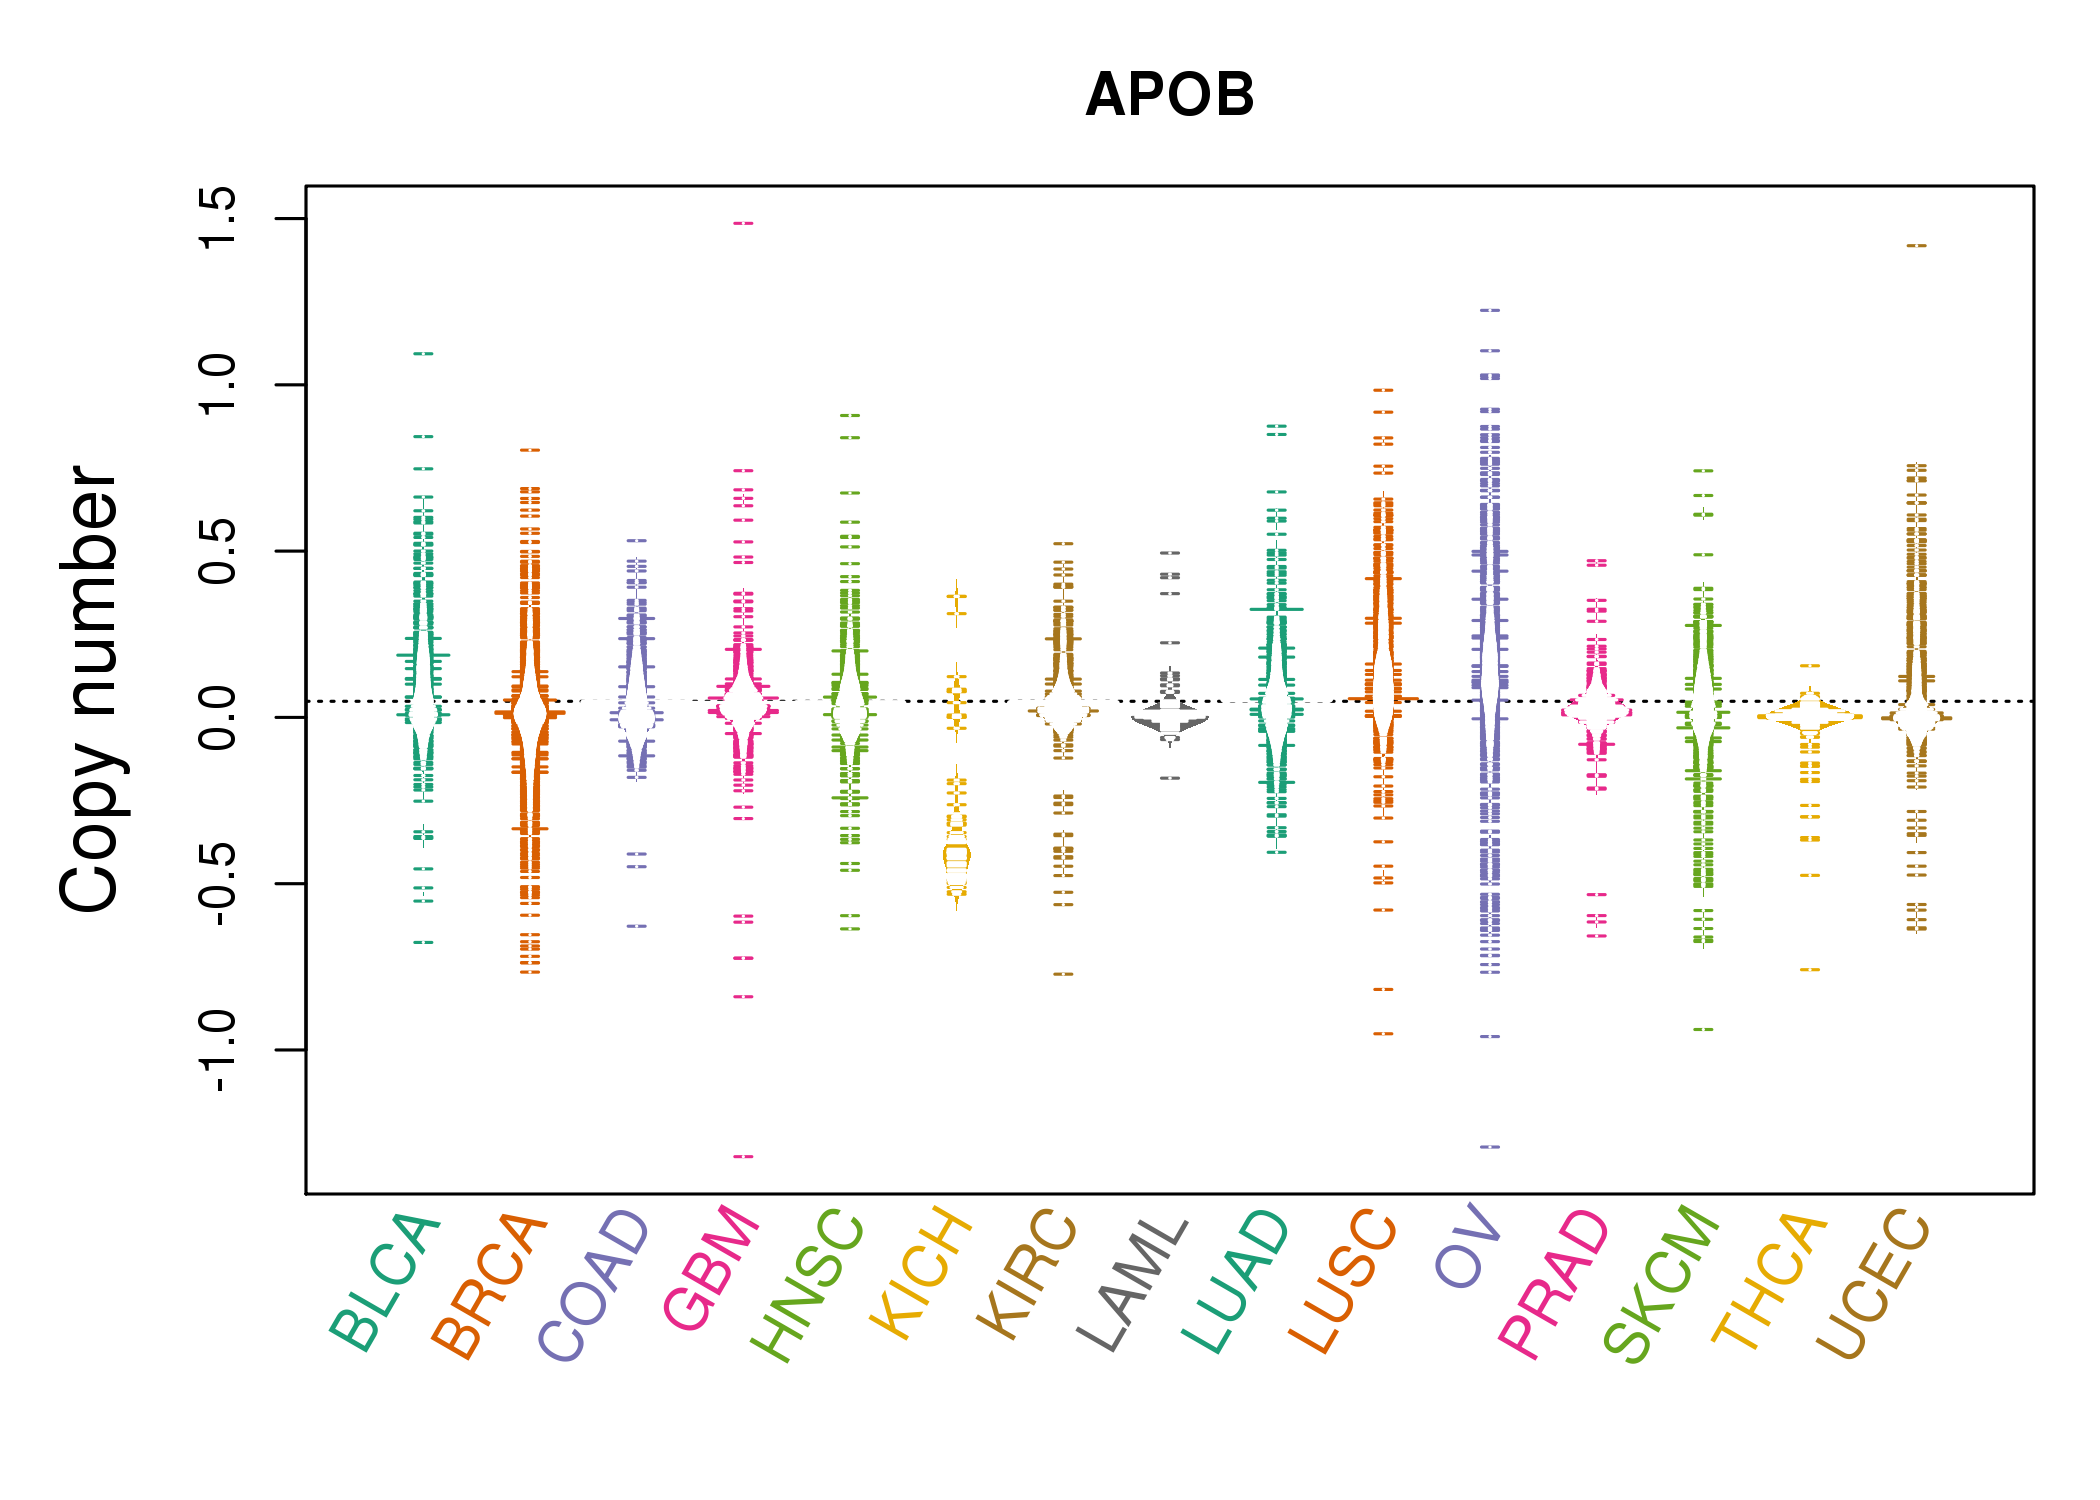 |
| cf) Tissue ID[Tissue type]: BLCA[Bladder Urothelial Carcinoma], BRCA[Breast invasive carcinoma], CESC[Cervical squamous cell carcinoma and endocervical adenocarcinoma], COAD[Colon adenocarcinoma], GBM[Glioblastoma multiforme], Glioma Low Grade, HNSC[Head and Neck squamous cell carcinoma], KICH[Kidney Chromophobe], KIRC[Kidney renal clear cell carcinoma], KIRP[Kidney renal papillary cell carcinoma], LAML[Acute Myeloid Leukemia], LUAD[Lung adenocarcinoma], LUSC[Lung squamous cell carcinoma], OV[Ovarian serous cystadenocarcinoma ], PAAD[Pancreatic adenocarcinoma], PRAD[Prostate adenocarcinoma], SKCM[Skin Cutaneous Melanoma], STAD[Stomach adenocarcinoma], THCA[Thyroid carcinoma], UCEC[Uterine Corpus Endometrial Carcinoma] |
| Top |
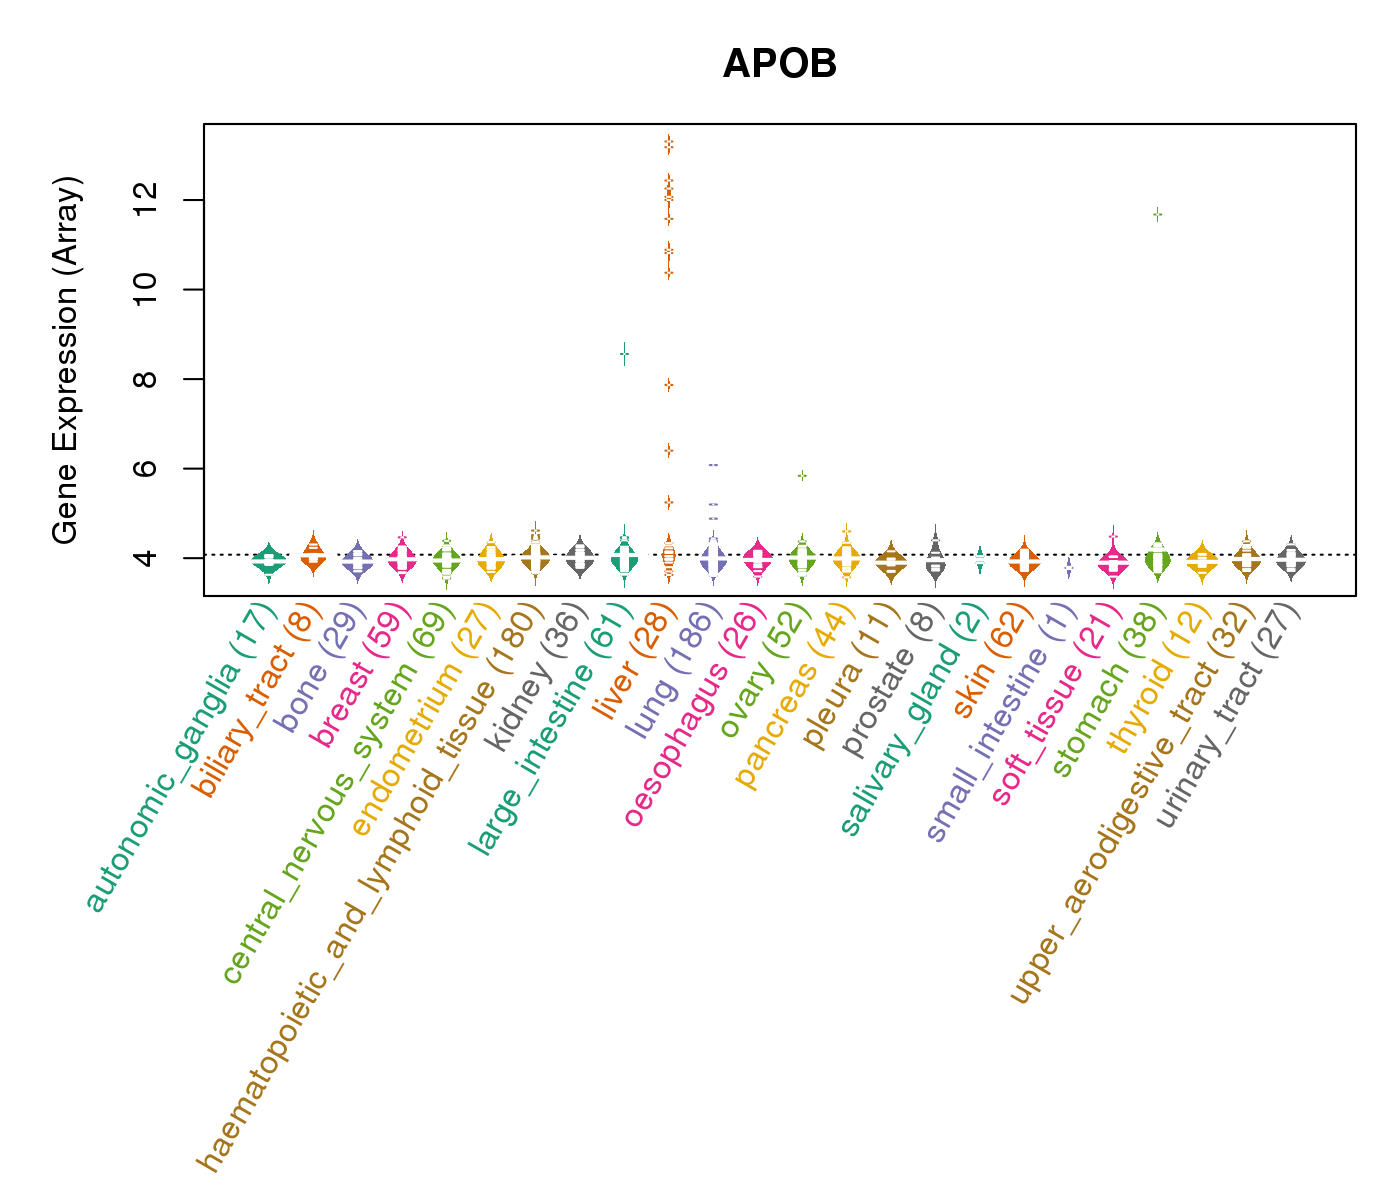
| Gene Expression for APOB |
| * CCLE gene expression data were extracted from CCLE_Expression_Entrez_2012-10-18.res: Gene-centric RMA-normalized mRNA expression data. |
 |
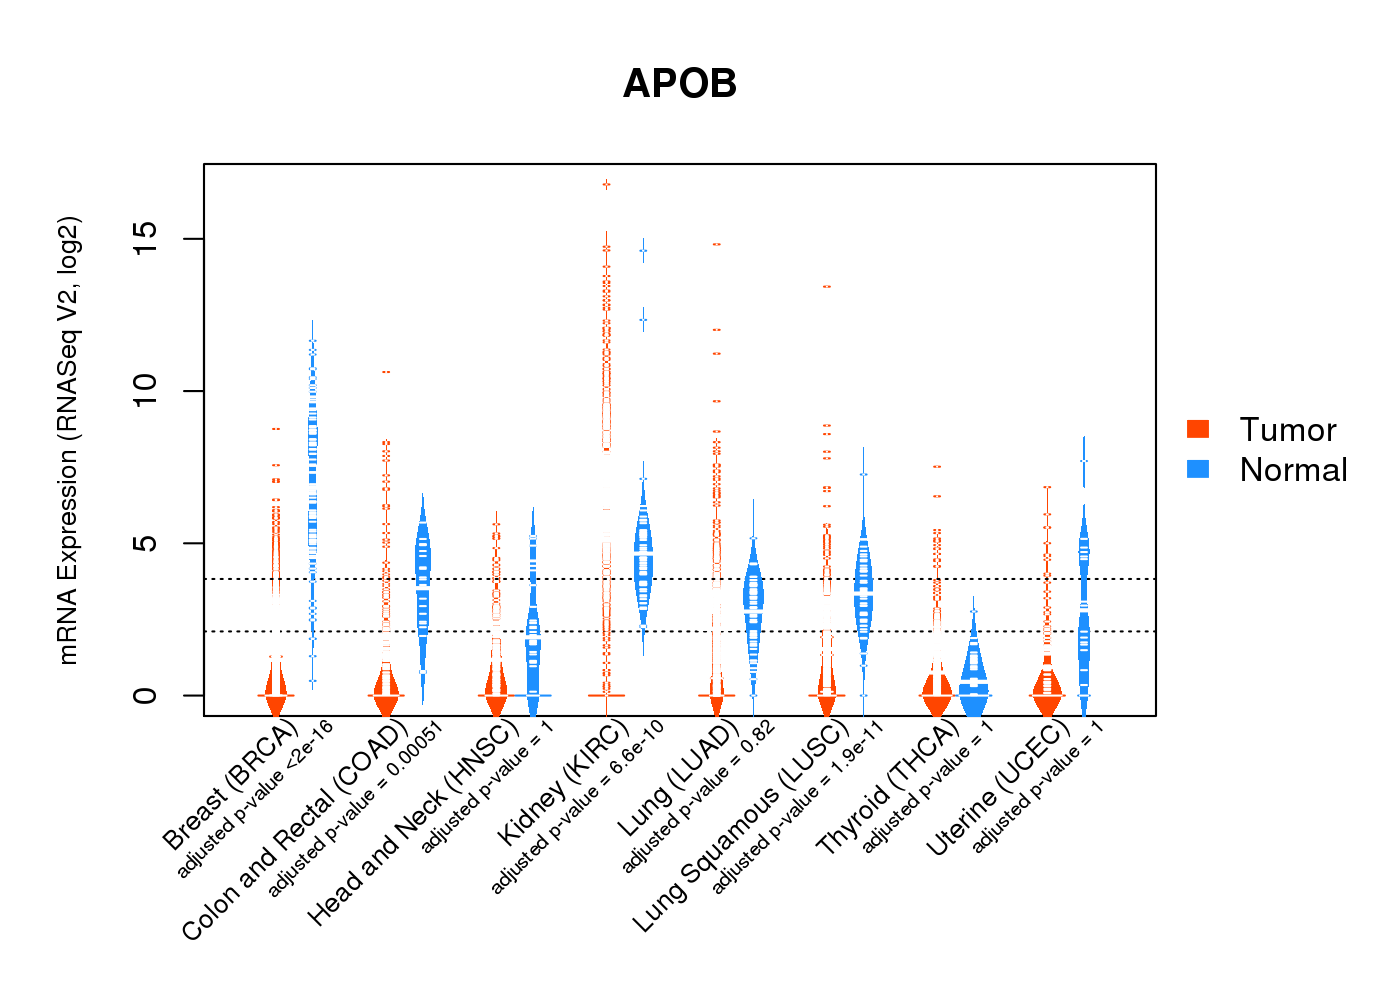
| * Normalized gene expression data of RNASeqV2 was extracted from TCGA using R package TCGA-Assembler. The URLs of all public data files on TCGA DCC data server were gathered at Jan-05-2015. Only eight cancer types have enough normal control samples for differential expression analysis. (t test, adjusted p<0.05 (using Benjamini-Hochberg FDR)) |
 |
| Top |
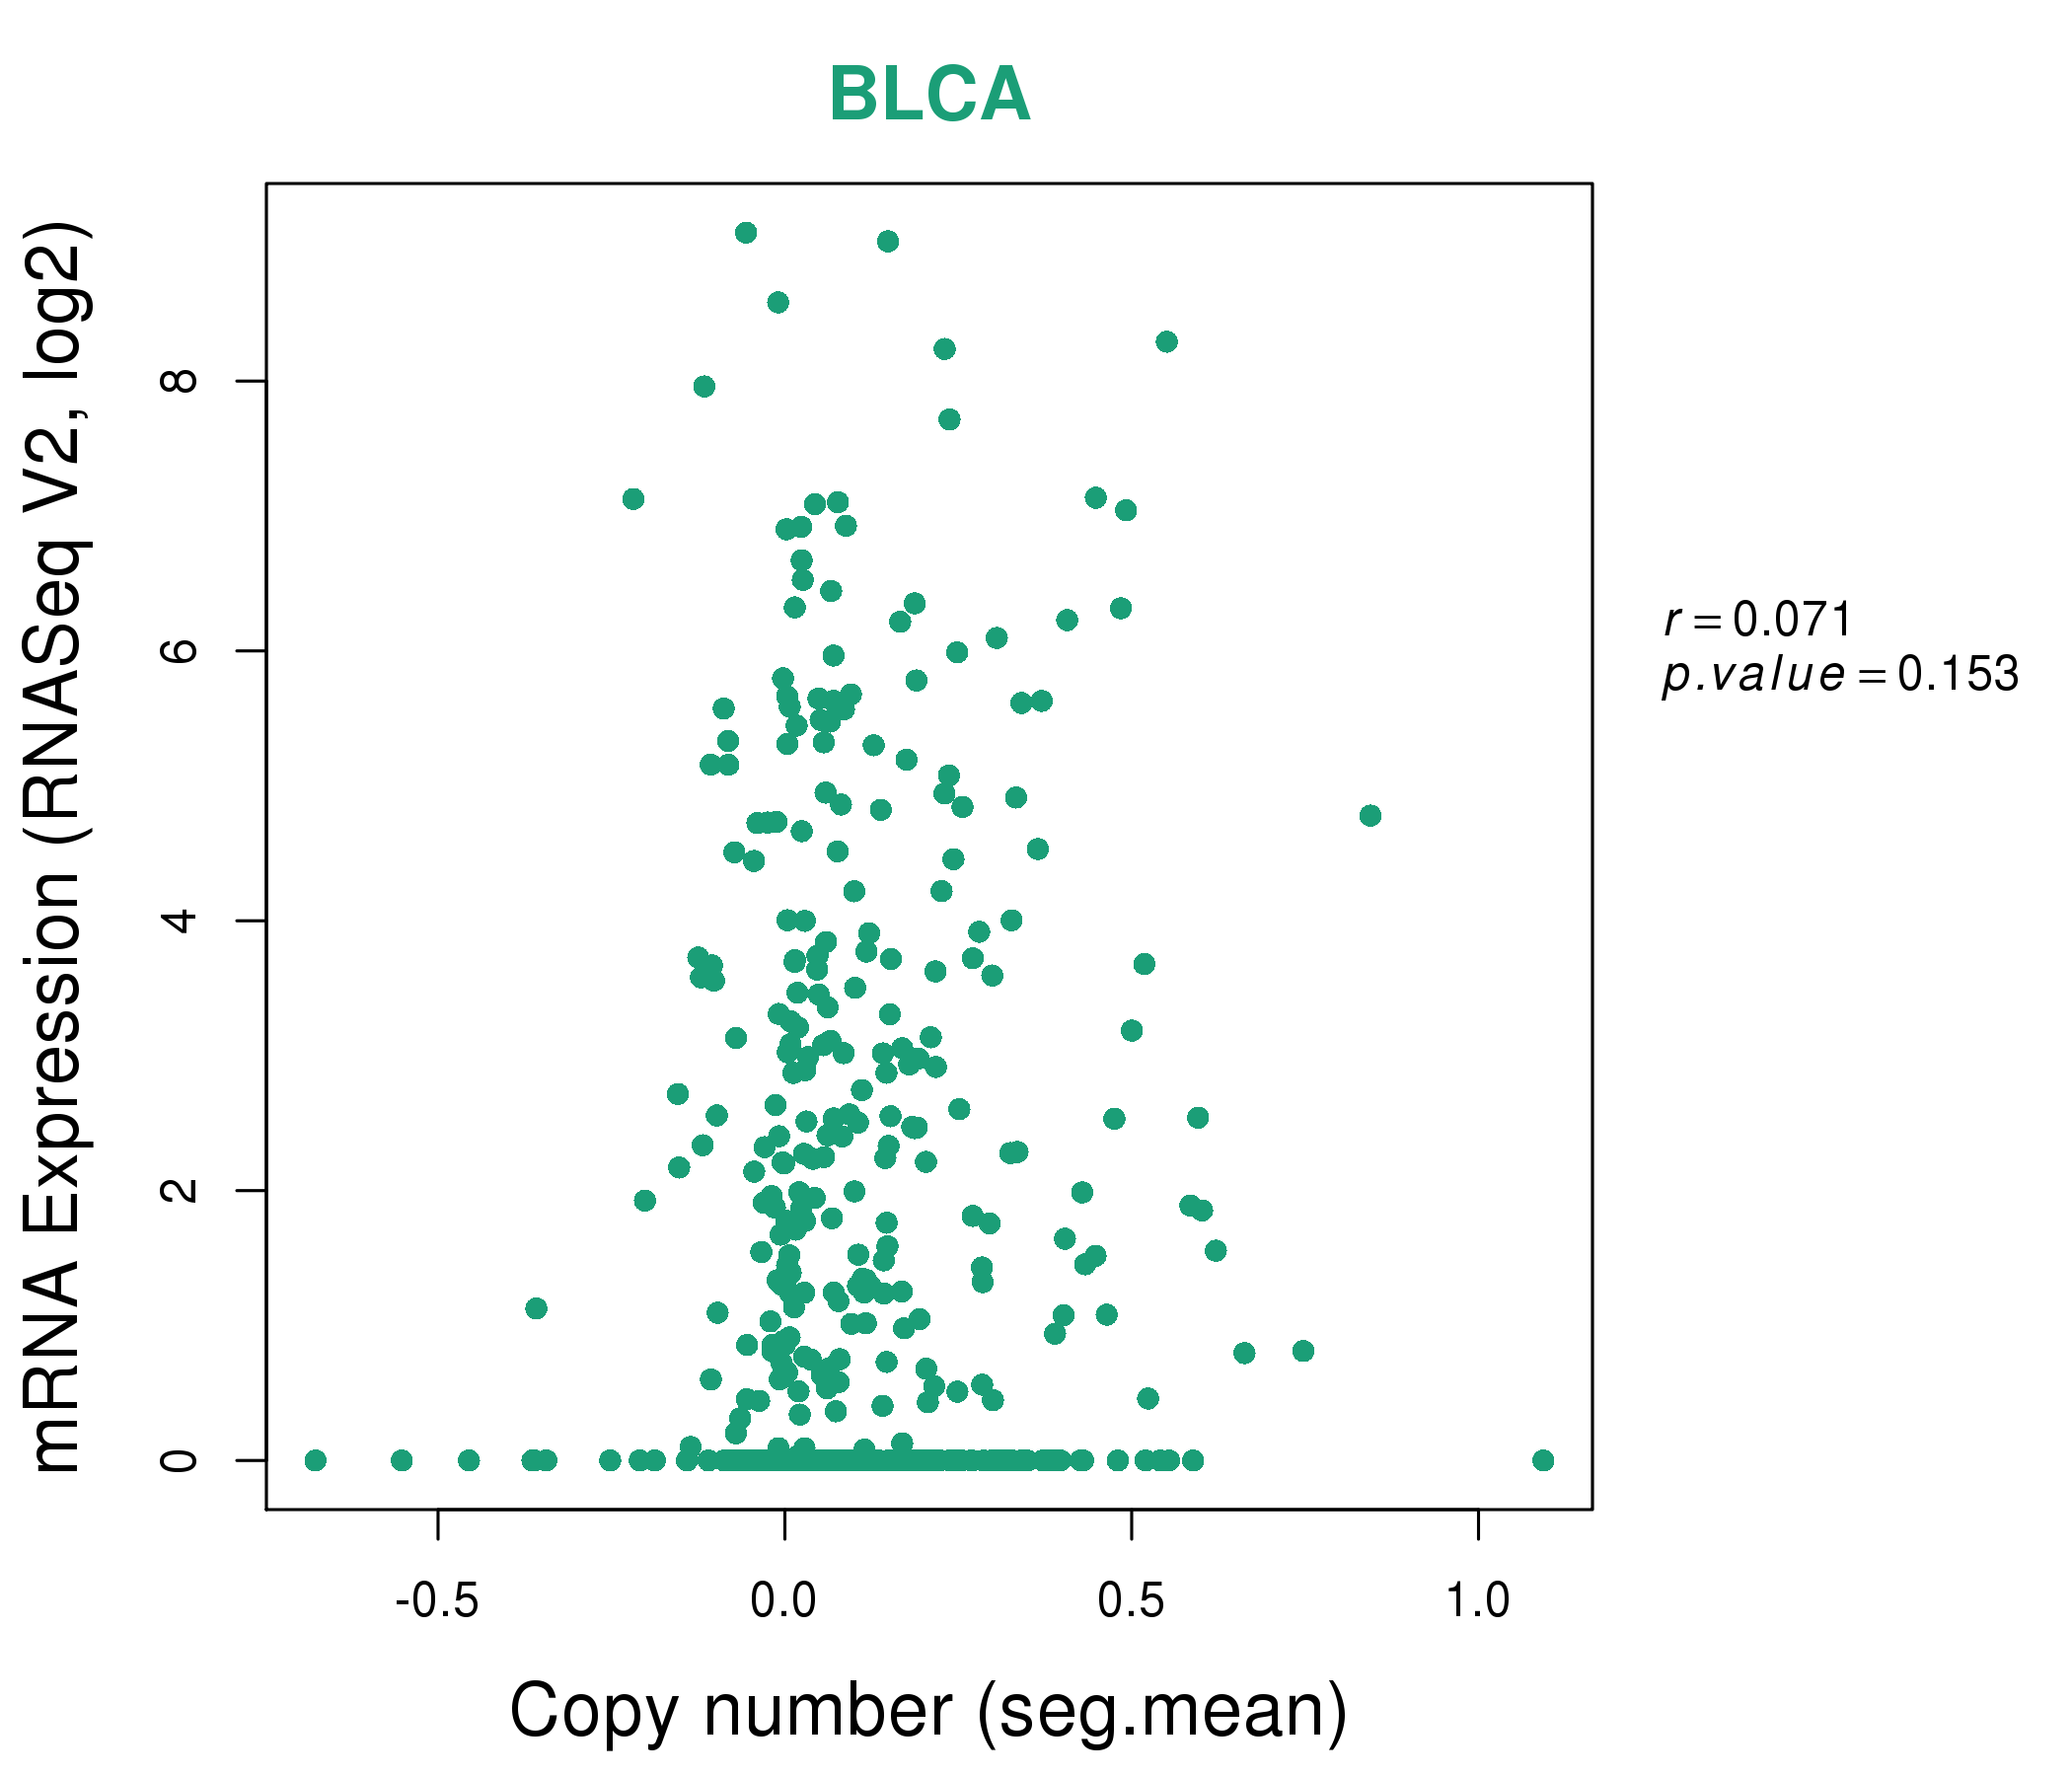
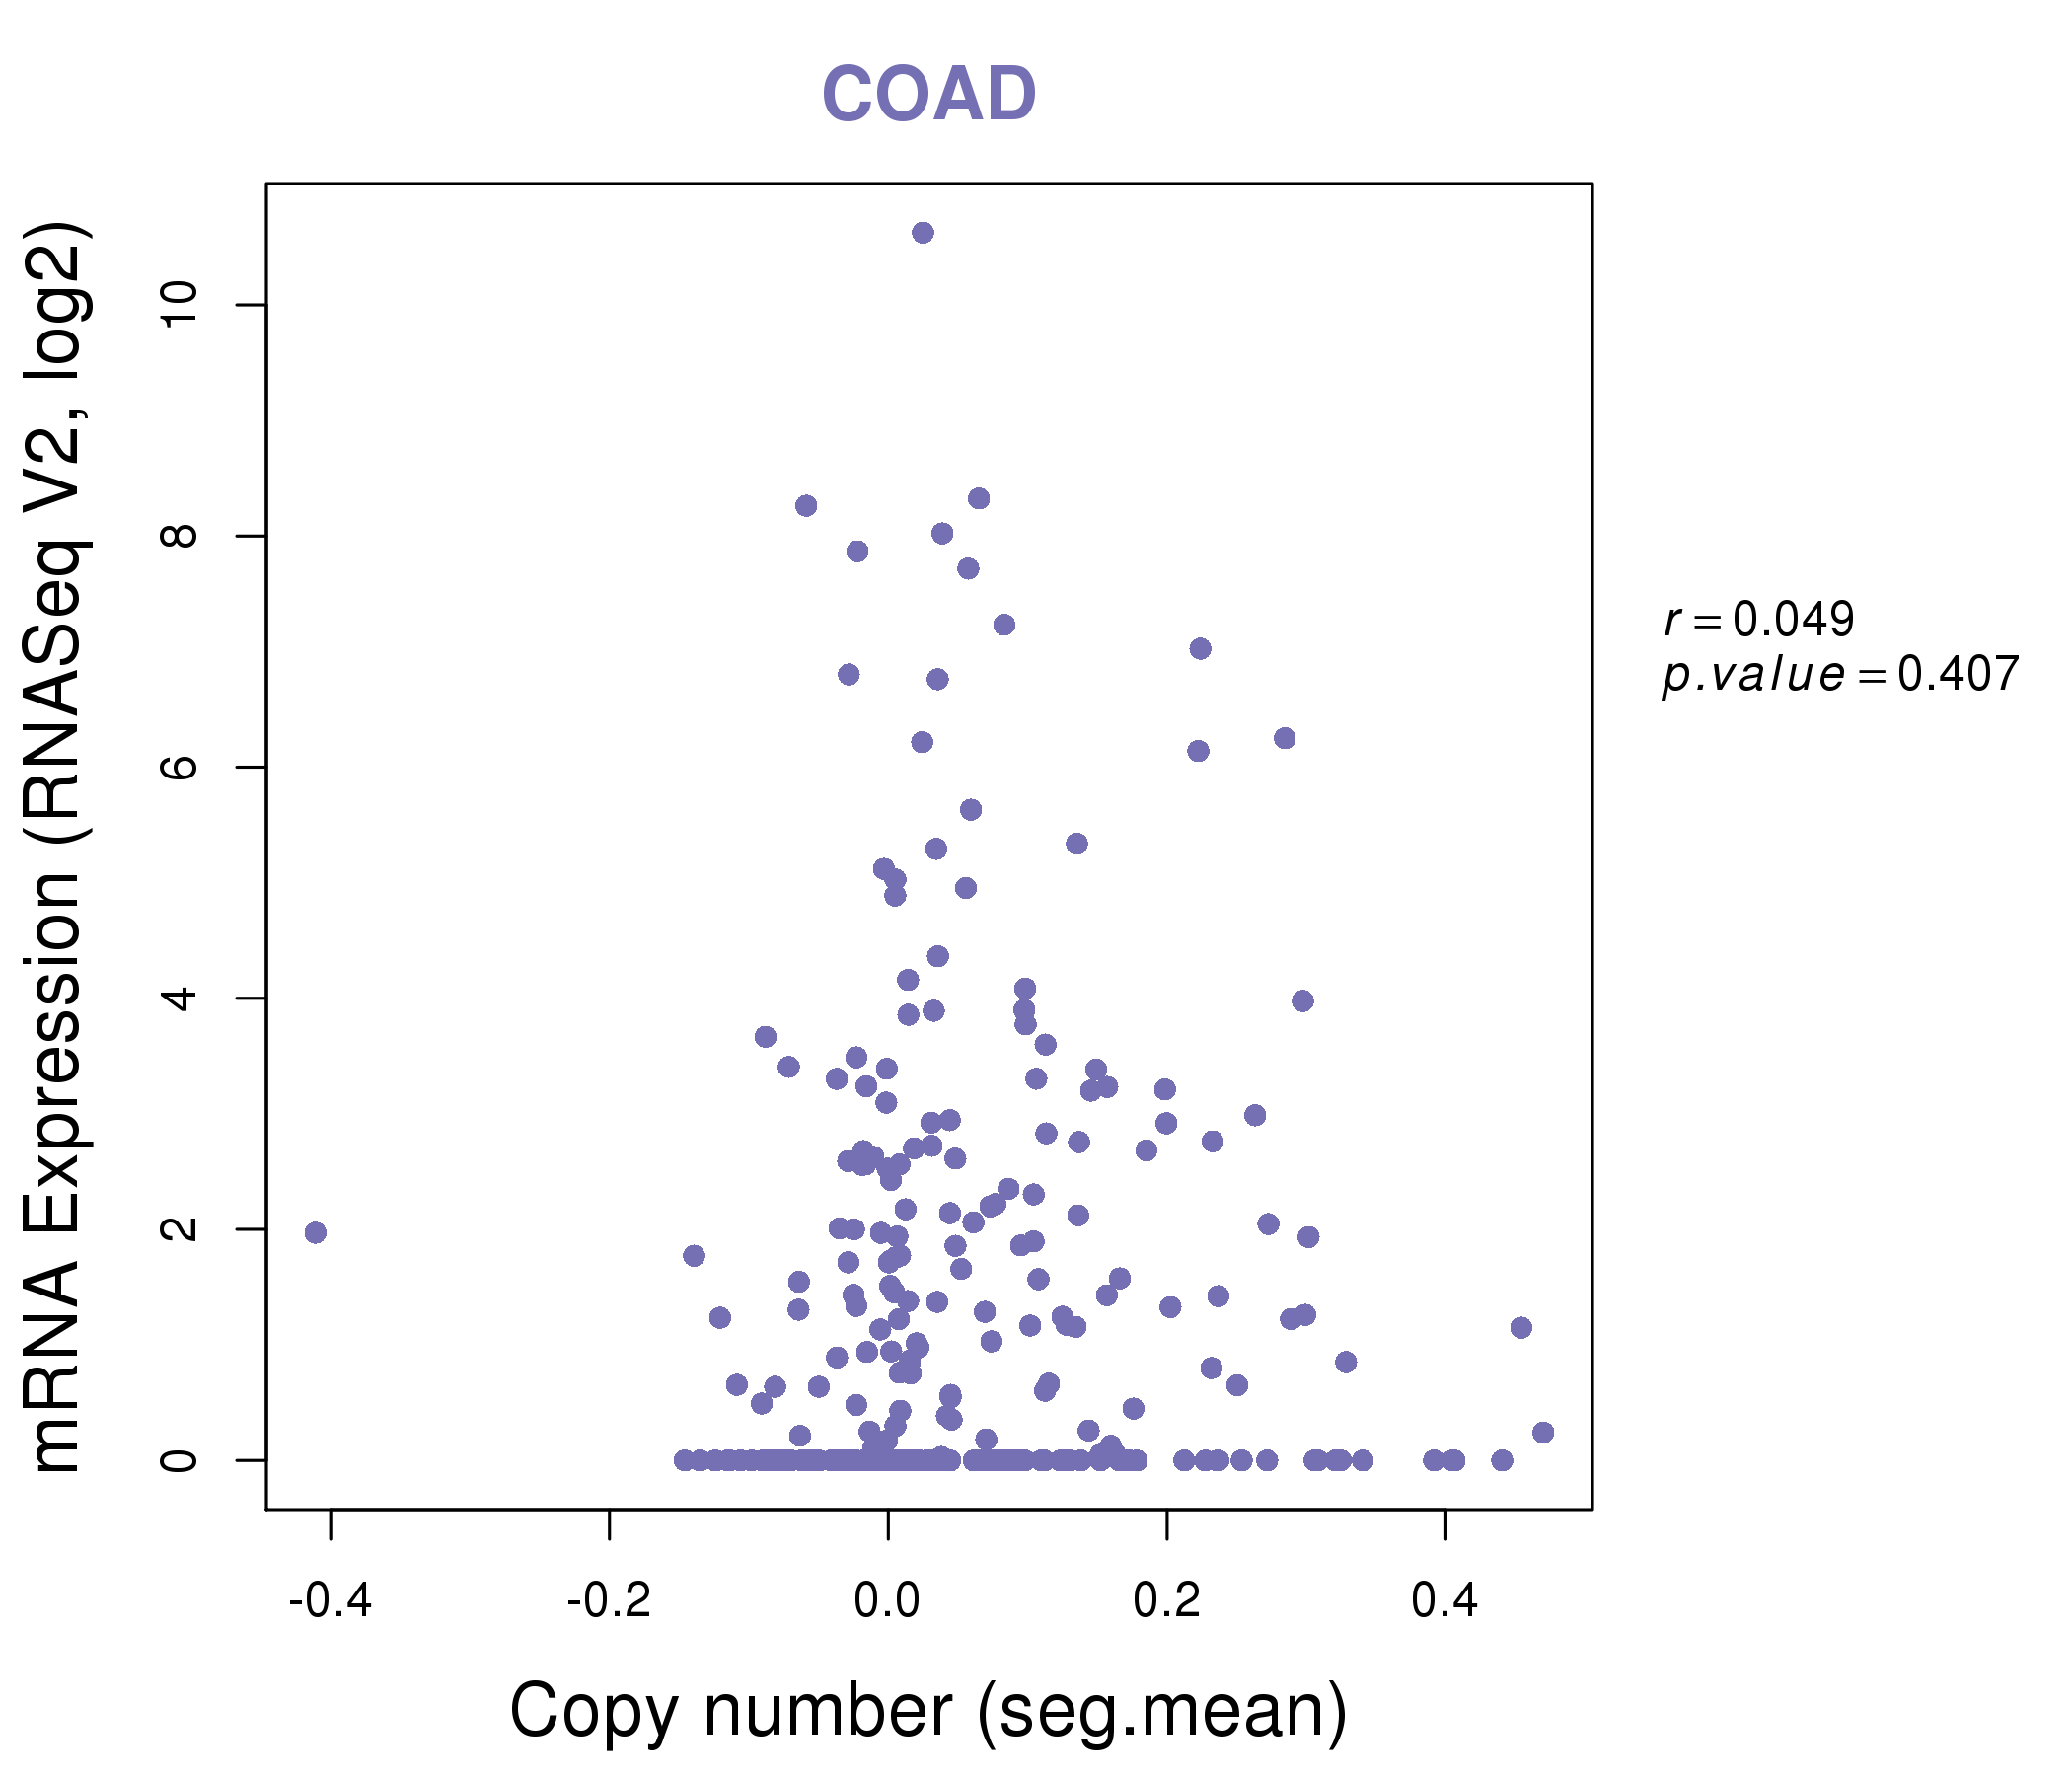
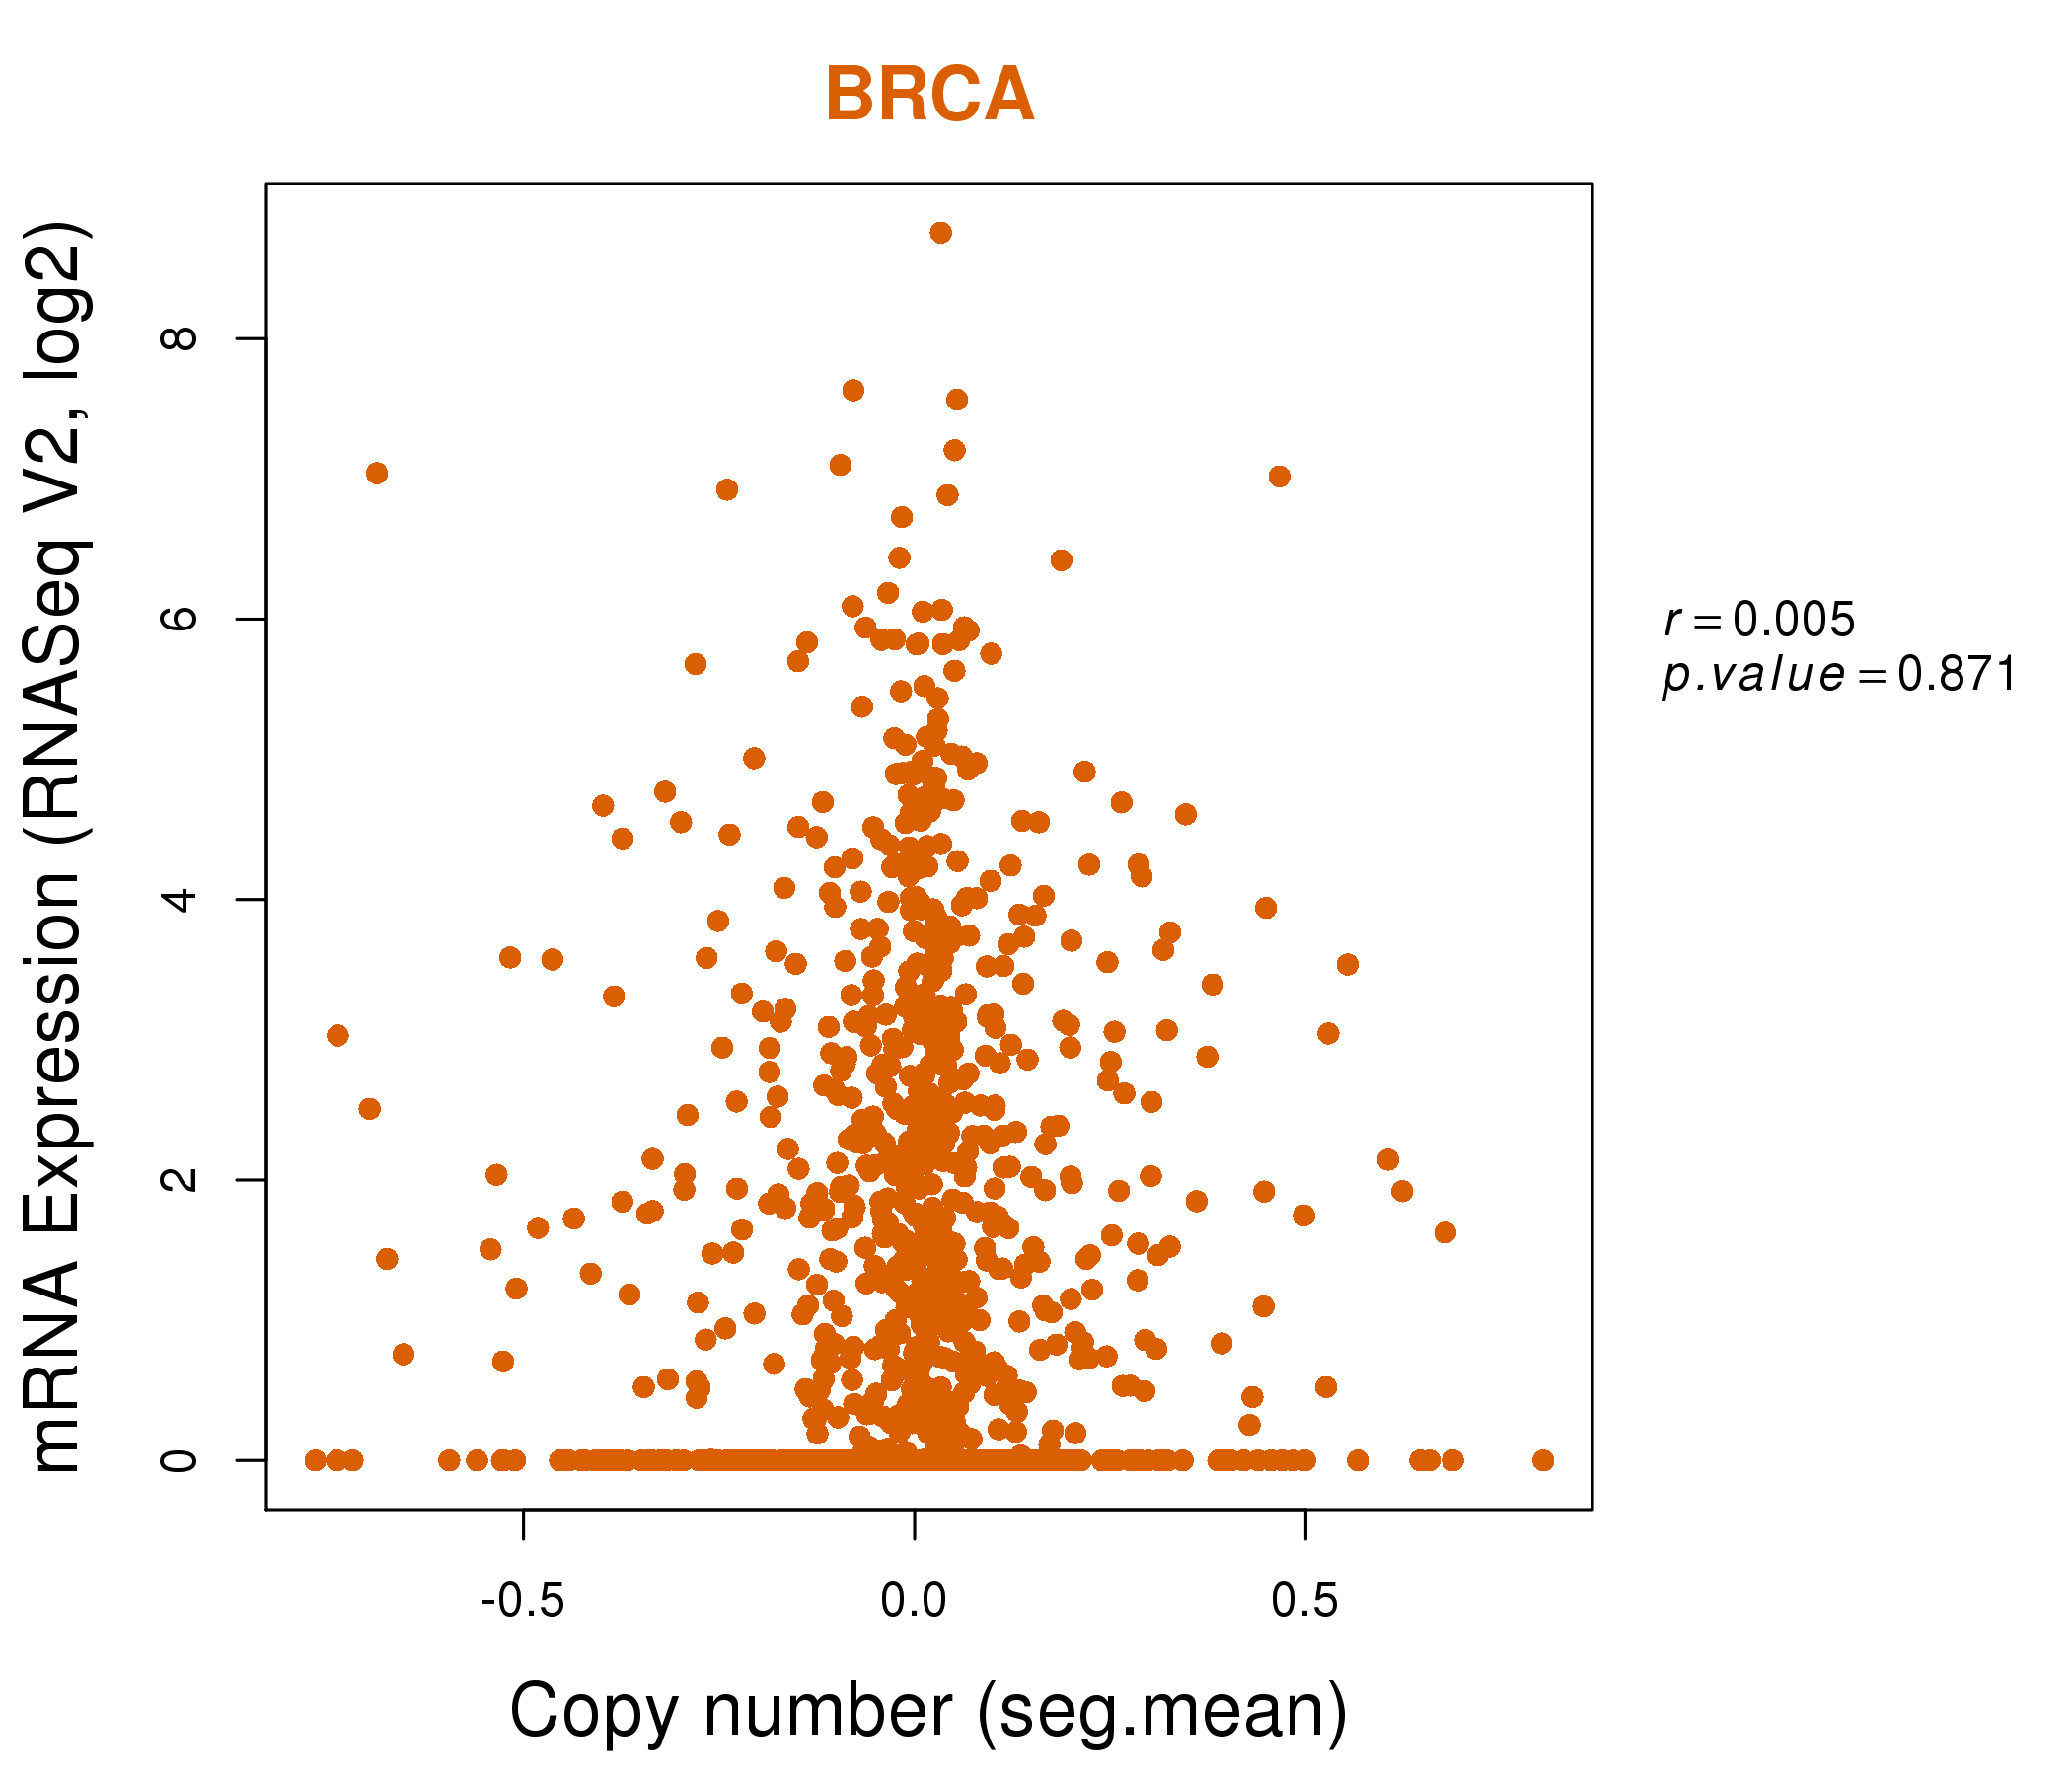
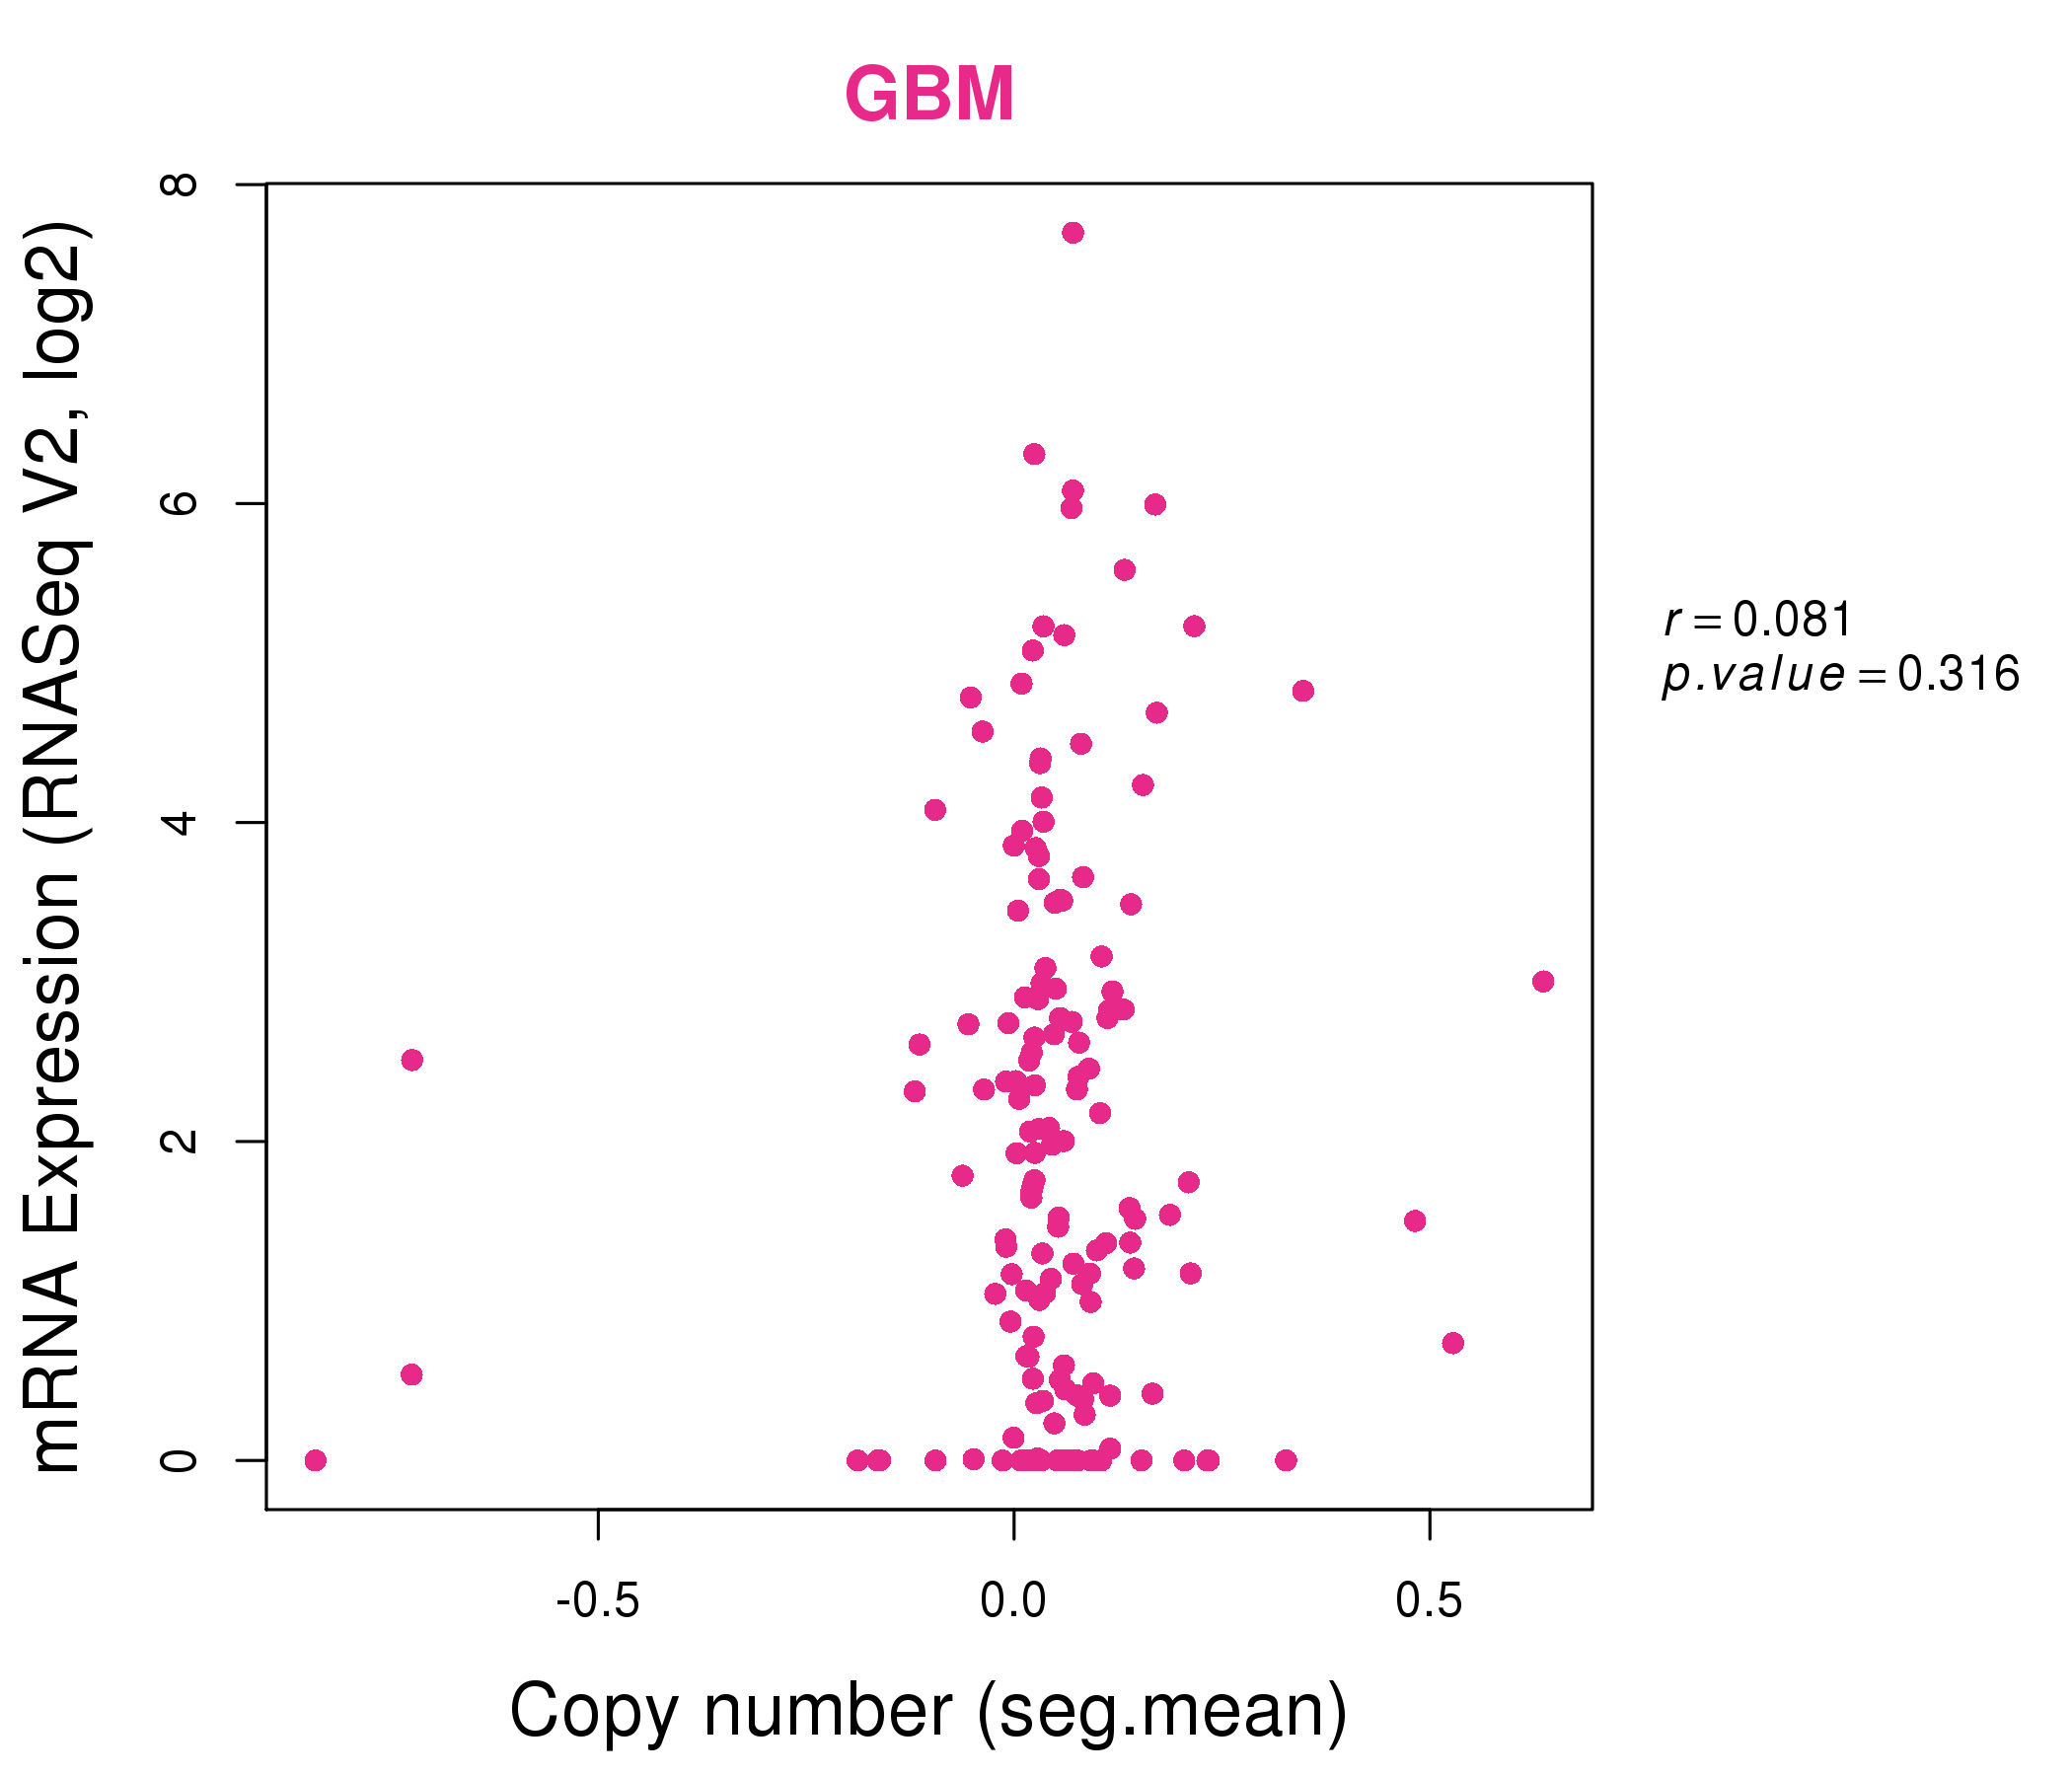
| * This plots show the correlation between CNV and gene expression. |
: Open all plots for all cancer types
 |
|
 |
|
| Top |
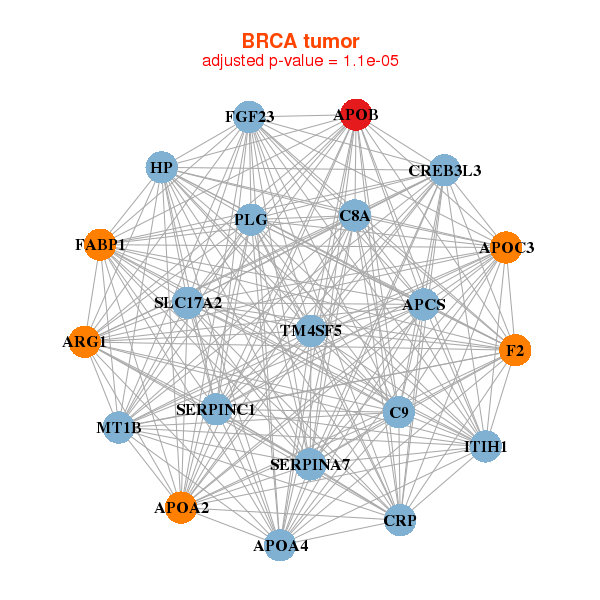
| Gene-Gene Network Information |
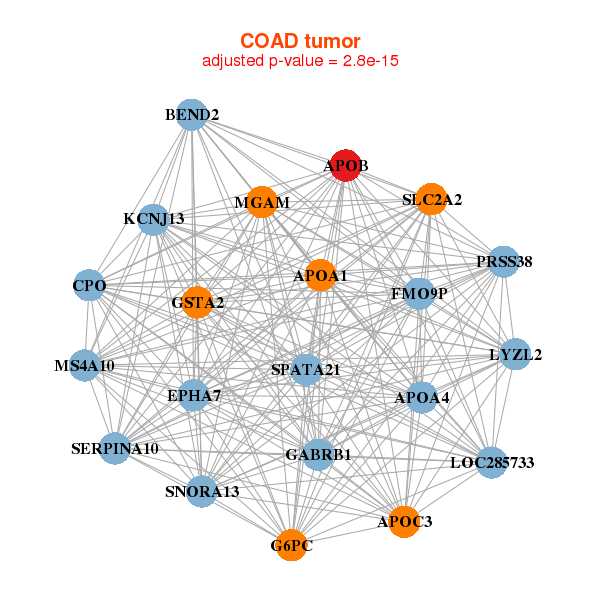
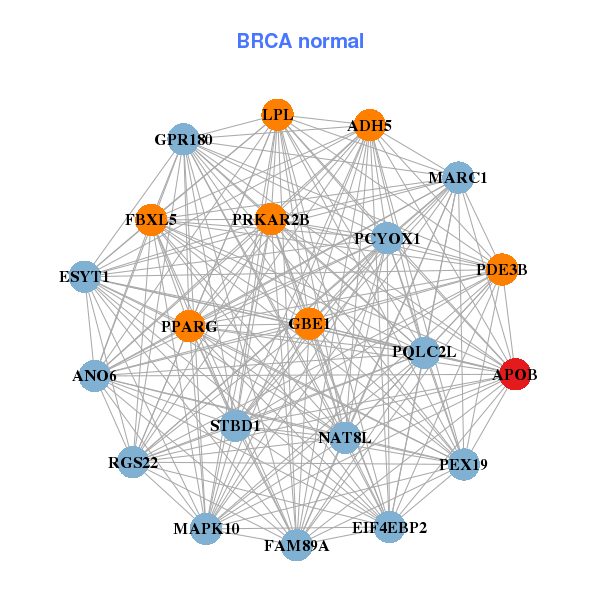
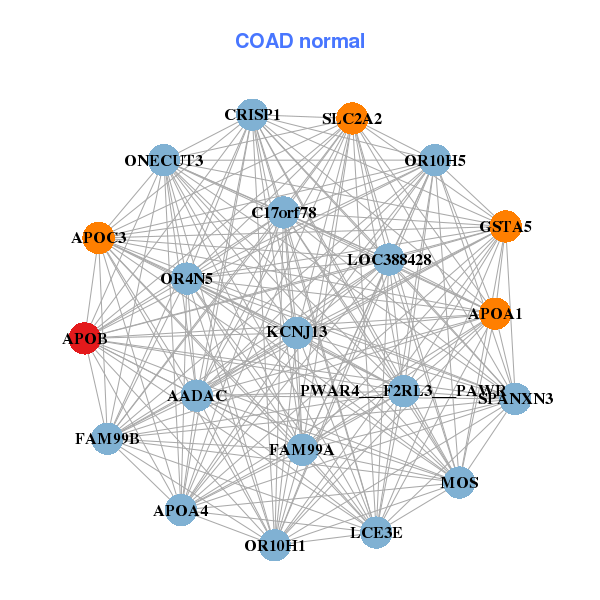
| * Co-Expression network figures were drawn using R package igraph. Only the top 20 genes with the highest correlations were shown. Red circle: input gene, orange circle: cell metabolism gene, sky circle: other gene |
: Open all plots for all cancer types
 |
| ||||
| APCS,APOA2,APOA4,APOB,APOC3,ARG1,C8A, C9,CREB3L3,CRP,F2,FABP1,FGF23,HP, ITIH1,MT1B,PLG,SERPINA7,SERPINC1,SLC17A2,TM4SF5 | ADH5,ANO6,APOB,PQLC2L,EIF4EBP2,ESYT1,FAM89A, FBXL5,GBE1,GPR180,LPL,MAPK10,MARC1,NAT8L, PCYOX1,PDE3B,PEX19,PPARG,PRKAR2B,RGS22,STBD1 | ||||
 |
| ||||
| APOA1,APOA4,APOB,APOC3,BEND2,CPO,EPHA7, FMO9P,G6PC,GABRB1,GSTA2,KCNJ13,LOC285733,LYZL2, MGAM,MS4A10,PRSS38,SERPINA10,SLC2A2,SNORA13,SPATA21 | AADAC,APOA1,APOA4,APOB,APOC3,C17orf78,CRISP1, FAM99A,FAM99B,GSTA5,KCNJ13,LCE3E,LOC388428,MOS, ONECUT3,OR10H1,OR10H5,OR4N5,PWAR4___F2RL3___PAWR,SLC2A2,SPANXN3 |
| * Co-Expression network figures were drawn using R package igraph. Only the top 20 genes with the highest correlations were shown. Red circle: input gene, orange circle: cell metabolism gene, sky circle: other gene |
: Open all plots for all cancer types
| Top |
: Open all interacting genes' information including KEGG pathway for all interacting genes from DAVID
| Top |
| Pharmacological Information for APOB |
| DB Category | DB Name | DB's ID and Url link |
| * Gene Centered Interaction Network. |
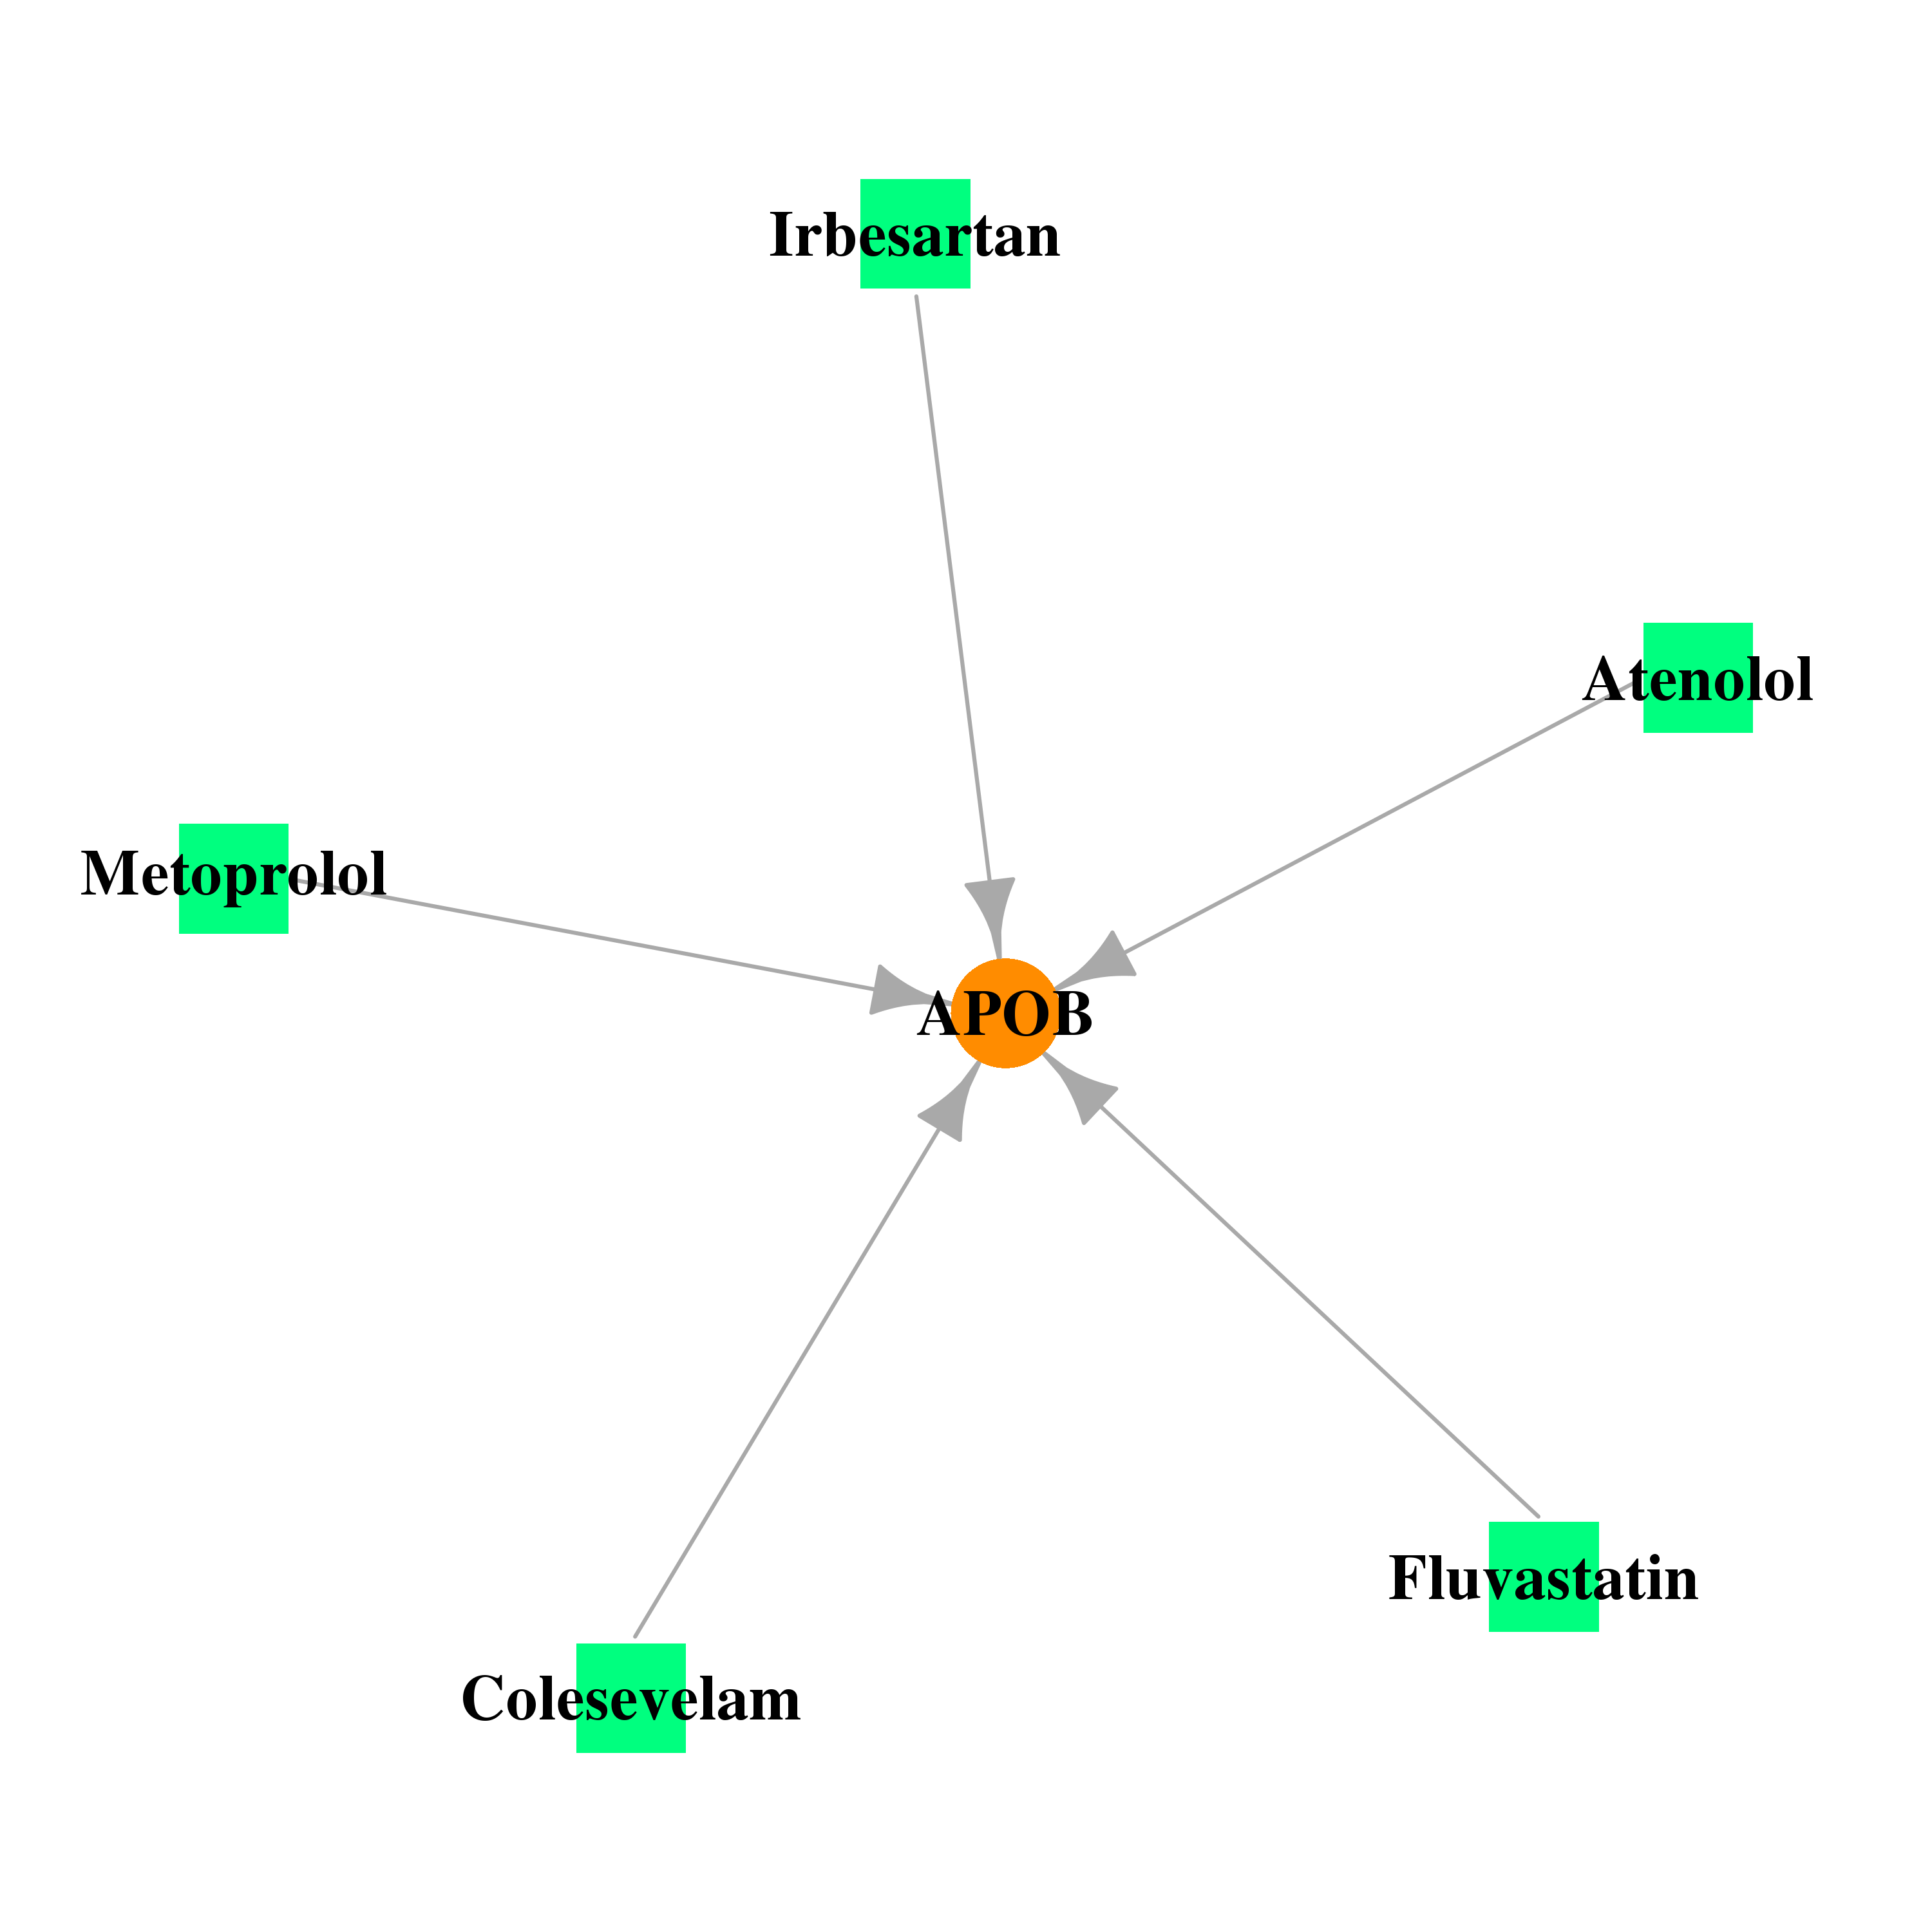 |
| * Drug Centered Interaction Network. |
| DrugBank ID | Target Name | Drug Groups | Generic Name | Drug Centered Network | Drug Structure |
| DB01095 | apolipoprotein B | approved | Fluvastatin | 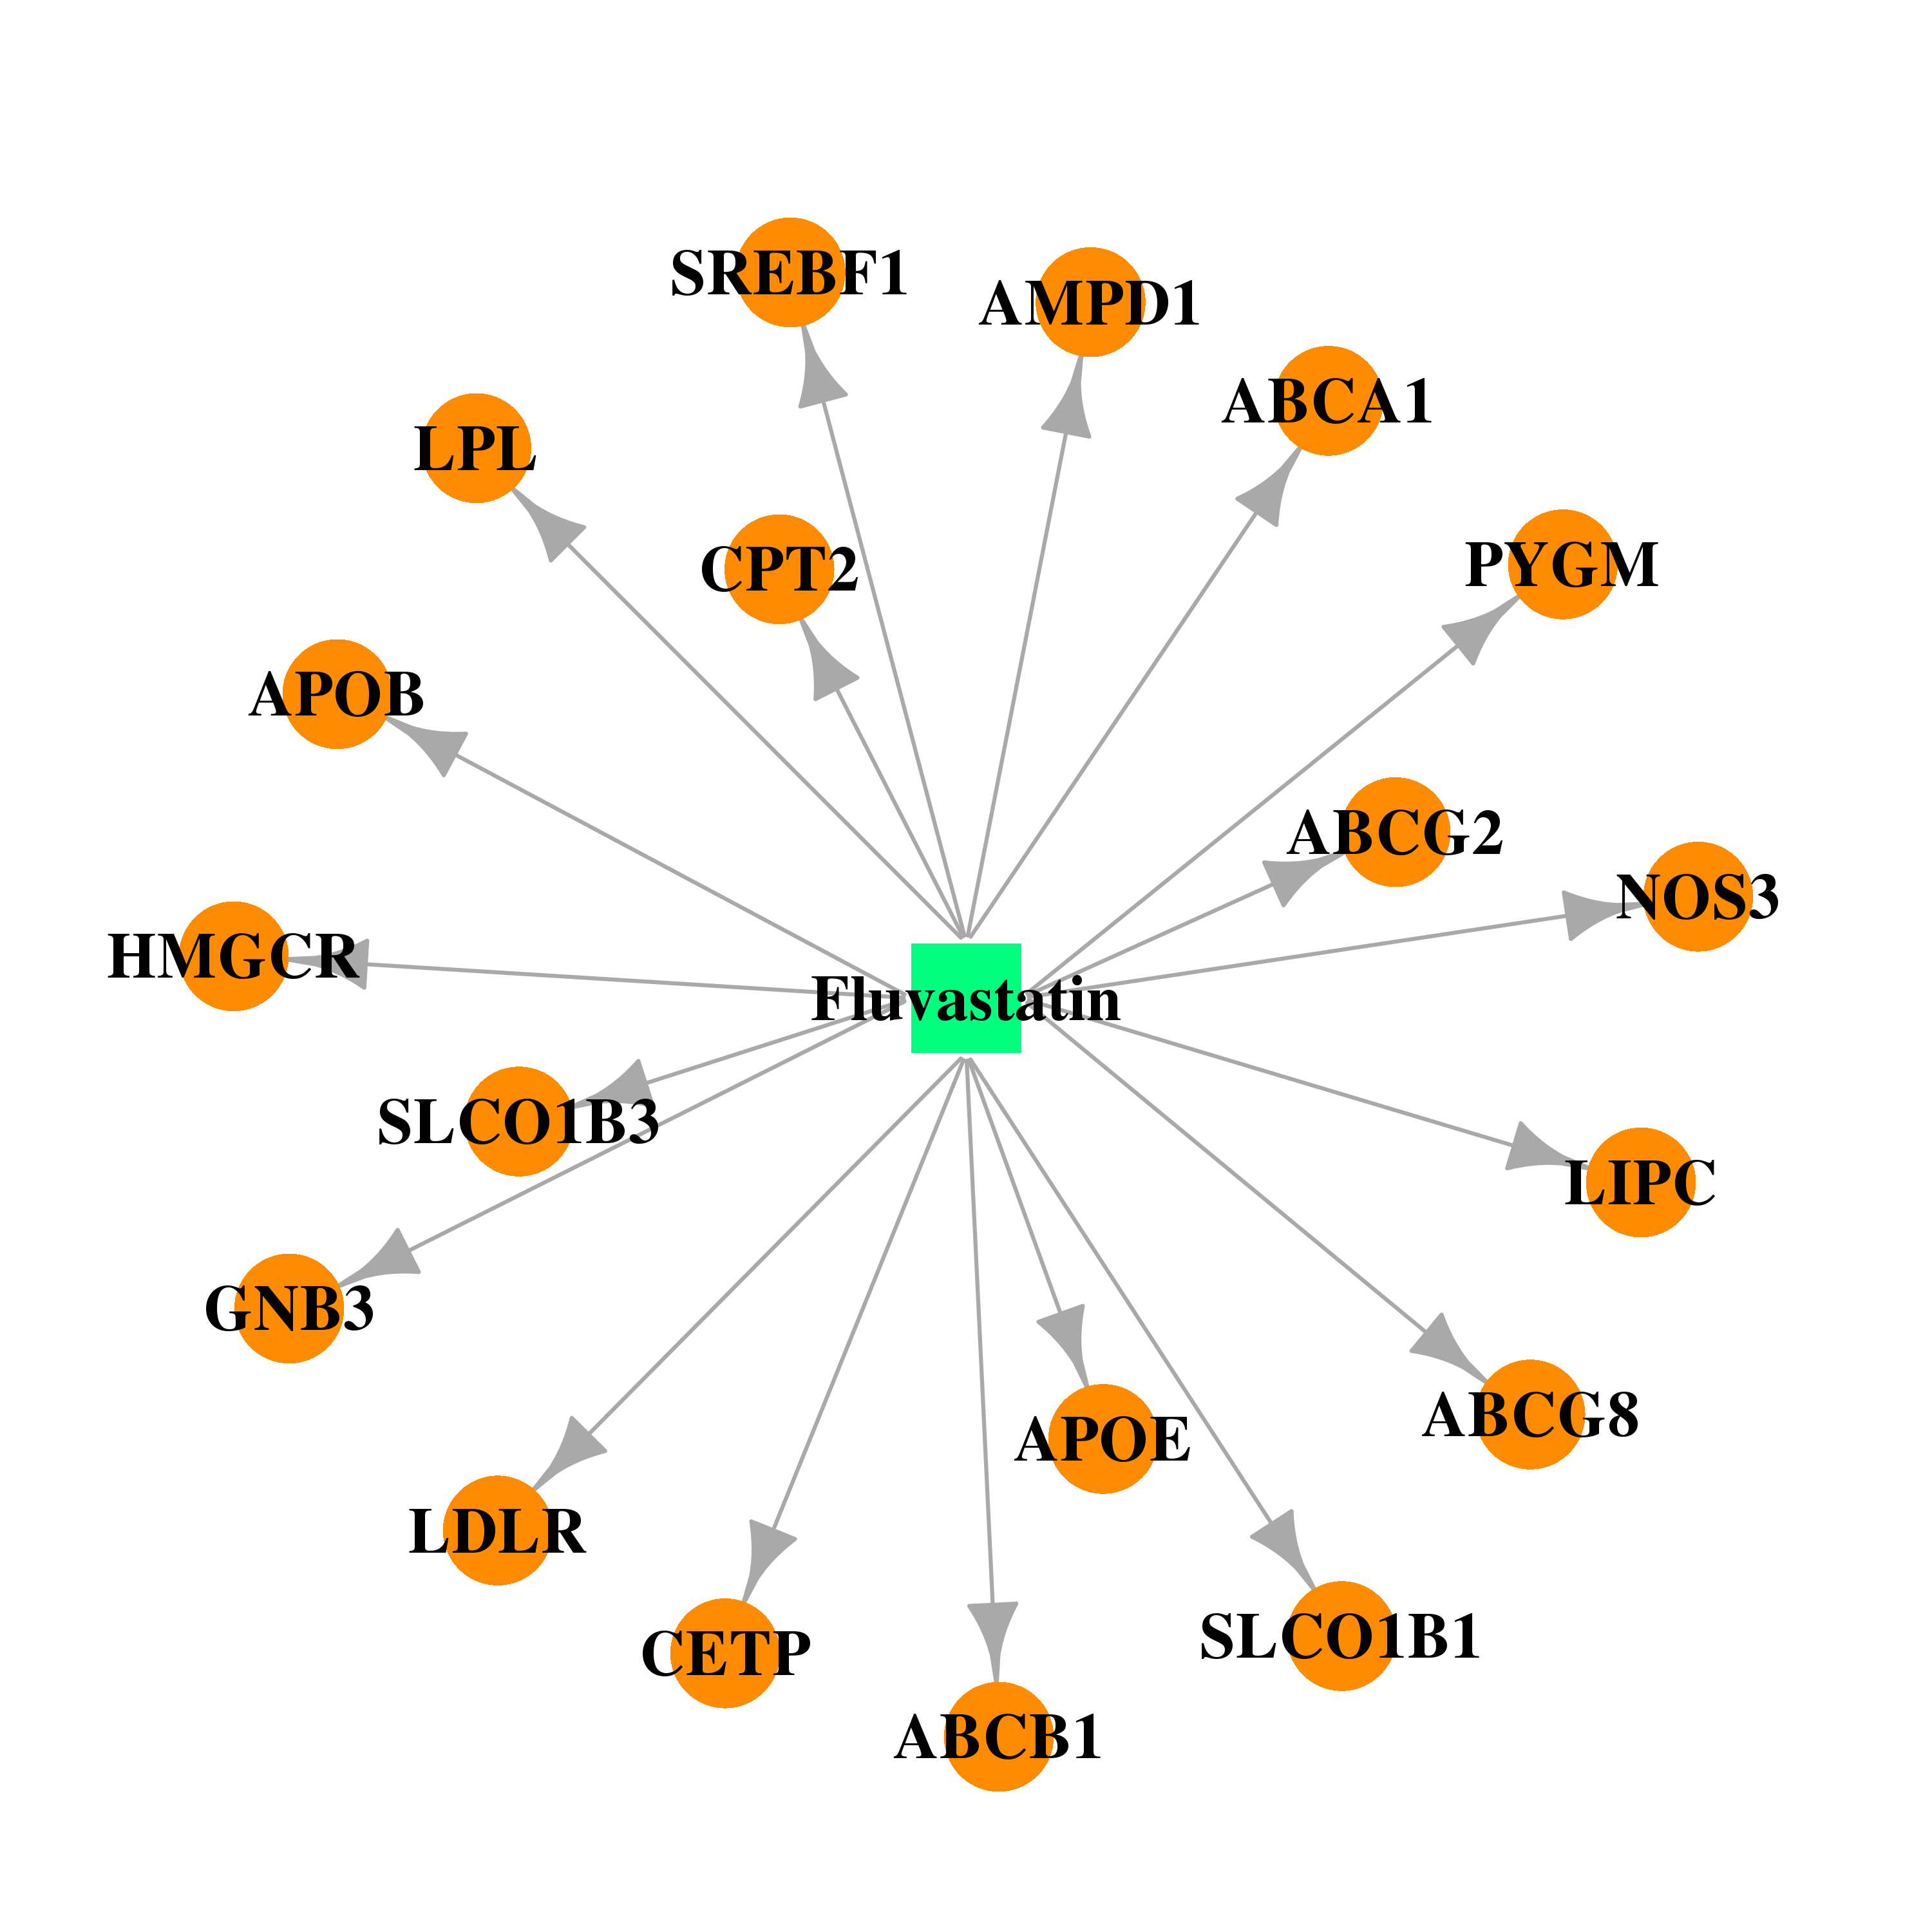 | 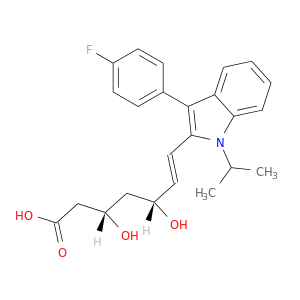 |
| DB00335 | apolipoprotein B | approved | Atenolol | 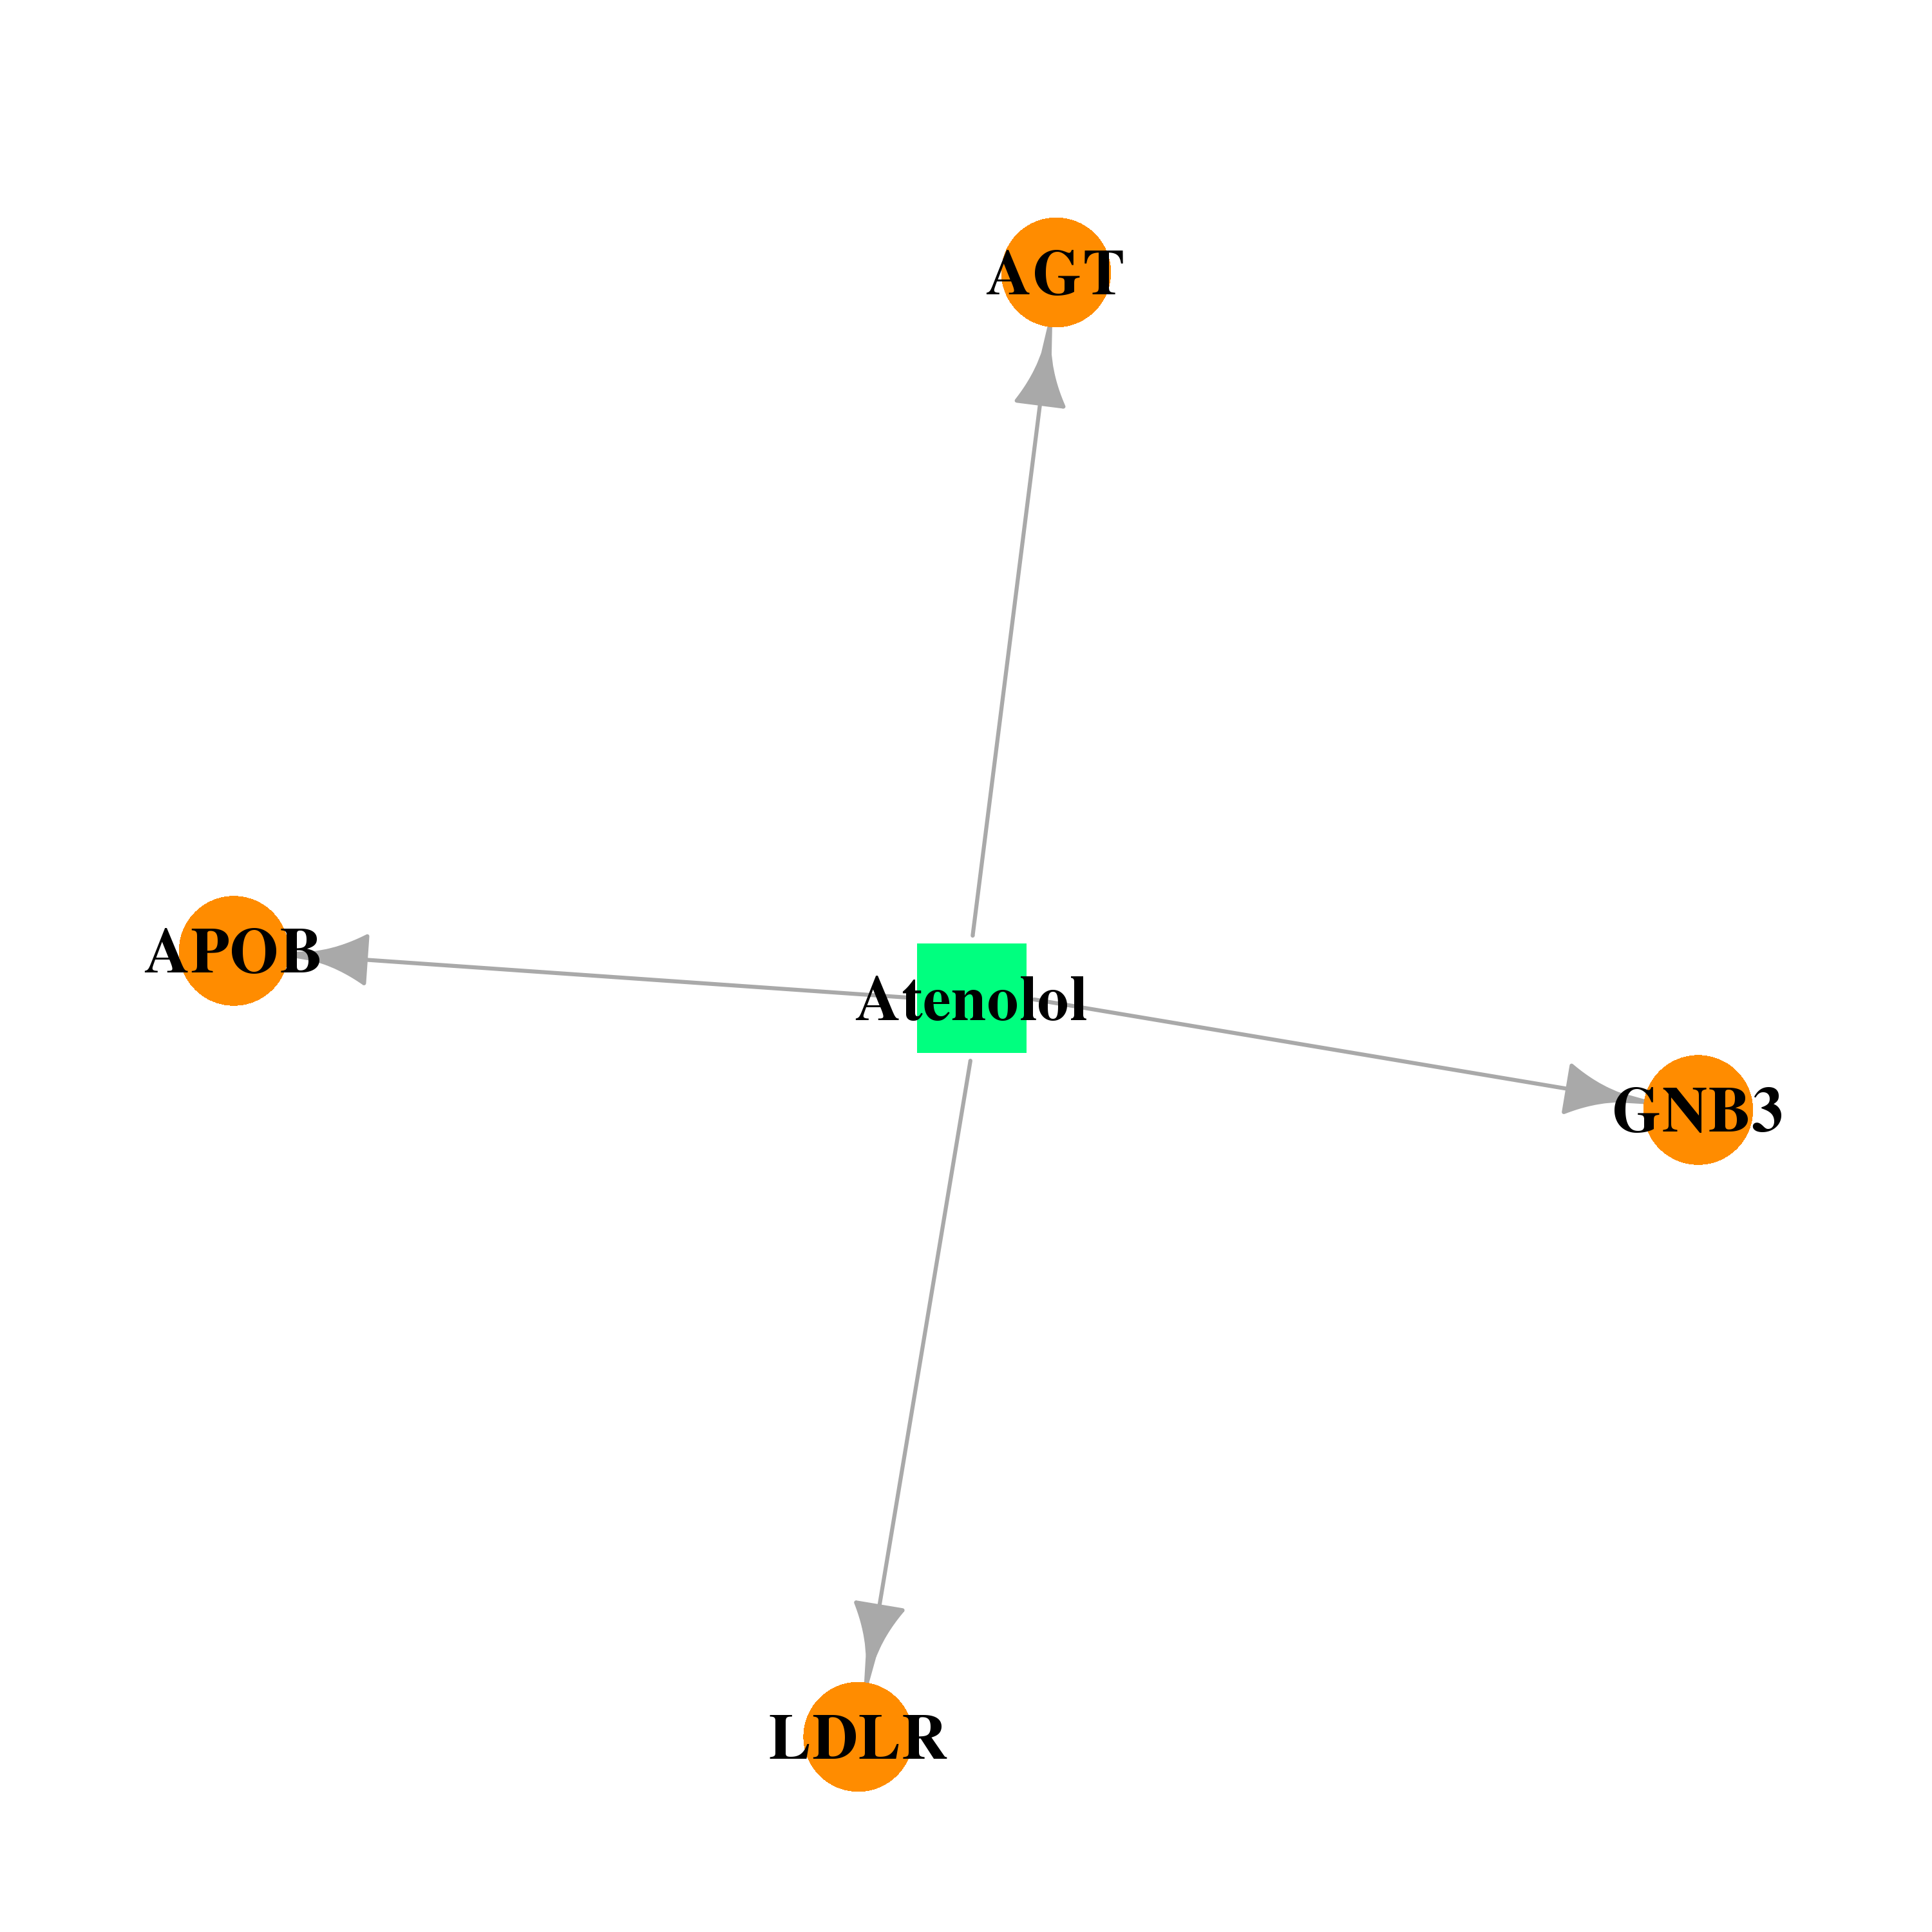 |  |
| DB01029 | apolipoprotein B | approved; investigational | Irbesartan | 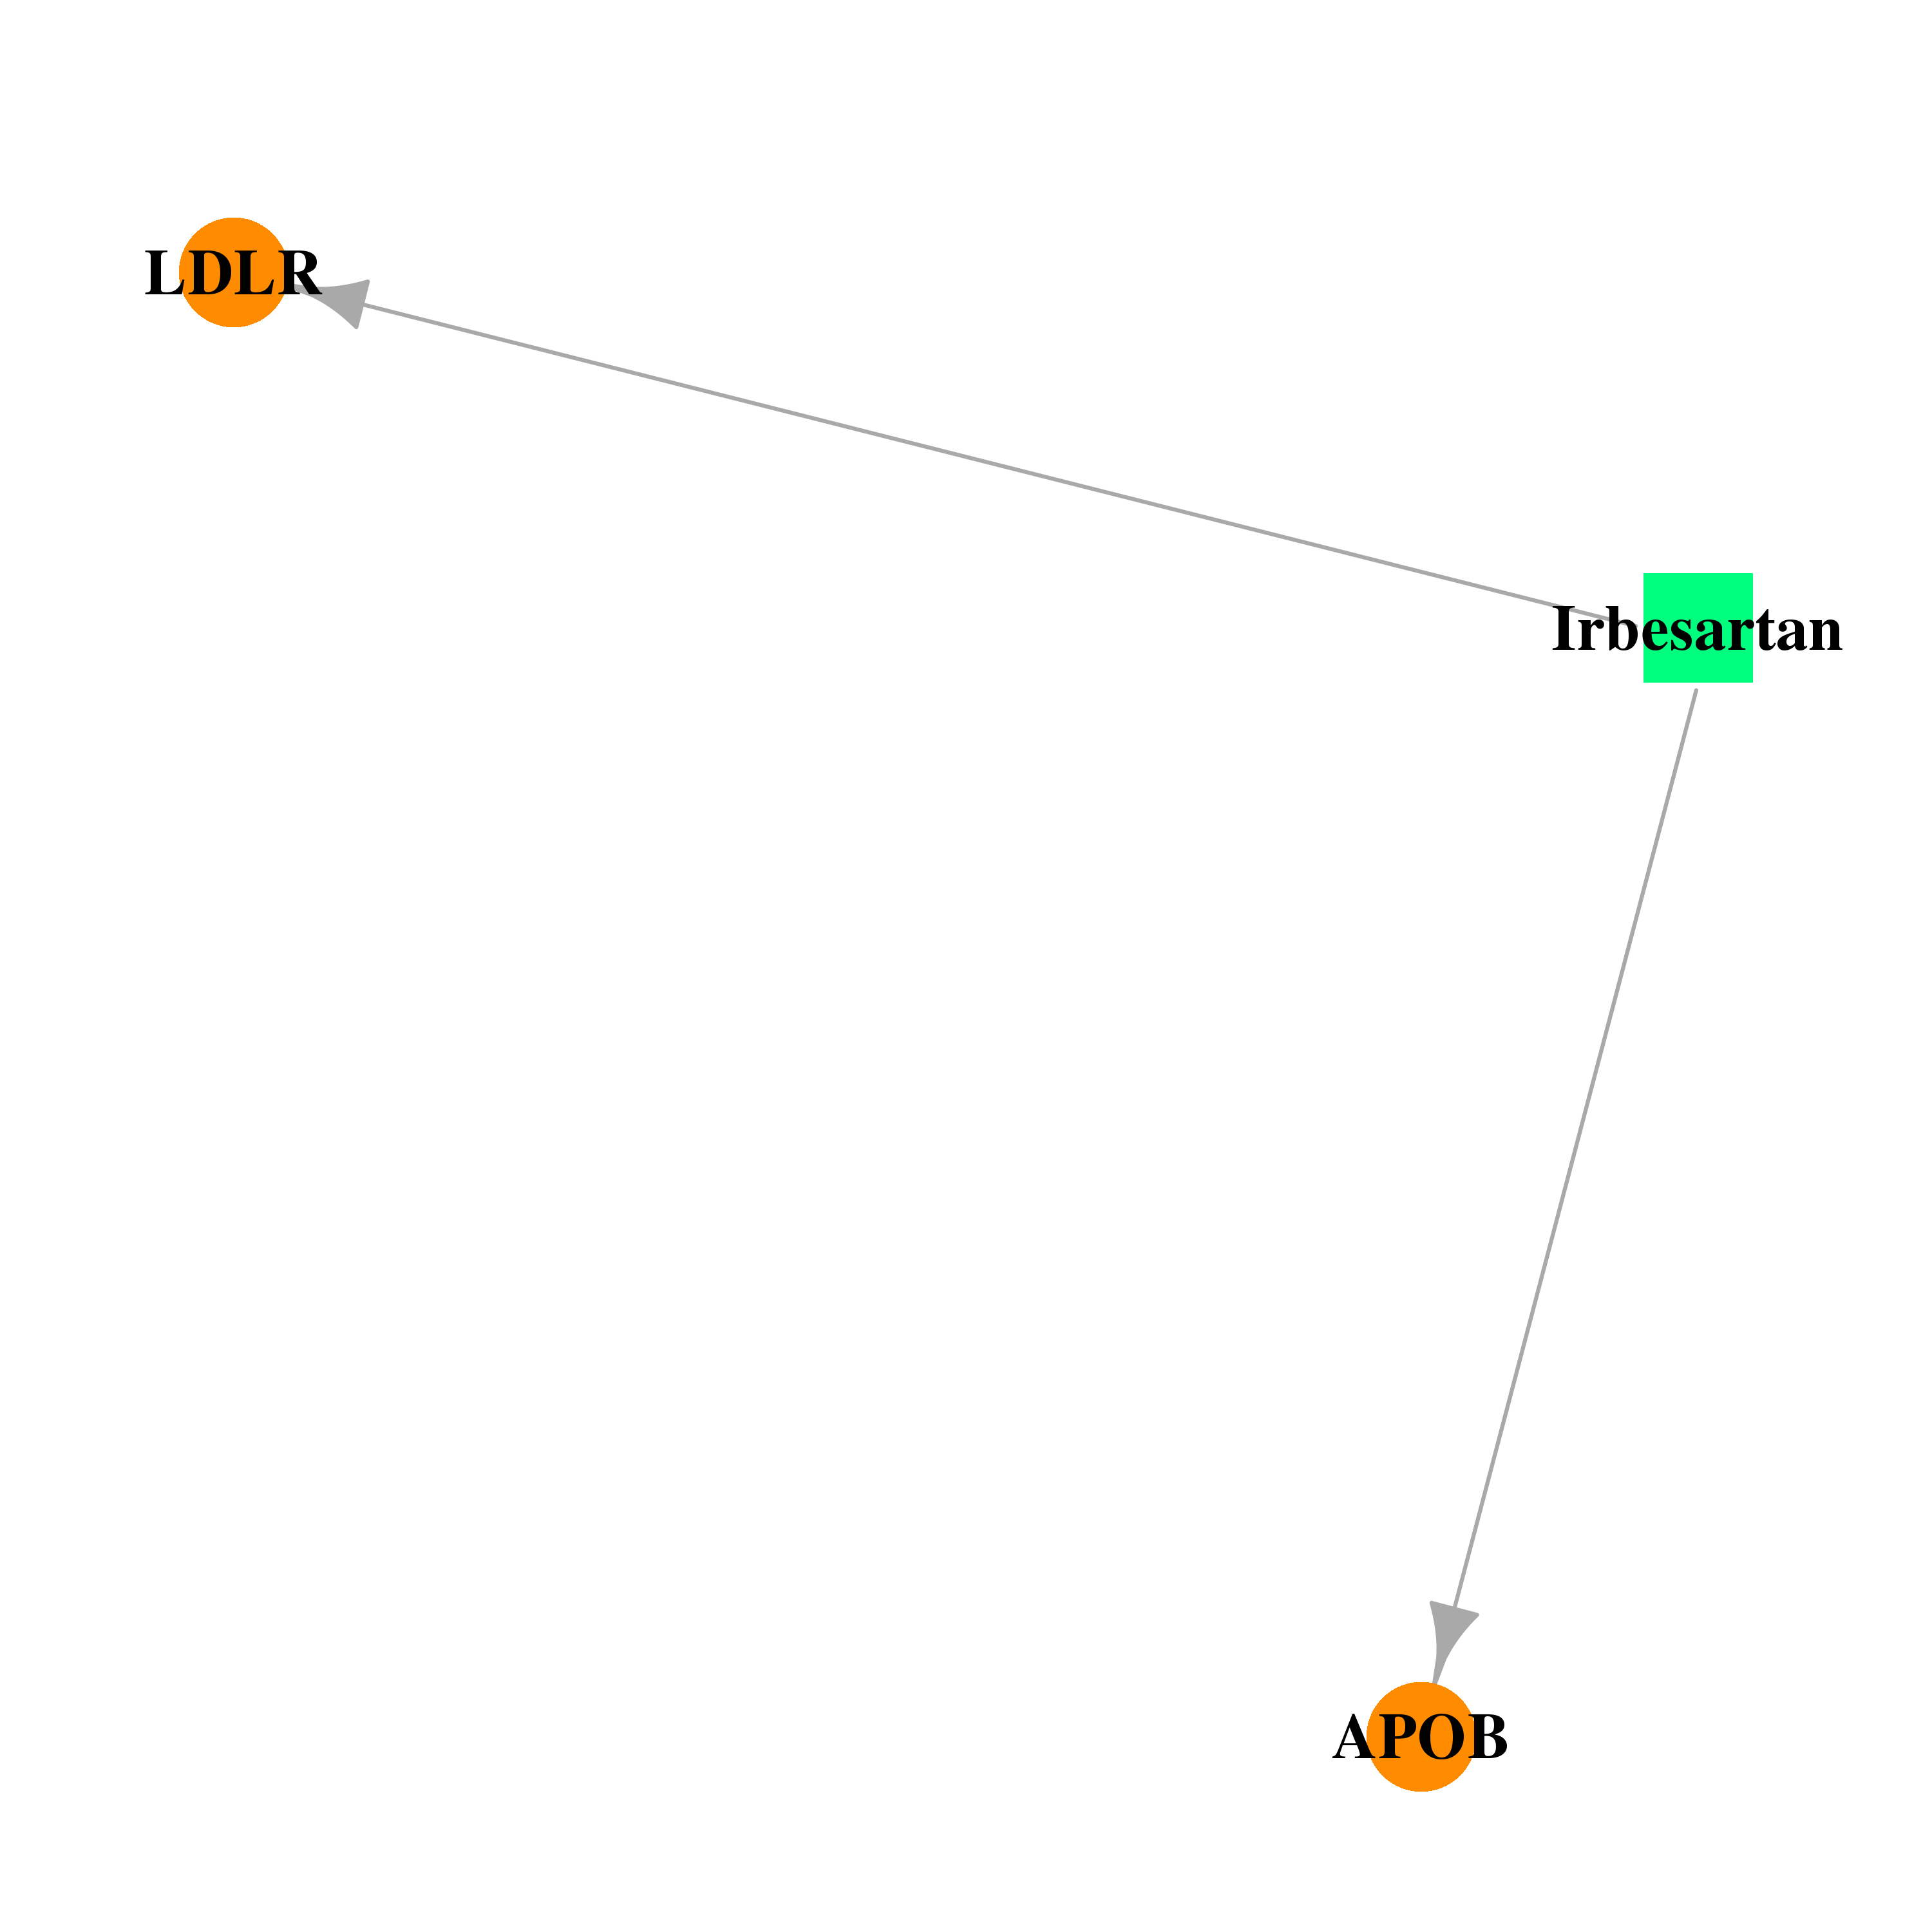 |  |
| DB00930 | apolipoprotein B | approved | Colesevelam | 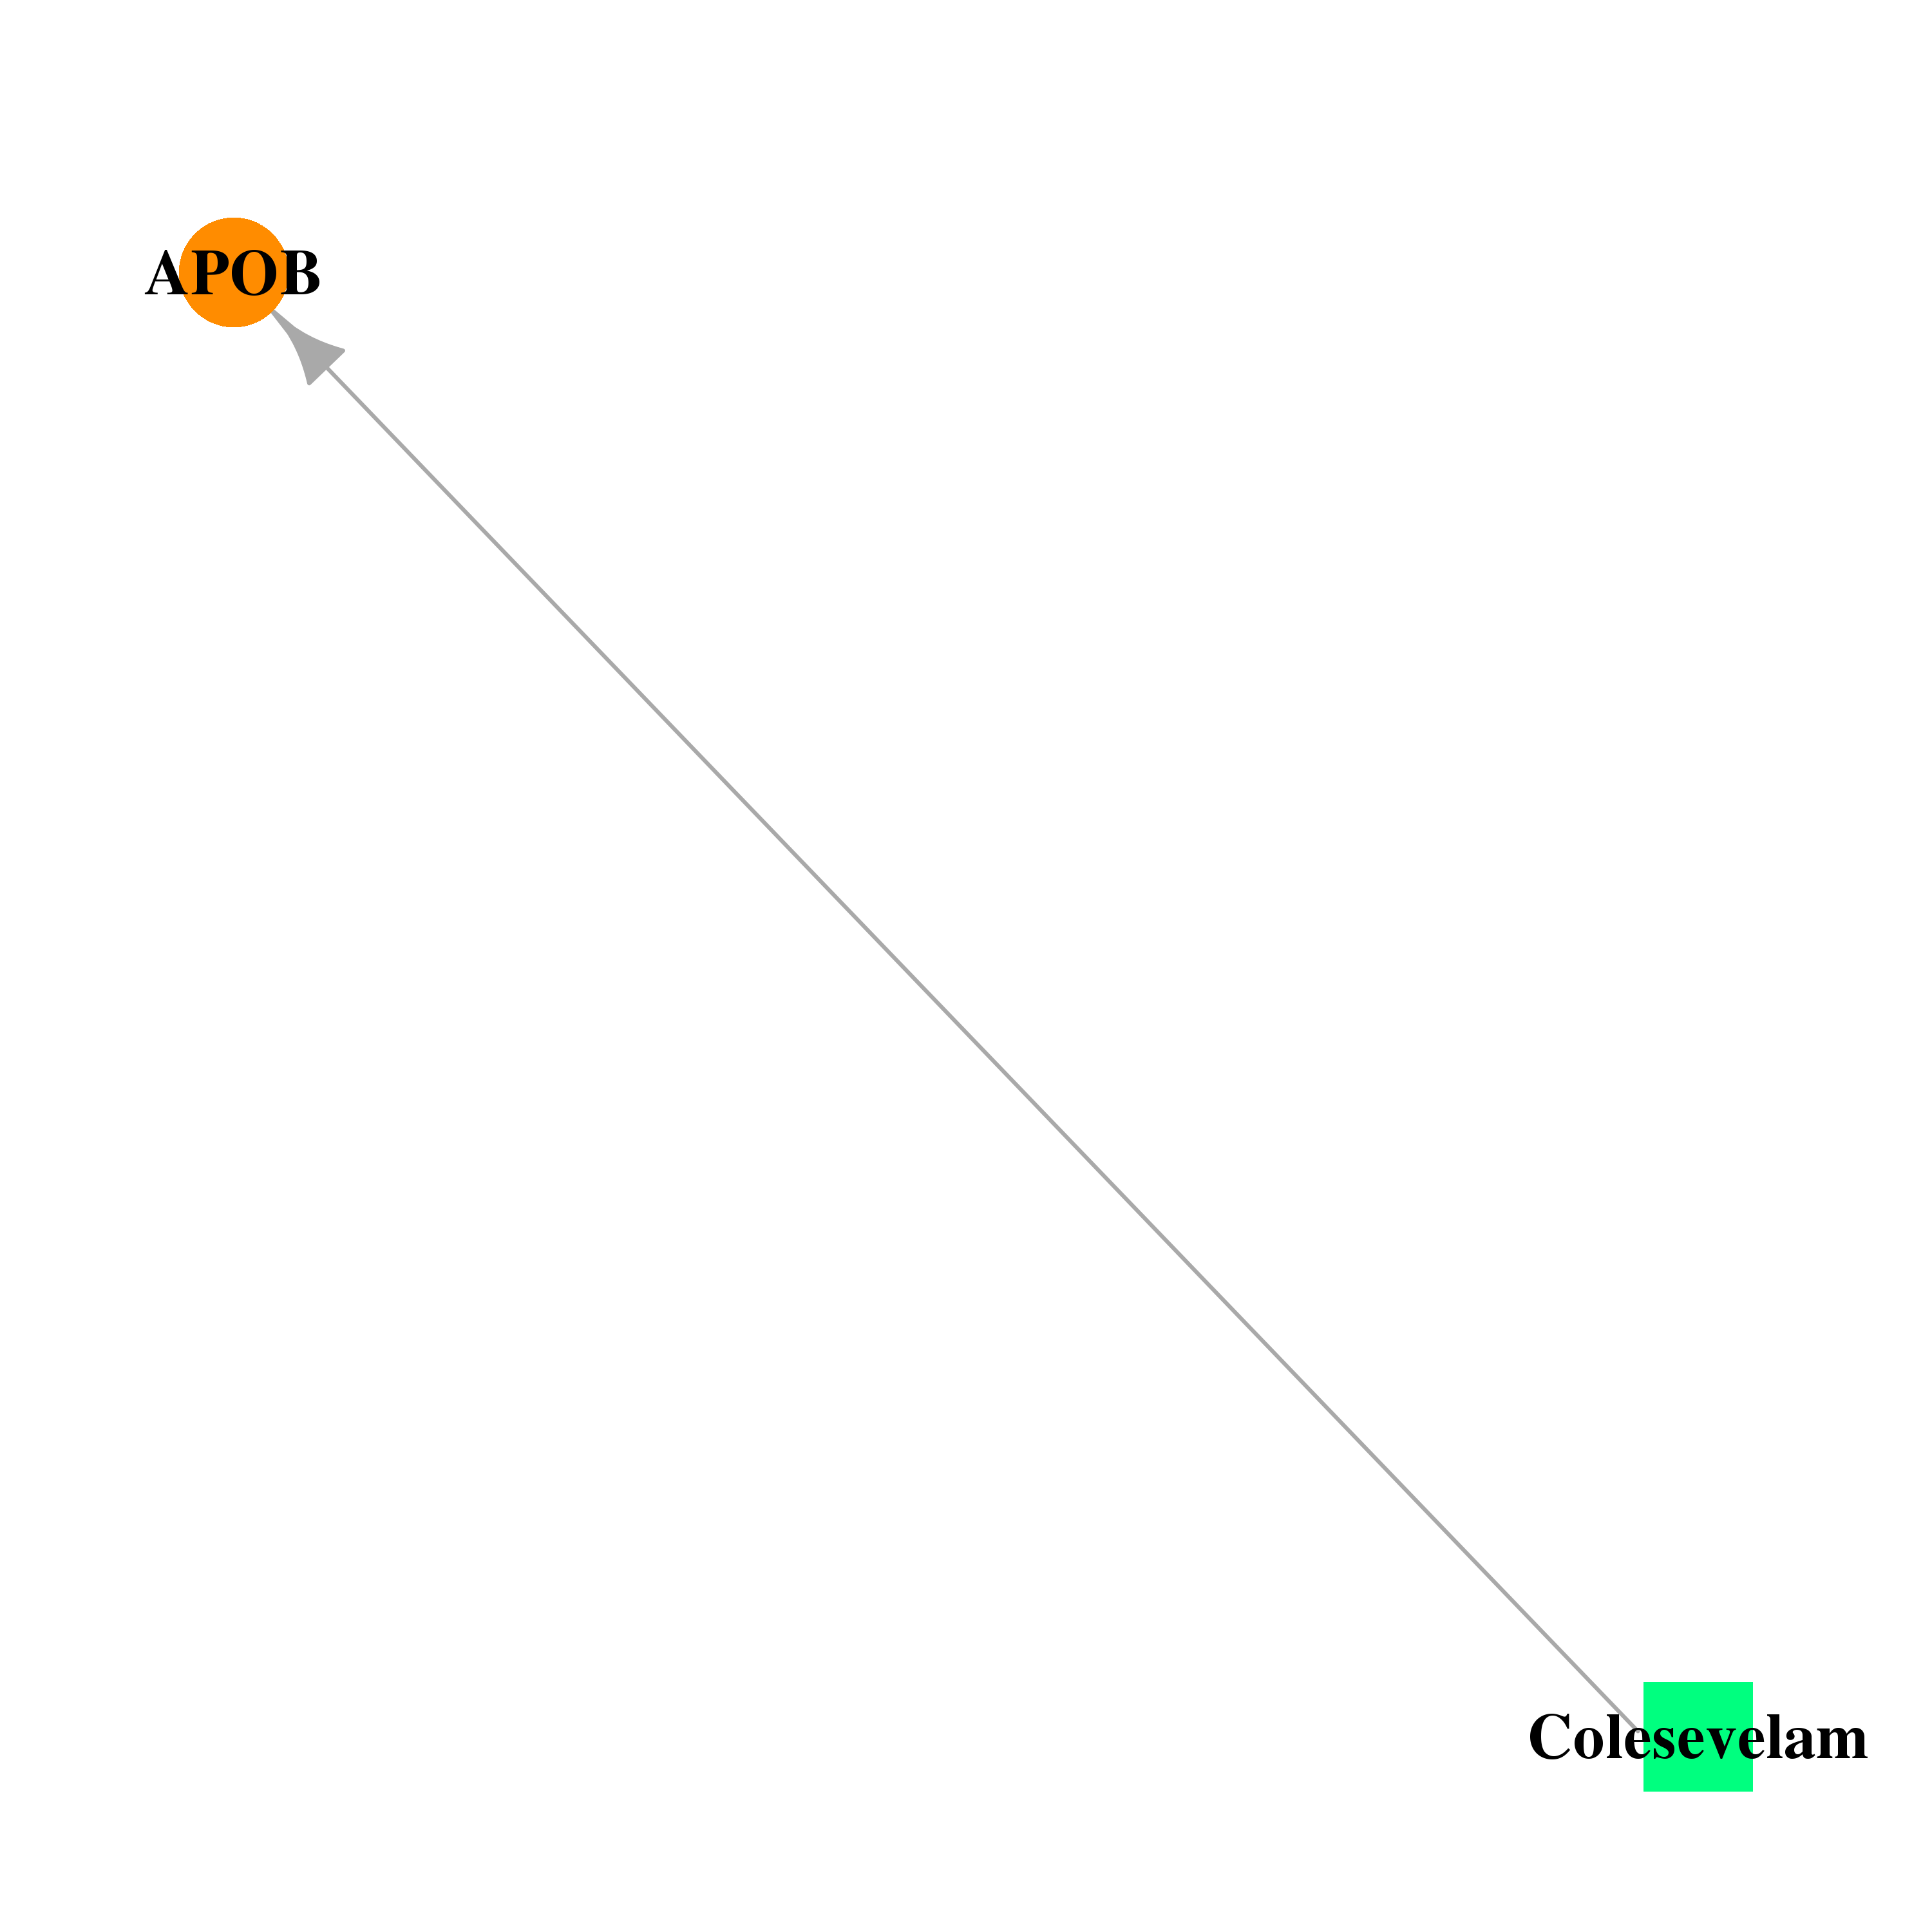 |  |
| DB00264 | apolipoprotein B | approved; investigational | Metoprolol | 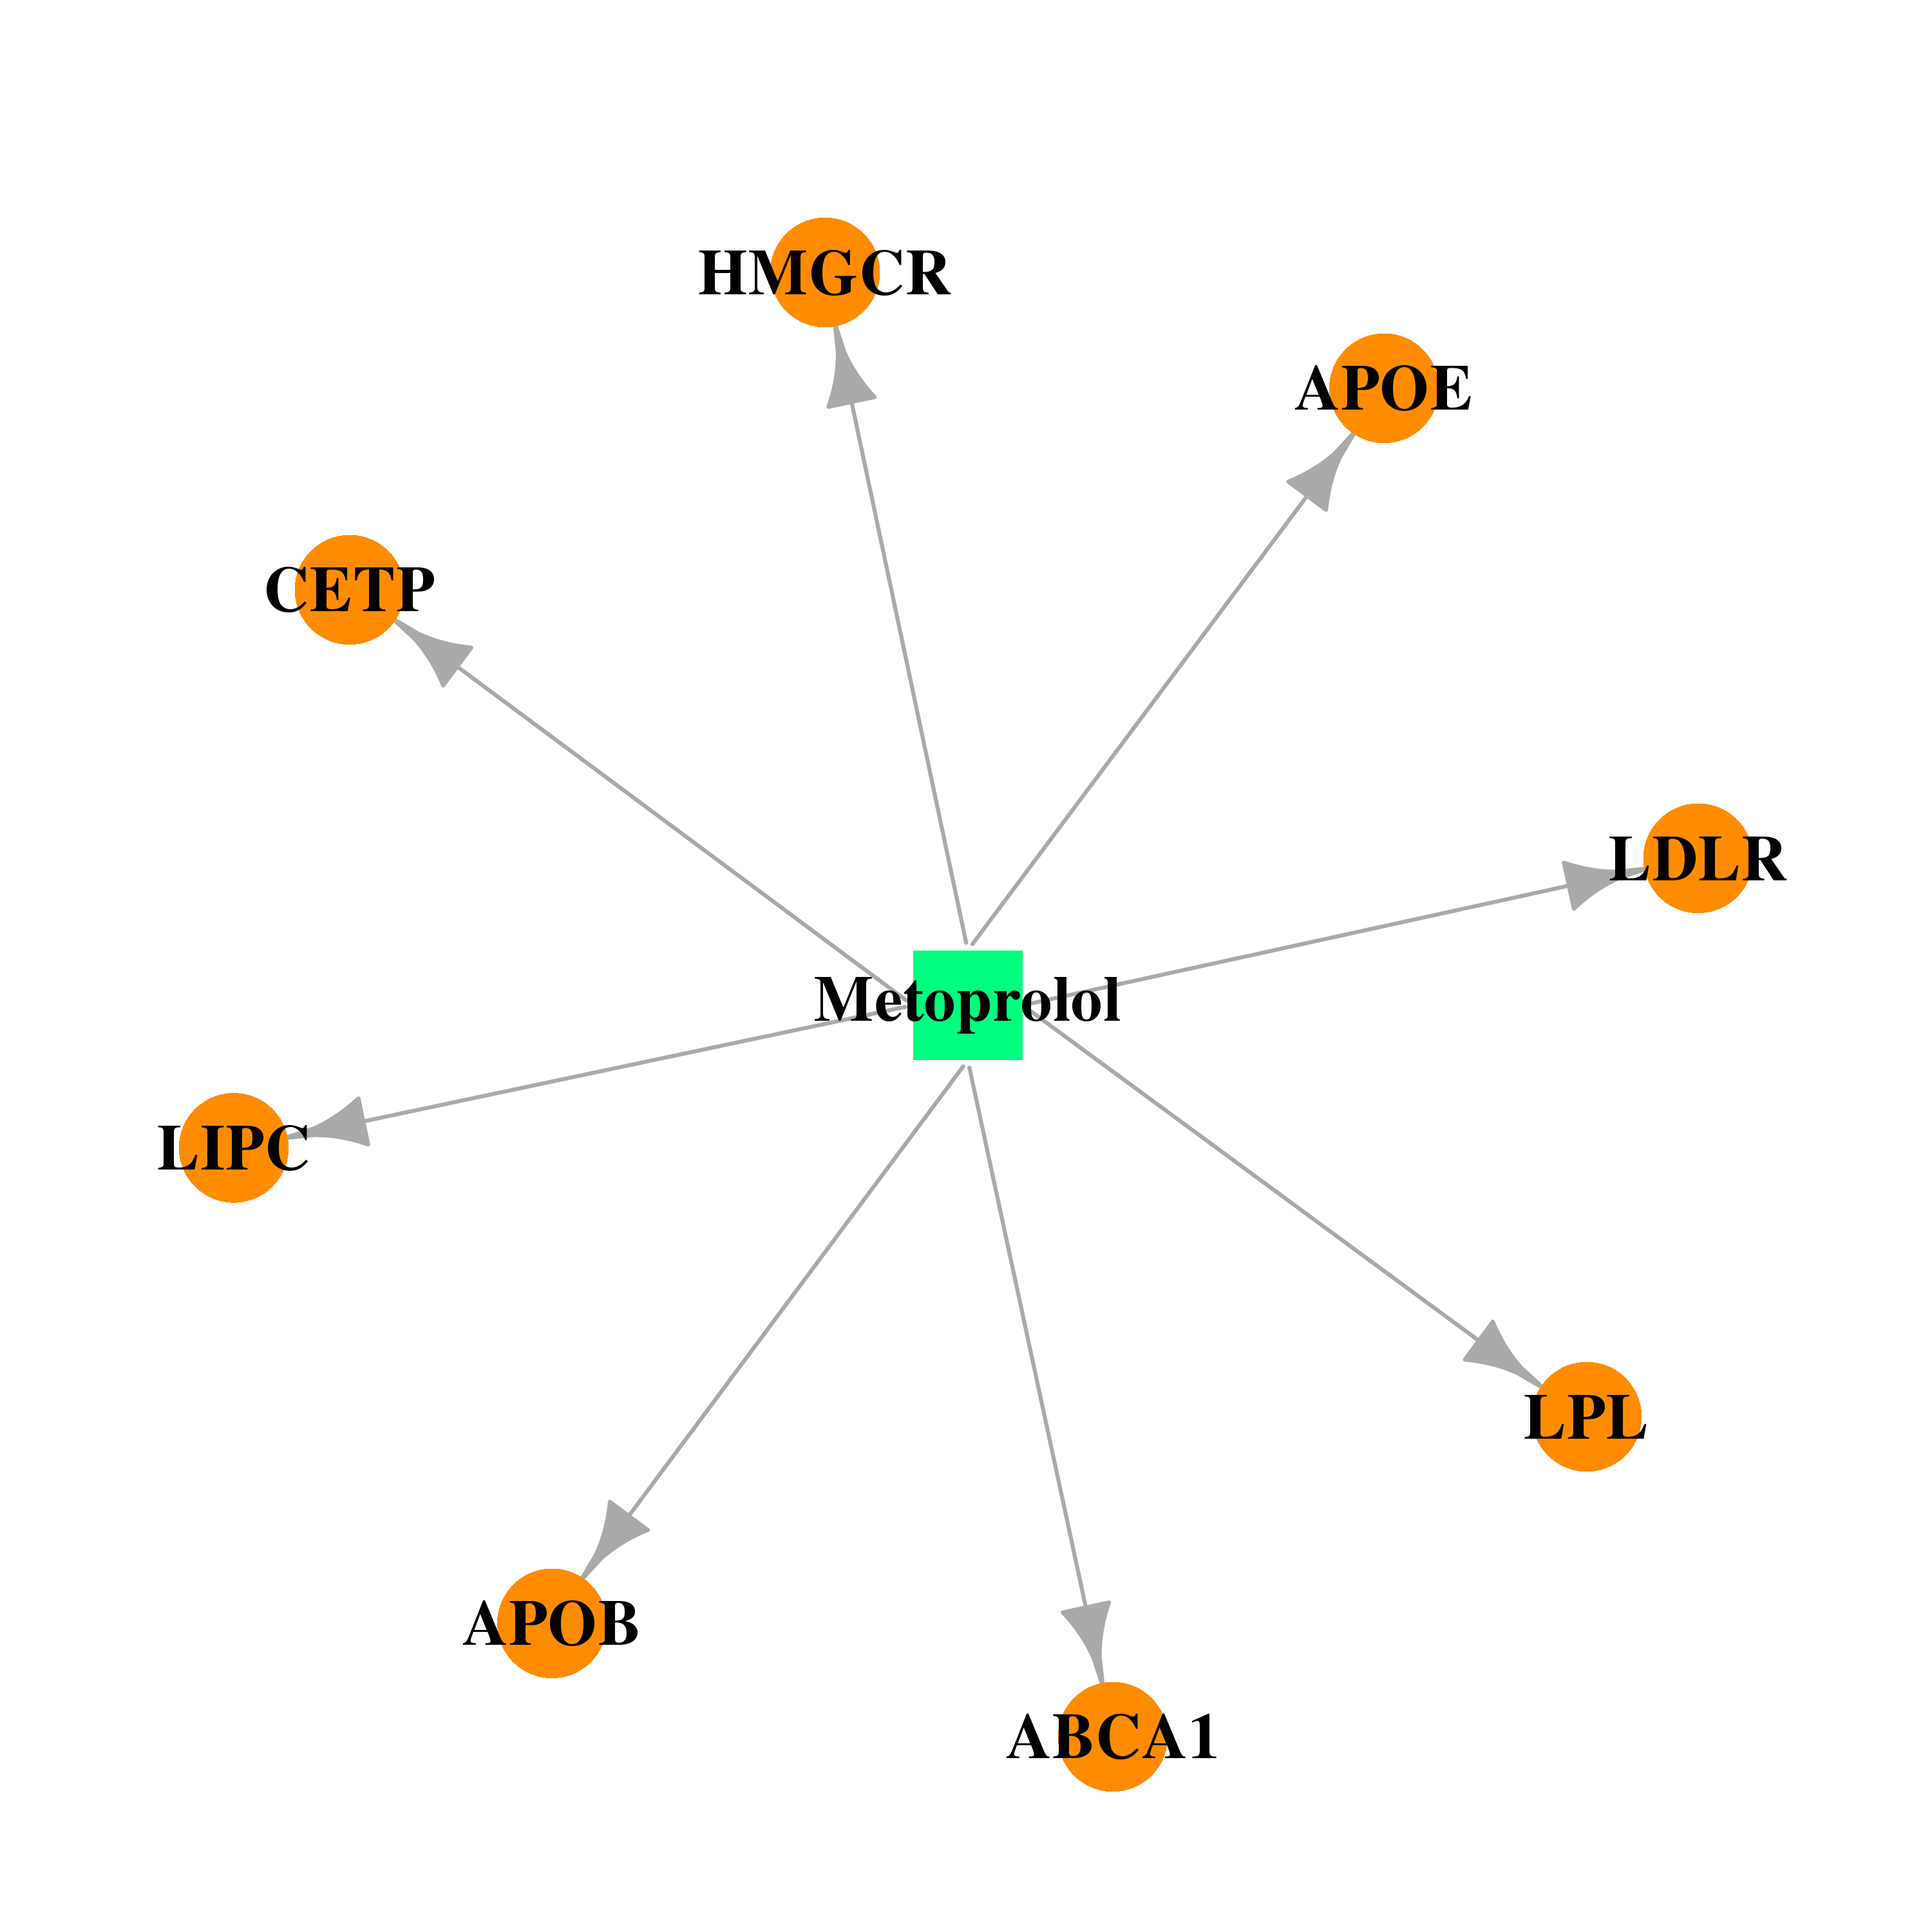 |  |
| Top |
| Cross referenced IDs for APOB |
| * We obtained these cross-references from Uniprot database. It covers 150 different DBs, 18 categories. http://www.uniprot.org/help/cross_references_section |
: Open all cross reference information
|
Copyright © 2016-Present - The Univsersity of Texas Health Science Center at Houston @ |