|
||||||||||||||||||||||||||||||||||||||||||||||||||||||||||||||||||||||||||||||||||||||||||||||||||||||||||||||||||||||||||||||||||||||||||||||||||||||||||||||||||||||||||||||||||||||||||||||||||||||||||||||||||||||||||||||||||||||||||||||||||||||||||||||||||||||||||||||||||||||||||||||||||||||||||||||||||||||||||
| |
| Phenotypic Information (metabolism pathway, cancer, disease, phenome) |
| |
| |
| Gene-Gene Network Information: Co-Expression Network, Interacting Genes & KEGG |
| |
|


| Gene Summary for ACSM4 |
| Basic gene info. | Gene symbol | ACSM4 |
| Gene name | acyl-CoA synthetase medium-chain family member 4 | |
| Synonyms | - | |
| Cytomap | UCSC genome browser: 12p13.31 | |
| Genomic location | chr12 :7456927-7480969 | |
| Type of gene | protein-coding | |
| RefGenes | NM_001080454.1, | |
| Ensembl id | ENSG00000215009 | |
| Description | acyl-coenzyme A synthetase ACSM4, mitochondrial | |
| Modification date | 20141207 | |
| dbXrefs | MIM : 614360 | |
| HGNC : HGNC | ||
| Ensembl : ENSG00000215009 | ||
| Vega : OTTHUMG00000154975 | ||
| Protein | UniProt: go to UniProt's Cross Reference DB Table | |
| Expression | CleanEX: HS_ACSM4 | |
| BioGPS: 341392 | ||
| Gene Expression Atlas: ENSG00000215009 | ||
| The Human Protein Atlas: ENSG00000215009 | ||
| Pathway | NCI Pathway Interaction Database: ACSM4 | |
| KEGG: ACSM4 | ||
| REACTOME: ACSM4 | ||
| ConsensusPathDB | ||
| Pathway Commons: ACSM4 | ||
| Metabolism | MetaCyc: ACSM4 | |
| HUMANCyc: ACSM4 | ||
| Regulation | Ensembl's Regulation: ENSG00000215009 | |
| miRBase: chr12 :7,456,927-7,480,969 | ||
| TargetScan: NM_001080454 | ||
| cisRED: ENSG00000215009 | ||
| Context | iHOP: ACSM4 | |
| cancer metabolism search in PubMed: ACSM4 | ||
| UCL Cancer Institute: ACSM4 | ||
| Assigned class in ccmGDB | C | |
| Top |
| Phenotypic Information for ACSM4(metabolism pathway, cancer, disease, phenome) |
| Cancer | CGAP: ACSM4 |
| Familial Cancer Database: ACSM4 | |
| * This gene is included in those cancer gene databases. |
|
|
|
|
|
| . | ||||||||||||||||||||||||||||||||||||||||||||||||||||||||||||||||||||||||||||||||||||||||||||||||||||||||||||||||||||||||||||||||||||||||||||||||||||||||||||||||||||||||||||||||||||||||||||||||||||||||||||||||||||||||||||||||||||||||||||||||||||||||||||||||||||||||||||||||||||||||||||||||||||||||||||||||||||
Oncogene 1 | Significant driver gene in | |||||||||||||||||||||||||||||||||||||||||||||||||||||||||||||||||||||||||||||||||||||||||||||||||||||||||||||||||||||||||||||||||||||||||||||||||||||||||||||||||||||||||||||||||||||||||||||||||||||||||||||||||||||||||||||||||||||||||||||||||||||||||||||||||||||||||||||||||||||||||||||||||||||||||||||||||||||||||
| cf) number; DB name 1 Oncogene; http://nar.oxfordjournals.org/content/35/suppl_1/D721.long, 2 Tumor Suppressor gene; https://bioinfo.uth.edu/TSGene/, 3 Cancer Gene Census; http://www.nature.com/nrc/journal/v4/n3/abs/nrc1299.html, 4 CancerGenes; http://nar.oxfordjournals.org/content/35/suppl_1/D721.long, 5 Network of Cancer Gene; http://ncg.kcl.ac.uk/index.php, 1Therapeutic Vulnerabilities in Cancer; http://cbio.mskcc.org/cancergenomics/statius/ |
| KEGG_BUTANOATE_METABOLISM | |
| OMIM | |
| Orphanet | |
| Disease | KEGG Disease: ACSM4 |
| MedGen: ACSM4 (Human Medical Genetics with Condition) | |
| ClinVar: ACSM4 | |
| Phenotype | MGI: ACSM4 (International Mouse Phenotyping Consortium) |
| PhenomicDB: ACSM4 | |
| Mutations for ACSM4 |
| * Under tables are showing count per each tissue to give us broad intuition about tissue specific mutation patterns.You can go to the detailed page for each mutation database's web site. |
| - Statistics for Tissue and Mutation type | Top |
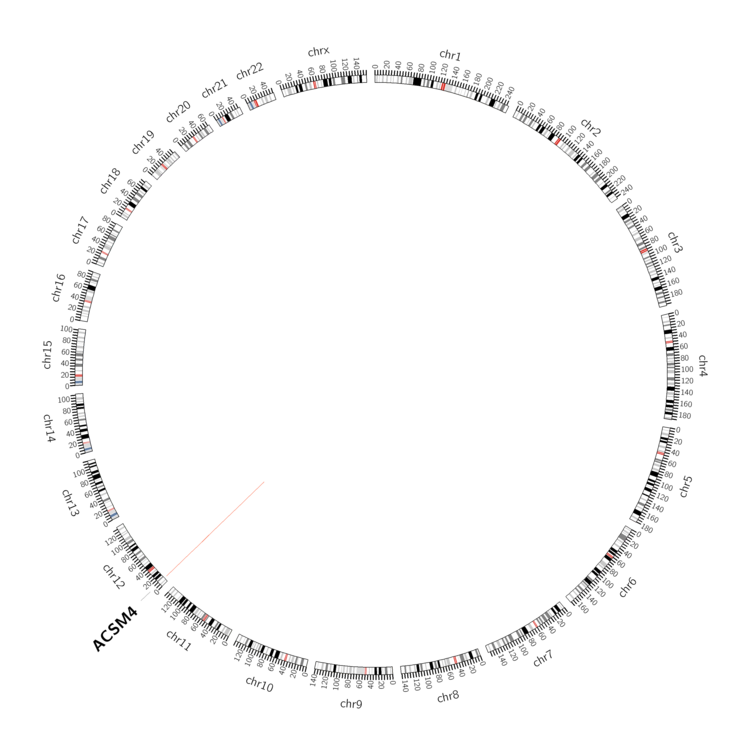 |
| - For Inter-chromosomal Variations |
| There's no inter-chromosomal structural variation. |
| - For Intra-chromosomal Variations |
| * Intra-chromosomal variantions includes 'intrachromosomal amplicon to amplicon', 'intrachromosomal amplicon to non-amplified dna', 'intrachromosomal deletion', 'intrachromosomal fold-back inversion', 'intrachromosomal inversion', 'intrachromosomal tandem duplication', 'Intrachromosomal unknown type', 'intrachromosomal with inverted orientation', 'intrachromosomal with non-inverted orientation'. |
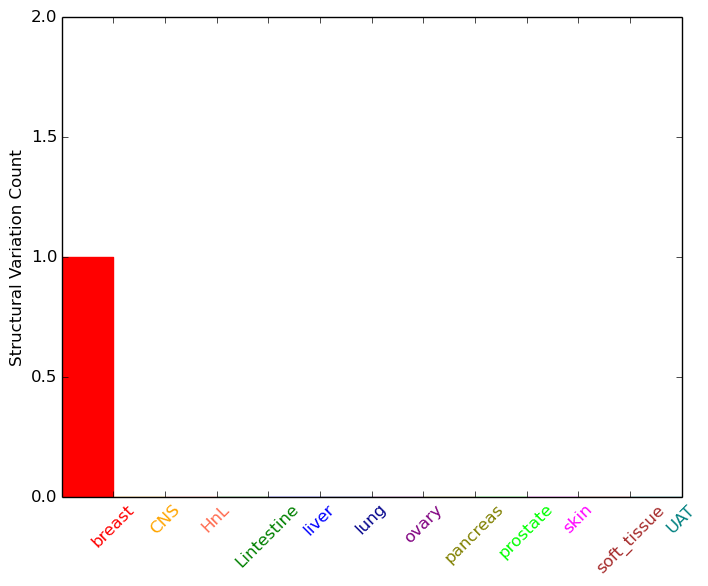 |
| Sample | Symbol_a | Chr_a | Start_a | End_a | Symbol_b | Chr_b | Start_b | End_b |
| breast | ACSM4 | chr12 | 7473532 | 7473532 | chr12 | 7497827 | 7497827 |
| cf) Tissue number; Tissue name (1;Breast, 2;Central_nervous_system, 3;Haematopoietic_and_lymphoid_tissue, 4;Large_intestine, 5;Liver, 6;Lung, 7;Ovary, 8;Pancreas, 9;Prostate, 10;Skin, 11;Soft_tissue, 12;Upper_aerodigestive_tract) |
| * From mRNA Sanger sequences, Chitars2.0 arranged chimeric transcripts. This table shows ACSM4 related fusion information. |
| ID | Head Gene | Tail Gene | Accession | Gene_a | qStart_a | qEnd_a | Chromosome_a | tStart_a | tEnd_a | Gene_a | qStart_a | qEnd_a | Chromosome_a | tStart_a | tEnd_a |
| Top |
| Mutation type/ Tissue ID | brca | cns | cerv | endome | haematopo | kidn | Lintest | liver | lung | ns | ovary | pancre | prost | skin | stoma | thyro | urina | |||
| Total # sample | 2 | |||||||||||||||||||
| GAIN (# sample) | 2 | |||||||||||||||||||
| LOSS (# sample) |
| cf) Tissue ID; Tissue type (1; Breast, 2; Central_nervous_system, 3; Cervix, 4; Endometrium, 5; Haematopoietic_and_lymphoid_tissue, 6; Kidney, 7; Large_intestine, 8; Liver, 9; Lung, 10; NS, 11; Ovary, 12; Pancreas, 13; Prostate, 14; Skin, 15; Stomach, 16; Thyroid, 17; Urinary_tract) |
| Top |
|
 |
| Top |
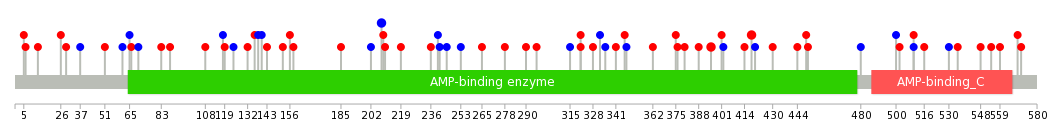
| Stat. for Non-Synonymous SNVs (# total SNVs=57) | (# total SNVs=11) |
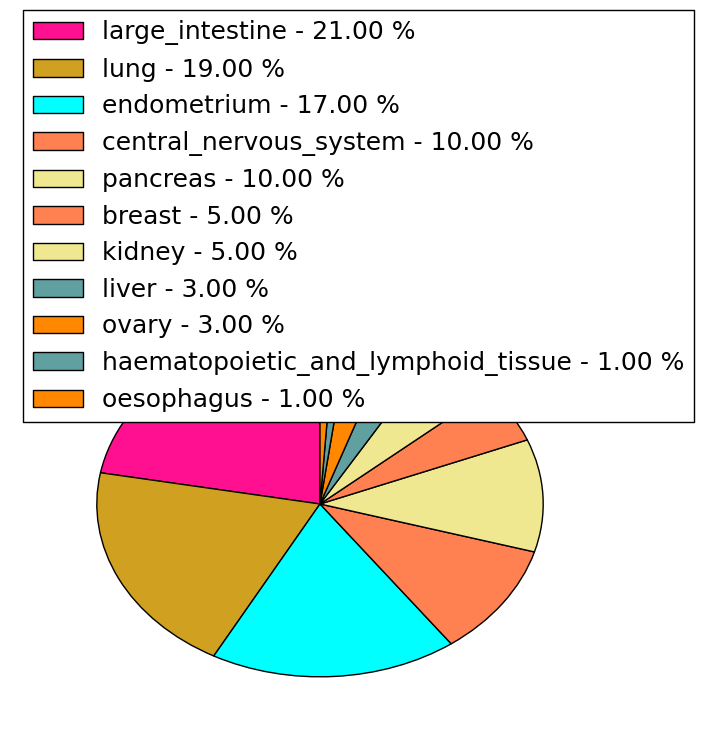 | 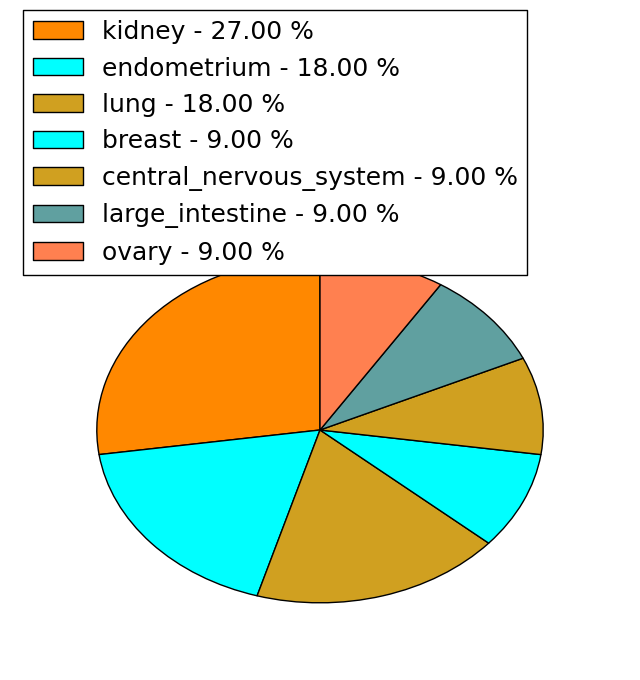 |
(# total SNVs=1) | (# total SNVs=1) |
 |  |
| Top |
| * When you move the cursor on each content, you can see more deailed mutation information on the Tooltip. Those are primary_site,primary_histology,mutation(aa),pubmedID. |
| GRCh37 position | Mutation(aa) | Unique sampleID count |
| chr12:7470689-7470689 | p.A278S | 3 |
| chr12:7476100-7476100 | p.E418K | 2 |
| chr12:7459281-7459281 | p.A118A | 2 |
| chr12:7456958-7456958 | p.R11G | 2 |
| chr12:7473381-7473381 | p.V328L | 2 |
| chr12:7470723-7470723 | p.G289E | 2 |
| chr12:7479625-7479625 | p.E530D | 2 |
| chr12:7475888-7475888 | p.G395E | 2 |
| chr12:7476089-7476089 | p.G414V | 1 |
| chr12:7457038-7457038 | p.D37D | 1 |
| Top |
|
 |
| Point Mutation/ Tissue ID | 1 | 2 | 3 | 4 | 5 | 6 | 7 | 8 | 9 | 10 | 11 | 12 | 13 | 14 | 15 | 16 | 17 | 18 | 19 | 20 |
| # sample | 1 | 3 | 7 | 5 | 2 | 1 | 3 | 10 | 3 | 20 | 5 | 9 | ||||||||
| # mutation | 1 | 3 | 10 | 5 | 2 | 1 | 3 | 10 | 3 | 24 | 5 | 11 | ||||||||
| nonsynonymous SNV | 2 | 6 | 5 | 2 | 8 | 1 | 16 | 5 | 9 | |||||||||||
| synonymous SNV | 1 | 1 | 4 | 2 | 1 | 1 | 2 | 2 | 8 | 2 |
| cf) Tissue ID; Tissue type (1; BLCA[Bladder Urothelial Carcinoma], 2; BRCA[Breast invasive carcinoma], 3; CESC[Cervical squamous cell carcinoma and endocervical adenocarcinoma], 4; COAD[Colon adenocarcinoma], 5; GBM[Glioblastoma multiforme], 6; Glioma Low Grade, 7; HNSC[Head and Neck squamous cell carcinoma], 8; KICH[Kidney Chromophobe], 9; KIRC[Kidney renal clear cell carcinoma], 10; KIRP[Kidney renal papillary cell carcinoma], 11; LAML[Acute Myeloid Leukemia], 12; LUAD[Lung adenocarcinoma], 13; LUSC[Lung squamous cell carcinoma], 14; OV[Ovarian serous cystadenocarcinoma ], 15; PAAD[Pancreatic adenocarcinoma], 16; PRAD[Prostate adenocarcinoma], 17; SKCM[Skin Cutaneous Melanoma], 18:STAD[Stomach adenocarcinoma], 19:THCA[Thyroid carcinoma], 20:UCEC[Uterine Corpus Endometrial Carcinoma]) |
| Top |
| * We represented just top 10 SNVs. When you move the cursor on each content, you can see more deailed mutation information on the Tooltip. Those are primary_site, primary_histology, mutation(aa), pubmedID. |
| Genomic Position | Mutation(aa) | Unique sampleID count |
| chr12:7475888 | p.G395E | 2 |
| chr12:7476100 | p.E418K | 2 |
| chr12:7469736 | p.F208F | 2 |
| chr12:7480901 | p.G347G | 1 |
| chr12:7459137 | p.Y480Y | 1 |
| chr12:7473361 | p.F5S | 1 |
| chr12:7475867 | p.I124I | 1 |
| chr12:7463150 | p.Q240Q | 1 |
| chr12:7477098 | p.H241H | 1 |
| chr12:7456941 | p.T362I | 1 |
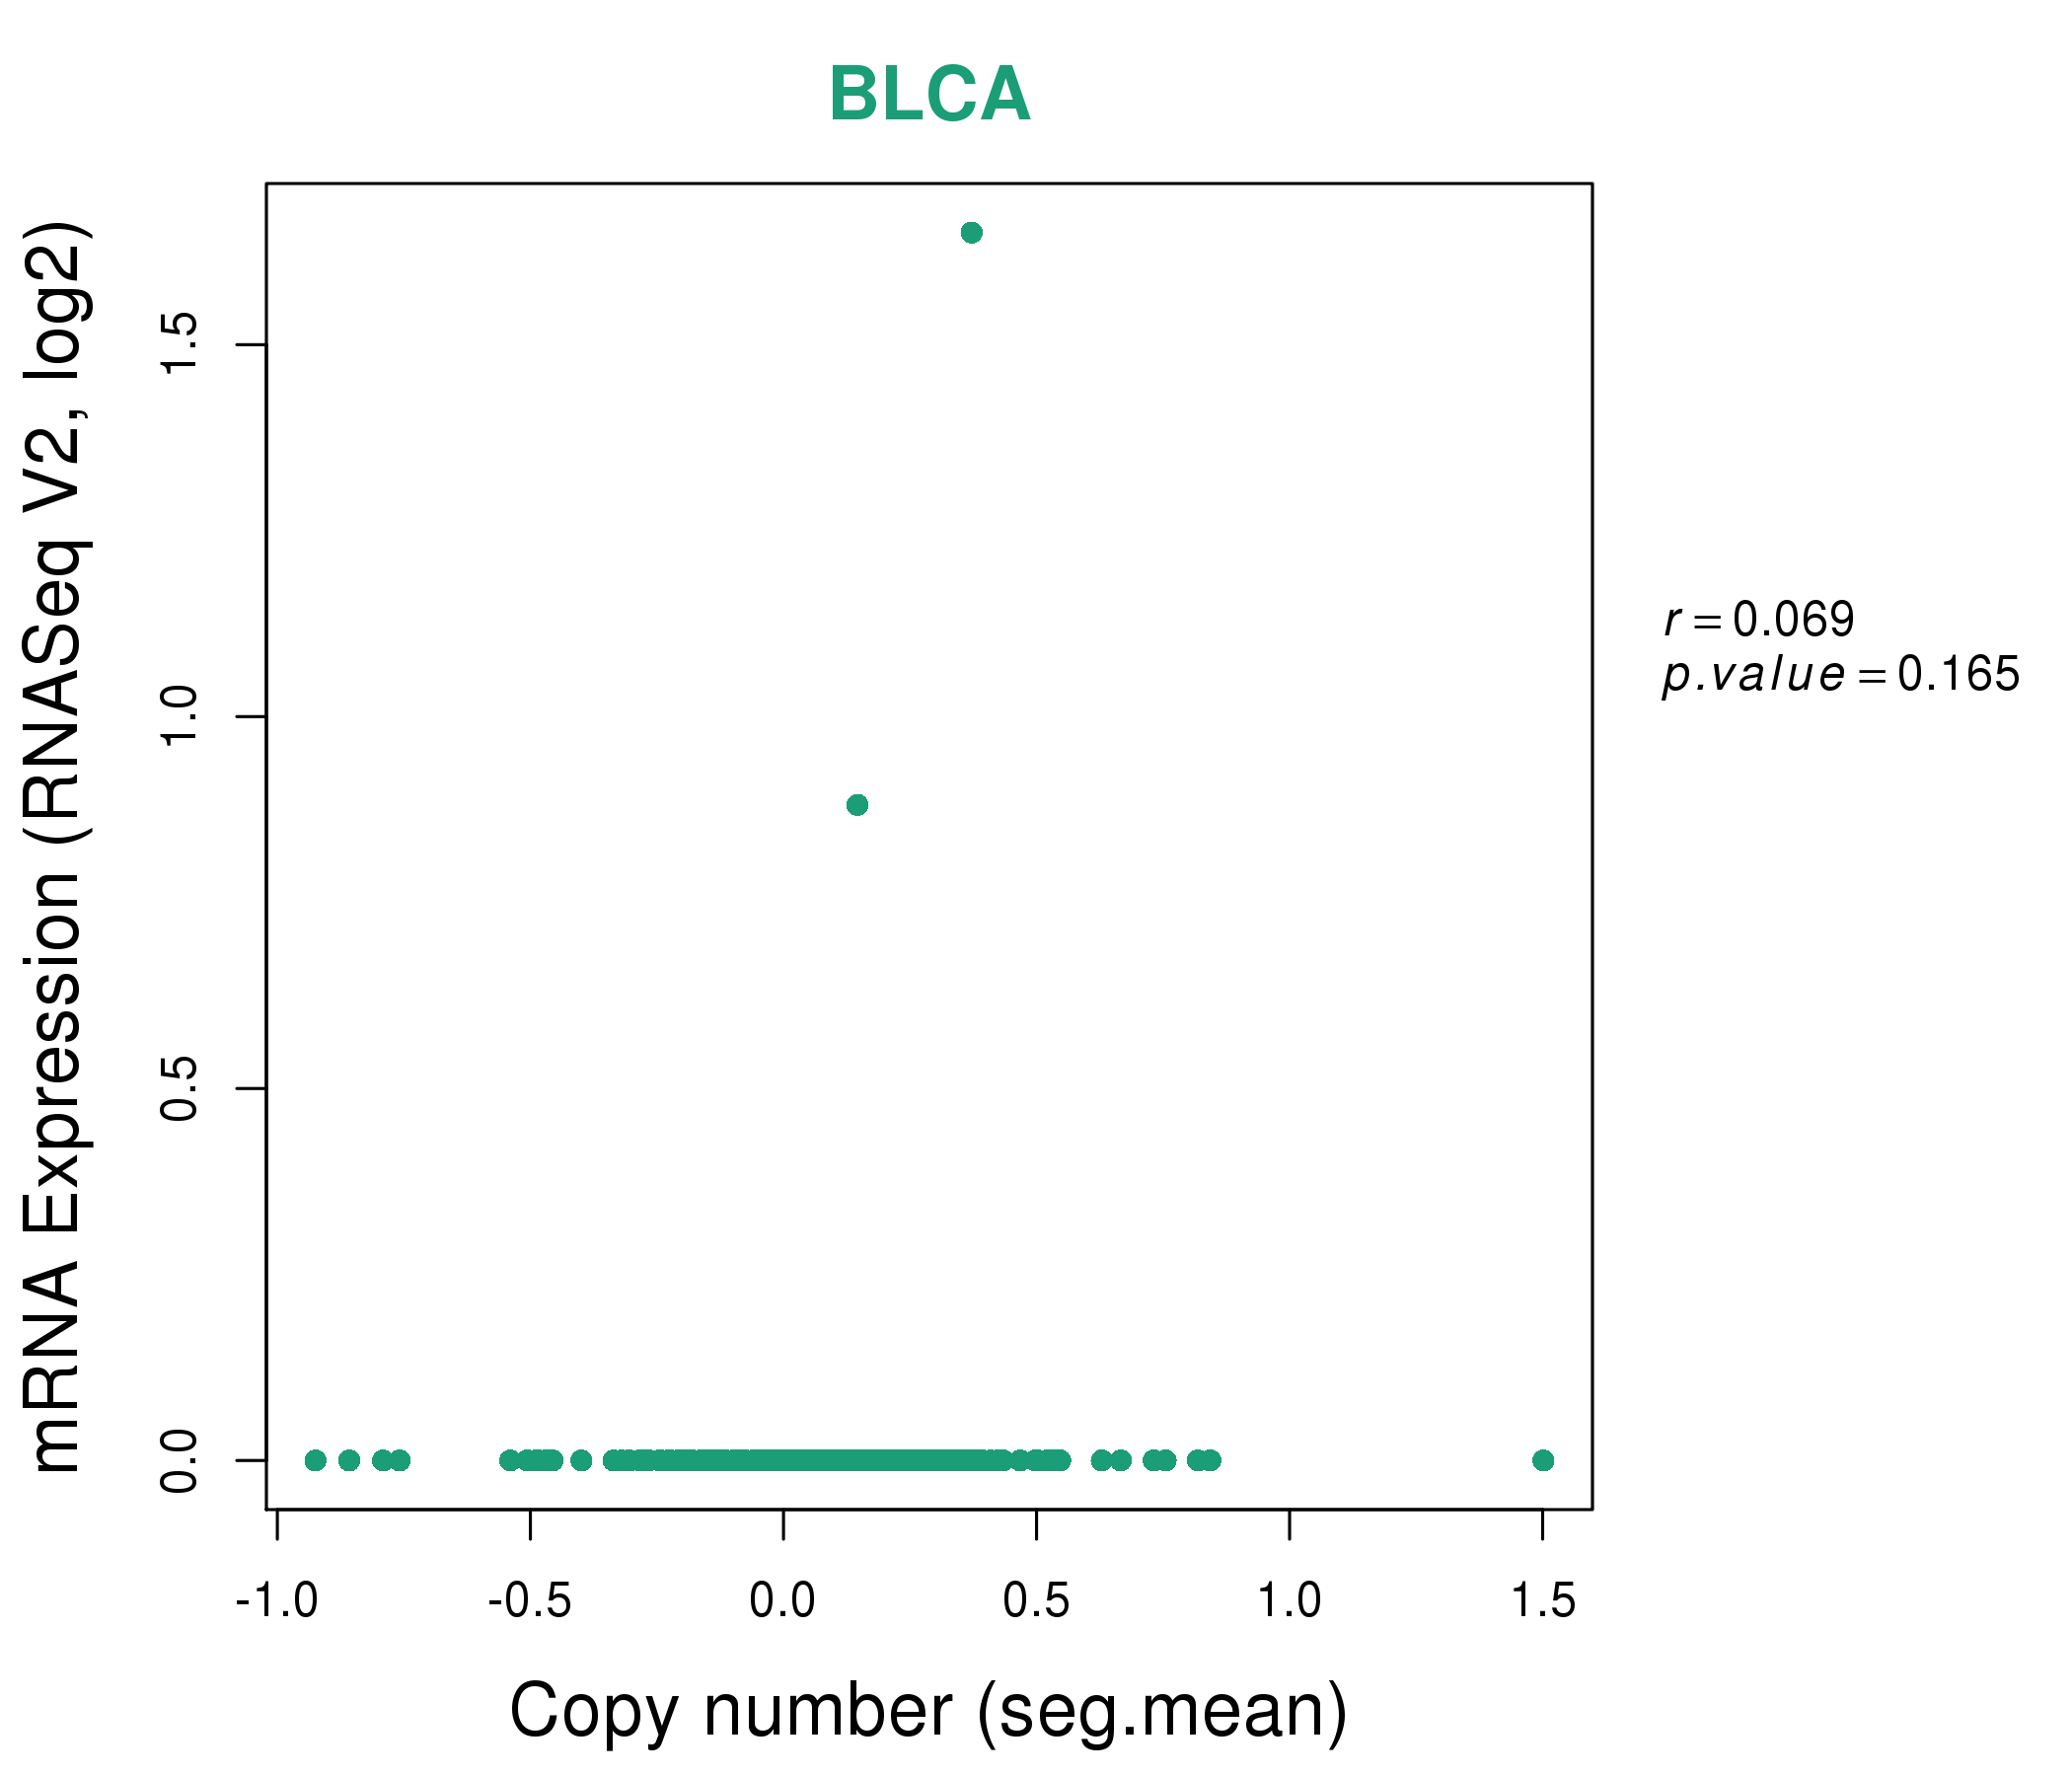
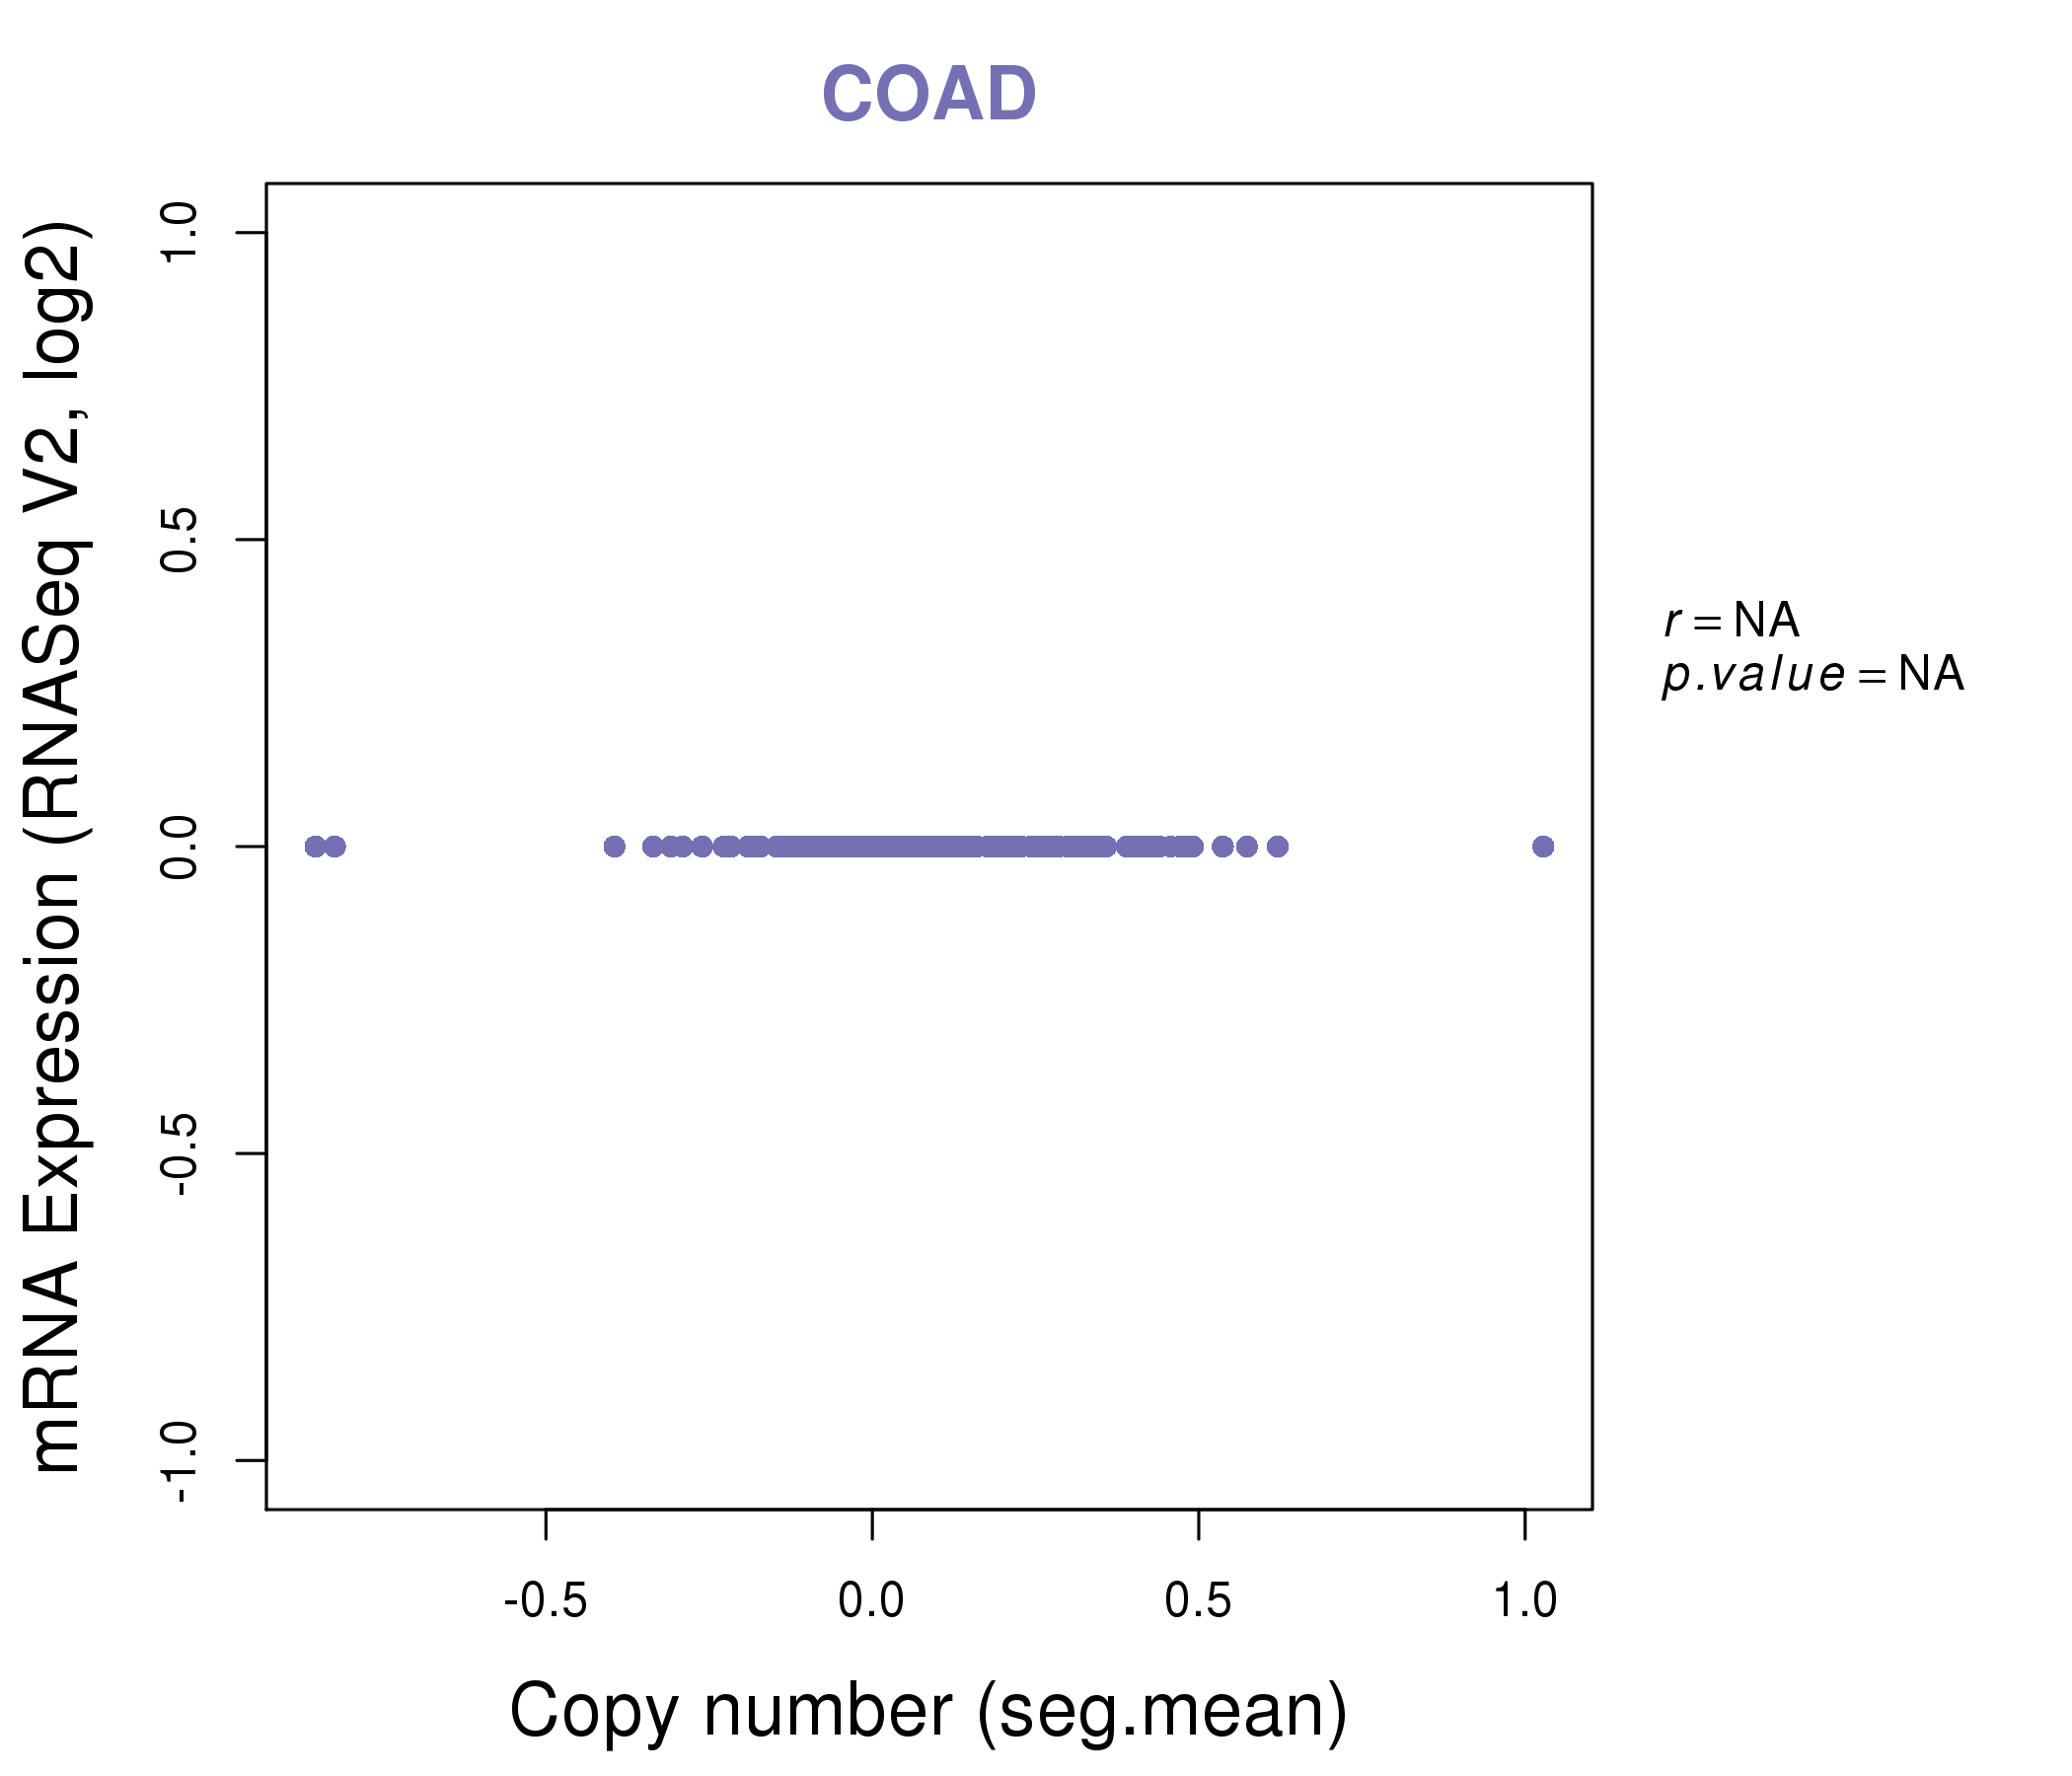
| * Copy number data were extracted from TCGA using R package TCGA-Assembler. The URLs of all public data files on TCGA DCC data server were gathered on Jan-05-2015. Function ProcessCNAData in TCGA-Assembler package was used to obtain gene-level copy number value which is calculated as the average copy number of the genomic region of a gene. |
 |
| cf) Tissue ID[Tissue type]: BLCA[Bladder Urothelial Carcinoma], BRCA[Breast invasive carcinoma], CESC[Cervical squamous cell carcinoma and endocervical adenocarcinoma], COAD[Colon adenocarcinoma], GBM[Glioblastoma multiforme], Glioma Low Grade, HNSC[Head and Neck squamous cell carcinoma], KICH[Kidney Chromophobe], KIRC[Kidney renal clear cell carcinoma], KIRP[Kidney renal papillary cell carcinoma], LAML[Acute Myeloid Leukemia], LUAD[Lung adenocarcinoma], LUSC[Lung squamous cell carcinoma], OV[Ovarian serous cystadenocarcinoma ], PAAD[Pancreatic adenocarcinoma], PRAD[Prostate adenocarcinoma], SKCM[Skin Cutaneous Melanoma], STAD[Stomach adenocarcinoma], THCA[Thyroid carcinoma], UCEC[Uterine Corpus Endometrial Carcinoma] |
| Top |
| Gene Expression for ACSM4 |
| * CCLE gene expression data were extracted from CCLE_Expression_Entrez_2012-10-18.res: Gene-centric RMA-normalized mRNA expression data. |
 |
| * Normalized gene expression data of RNASeqV2 was extracted from TCGA using R package TCGA-Assembler. The URLs of all public data files on TCGA DCC data server were gathered at Jan-05-2015. Only eight cancer types have enough normal control samples for differential expression analysis. (t test, adjusted p<0.05 (using Benjamini-Hochberg FDR)) |
 |
| Top |
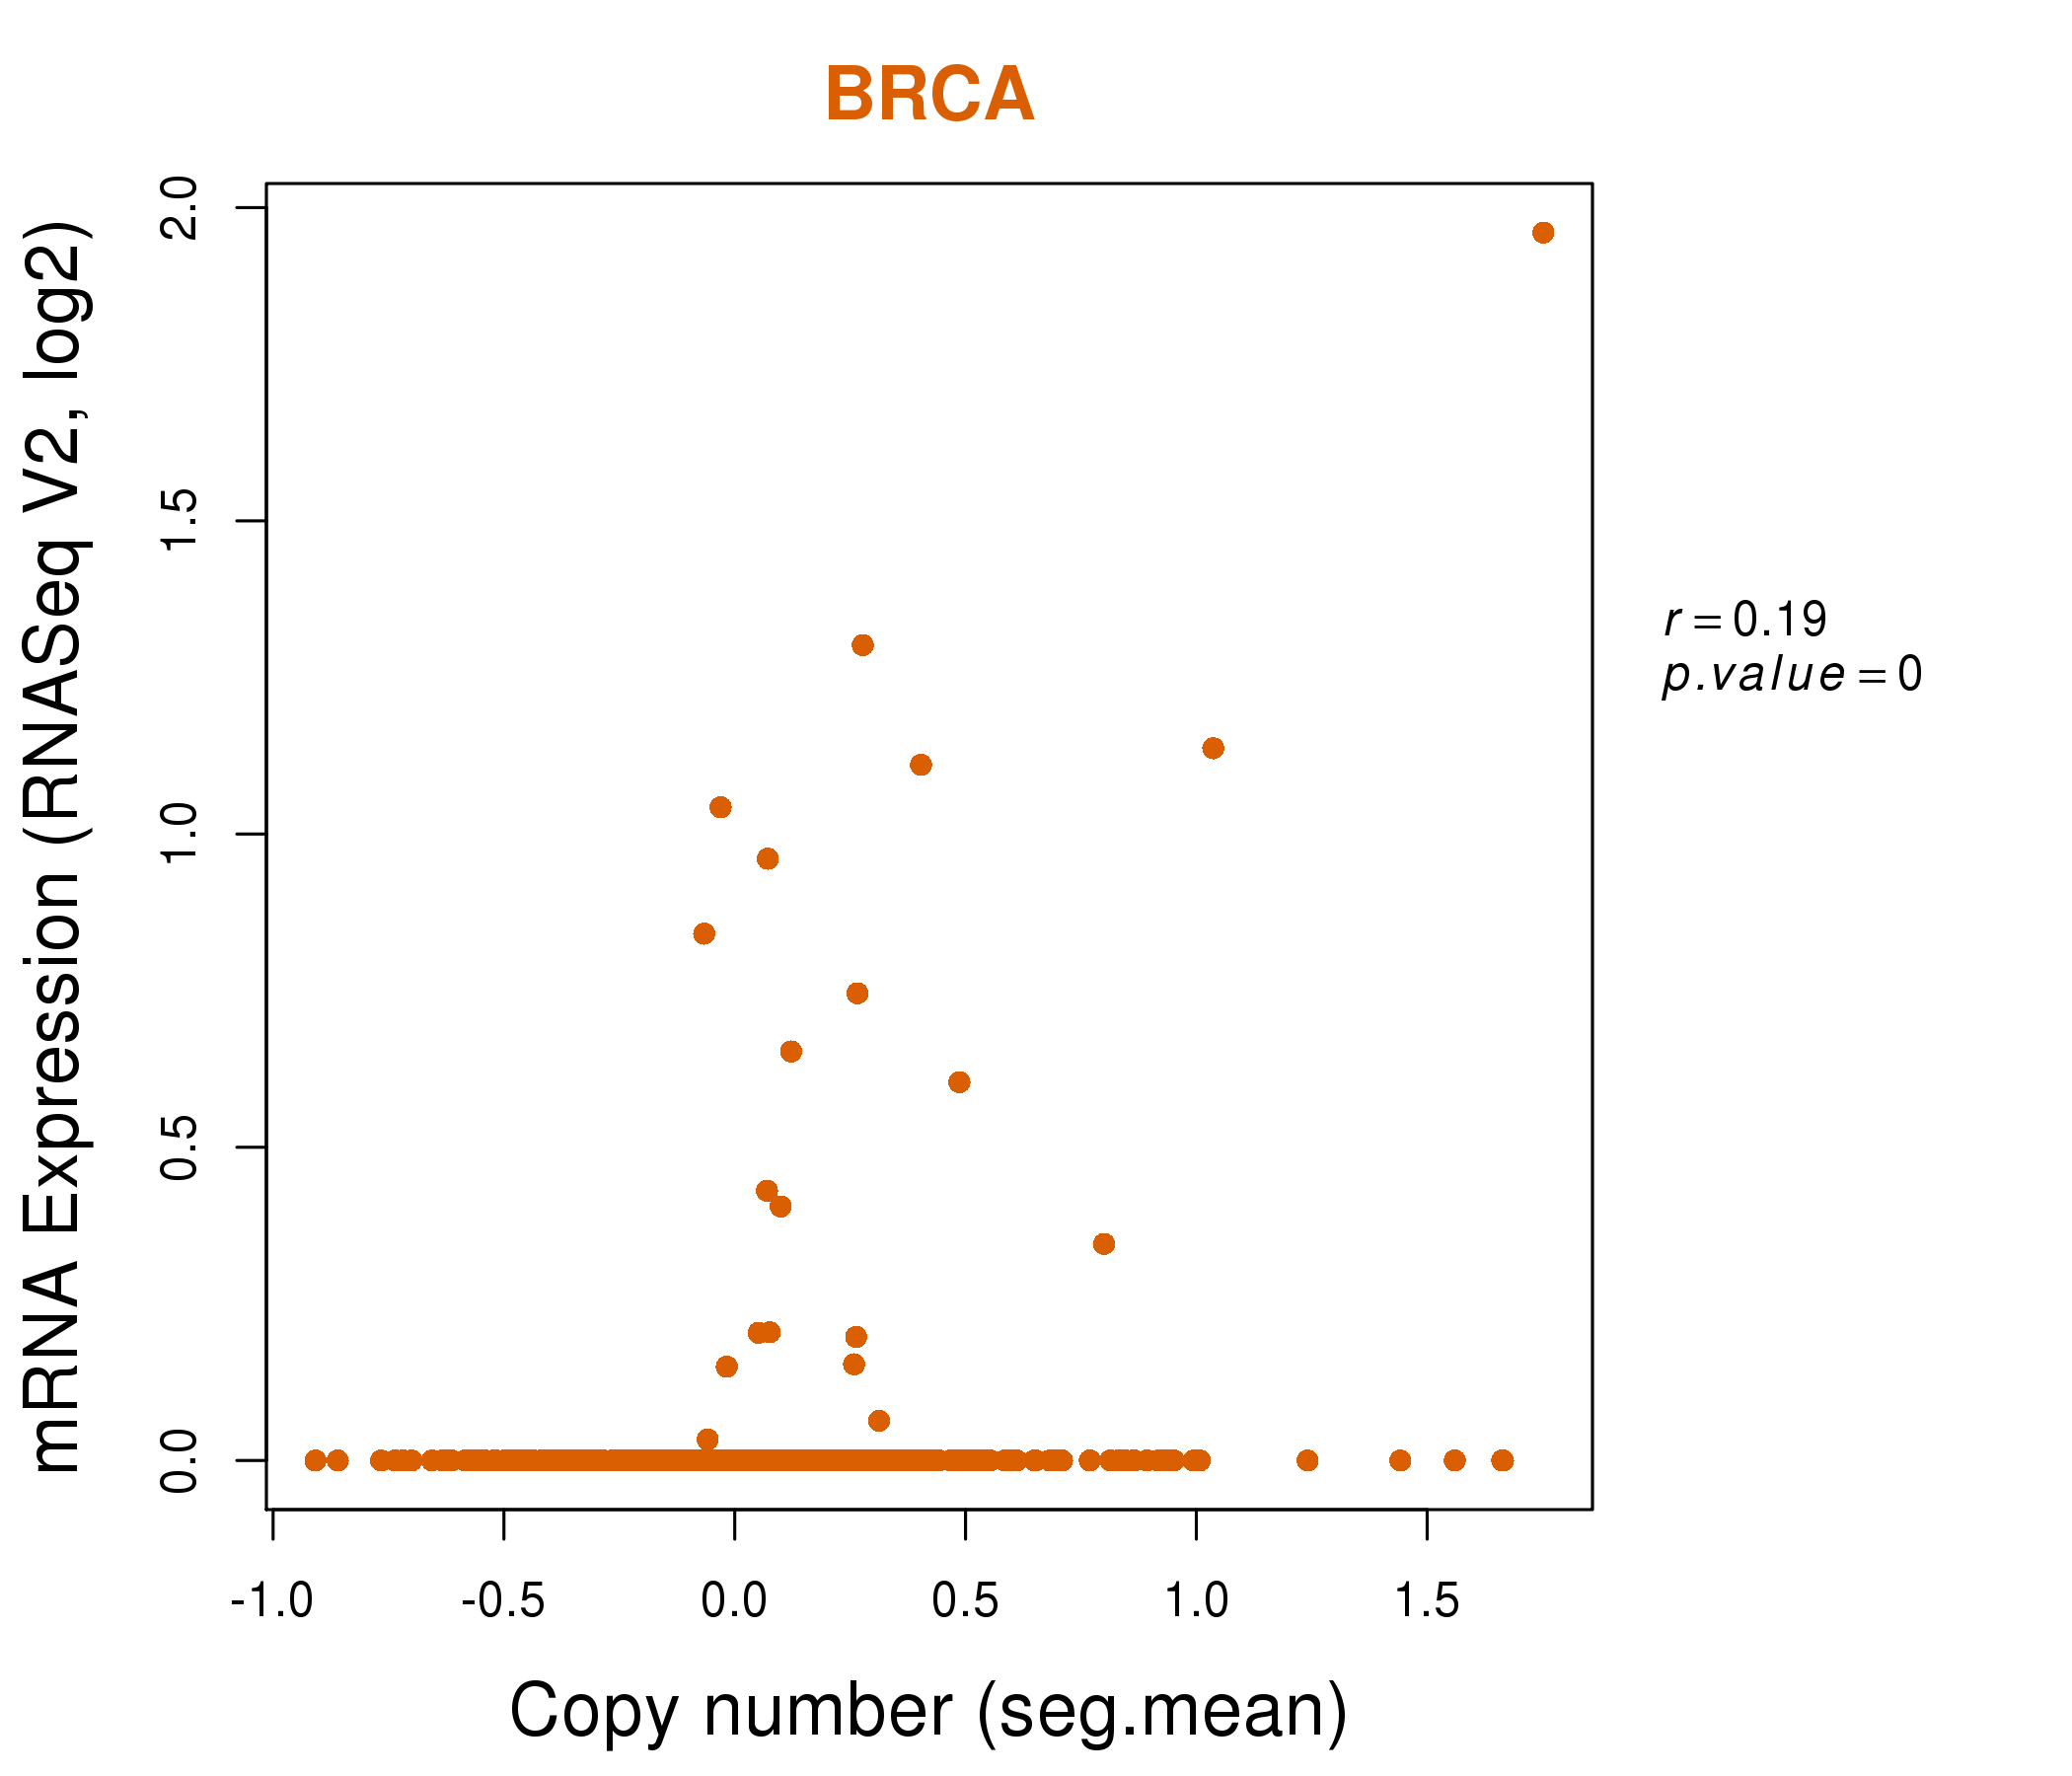
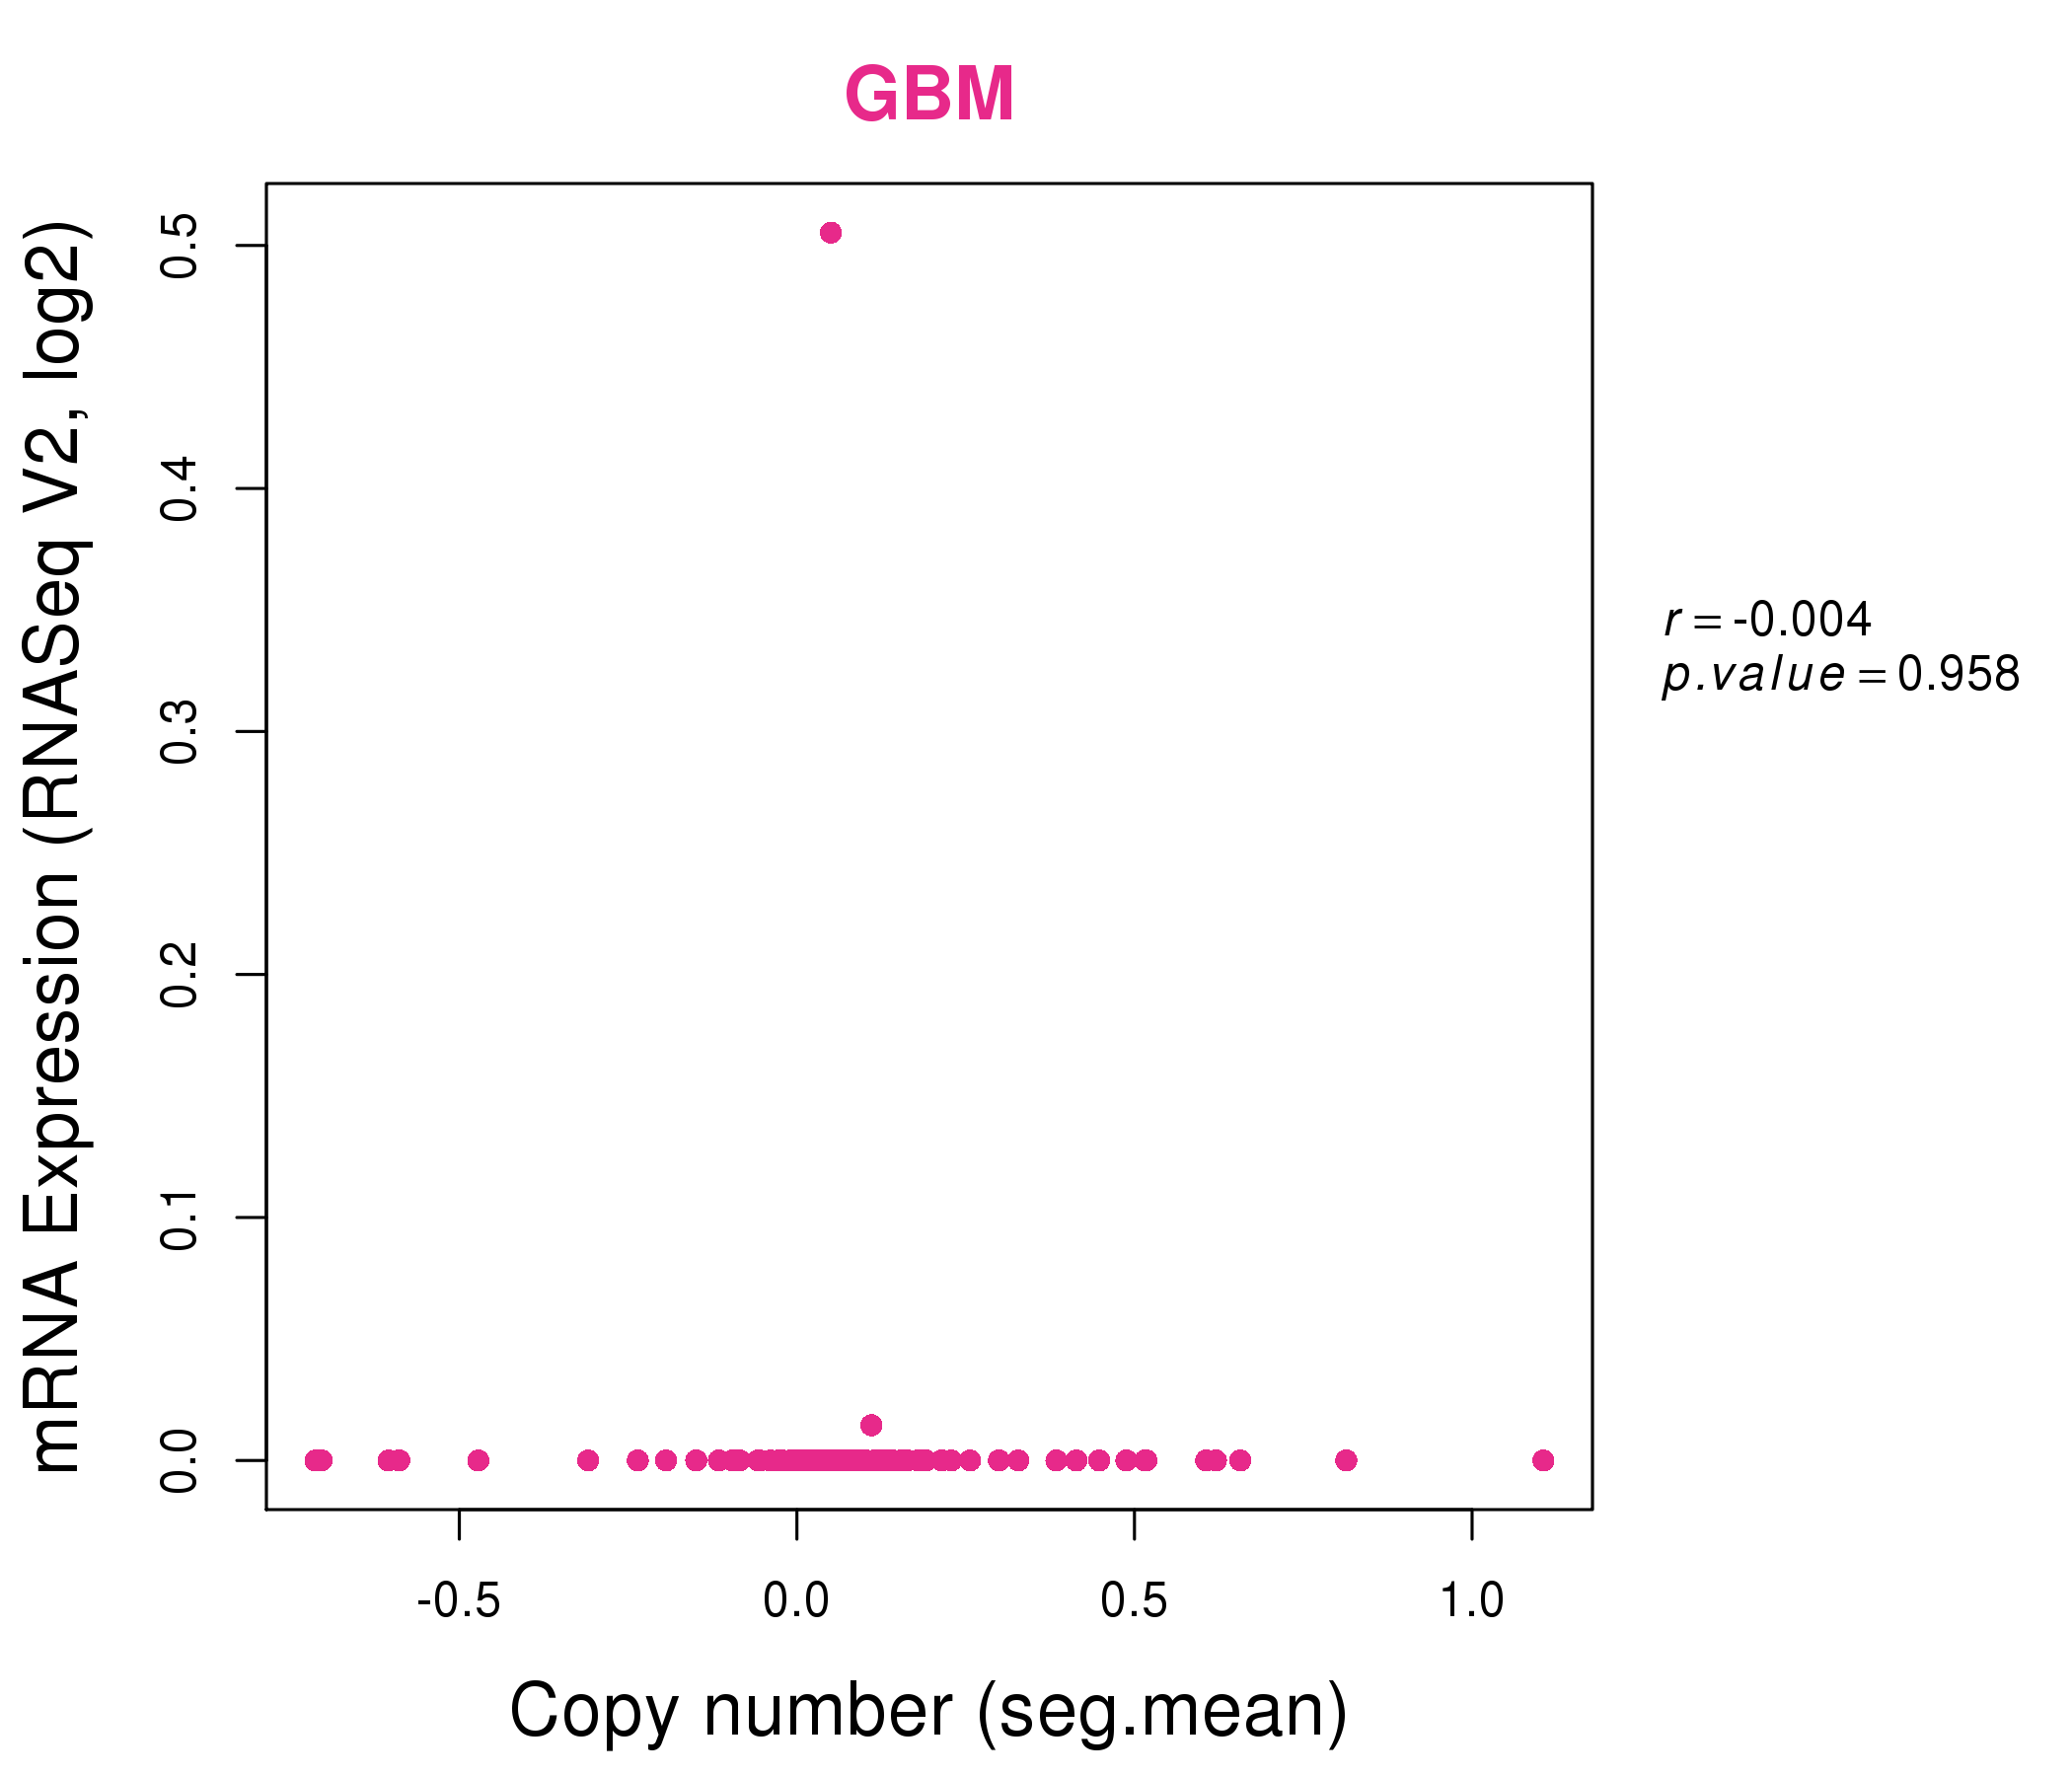
| * This plots show the correlation between CNV and gene expression. |
: Open all plots for all cancer types
 |
|
 |
|
| Top |
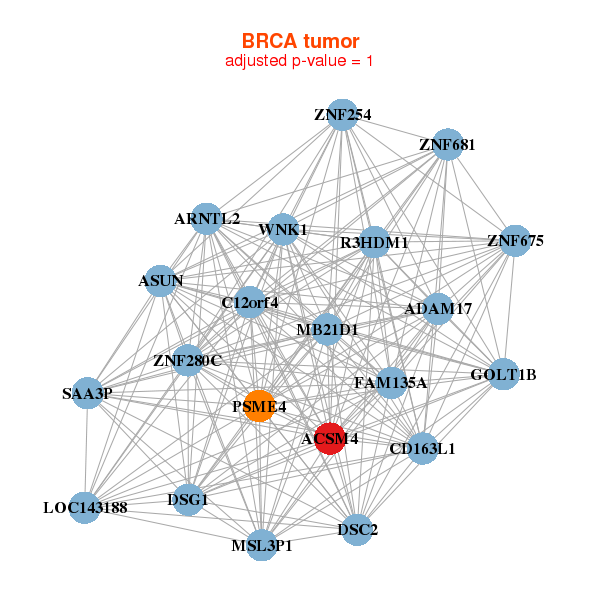
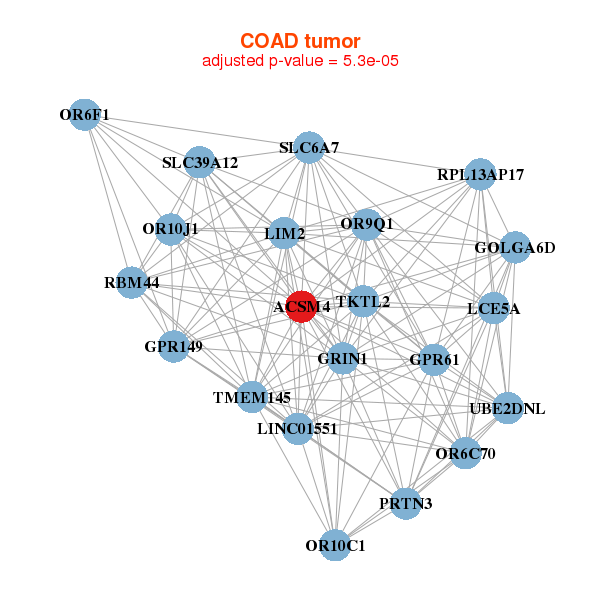
| Gene-Gene Network Information |
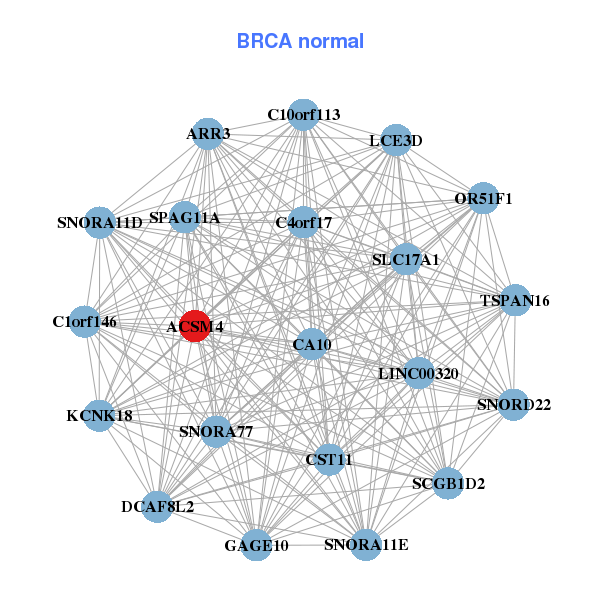
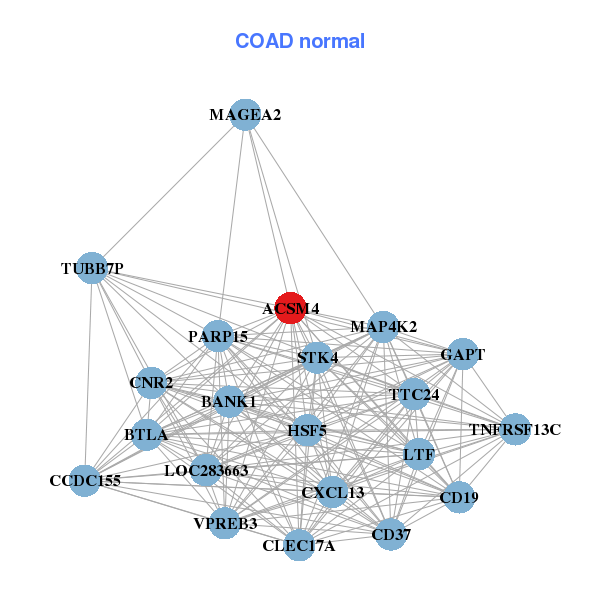
| * Co-Expression network figures were drawn using R package igraph. Only the top 20 genes with the highest correlations were shown. Red circle: input gene, orange circle: cell metabolism gene, sky circle: other gene |
: Open all plots for all cancer types
 |
|
| ACSM4,ADAM17,ARNTL2,ASUN,C12orf4,MB21D1,CD163L1, DSC2,DSG1,FAM135A,GOLT1B,WNK1,LOC143188,MSL3P1, PSME4,R3HDM1,SAA3P,ZNF254,ZNF280C,ZNF675,ZNF681 | ACSM4,ARR3,C10orf113,C1orf146,LINC00320,C4orf17,CA10, CST11,DCAF8L2,GAGE10,KCNK18,LCE3D,OR51F1,SCGB1D2, SLC17A1,SNORA11D,SNORA11E,SNORA77,SNORD22,SPAG11A,TSPAN16 |
 |
|
| ACSM4,LINC01551,GOLGA6D,GPR149,GPR61,GRIN1,LCE5A, LIM2,OR10C1,OR10J1,OR6C70,OR6F1,OR9Q1,PRTN3, RBM44,RPL13AP17,SLC39A12,SLC6A7,TKTL2,TMEM145,UBE2DNL | ACSM4,BANK1,BTLA,CCDC155,CD19,CD37,CLEC17A, CNR2,CXCL13,GAPT,HSF5,LOC283663,LTF,MAGEA2, MAP4K2,PARP15,STK4,TNFRSF13C,TTC24,TUBB7P,VPREB3 |
| * Co-Expression network figures were drawn using R package igraph. Only the top 20 genes with the highest correlations were shown. Red circle: input gene, orange circle: cell metabolism gene, sky circle: other gene |
: Open all plots for all cancer types
| Top |
: Open all interacting genes' information including KEGG pathway for all interacting genes from DAVID
| Top |
| Pharmacological Information for ACSM4 |
| There's no related Drug. |
| Top |
| Cross referenced IDs for ACSM4 |
| * We obtained these cross-references from Uniprot database. It covers 150 different DBs, 18 categories. http://www.uniprot.org/help/cross_references_section |
: Open all cross reference information
|
Copyright © 2016-Present - The Univsersity of Texas Health Science Center at Houston @ |