|
||||||||||||||||||||
| |
| Phenotypic Information (metabolism pathway, cancer, disease, phenome) |
| |
| |
| Gene-Gene Network Information: Co-Expression Network, Interacting Genes & KEGG |
| |
|


| Gene Summary for IDH2 |
| Basic gene info. | Gene symbol | IDH2 |
| Gene name | isocitrate dehydrogenase 2 (NADP+), mitochondrial | |
| Synonyms | D2HGA2|ICD-M|IDH|IDHM|IDP|IDPM|mNADP-IDH | |
| Cytomap | UCSC genome browser: 15q26.1 | |
| Genomic location | chr15 :90627211-90645708 | |
| Type of gene | protein-coding | |
| RefGenes | NM_001289910.1, NM_001290114.1,NM_002168.3, | |
| Ensembl id | ENSG00000182054 | |
| Description | NADP(+)-specific ICDHisocitrate dehydrogenase [NADP], mitochondrialoxalosuccinate decarboxylase | |
| Modification date | 20141207 | |
| dbXrefs | MIM : 147650 | |
| HGNC : HGNC | ||
| HPRD : 00973 | ||
| Protein | UniProt: P48735 go to UniProt's Cross Reference DB Table | |
| Expression | CleanEX: HS_IDH2 | |
| BioGPS: 3418 | ||
| Gene Expression Atlas: ENSG00000182054 | ||
| The Human Protein Atlas: ENSG00000182054 | ||
| Pathway | NCI Pathway Interaction Database: IDH2 | |
| KEGG: IDH2 | ||
| REACTOME: IDH2 | ||
| ConsensusPathDB | ||
| Pathway Commons: IDH2 | ||
| Metabolism | MetaCyc: IDH2 | |
| HUMANCyc: IDH2 | ||
| Regulation | Ensembl's Regulation: ENSG00000182054 | |
| miRBase: chr15 :90,627,211-90,645,708 | ||
| TargetScan: NM_001289910 | ||
| cisRED: ENSG00000182054 | ||
| Context | iHOP: IDH2 | |
| cancer metabolism search in PubMed: IDH2 | ||
| UCL Cancer Institute: IDH2 | ||
| Assigned class in ccmGDB | A - This gene has a literature evidence and it belongs to cancer gene. | |
| References showing role of IDH2 in cancer cell metabolism | 1. Cairns RA, Mak TW (2013) Oncogenic isocitrate dehydrogenase mutations: mechanisms, models, and clinical opportunities. Cancer Discov 3: 730-741. doi: 10.1158/2159-8290.CD-13-0083. go to article 2. Shim EH, Livi CB, Rakheja D, Tan J, Benson D, et al. (2014) L-2-Hydroxyglutarate: an epigenetic modifier and putative oncometabolite in renal cancer. Cancer Discov 4: 1290-1298. doi: 10.1158/2159-8290.CD-13-0696. pmid: 4286872. go to article 3. Lu C, Venneti S, Akalin A, Fang F, Ward PS, et al. (2013) Induction of sarcomas by mutant IDH2. Genes Dev 27: 1986-1998. doi: 10.1101/gad.226753.113. pmid: 3792475. go to article 4. Akbay EA, Moslehi J, Christensen CL, Saha S, Tchaicha JH, et al. (2014) D-2-hydroxyglutarate produced by mutant IDH2 causes cardiomyopathy and neurodegeneration in mice. Genes Dev 28: 479-490. doi: 10.1101/gad.231233.113. pmid: 3950345. go to article 5. Kats LM, Reschke M, Taulli R, Pozdnyakova O, Burgess K, et al. (2014) Proto-oncogenic role of mutant IDH2 in leukemia initiation and maintenance. Cell Stem Cell 14: 329-341. doi: 10.1016/j.stem.2013.12.016. pmid: 4380188. go to article | |
| Top |
| Phenotypic Information for IDH2(metabolism pathway, cancer, disease, phenome) |
| Cancer | CGAP: IDH2 |
| Familial Cancer Database: IDH2 | |
| * This gene is included in those cancer gene databases. |
|
|
|
|
|
|
| ||||||||||||||
Oncogene 1 | ||||||||||||||||||||
| cf) number; DB name 1 Oncogene; http://nar.oxfordjournals.org/content/35/suppl_1/D721.long, 2 Tumor Suppressor gene; https://bioinfo.uth.edu/TSGene/, 3 Cancer Gene Census; http://www.nature.com/nrc/journal/v4/n3/abs/nrc1299.html, 4 CancerGenes; http://nar.oxfordjournals.org/content/35/suppl_1/D721.long, 5 Network of Cancer Gene; http://ncg.kcl.ac.uk/index.php, 6 http://www.nejm.org/doi/full/10.1056/NEJMoa1301689, 7 http://www.nejm.org/doi/full/10.1056/NEJMoa1402121, 8Therapeutic Vulnerabilities in Cancer; http://cbio.mskcc.org/cancergenomics/statius/ |
| KEGG_GLUTATHIONE_METABOLISM REACTOME_PYRUVATE_METABOLISM_AND_CITRIC_ACID_TCA_CYCLE | |
| OMIM | 147650; gene. 613657; phenotype. |
| Orphanet | 163634; Maffucci syndrome. 296; Enchondromatosis. 79315; D-2-hydroxyglutaric aciduria. |
| Disease | KEGG Disease: IDH2 |
| MedGen: IDH2 (Human Medical Genetics with Condition) | |
| ClinVar: IDH2 | |
| Phenotype | MGI: IDH2 (International Mouse Phenotyping Consortium) |
| PhenomicDB: IDH2 | |
| Mutations for IDH2 |
| * Under tables are showing count per each tissue to give us broad intuition about tissue specific mutation patterns.You can go to the detailed page for each mutation database's web site. |
| There's no structural variation information in COSMIC data for this gene. |
| * From mRNA Sanger sequences, Chitars2.0 arranged chimeric transcripts. This table shows IDH2 related fusion information. |
| ID | Head Gene | Tail Gene | Accession | Gene_a | qStart_a | qEnd_a | Chromosome_a | tStart_a | tEnd_a | Gene_a | qStart_a | qEnd_a | Chromosome_a | tStart_a | tEnd_a |
| AA091237 | IDH2 | 1 | 92 | 15 | 90630670 | 90630761 | IDH2 | 93 | 261 | 15 | 90631591 | 90631849 | |
| Z28531 | IDH2 | 1 | 80 | 15 | 90627408 | 90627487 | KIF1C | 74 | 279 | 17 | 4927083 | 4927289 | |
| U52144 | RPS11 | 1 | 176 | 19 | 50002769 | 50002945 | IDH2 | 168 | 1591 | 15 | 90627210 | 90633860 | |
| AV658020 | IDH2 | 1 | 179 | 15 | 90637602 | 90637780 | IDH2 | 176 | 349 | 15 | 90639021 | 90639248 | |
| Top |
| There's no copy number variation information in COSMIC data for this gene. |
| Top |
|
 |
| Top |
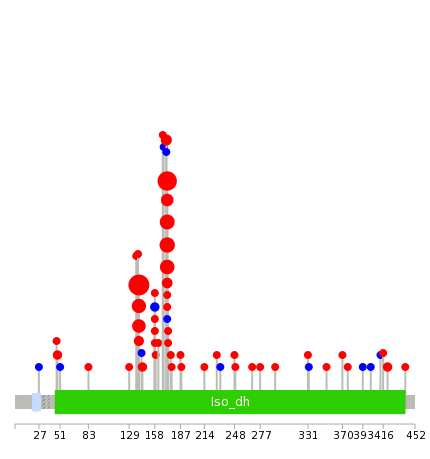
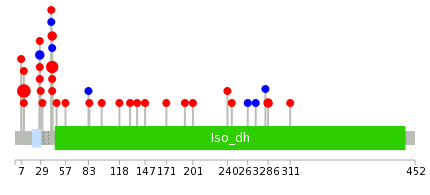
| Stat. for Non-Synonymous SNVs (# total SNVs=1471) | (# total SNVs=12) |
 |  |
(# total SNVs=1) | (# total SNVs=0) |
 |
| Top |
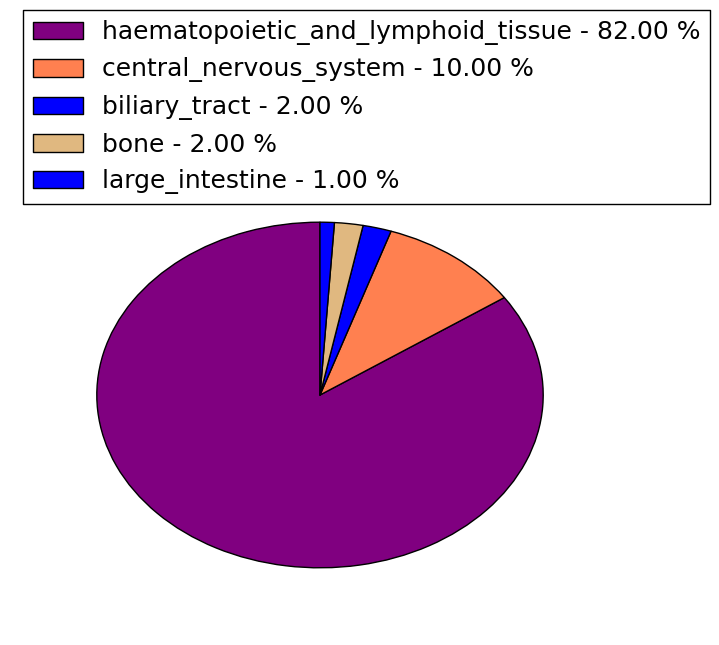
| * When you move the cursor on each content, you can see more deailed mutation information on the Tooltip. Those are primary_site,primary_histology,mutation(aa),pubmedID. |
| GRCh37 position | Mutation(aa) | Unique sampleID count |
| chr15:90631934-90631934 | p.R140Q | 436 |
| chr15:90631838-90631838 | p.R172K | 204 |
| chr15:90631837-90631837 | p.R172S | 29 |
| chr15:90631839-90631839 | p.R172G | 23 |
| chr15:90631935-90631935 | p.R140W | 12 |
| chr15:90631841-90631841 | p.G171D | 5 |
| chr15:90631879-90631879 | p.P158P | 2 |
| chr15:90631880-90631880 | p.P158L | 2 |
| chr15:90631881-90631881 | p.P158T | 2 |
| chr15:90634848-90634848 | p.K48N | 2 |
| Top |
|
 |
| Point Mutation/ Tissue ID | 1 | 2 | 3 | 4 | 5 | 6 | 7 | 8 | 9 | 10 | 11 | 12 | 13 | 14 | 15 | 16 | 17 | 18 | 19 | 20 |
| # sample | 18 | 1 | 20 | 1 | 1 | 2 | 2 | 6 | ||||||||||||
| # mutation | 14 | 1 | 2 | 2 | 1 | 2 | 2 | 7 | ||||||||||||
| nonsynonymous SNV | 11 | 1 | 2 | 1 | 1 | 2 | 2 | 5 | ||||||||||||
| synonymous SNV | 4 | 1 | 2 |
| cf) Tissue ID; Tissue type (1; BLCA[Bladder Urothelial Carcinoma], 2; BRCA[Breast invasive carcinoma], 3; CESC[Cervical squamous cell carcinoma and endocervical adenocarcinoma], 4; COAD[Colon adenocarcinoma], 5; GBM[Glioblastoma multiforme], 6; Glioma Low Grade, 7; HNSC[Head and Neck squamous cell carcinoma], 8; KICH[Kidney Chromophobe], 9; KIRC[Kidney renal clear cell carcinoma], 10; KIRP[Kidney renal papillary cell carcinoma], 11; LAML[Acute Myeloid Leukemia], 12; LUAD[Lung adenocarcinoma], 13; LUSC[Lung squamous cell carcinoma], 14; OV[Ovarian serous cystadenocarcinoma ], 15; PAAD[Pancreatic adenocarcinoma], 16; PRAD[Prostate adenocarcinoma], 17; SKCM[Skin Cutaneous Melanoma], 18:STAD[Stomach adenocarcinoma], 19:THCA[Thyroid carcinoma], 20:UCEC[Uterine Corpus Endometrial Carcinoma]) |
| Top |
| * We represented just top 10 SNVs. When you move the cursor on each content, you can see more deailed mutation information on the Tooltip. Those are primary_site, primary_histology, mutation(aa), pubmedID. |
| Genomic Position | Mutation(aa) | Unique sampleID count |
| chr15:90631934 | p.R10Q,IDH2 | 17 |
| chr15:90631838 | p.R42K,IDH2 | 10 |
| chr15:90631837 | p.R42S,IDH2 | 3 |
| chr15:90631879 | p.P28P,IDH2 | 2 |
| chr15:90631880 | p.P28L,IDH2 | 2 |
| chr15:90628072 | p.A286V,IDH2 | 2 |
| chr15:90628080 | p.C272C,IDH2 | 1 |
| chr15:90630742 | p.R263R,IDH2 | 1 |
| chr15:90628113 | p.R42W,IDH2 | 1 |
| chr15:90630804 | p.W245L,IDH2 | 1 |
| * Copy number data were extracted from TCGA using R package TCGA-Assembler. The URLs of all public data files on TCGA DCC data server were gathered on Jan-05-2015. Function ProcessCNAData in TCGA-Assembler package was used to obtain gene-level copy number value which is calculated as the average copy number of the genomic region of a gene. |
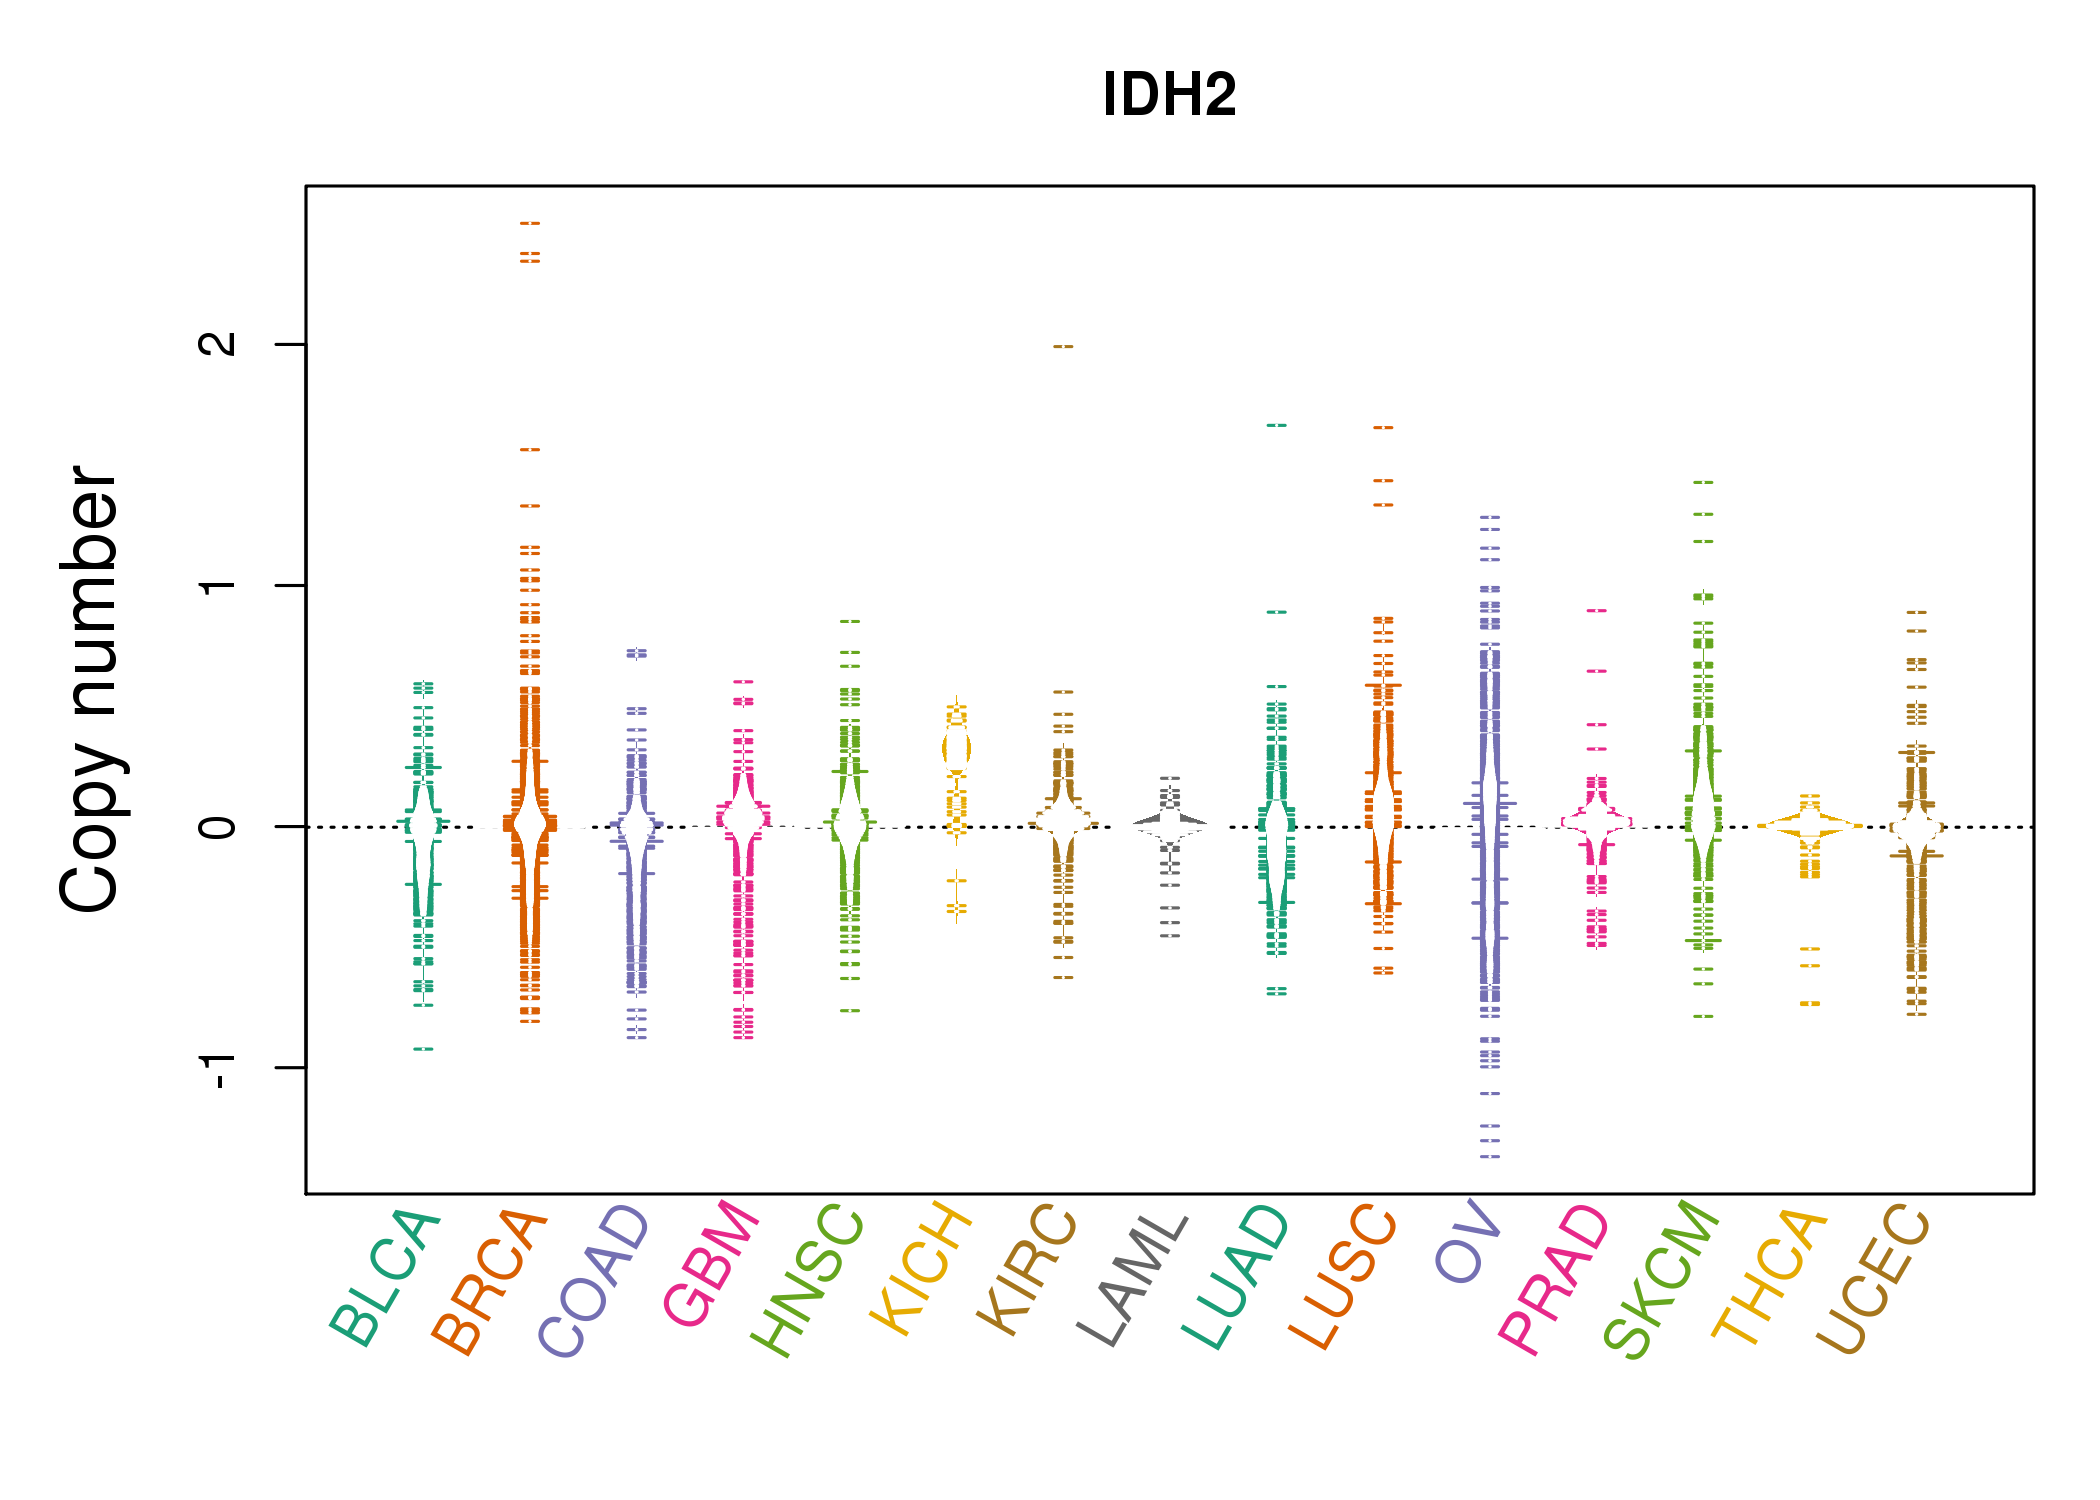 |
| cf) Tissue ID[Tissue type]: BLCA[Bladder Urothelial Carcinoma], BRCA[Breast invasive carcinoma], CESC[Cervical squamous cell carcinoma and endocervical adenocarcinoma], COAD[Colon adenocarcinoma], GBM[Glioblastoma multiforme], Glioma Low Grade, HNSC[Head and Neck squamous cell carcinoma], KICH[Kidney Chromophobe], KIRC[Kidney renal clear cell carcinoma], KIRP[Kidney renal papillary cell carcinoma], LAML[Acute Myeloid Leukemia], LUAD[Lung adenocarcinoma], LUSC[Lung squamous cell carcinoma], OV[Ovarian serous cystadenocarcinoma ], PAAD[Pancreatic adenocarcinoma], PRAD[Prostate adenocarcinoma], SKCM[Skin Cutaneous Melanoma], STAD[Stomach adenocarcinoma], THCA[Thyroid carcinoma], UCEC[Uterine Corpus Endometrial Carcinoma] |
| Top |
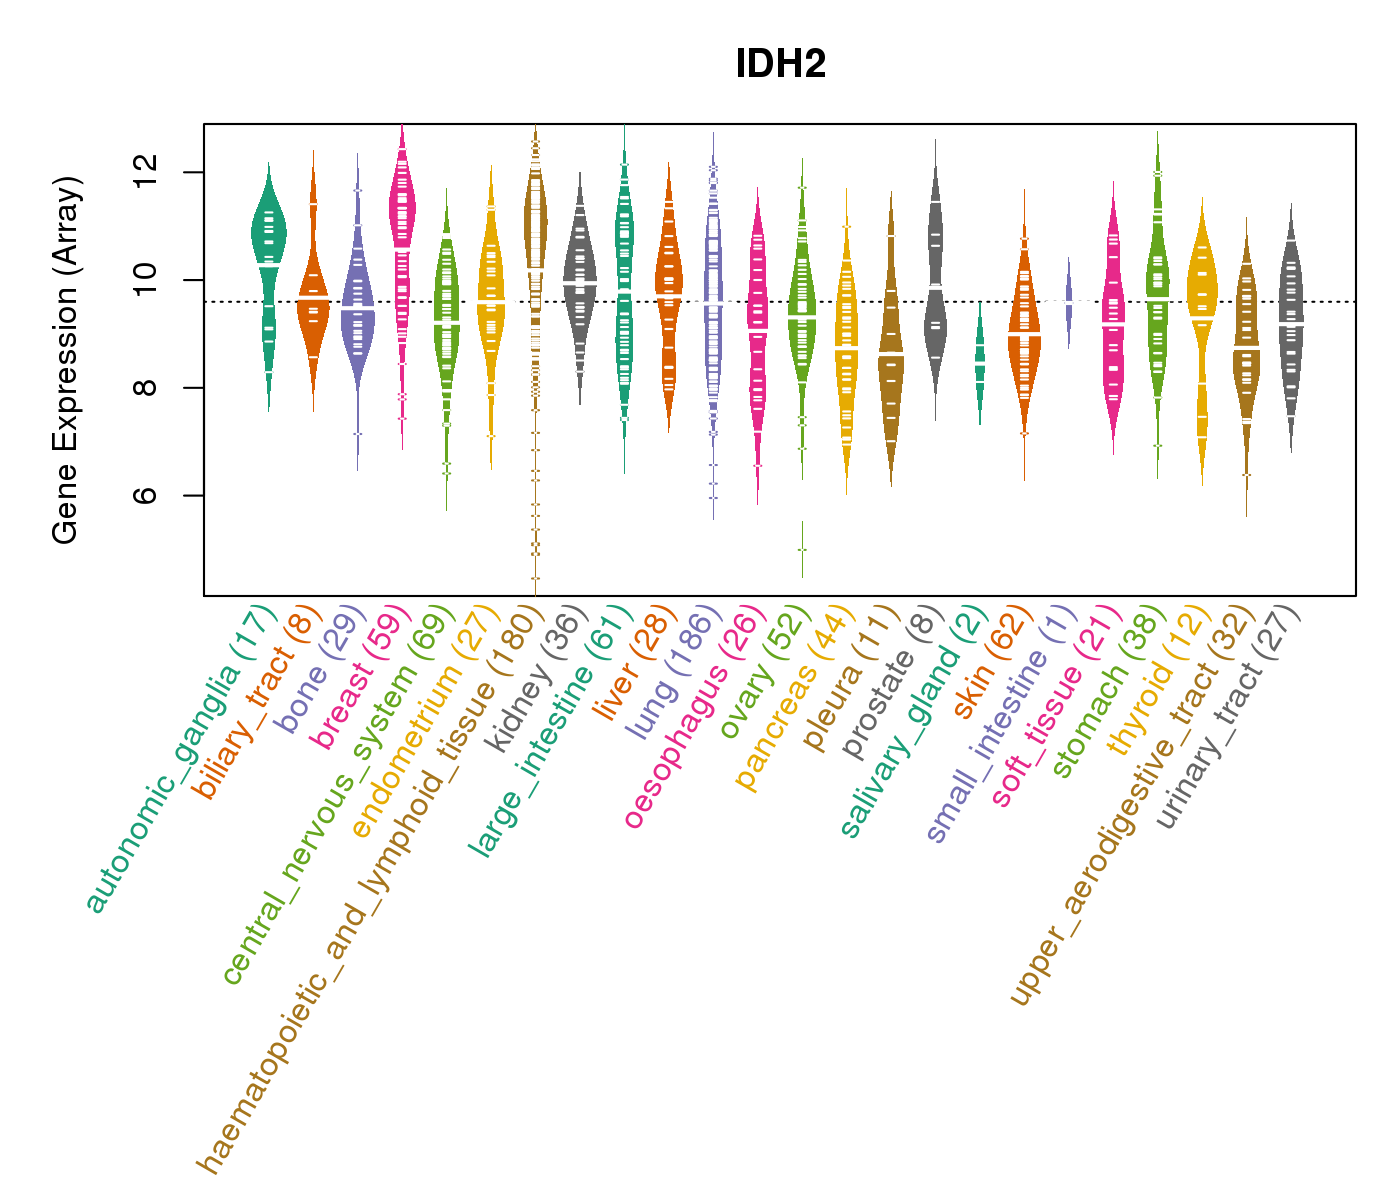
| Gene Expression for IDH2 |
| * CCLE gene expression data were extracted from CCLE_Expression_Entrez_2012-10-18.res: Gene-centric RMA-normalized mRNA expression data. |
 |
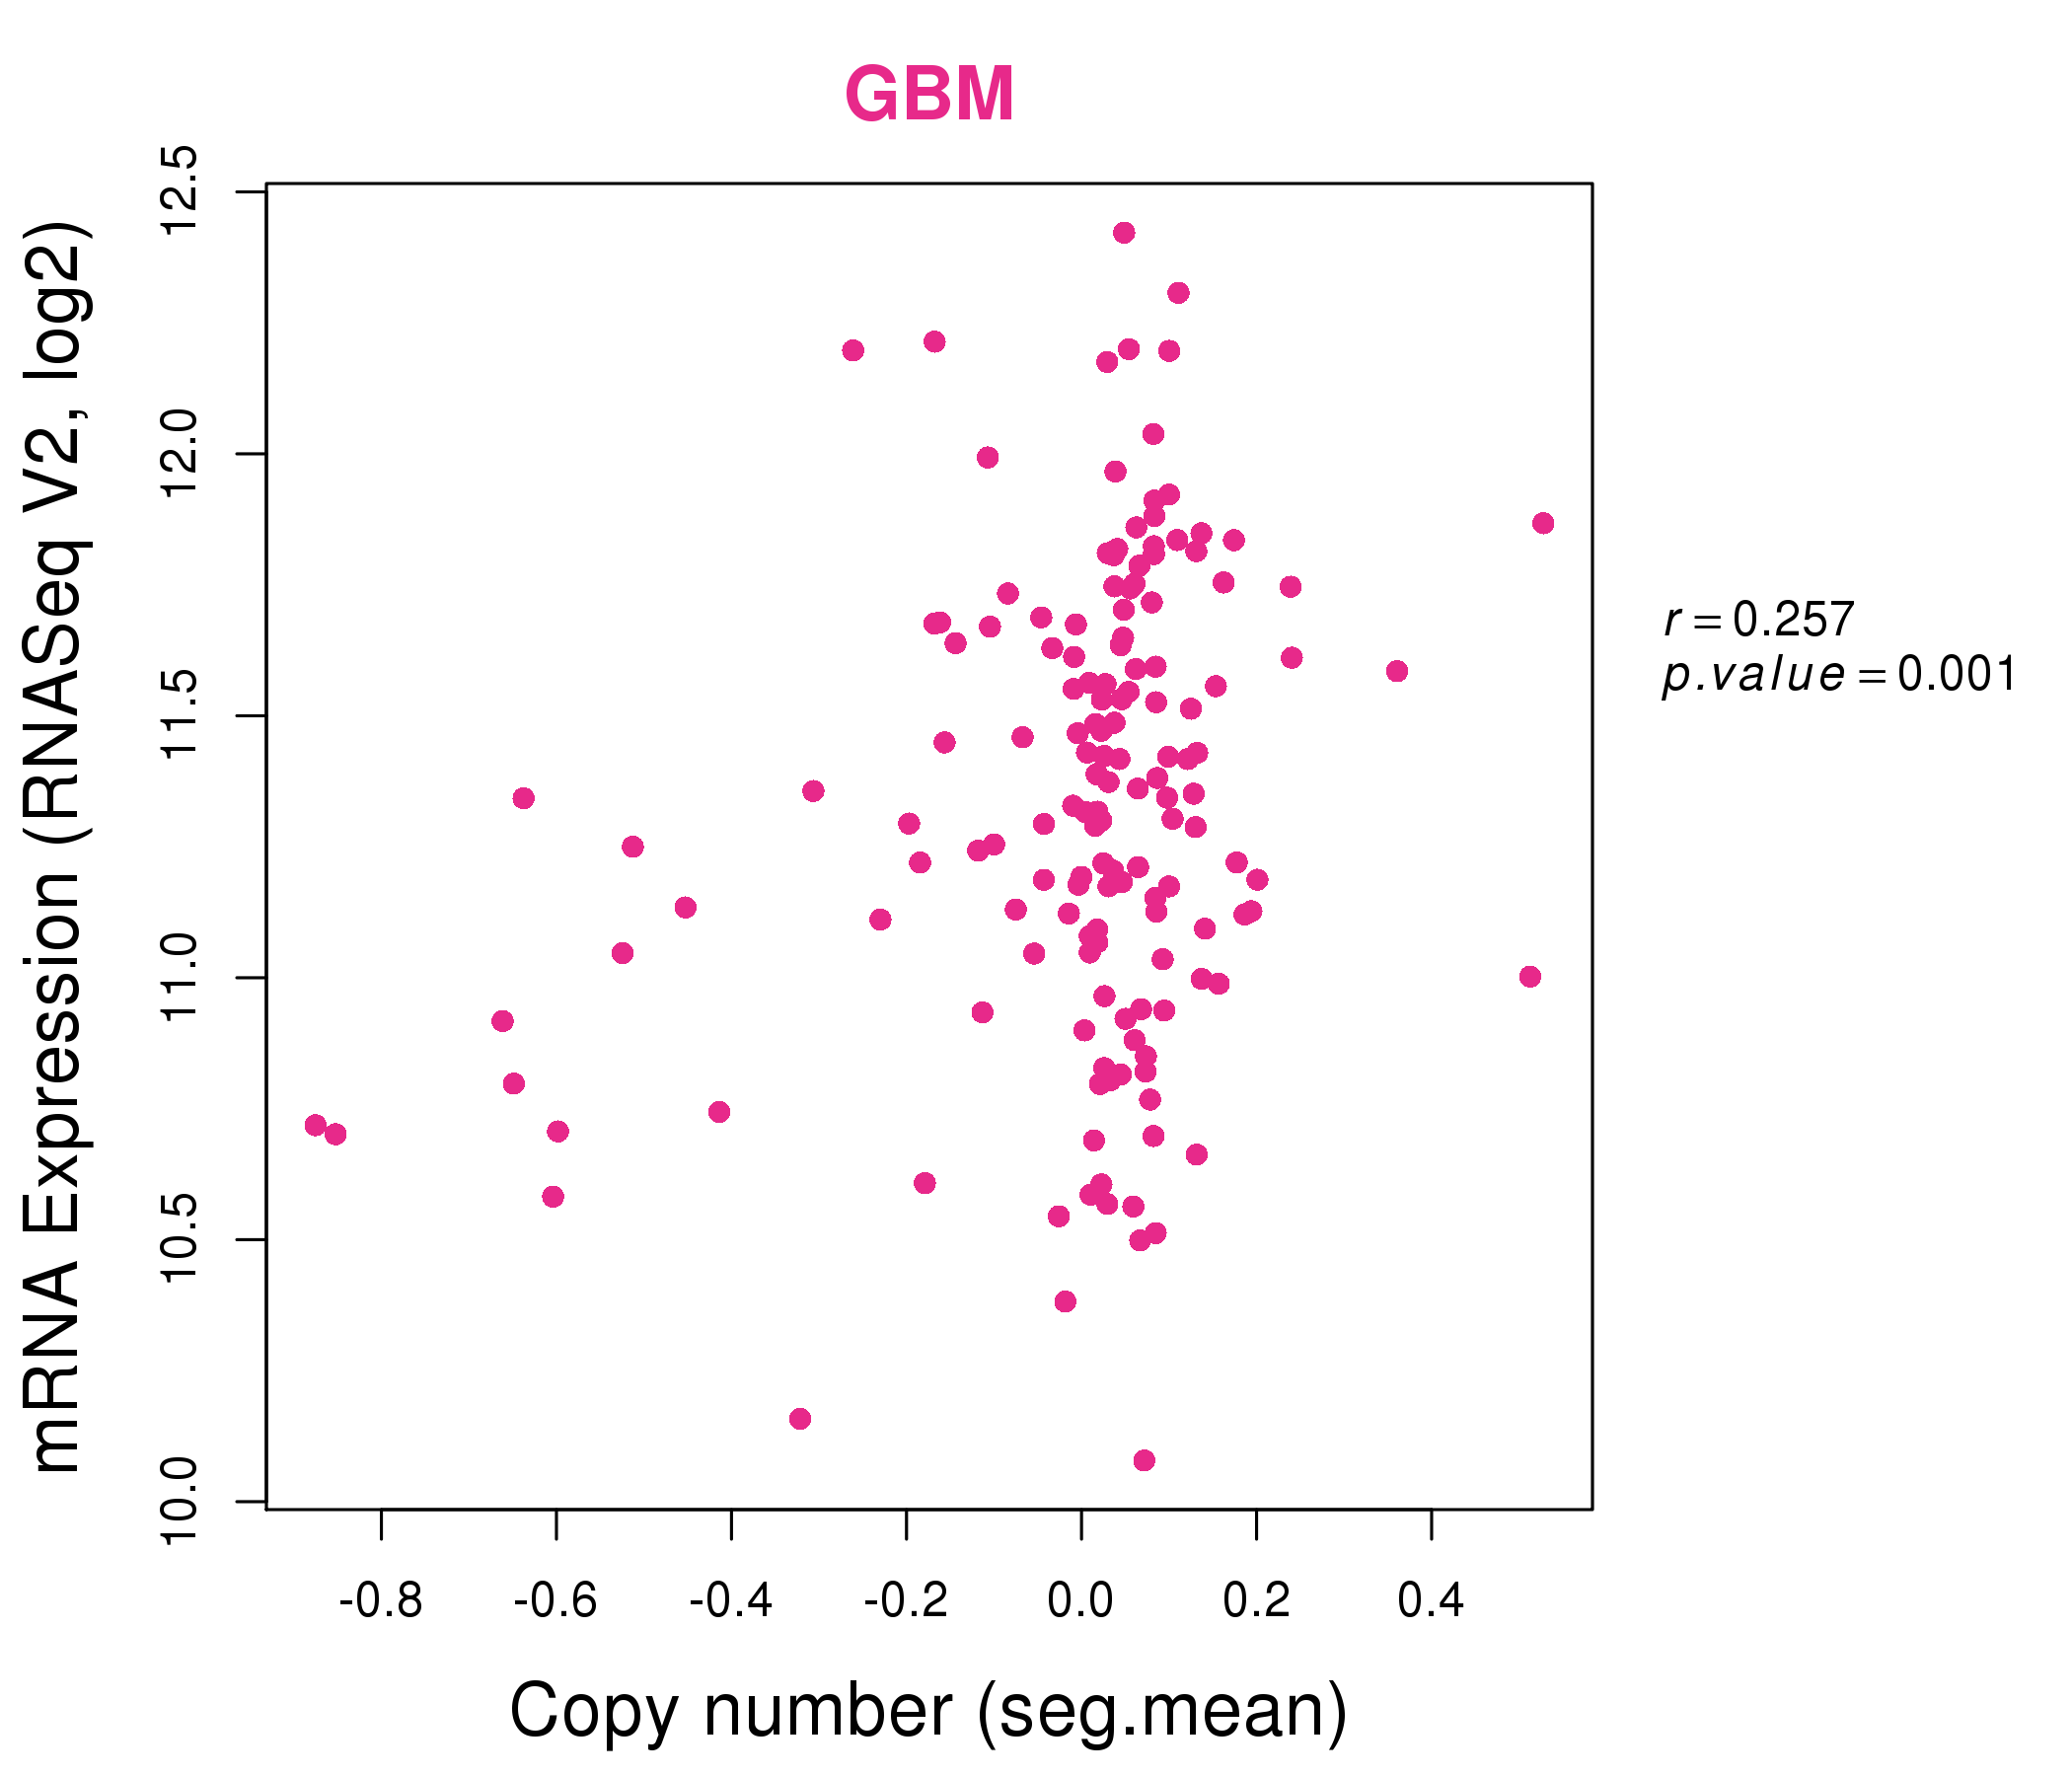
| * Normalized gene expression data of RNASeqV2 was extracted from TCGA using R package TCGA-Assembler. The URLs of all public data files on TCGA DCC data server were gathered at Jan-05-2015. Only eight cancer types have enough normal control samples for differential expression analysis. (t test, adjusted p<0.05 (using Benjamini-Hochberg FDR)) |
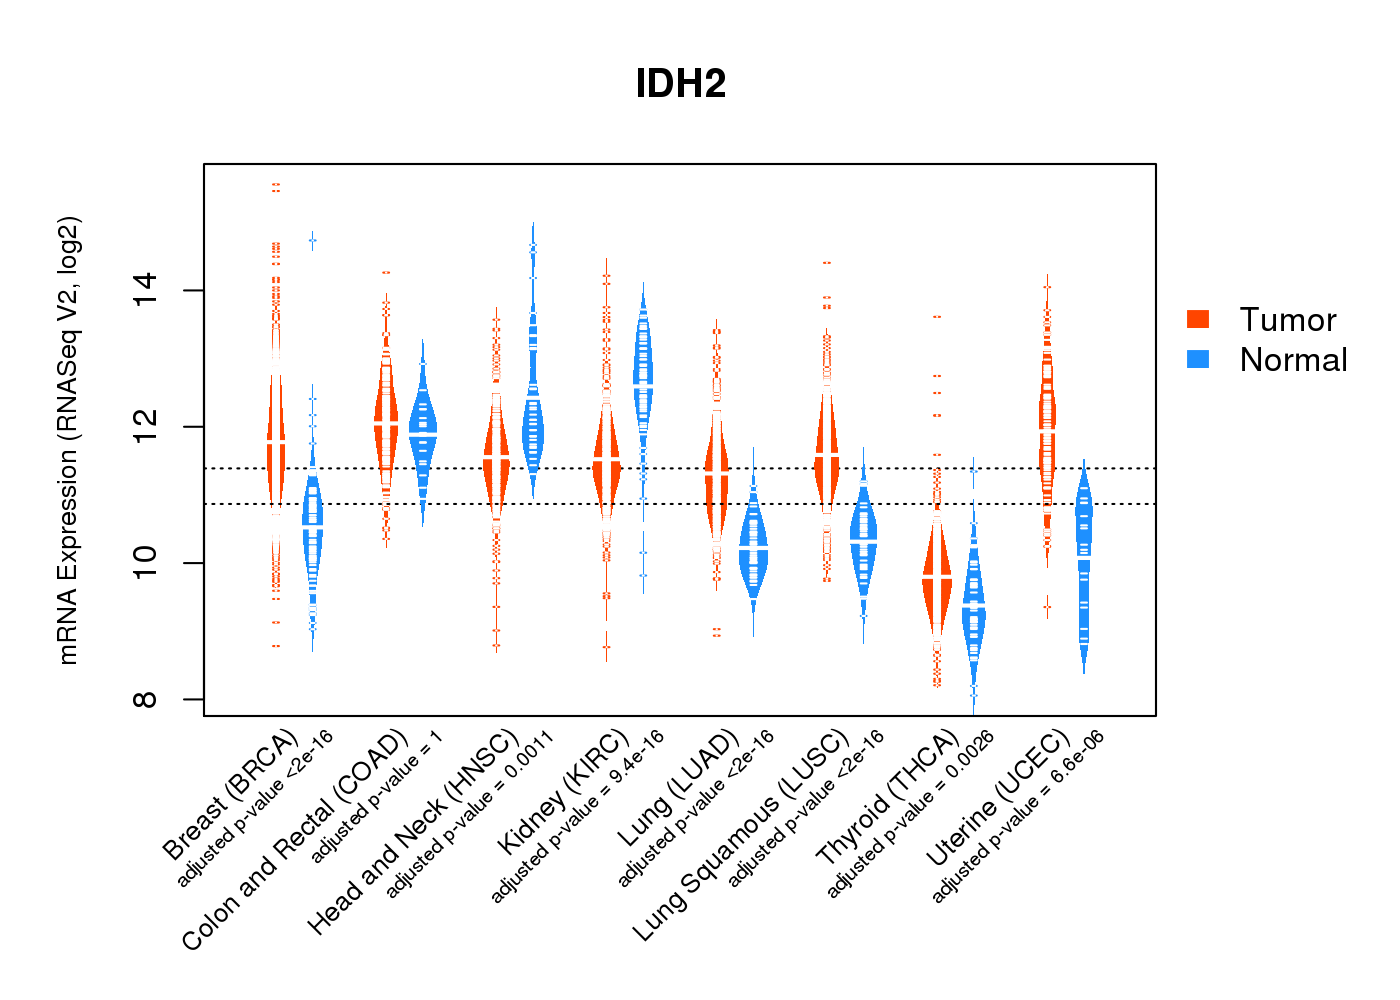 |
| Top |
| * This plots show the correlation between CNV and gene expression. |
: Open all plots for all cancer types
 |
|
 |
|

| Top |
| Gene-Gene Network Information |
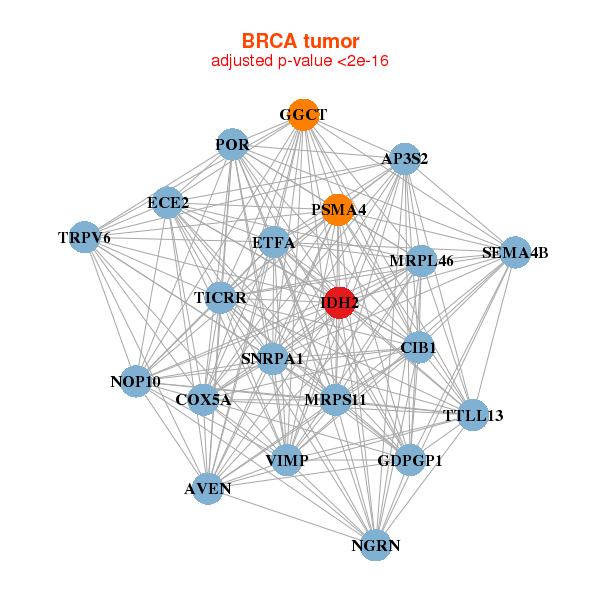
| * Co-Expression network figures were drawn using R package igraph. Only the top 20 genes with the highest correlations were shown. Red circle: input gene, orange circle: cell metabolism gene, sky circle: other gene |
: Open all plots for all cancer types
 |
|
| AP3S2,AVEN,TICRR,GDPGP1,CIB1,COX5A,ECE2, ETFA,GGCT,IDH2,MRPL46,MRPS11,NGRN,NOP10, POR,PSMA4,VIMP,SEMA4B,SNRPA1,TRPV6,TTLL13 | ADPRHL1,ALDOA,PERM1,CACNB1,CCDC28B,FEM1A,GAMT, GOT1,GOT2,HS3ST5,HSPA2,IDH2,IPO13,JSRP1, MYL6B,MYOM2,RNF123,RTN2,SH2B2,VDAC1,WDR62 |
 |
|
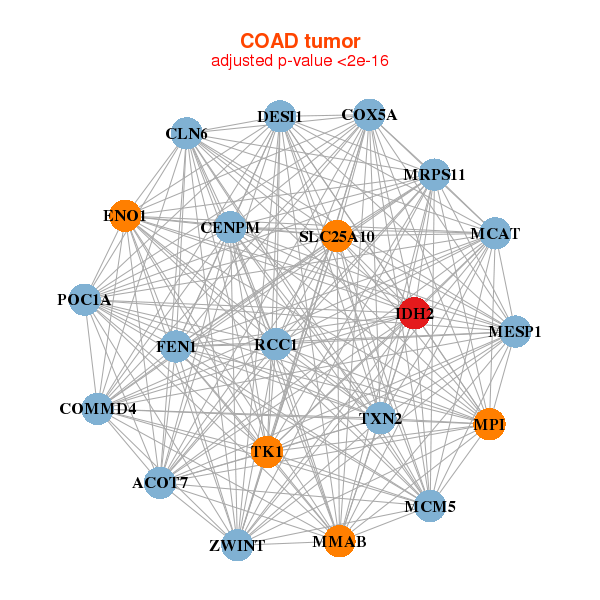
| ACOT7,CENPM,CLN6,COMMD4,COX5A,ENO1,FEN1, IDH2,MCAT,MCM5,MESP1,MMAB,MPI,MRPS11, POC1A,DESI1,RCC1,SLC25A10,TK1,TXN2,ZWINT | DPCD,DRAP1,EMD,FTSJ2,GLIPR2,GMPR,IDH2, KCNQ2,LDHB,MLH1,NUP62,OXCT1,PHF19,PPP2R4, RECQL,RHBDD1,SKA2,SLC25A28,TUBB,USP5,ZNF771 |


| * Co-Expression network figures were drawn using R package igraph. Only the top 20 genes with the highest correlations were shown. Red circle: input gene, orange circle: cell metabolism gene, sky circle: other gene |
: Open all plots for all cancer types
| Top |
: Open all interacting genes' information including KEGG pathway for all interacting genes from DAVID
| Top |
| Pharmacological Information for IDH2 |
| There's no related Drug. |
| Top |
| Cross referenced IDs for IDH2 |
| * We obtained these cross-references from Uniprot database. It covers 150 different DBs, 18 categories. http://www.uniprot.org/help/cross_references_section |
: Open all cross reference information
|
Copyright © 2016-Present - The Univsersity of Texas Health Science Center at Houston @ |