|
|||||||||||||||||||||||||||||||||||||||||||||||||||||||||||||||||||||||||||||||||||||||||||||||||||||||||||||||||||||||||||||||||||||||||||||||||||||||||||||||||||||||||||||||||||||||||||||||||||||||||||||||||||||||||||||||||||||||||||||||||||||||||||||||||||||||||||||||||||||||||||||||||||||||||||||||||||||||||||||||||||||||||||||
| |
| Phenotypic Information (metabolism pathway, cancer, disease, phenome) |
| |
| |
| Gene-Gene Network Information: Co-Expression Network, Interacting Genes & KEGG |
| |
|


| Gene Summary for IDH3A |
| Basic gene info. | Gene symbol | IDH3A |
| Gene name | isocitrate dehydrogenase 3 (NAD+) alpha | |
| Synonyms | - | |
| Cytomap | UCSC genome browser: 15q25.1-q25.2 | |
| Genomic location | chr15 :78441718-78462884 | |
| Type of gene | protein-coding | |
| RefGenes | NM_005530.2, | |
| Ensembl id | ENSG00000166411 | |
| Description | H-IDH alphaNAD(+)-specific ICDH subunit alphaNAD(H)-specific isocitrate dehydrogenase alpha subunitNAD+-specific ICDHisocitrate dehydrogenase (NAD+) alpha chainisocitrate dehydrogenase [NAD] subunit alpha, mitochondrialisocitric dehydrogenase subuni | |
| Modification date | 20141207 | |
| dbXrefs | MIM : 601149 | |
| HGNC : HGNC | ||
| HPRD : 03094 | ||
| Protein | UniProt: go to UniProt's Cross Reference DB Table | |
| Expression | CleanEX: HS_IDH3A | |
| BioGPS: 3419 | ||
| Gene Expression Atlas: ENSG00000166411 | ||
| The Human Protein Atlas: ENSG00000166411 | ||
| Pathway | NCI Pathway Interaction Database: IDH3A | |
| KEGG: IDH3A | ||
| REACTOME: IDH3A | ||
| ConsensusPathDB | ||
| Pathway Commons: IDH3A | ||
| Metabolism | MetaCyc: IDH3A | |
| HUMANCyc: IDH3A | ||
| Regulation | Ensembl's Regulation: ENSG00000166411 | |
| miRBase: chr15 :78,441,718-78,462,884 | ||
| TargetScan: NM_005530 | ||
| cisRED: ENSG00000166411 | ||
| Context | iHOP: IDH3A | |
| cancer metabolism search in PubMed: IDH3A | ||
| UCL Cancer Institute: IDH3A | ||
| Assigned class in ccmGDB | C | |
| Top |
| Phenotypic Information for IDH3A(metabolism pathway, cancer, disease, phenome) |
| Cancer | CGAP: IDH3A |
| Familial Cancer Database: IDH3A | |
| * This gene is included in those cancer gene databases. |
|
|
|
|
|
|
| |||||||||||||||||||||||||||||||||||||||||||||||||||||||||||||||||||||||||||||||||||||||||||||||||||||||||||||||||||||||||||||||||||||||||||||||||||||||||||||||||||||||||||||||||||||||||||||||||||||||||||||||||||||||||||||||||||||||||||||||||||||||||||||||||||||||||||||||||||||||||||||||||||||||||||||||||||||||||||||||||||||||
Oncogene 1 | Significant driver gene in | ||||||||||||||||||||||||||||||||||||||||||||||||||||||||||||||||||||||||||||||||||||||||||||||||||||||||||||||||||||||||||||||||||||||||||||||||||||||||||||||||||||||||||||||||||||||||||||||||||||||||||||||||||||||||||||||||||||||||||||||||||||||||||||||||||||||||||||||||||||||||||||||||||||||||||||||||||||||||||||||||||||||||||||
| cf) number; DB name 1 Oncogene; http://nar.oxfordjournals.org/content/35/suppl_1/D721.long, 2 Tumor Suppressor gene; https://bioinfo.uth.edu/TSGene/, 3 Cancer Gene Census; http://www.nature.com/nrc/journal/v4/n3/abs/nrc1299.html, 4 CancerGenes; http://nar.oxfordjournals.org/content/35/suppl_1/D721.long, 5 Network of Cancer Gene; http://ncg.kcl.ac.uk/index.php, 1Therapeutic Vulnerabilities in Cancer; http://cbio.mskcc.org/cancergenomics/statius/ |
| REACTOME_PYRUVATE_METABOLISM_AND_CITRIC_ACID_TCA_CYCLE | |
| OMIM | |
| Orphanet | |
| Disease | KEGG Disease: IDH3A |
| MedGen: IDH3A (Human Medical Genetics with Condition) | |
| ClinVar: IDH3A | |
| Phenotype | MGI: IDH3A (International Mouse Phenotyping Consortium) |
| PhenomicDB: IDH3A | |
| Mutations for IDH3A |
| * Under tables are showing count per each tissue to give us broad intuition about tissue specific mutation patterns.You can go to the detailed page for each mutation database's web site. |
| There's no structural variation information in COSMIC data for this gene. |
| * From mRNA Sanger sequences, Chitars2.0 arranged chimeric transcripts. This table shows IDH3A related fusion information. |
| ID | Head Gene | Tail Gene | Accession | Gene_a | qStart_a | qEnd_a | Chromosome_a | tStart_a | tEnd_a | Gene_a | qStart_a | qEnd_a | Chromosome_a | tStart_a | tEnd_a |
| AI571707 | IDH3A | 1 | 187 | 15 | 78461816 | 78462002 | IDH3A | 185 | 342 | 15 | 78461510 | 78461666 | |
| BE887604 | IDH3A | 20 | 79 | 15 | 78461654 | 78461713 | IDH3A | 72 | 386 | 15 | 78461692 | 78462006 | |
| Top |
| Mutation type/ Tissue ID | brca | cns | cerv | endome | haematopo | kidn | Lintest | liver | lung | ns | ovary | pancre | prost | skin | stoma | thyro | urina | |||
| Total # sample | 2 | |||||||||||||||||||
| GAIN (# sample) | 2 | |||||||||||||||||||
| LOSS (# sample) |
| cf) Tissue ID; Tissue type (1; Breast, 2; Central_nervous_system, 3; Cervix, 4; Endometrium, 5; Haematopoietic_and_lymphoid_tissue, 6; Kidney, 7; Large_intestine, 8; Liver, 9; Lung, 10; NS, 11; Ovary, 12; Pancreas, 13; Prostate, 14; Skin, 15; Stomach, 16; Thyroid, 17; Urinary_tract) |
| Top |
|
 |
| Top |
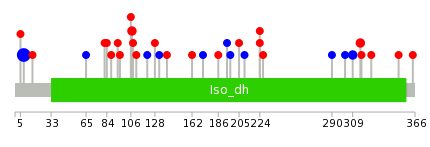
| Stat. for Non-Synonymous SNVs (# total SNVs=23) | (# total SNVs=20) |
 |  |
(# total SNVs=0) | (# total SNVs=0) |
| Top |
| * When you move the cursor on each content, you can see more deailed mutation information on the Tooltip. Those are primary_site,primary_histology,mutation(aa),pubmedID. |
| GRCh37 position | Mutation(aa) | Unique sampleID count |
| chr15:78441769-78441769 | p.S8S | 17 |
| chr15:78458554-78458554 | p.L309L | 2 |
| chr15:78458574-78458574 | p.R316H | 2 |
| chr15:78453952-78453952 | p.H107Y | 2 |
| chr15:78455907-78455907 | p.D224N | 2 |
| chr15:78452522-78452522 | p.M88T | 1 |
| chr15:78454029-78454029 | p.G132G | 1 |
| chr15:78458497-78458497 | p.H290H | 1 |
| chr15:78452527-78452527 | p.K90* | 1 |
| chr15:78454050-78454050 | p.D139E | 1 |
| Top |
|
 |
| Point Mutation/ Tissue ID | 1 | 2 | 3 | 4 | 5 | 6 | 7 | 8 | 9 | 10 | 11 | 12 | 13 | 14 | 15 | 16 | 17 | 18 | 19 | 20 |
| # sample | 1 | 6 | 1 | 1 | 1 | 2 | 1 | 3 | 2 | 6 | ||||||||||
| # mutation | 1 | 6 | 1 | 1 | 1 | 2 | 1 | 3 | 2 | 5 | ||||||||||
| nonsynonymous SNV | 1 | 5 | 1 | 1 | 2 | 3 | 3 | |||||||||||||
| synonymous SNV | 1 | 1 | 1 | 2 | 2 |
| cf) Tissue ID; Tissue type (1; BLCA[Bladder Urothelial Carcinoma], 2; BRCA[Breast invasive carcinoma], 3; CESC[Cervical squamous cell carcinoma and endocervical adenocarcinoma], 4; COAD[Colon adenocarcinoma], 5; GBM[Glioblastoma multiforme], 6; Glioma Low Grade, 7; HNSC[Head and Neck squamous cell carcinoma], 8; KICH[Kidney Chromophobe], 9; KIRC[Kidney renal clear cell carcinoma], 10; KIRP[Kidney renal papillary cell carcinoma], 11; LAML[Acute Myeloid Leukemia], 12; LUAD[Lung adenocarcinoma], 13; LUSC[Lung squamous cell carcinoma], 14; OV[Ovarian serous cystadenocarcinoma ], 15; PAAD[Pancreatic adenocarcinoma], 16; PRAD[Prostate adenocarcinoma], 17; SKCM[Skin Cutaneous Melanoma], 18:STAD[Stomach adenocarcinoma], 19:THCA[Thyroid carcinoma], 20:UCEC[Uterine Corpus Endometrial Carcinoma]) |
| Top |
| * We represented just top 10 SNVs. When you move the cursor on each content, you can see more deailed mutation information on the Tooltip. Those are primary_site, primary_histology, mutation(aa), pubmedID. |
| Genomic Position | Mutation(aa) | Unique sampleID count |
| chr15:78458574 | p.S82L | 2 |
| chr15:78452504 | p.R316H | 2 |
| chr15:78453965 | p.D364Y | 1 |
| chr15:78455916 | p.Y121Y | 1 |
| chr15:78453996 | p.V128F | 1 |
| chr15:78457365 | p.D139E | 1 |
| chr15:78454015 | p.D162A | 1 |
| chr15:78458533 | p.T172T | 1 |
| chr15:78454050 | p.K177K | 1 |
| chr15:78458546 | p.A197A | 1 |
| * Copy number data were extracted from TCGA using R package TCGA-Assembler. The URLs of all public data files on TCGA DCC data server were gathered on Jan-05-2015. Function ProcessCNAData in TCGA-Assembler package was used to obtain gene-level copy number value which is calculated as the average copy number of the genomic region of a gene. |
 |
| cf) Tissue ID[Tissue type]: BLCA[Bladder Urothelial Carcinoma], BRCA[Breast invasive carcinoma], CESC[Cervical squamous cell carcinoma and endocervical adenocarcinoma], COAD[Colon adenocarcinoma], GBM[Glioblastoma multiforme], Glioma Low Grade, HNSC[Head and Neck squamous cell carcinoma], KICH[Kidney Chromophobe], KIRC[Kidney renal clear cell carcinoma], KIRP[Kidney renal papillary cell carcinoma], LAML[Acute Myeloid Leukemia], LUAD[Lung adenocarcinoma], LUSC[Lung squamous cell carcinoma], OV[Ovarian serous cystadenocarcinoma ], PAAD[Pancreatic adenocarcinoma], PRAD[Prostate adenocarcinoma], SKCM[Skin Cutaneous Melanoma], STAD[Stomach adenocarcinoma], THCA[Thyroid carcinoma], UCEC[Uterine Corpus Endometrial Carcinoma] |
| Top |
| Gene Expression for IDH3A |
| * CCLE gene expression data were extracted from CCLE_Expression_Entrez_2012-10-18.res: Gene-centric RMA-normalized mRNA expression data. |
 |
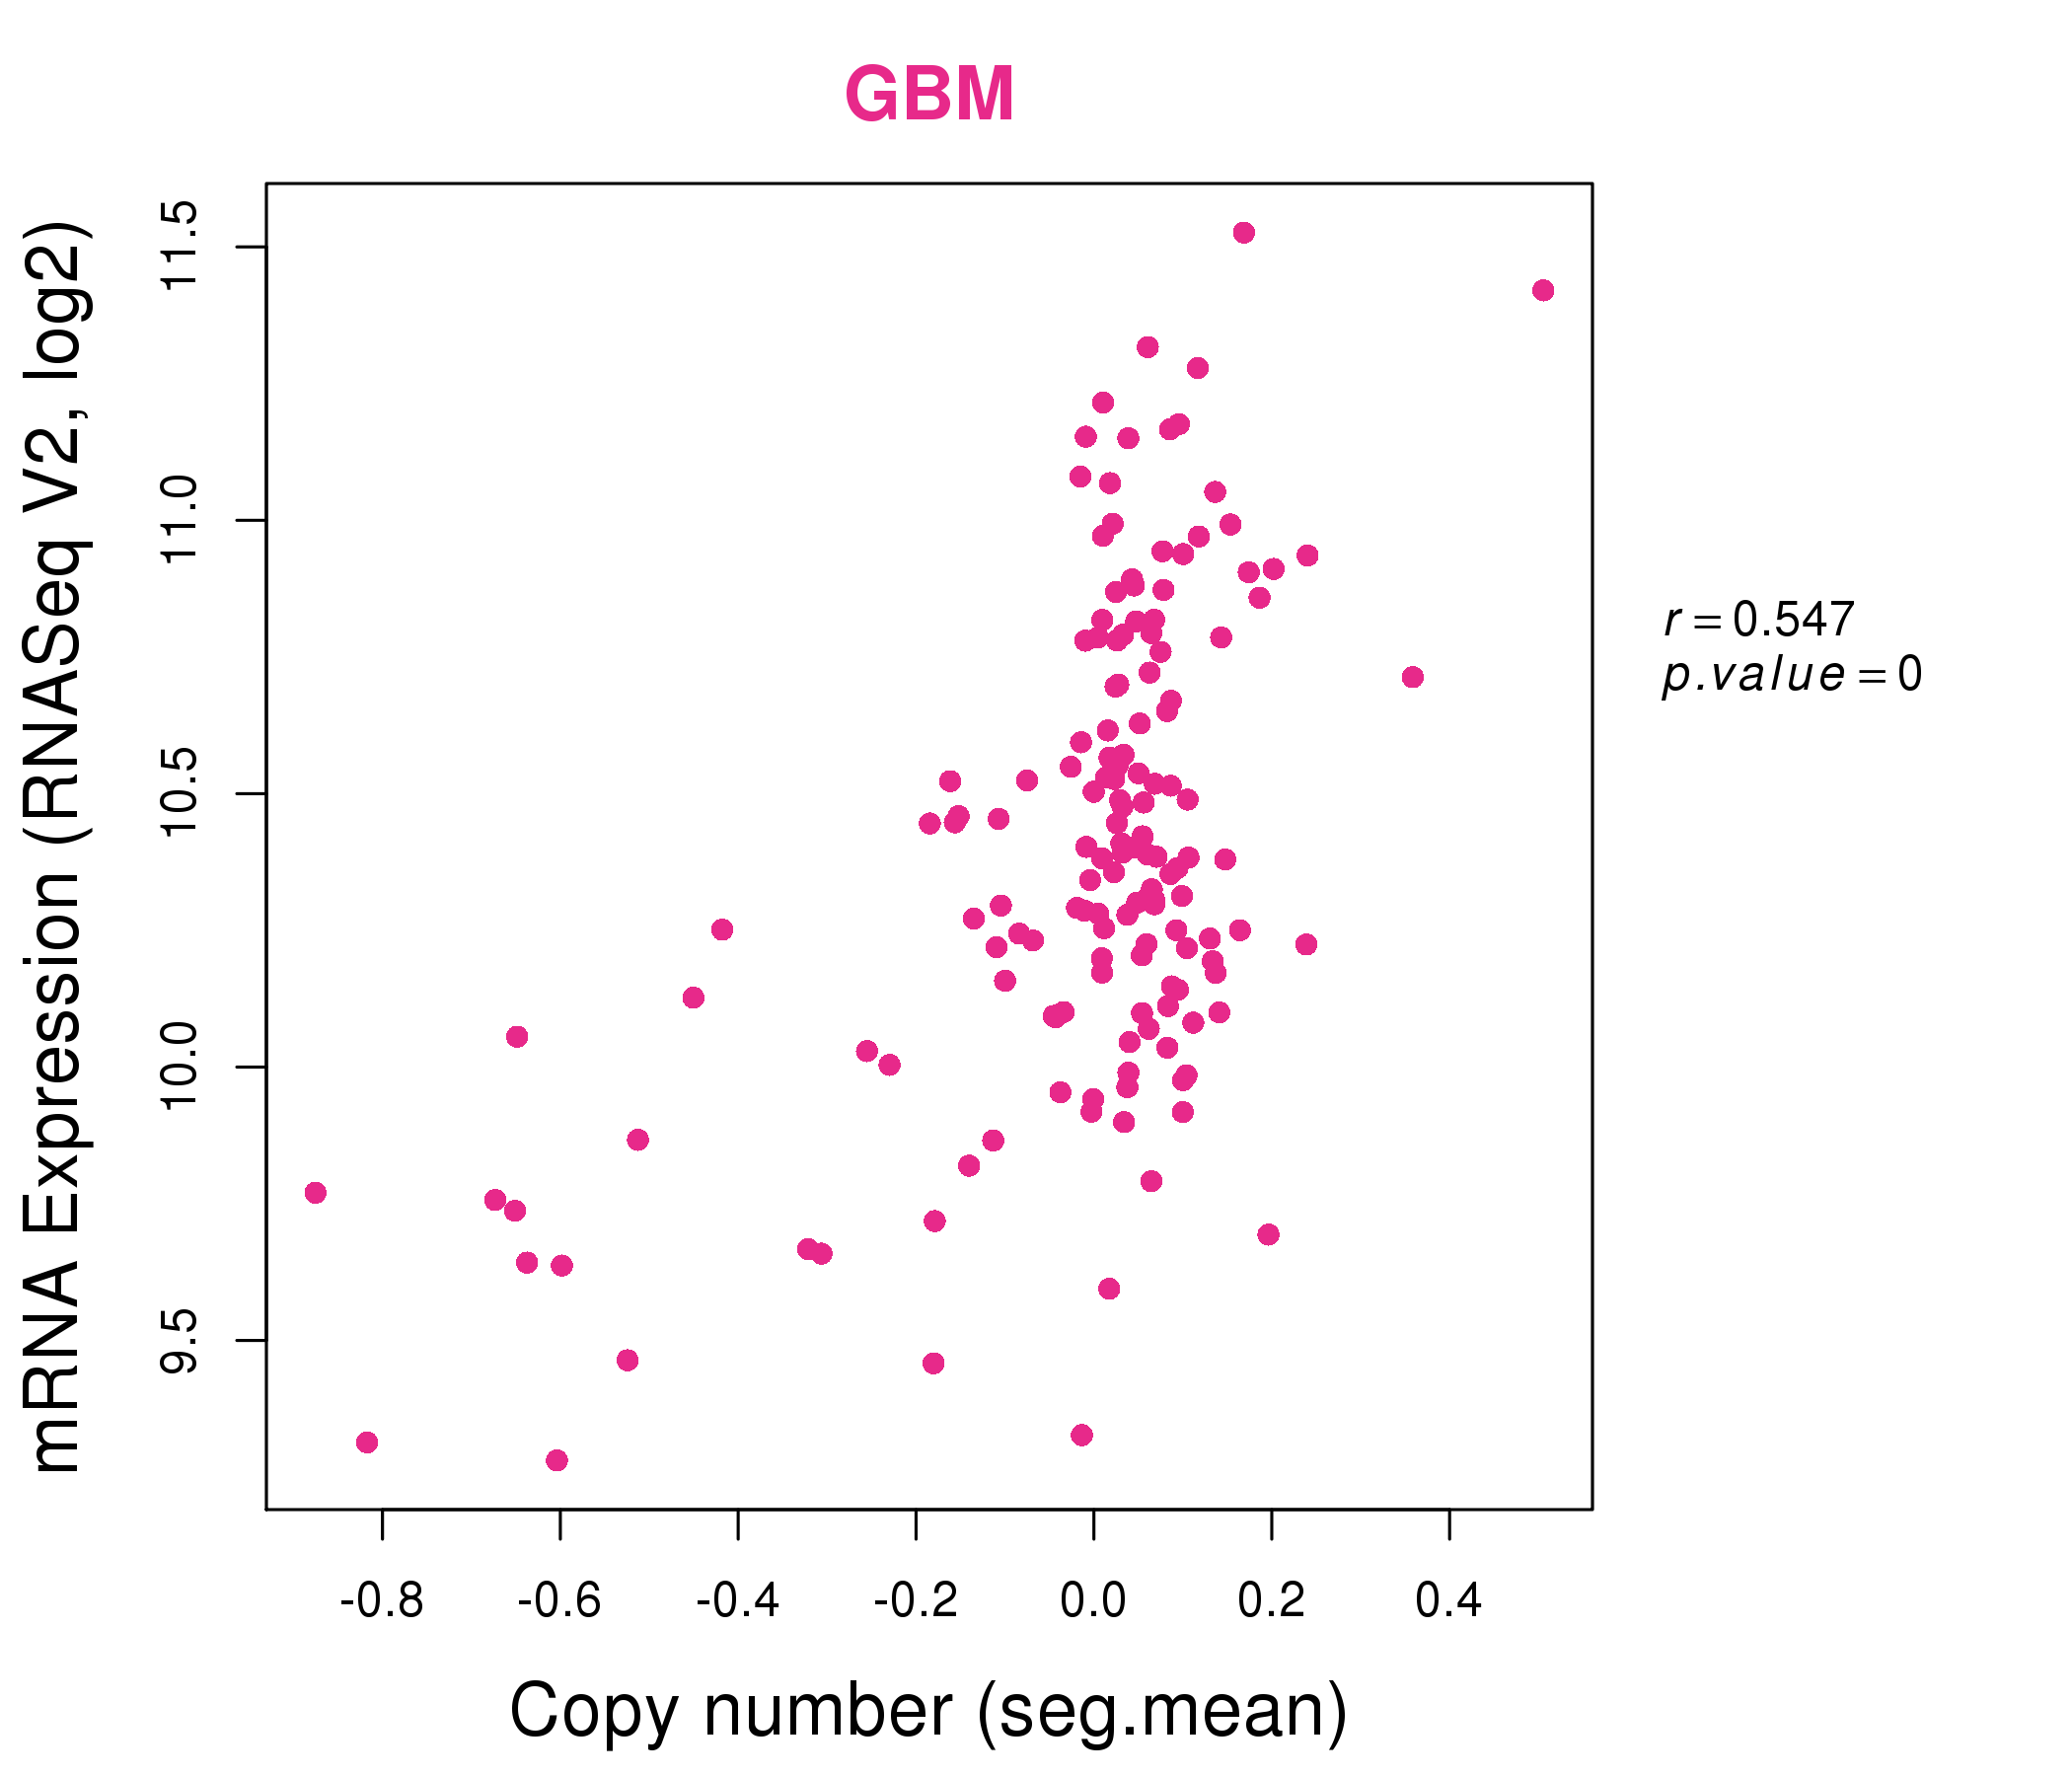
| * Normalized gene expression data of RNASeqV2 was extracted from TCGA using R package TCGA-Assembler. The URLs of all public data files on TCGA DCC data server were gathered at Jan-05-2015. Only eight cancer types have enough normal control samples for differential expression analysis. (t test, adjusted p<0.05 (using Benjamini-Hochberg FDR)) |
 |
| Top |
| * This plots show the correlation between CNV and gene expression. |
: Open all plots for all cancer types
 |
|
 |
|

| Top |
| Gene-Gene Network Information |
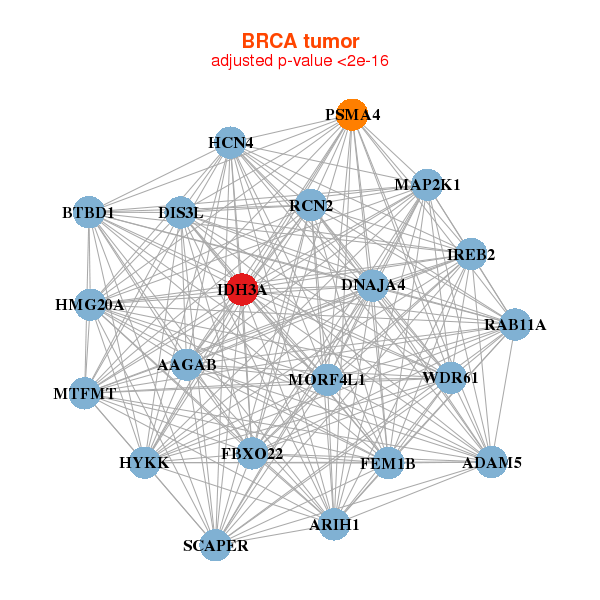
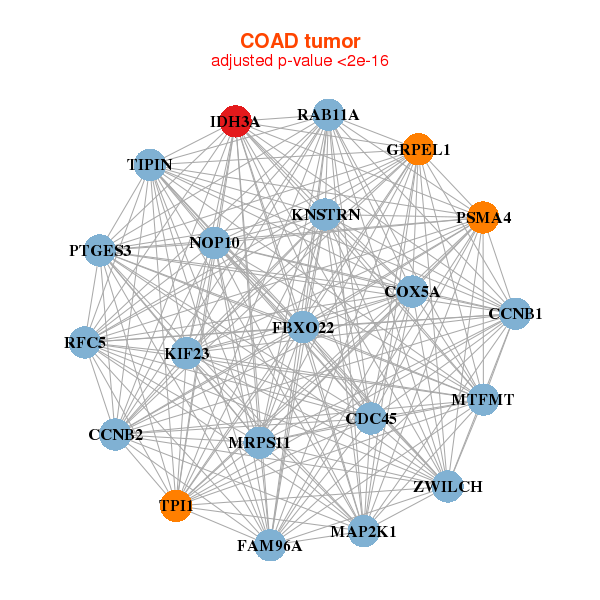
| * Co-Expression network figures were drawn using R package igraph. Only the top 20 genes with the highest correlations were shown. Red circle: input gene, orange circle: cell metabolism gene, sky circle: other gene |
: Open all plots for all cancer types
 |
| ||||
| AAGAB,ADAM5,HYKK,ARIH1,BTBD1,DIS3L,DNAJA4, FBXO22,FEM1B,HCN4,HMG20A,IDH3A,IREB2,MAP2K1, MORF4L1,MTFMT,PSMA4,RAB11A,RCN2,SCAPER,WDR61 | AK3,ANKRD40,ATPAF1,DLD,RMDN1,FEZ2,HOXA10, HSDL2,HSPB6,IDH3A,QKI,RAD23B,RDX,RTN4, SBDS,SETD3,SH3GLB1,STRADB,SUCLA2,UGP2,YWHAG | ||||
 |
| ||||
| KNSTRN,CCNB1,CCNB2,CDC45,COX5A,FAM96A,FBXO22, GRPEL1,IDH3A,KIF23,MAP2K1,MRPS11,MTFMT,NOP10, PSMA4,PTGES3,RAB11A,RFC5,TIPIN,TPI1,ZWILCH | AAGAB,ATG4A,SPRYD7,CHUK,DDX39A,ERP44,GNG5, H2AFY,IDH3A,KDELR2,LRRC59,MPDU1,PI4K2B,PNP, PPP2CA,RAB11A,RAB1A,TCP1,TFG,TPM3,TXNDC17 |

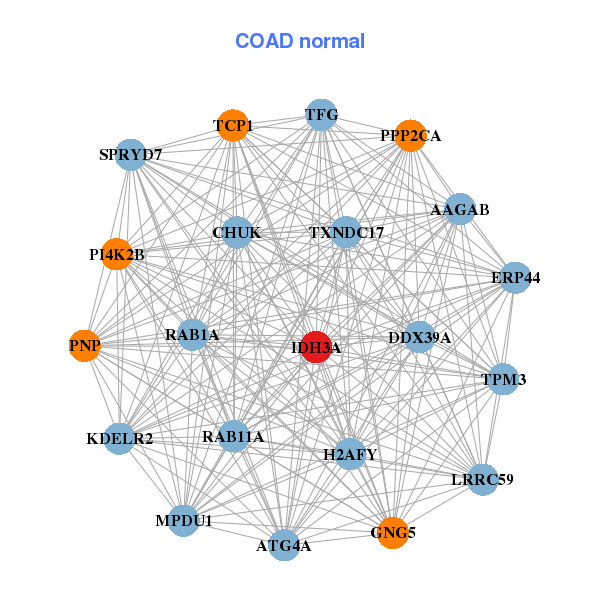
| * Co-Expression network figures were drawn using R package igraph. Only the top 20 genes with the highest correlations were shown. Red circle: input gene, orange circle: cell metabolism gene, sky circle: other gene |
: Open all plots for all cancer types
| Top |
: Open all interacting genes' information including KEGG pathway for all interacting genes from DAVID
| Top |
| Pharmacological Information for IDH3A |
| DB Category | DB Name | DB's ID and Url link |
| * Gene Centered Interaction Network. |
 |
| * Drug Centered Interaction Network. |
| DrugBank ID | Target Name | Drug Groups | Generic Name | Drug Centered Network | Drug Structure |
| DB00157 | isocitrate dehydrogenase 3 (NAD+) alpha | approved; nutraceutical | NADH |  |  |
| Top |
| Cross referenced IDs for IDH3A |
| * We obtained these cross-references from Uniprot database. It covers 150 different DBs, 18 categories. http://www.uniprot.org/help/cross_references_section |
: Open all cross reference information
|
Copyright © 2016-Present - The Univsersity of Texas Health Science Center at Houston @ |