|
|||||||||||||||||||||||||||||||||||||||||||||||||||||||||||||||||||||||||||||||||||||||||||||||||||||||||||||||||||||||||||||||||||||||||||||||||||||||||||||||||||||||||||||||||||||||||||||||||||||||||||||||||||||||||||||||||||||||||||||||||||||||||||||||||||||||||||||||||||||||||||||||||||||||||||||||||||||||||||||||||||||||||||||
| |
| Phenotypic Information (metabolism pathway, cancer, disease, phenome) |
| |
| |
| Gene-Gene Network Information: Co-Expression Network, Interacting Genes & KEGG |
| |
|


| Gene Summary for IDH3B |
| Basic gene info. | Gene symbol | IDH3B |
| Gene name | isocitrate dehydrogenase 3 (NAD+) beta | |
| Synonyms | H-IDHB|RP46 | |
| Cytomap | UCSC genome browser: 20p13 | |
| Genomic location | chr20 :2639660-2644865 | |
| Type of gene | protein-coding | |
| RefGenes | NM_001258384.1, NM_006899.3,NM_174855.2,NM_174856.1, | |
| Ensembl id | ENSG00000101365 | |
| Description | NAD(+)-specific ICDH subunit betaNAD+-specific ICDHNAD+-specific isocitrate dehydrogenase b subunitNAD+-specific isocitrate dehydrogenase betaisocitrate dehydrogenase [NAD] subunit beta, mitochondrialisocitrate dehydrogenase, NAD(+)-specific, mitocho | |
| Modification date | 20141219 | |
| dbXrefs | MIM : 604526 | |
| HGNC : HGNC | ||
| Ensembl : ENSG00000101365 | ||
| HPRD : 05163 | ||
| Vega : OTTHUMG00000031699 | ||
| Protein | UniProt: go to UniProt's Cross Reference DB Table | |
| Expression | CleanEX: HS_IDH3B | |
| BioGPS: 3420 | ||
| Gene Expression Atlas: ENSG00000101365 | ||
| The Human Protein Atlas: ENSG00000101365 | ||
| Pathway | NCI Pathway Interaction Database: IDH3B | |
| KEGG: IDH3B | ||
| REACTOME: IDH3B | ||
| ConsensusPathDB | ||
| Pathway Commons: IDH3B | ||
| Metabolism | MetaCyc: IDH3B | |
| HUMANCyc: IDH3B | ||
| Regulation | Ensembl's Regulation: ENSG00000101365 | |
| miRBase: chr20 :2,639,660-2,644,865 | ||
| TargetScan: NM_001258384 | ||
| cisRED: ENSG00000101365 | ||
| Context | iHOP: IDH3B | |
| cancer metabolism search in PubMed: IDH3B | ||
| UCL Cancer Institute: IDH3B | ||
| Assigned class in ccmGDB | C | |
| Top |
| Phenotypic Information for IDH3B(metabolism pathway, cancer, disease, phenome) |
| Cancer | CGAP: IDH3B |
| Familial Cancer Database: IDH3B | |
| * This gene is included in those cancer gene databases. |
|
|
|
|
|
|
| |||||||||||||||||||||||||||||||||||||||||||||||||||||||||||||||||||||||||||||||||||||||||||||||||||||||||||||||||||||||||||||||||||||||||||||||||||||||||||||||||||||||||||||||||||||||||||||||||||||||||||||||||||||||||||||||||||||||||||||||||||||||||||||||||||||||||||||||||||||||||||||||||||||||||||||||||||||||||||||||||||||||
Oncogene 1 | Significant driver gene in | ||||||||||||||||||||||||||||||||||||||||||||||||||||||||||||||||||||||||||||||||||||||||||||||||||||||||||||||||||||||||||||||||||||||||||||||||||||||||||||||||||||||||||||||||||||||||||||||||||||||||||||||||||||||||||||||||||||||||||||||||||||||||||||||||||||||||||||||||||||||||||||||||||||||||||||||||||||||||||||||||||||||||||||
| cf) number; DB name 1 Oncogene; http://nar.oxfordjournals.org/content/35/suppl_1/D721.long, 2 Tumor Suppressor gene; https://bioinfo.uth.edu/TSGene/, 3 Cancer Gene Census; http://www.nature.com/nrc/journal/v4/n3/abs/nrc1299.html, 4 CancerGenes; http://nar.oxfordjournals.org/content/35/suppl_1/D721.long, 5 Network of Cancer Gene; http://ncg.kcl.ac.uk/index.php, 1Therapeutic Vulnerabilities in Cancer; http://cbio.mskcc.org/cancergenomics/statius/ |
| REACTOME_PYRUVATE_METABOLISM_AND_CITRIC_ACID_TCA_CYCLE | |
| OMIM | |
| Orphanet | |
| Disease | KEGG Disease: IDH3B |
| MedGen: IDH3B (Human Medical Genetics with Condition) | |
| ClinVar: IDH3B | |
| Phenotype | MGI: IDH3B (International Mouse Phenotyping Consortium) |
| PhenomicDB: IDH3B | |
| Mutations for IDH3B |
| * Under tables are showing count per each tissue to give us broad intuition about tissue specific mutation patterns.You can go to the detailed page for each mutation database's web site. |
| There's no structural variation information in COSMIC data for this gene. |
| * From mRNA Sanger sequences, Chitars2.0 arranged chimeric transcripts. This table shows IDH3B related fusion information. |
| ID | Head Gene | Tail Gene | Accession | Gene_a | qStart_a | qEnd_a | Chromosome_a | tStart_a | tEnd_a | Gene_a | qStart_a | qEnd_a | Chromosome_a | tStart_a | tEnd_a |
| BG991562 | IDH3B | 27 | 237 | 20 | 2641424 | 2644189 | JUP | 238 | 427 | 17 | 39740115 | 39776976 | |
| AF023265 | UBAC2 | 1 | 87 | 13 | 100038542 | 100038628 | IDH3B | 79 | 1278 | 20 | 2639041 | 2644835 | |
| BI015407 | PSAP | 16 | 170 | 10 | 73580052 | 73581743 | IDH3B | 166 | 243 | 20 | 2640724 | 2640801 | |
| BQ366218 | MYT1L | 242 | 263 | 2 | 2242110 | 2242131 | IDH3B | 249 | 680 | 20 | 2639303 | 2640772 | |
| DB143046 | IDH3B | 1 | 211 | 20 | 2640212 | 2644850 | IDH3B | 208 | 351 | 20 | 2641517 | 2644136 | |
| AF023266 | UBAC2 | 1 | 87 | 13 | 100038542 | 100038628 | IDH3B | 79 | 1357 | 20 | 2639041 | 2644835 | |
| U49283 | UBAC2 | 1 | 87 | 13 | 100038542 | 100038628 | IDH3B | 79 | 1595 | 20 | 2639041 | 2644835 | |
| Top |
| Mutation type/ Tissue ID | brca | cns | cerv | endome | haematopo | kidn | Lintest | liver | lung | ns | ovary | pancre | prost | skin | stoma | thyro | urina | |||
| Total # sample | 1 | |||||||||||||||||||
| GAIN (# sample) | 1 | |||||||||||||||||||
| LOSS (# sample) |
| cf) Tissue ID; Tissue type (1; Breast, 2; Central_nervous_system, 3; Cervix, 4; Endometrium, 5; Haematopoietic_and_lymphoid_tissue, 6; Kidney, 7; Large_intestine, 8; Liver, 9; Lung, 10; NS, 11; Ovary, 12; Pancreas, 13; Prostate, 14; Skin, 15; Stomach, 16; Thyroid, 17; Urinary_tract) |
| Top |
|
 |
| Top |
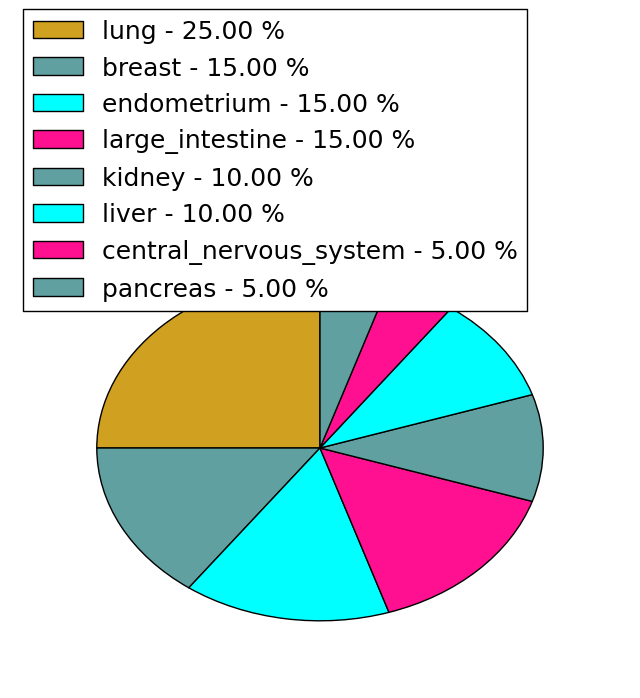
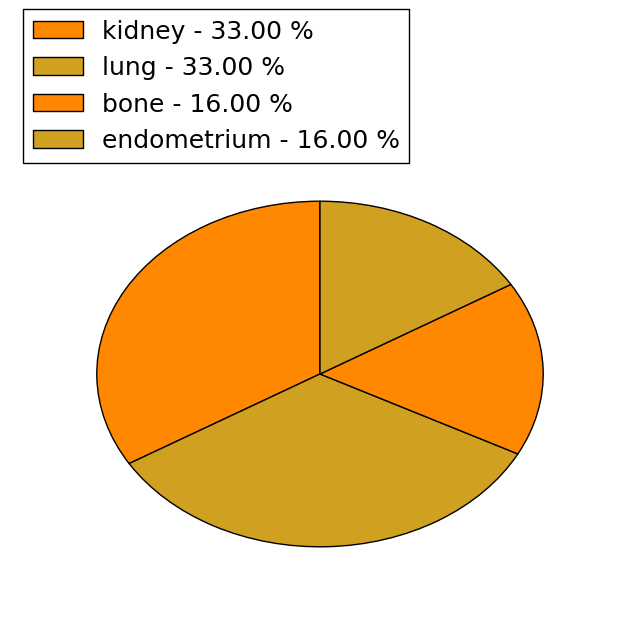
| Stat. for Non-Synonymous SNVs (# total SNVs=20) | (# total SNVs=6) |
 |  |
(# total SNVs=0) | (# total SNVs=0) |
| Top |
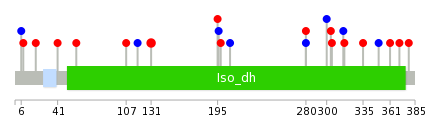
| * When you move the cursor on each content, you can see more deailed mutation information on the Tooltip. Those are primary_site,primary_histology,mutation(aa),pubmedID. |
| GRCh37 position | Mutation(aa) | Unique sampleID count |
| chr20:2639436-2639436 | p.I373M | 3 |
| chr20:2641429-2641429 | p.P149S | 2 |
| chr20:2644188-2644188 | p.Q81* | 1 |
| chr20:2640233-2640233 | p.? | 1 |
| chr20:2641147-2641147 | p.K207K | 1 |
| chr20:2644347-2644347 | p.V59L | 1 |
| chr20:2640344-2640344 | p.? | 1 |
| chr20:2641176-2641176 | p.A198S | 1 |
| chr20:2639397-2639397 | p.*386* | 1 |
| chr20:2644400-2644400 | p.E41G | 1 |
| Top |
|
 |
| Point Mutation/ Tissue ID | 1 | 2 | 3 | 4 | 5 | 6 | 7 | 8 | 9 | 10 | 11 | 12 | 13 | 14 | 15 | 16 | 17 | 18 | 19 | 20 |
| # sample | 2 | 2 | 2 | 3 | 3 | 3 | 1 | 3 | 1 | 4 | ||||||||||
| # mutation | 2 | 2 | 2 | 3 | 3 | 3 | 1 | 3 | 1 | 4 | ||||||||||
| nonsynonymous SNV | 1 | 2 | 2 | 1 | 3 | 1 | 2 | 1 | 3 | |||||||||||
| synonymous SNV | 1 | 2 | 1 | 2 | 1 | 1 |
| cf) Tissue ID; Tissue type (1; BLCA[Bladder Urothelial Carcinoma], 2; BRCA[Breast invasive carcinoma], 3; CESC[Cervical squamous cell carcinoma and endocervical adenocarcinoma], 4; COAD[Colon adenocarcinoma], 5; GBM[Glioblastoma multiforme], 6; Glioma Low Grade, 7; HNSC[Head and Neck squamous cell carcinoma], 8; KICH[Kidney Chromophobe], 9; KIRC[Kidney renal clear cell carcinoma], 10; KIRP[Kidney renal papillary cell carcinoma], 11; LAML[Acute Myeloid Leukemia], 12; LUAD[Lung adenocarcinoma], 13; LUSC[Lung squamous cell carcinoma], 14; OV[Ovarian serous cystadenocarcinoma ], 15; PAAD[Pancreatic adenocarcinoma], 16; PRAD[Prostate adenocarcinoma], 17; SKCM[Skin Cutaneous Melanoma], 18:STAD[Stomach adenocarcinoma], 19:THCA[Thyroid carcinoma], 20:UCEC[Uterine Corpus Endometrial Carcinoma]) |
| Top |
| * We represented just top 10 SNVs. When you move the cursor on each content, you can see more deailed mutation information on the Tooltip. Those are primary_site, primary_histology, mutation(aa), pubmedID. |
| Genomic Position | Mutation(aa) | Unique sampleID count |
| chr20:2640753 | p.L280V,IDH3B | 2 |
| chr20:2641562 | p.R131W,IDH3B | 2 |
| chr20:2644347 | p.K207K,IDH3B | 1 |
| chr20:2640681 | p.A198S,IDH3B | 1 |
| chr20:2644400 | p.R196R,IDH3B | 1 |
| chr20:2640691 | p.Q195P,IDH3B | 1 |
| chr20:2644629 | p.H379D | 1 |
| chr20:2644813 | p.P118P,IDH3B | 1 |
| chr20:2639420 | p.T370A | 1 |
| chr20:2641147 | p.N107D,IDH3B | 1 |
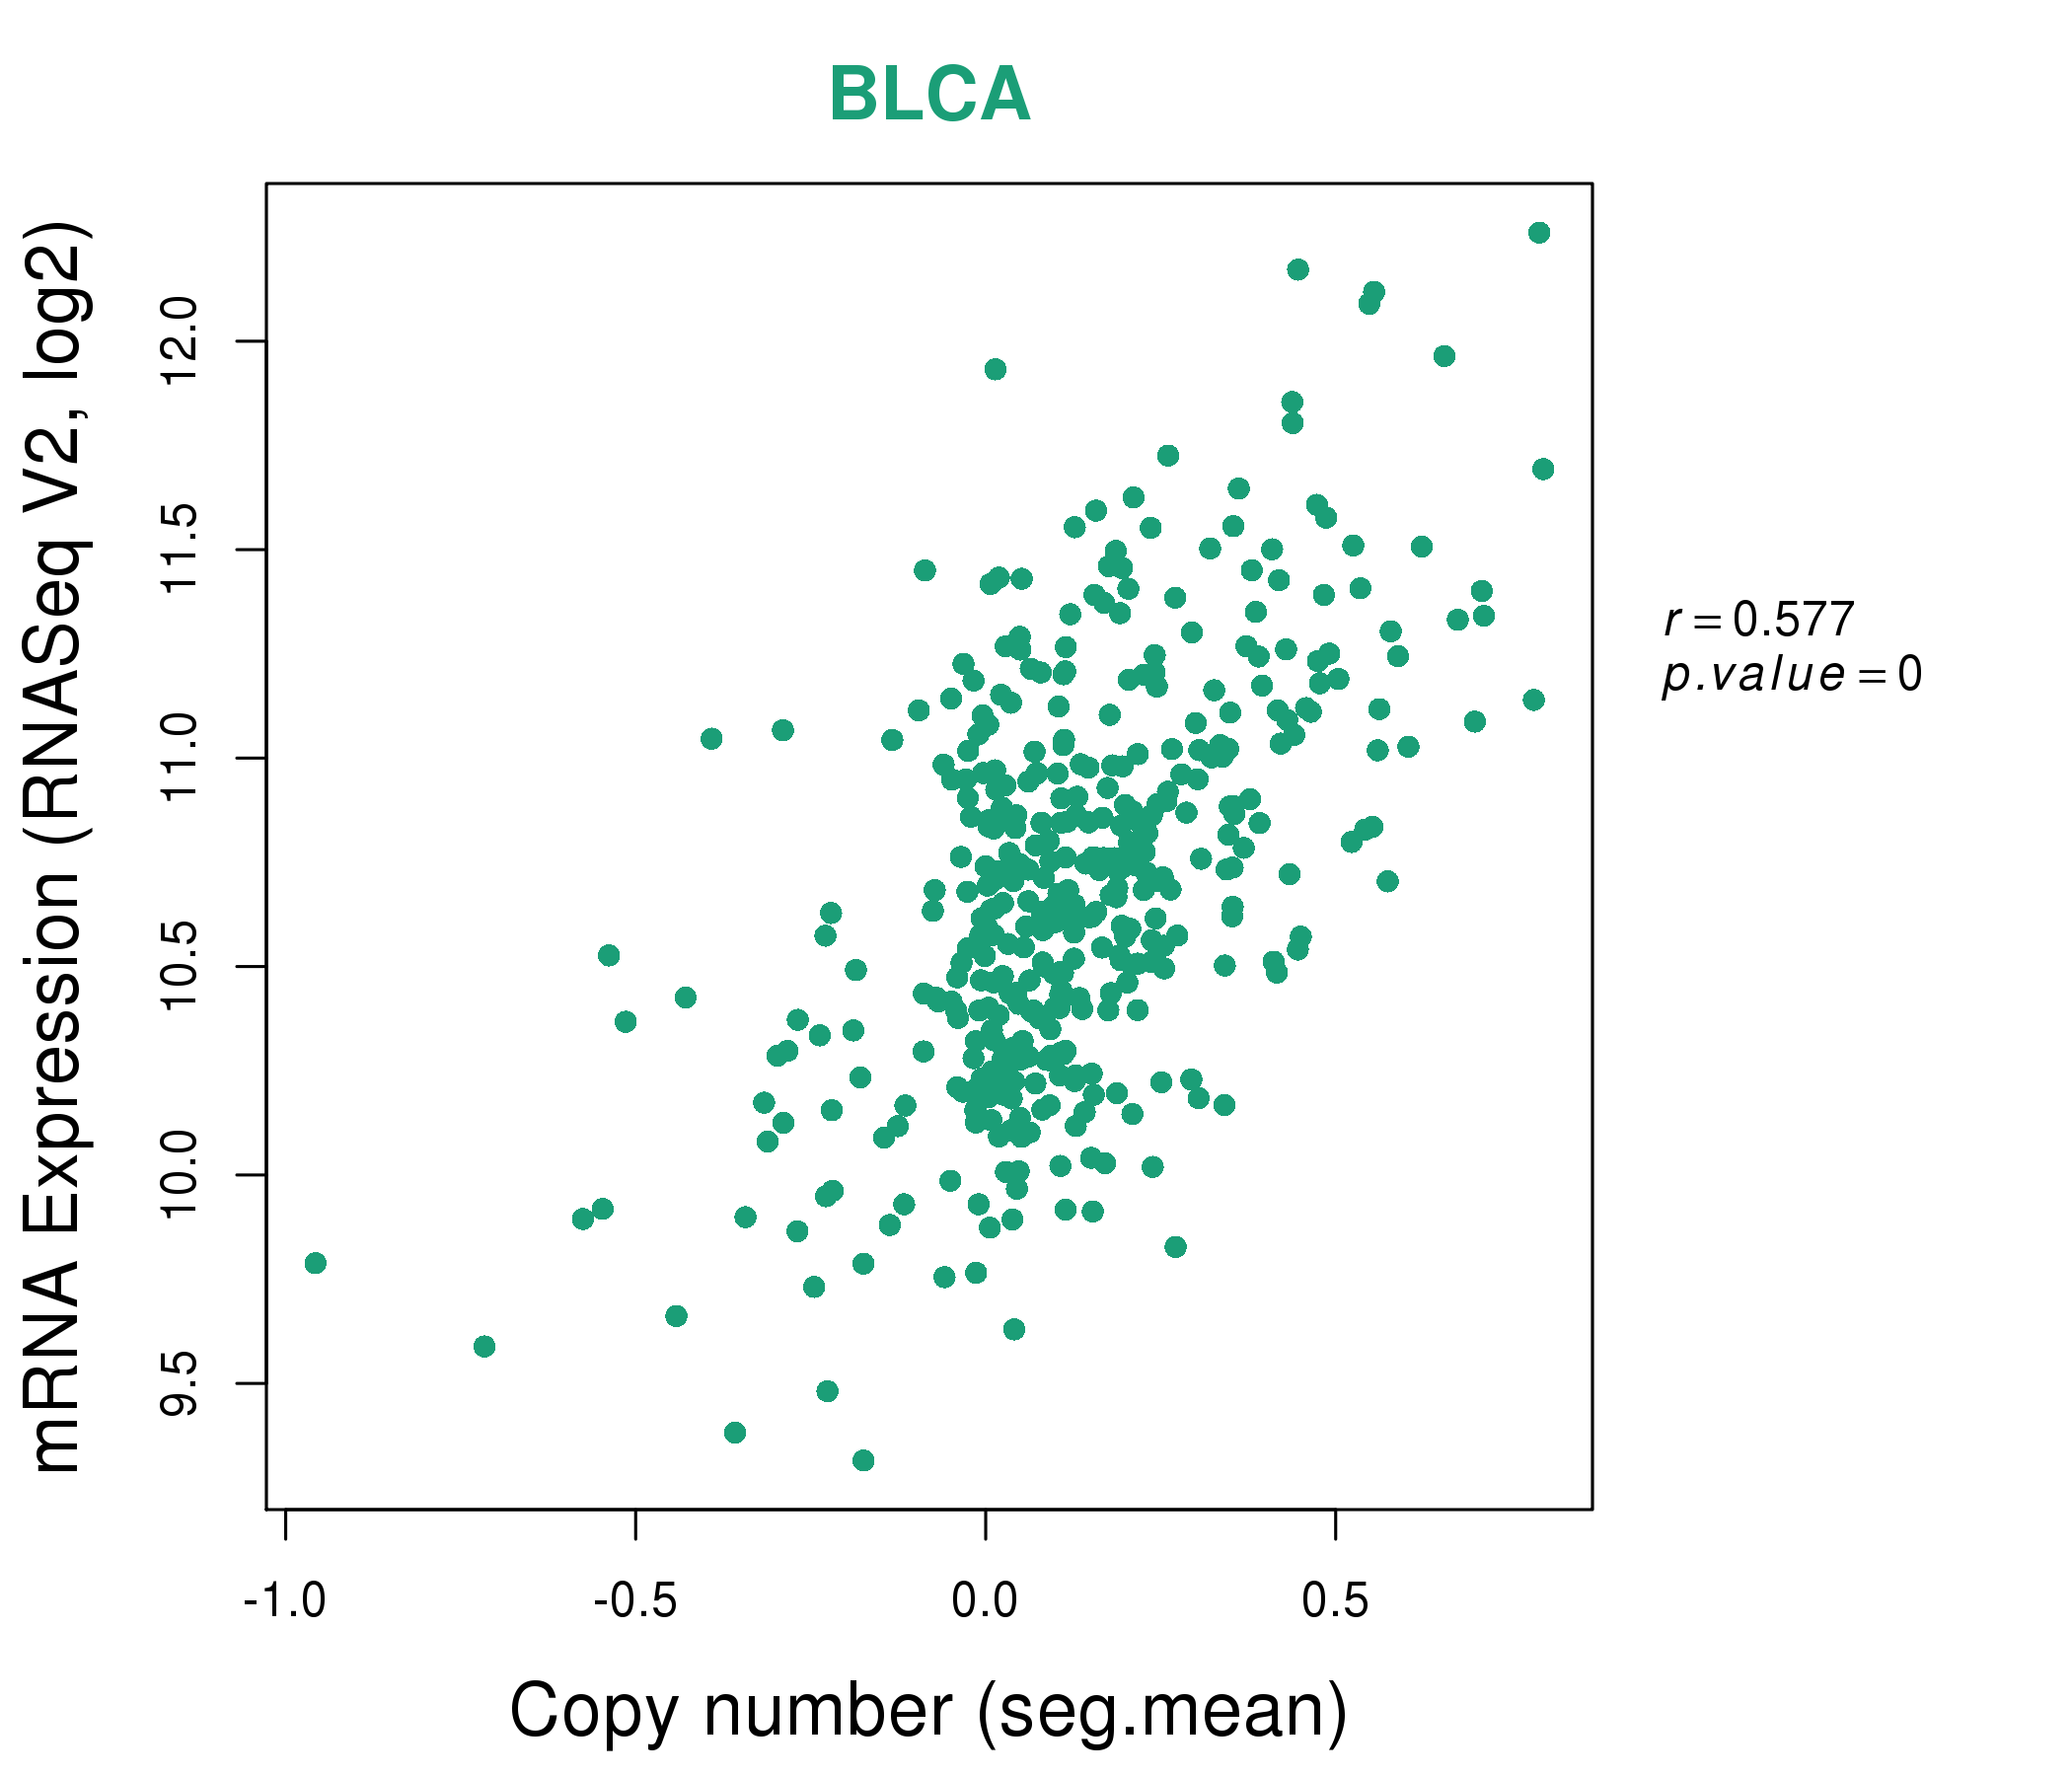
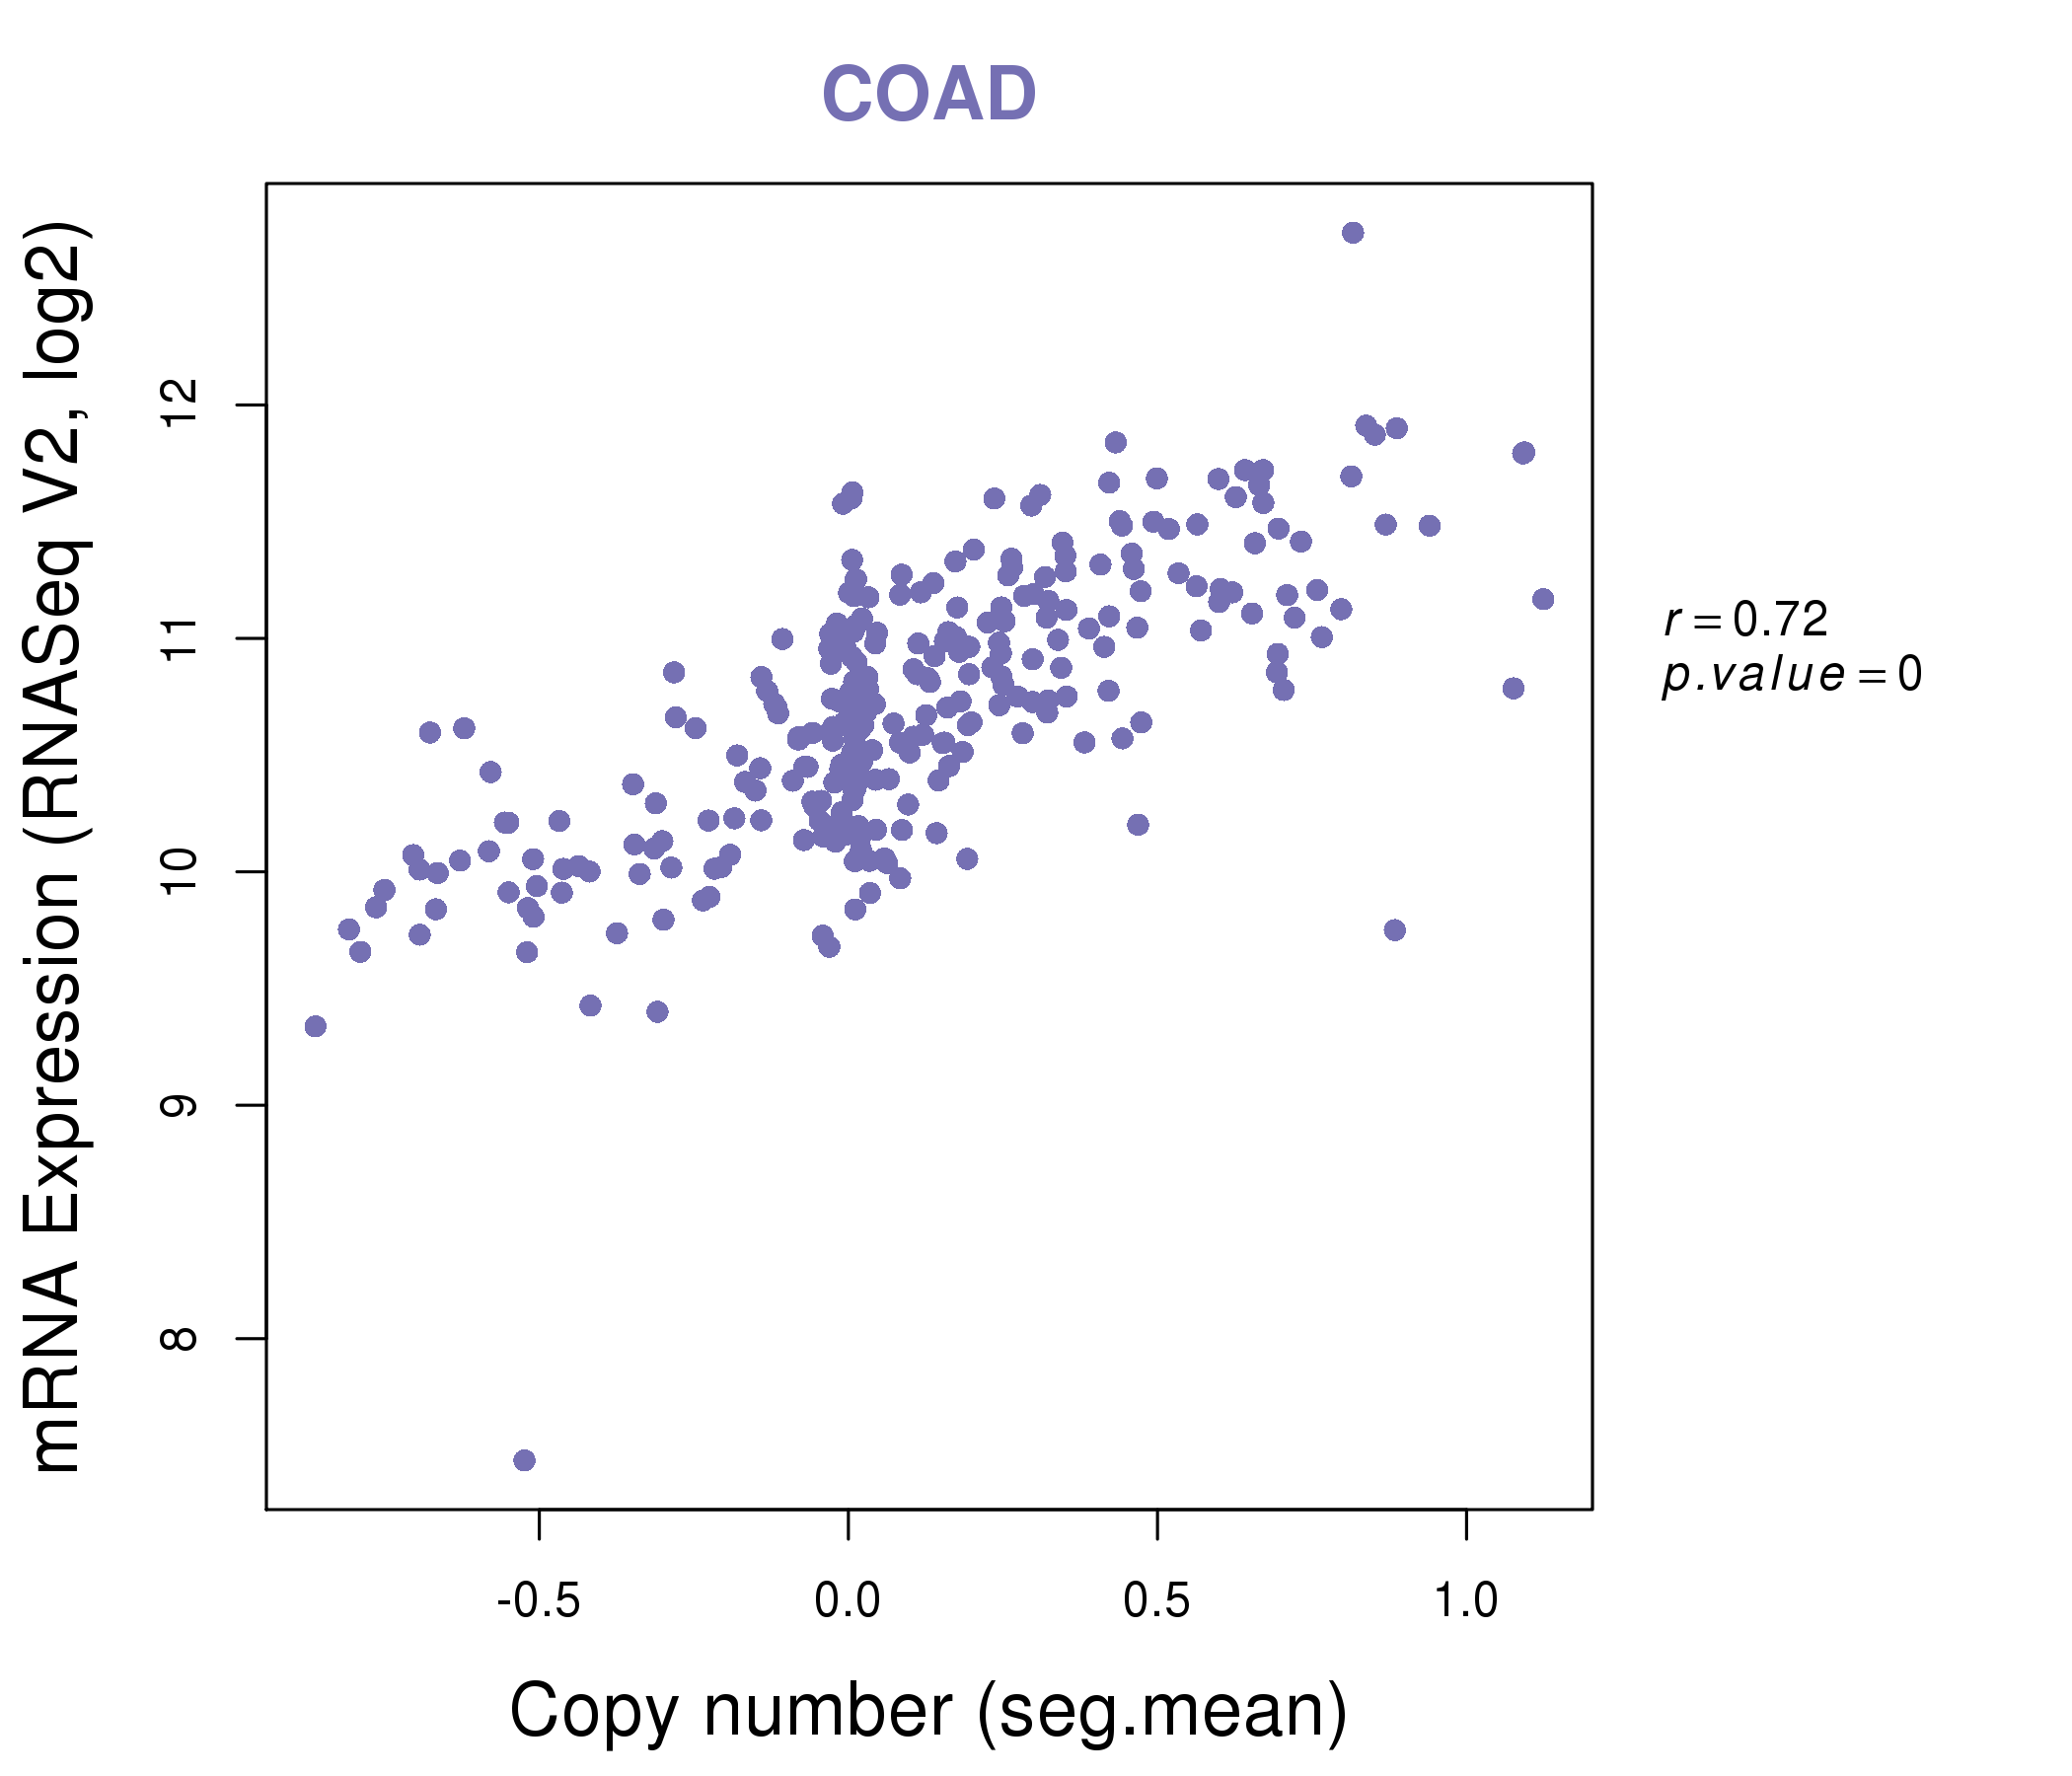
| * Copy number data were extracted from TCGA using R package TCGA-Assembler. The URLs of all public data files on TCGA DCC data server were gathered on Jan-05-2015. Function ProcessCNAData in TCGA-Assembler package was used to obtain gene-level copy number value which is calculated as the average copy number of the genomic region of a gene. |
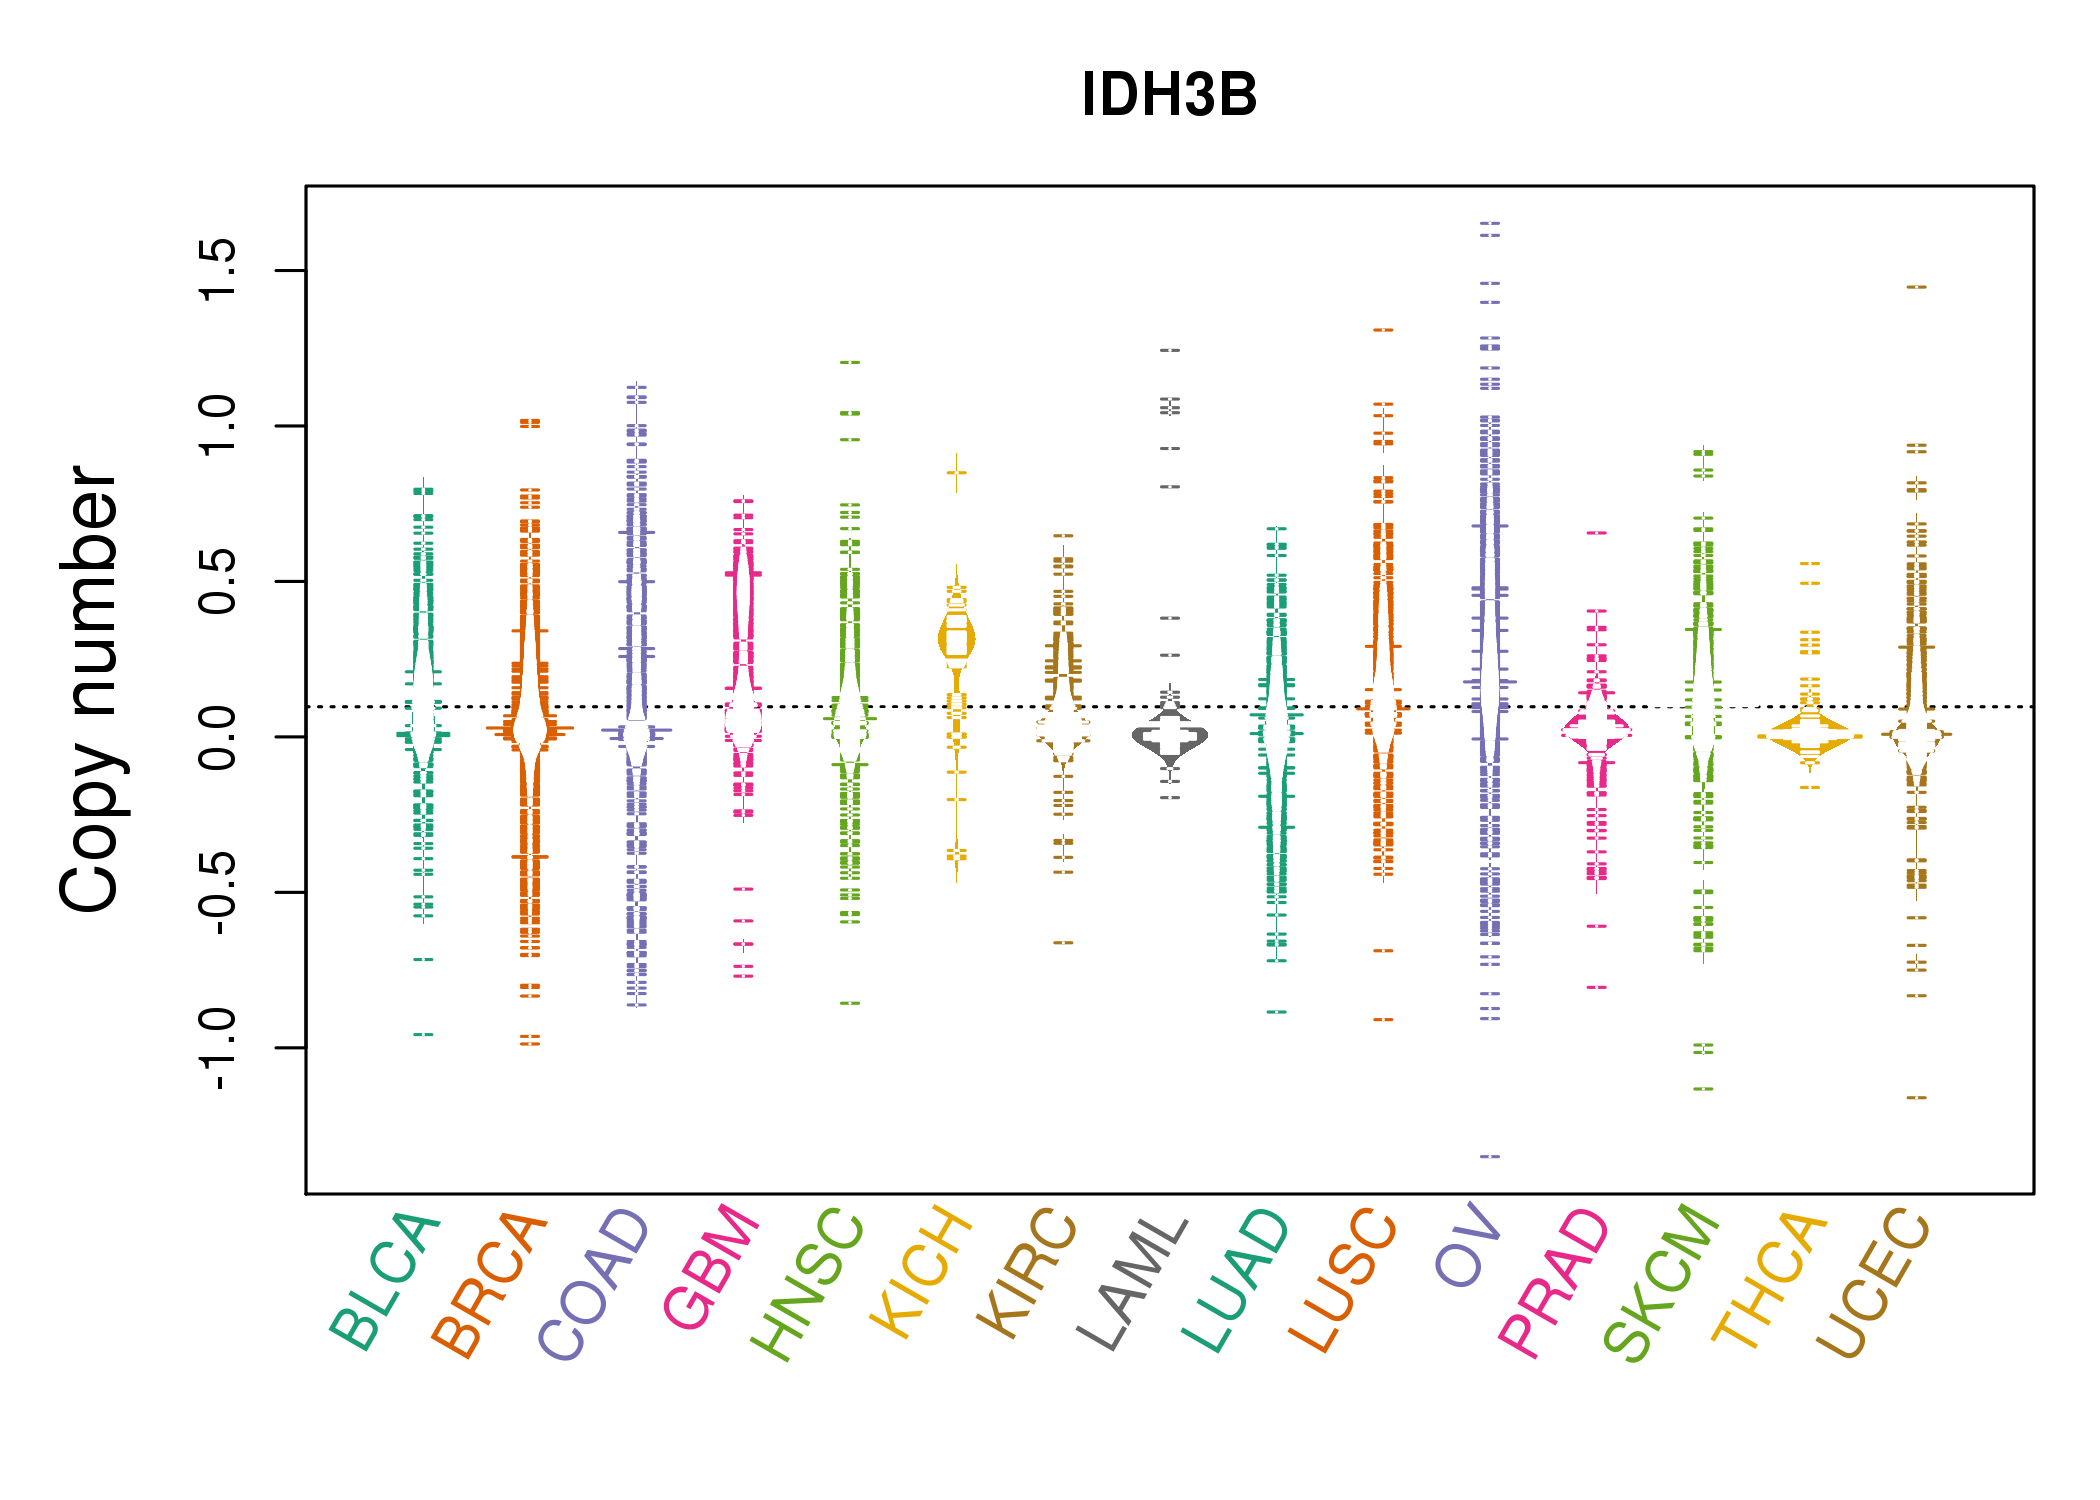 |
| cf) Tissue ID[Tissue type]: BLCA[Bladder Urothelial Carcinoma], BRCA[Breast invasive carcinoma], CESC[Cervical squamous cell carcinoma and endocervical adenocarcinoma], COAD[Colon adenocarcinoma], GBM[Glioblastoma multiforme], Glioma Low Grade, HNSC[Head and Neck squamous cell carcinoma], KICH[Kidney Chromophobe], KIRC[Kidney renal clear cell carcinoma], KIRP[Kidney renal papillary cell carcinoma], LAML[Acute Myeloid Leukemia], LUAD[Lung adenocarcinoma], LUSC[Lung squamous cell carcinoma], OV[Ovarian serous cystadenocarcinoma ], PAAD[Pancreatic adenocarcinoma], PRAD[Prostate adenocarcinoma], SKCM[Skin Cutaneous Melanoma], STAD[Stomach adenocarcinoma], THCA[Thyroid carcinoma], UCEC[Uterine Corpus Endometrial Carcinoma] |
| Top |
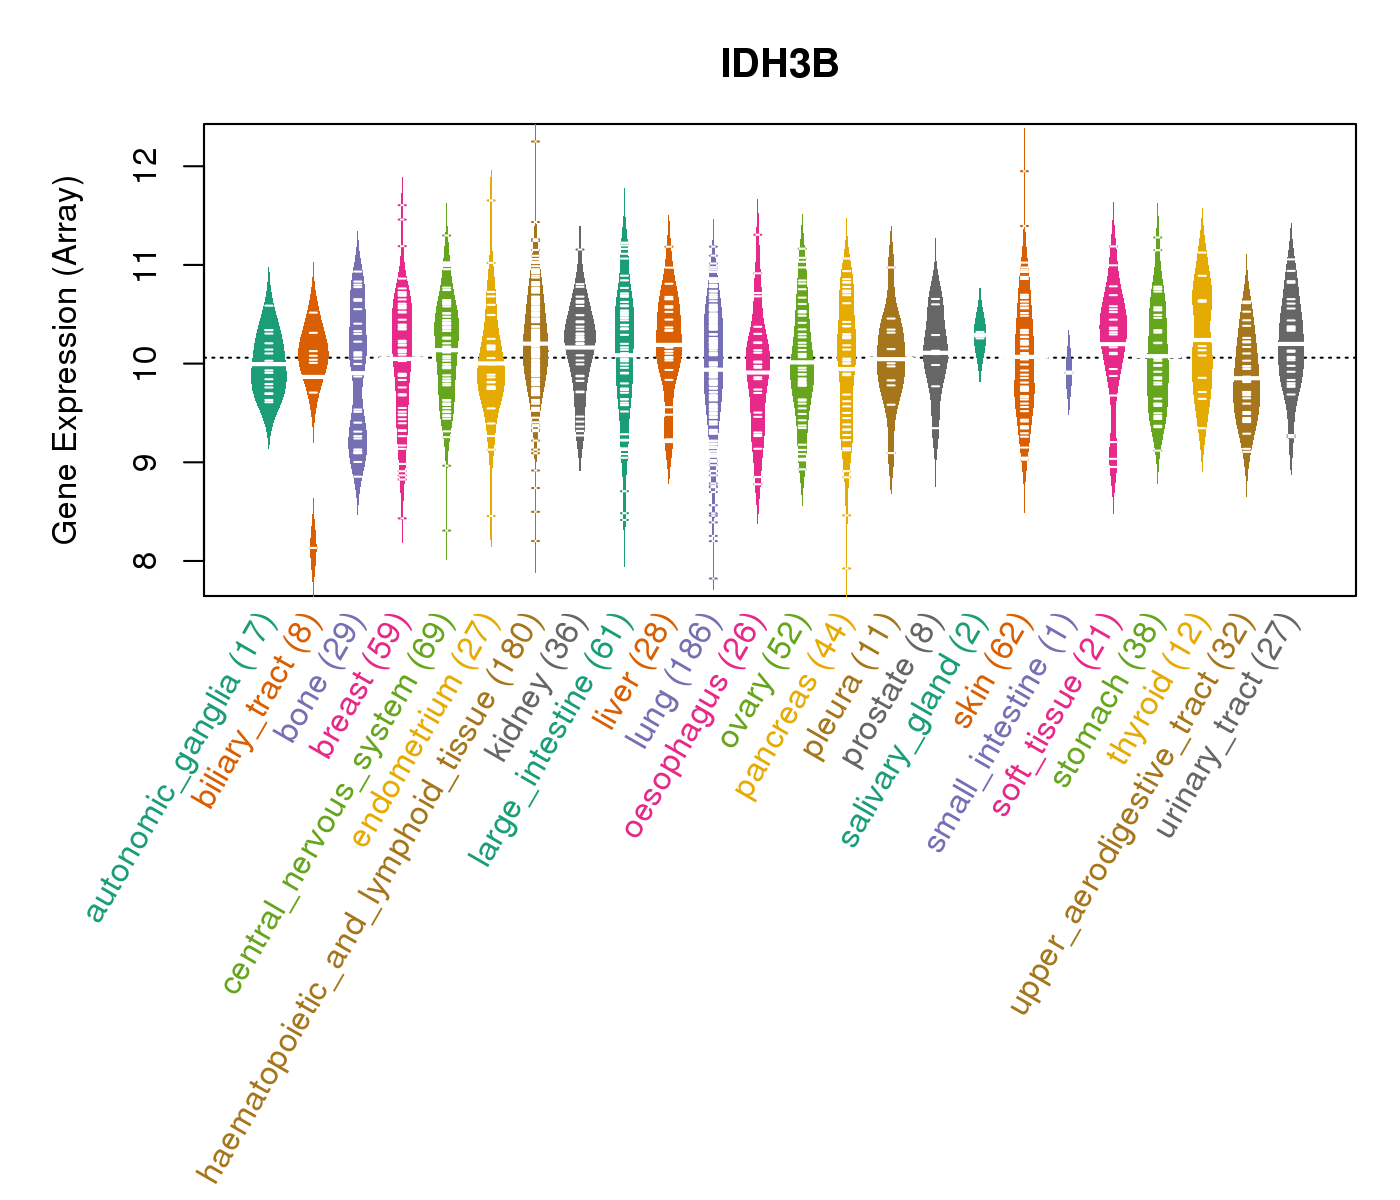
| Gene Expression for IDH3B |
| * CCLE gene expression data were extracted from CCLE_Expression_Entrez_2012-10-18.res: Gene-centric RMA-normalized mRNA expression data. |
 |
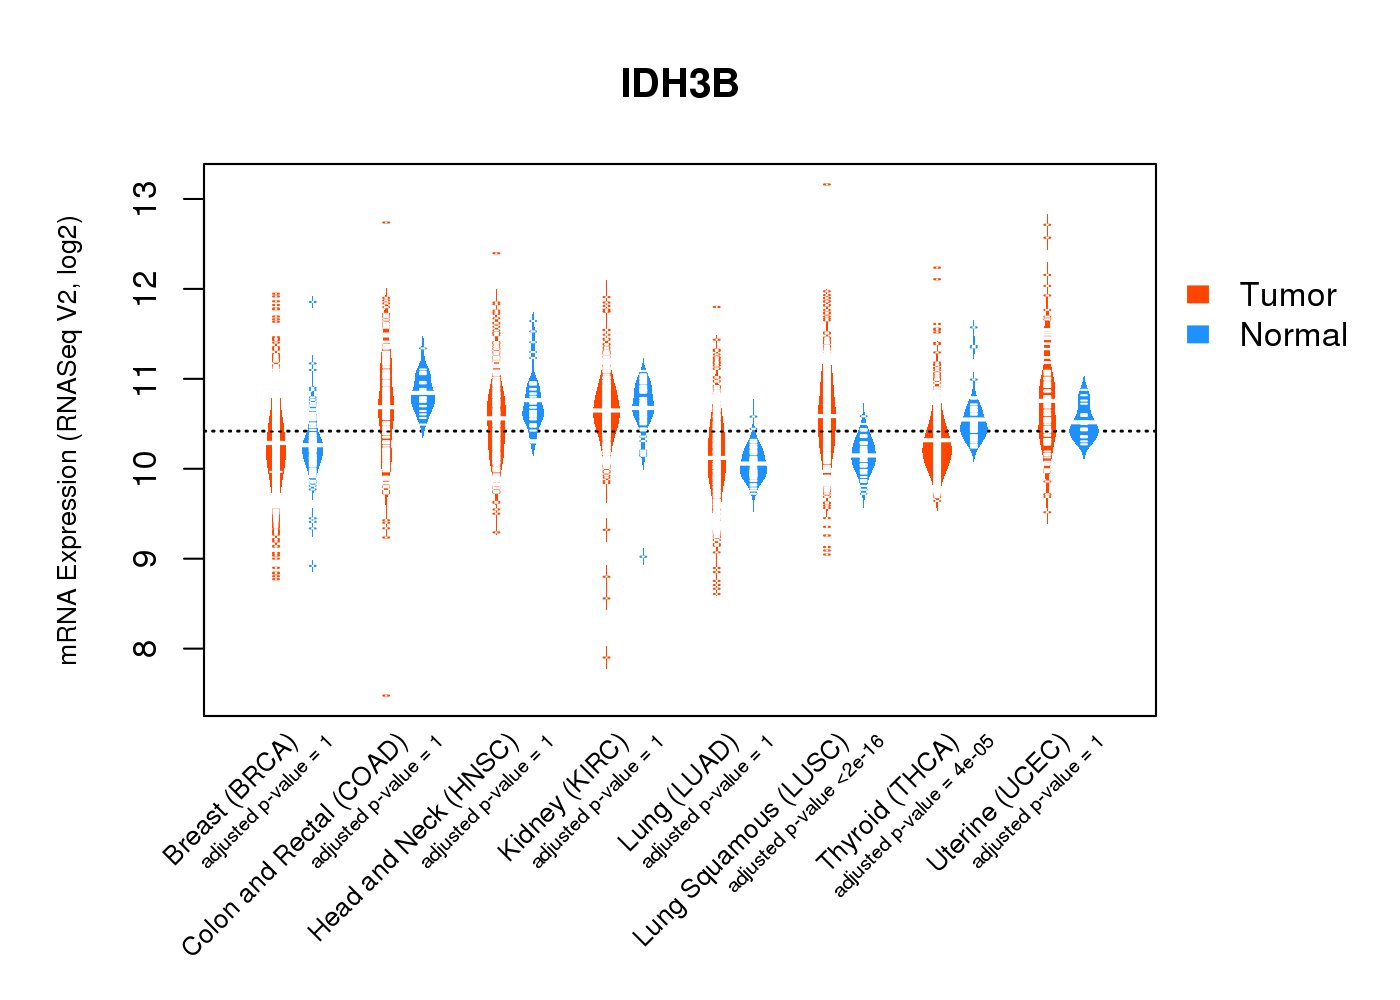
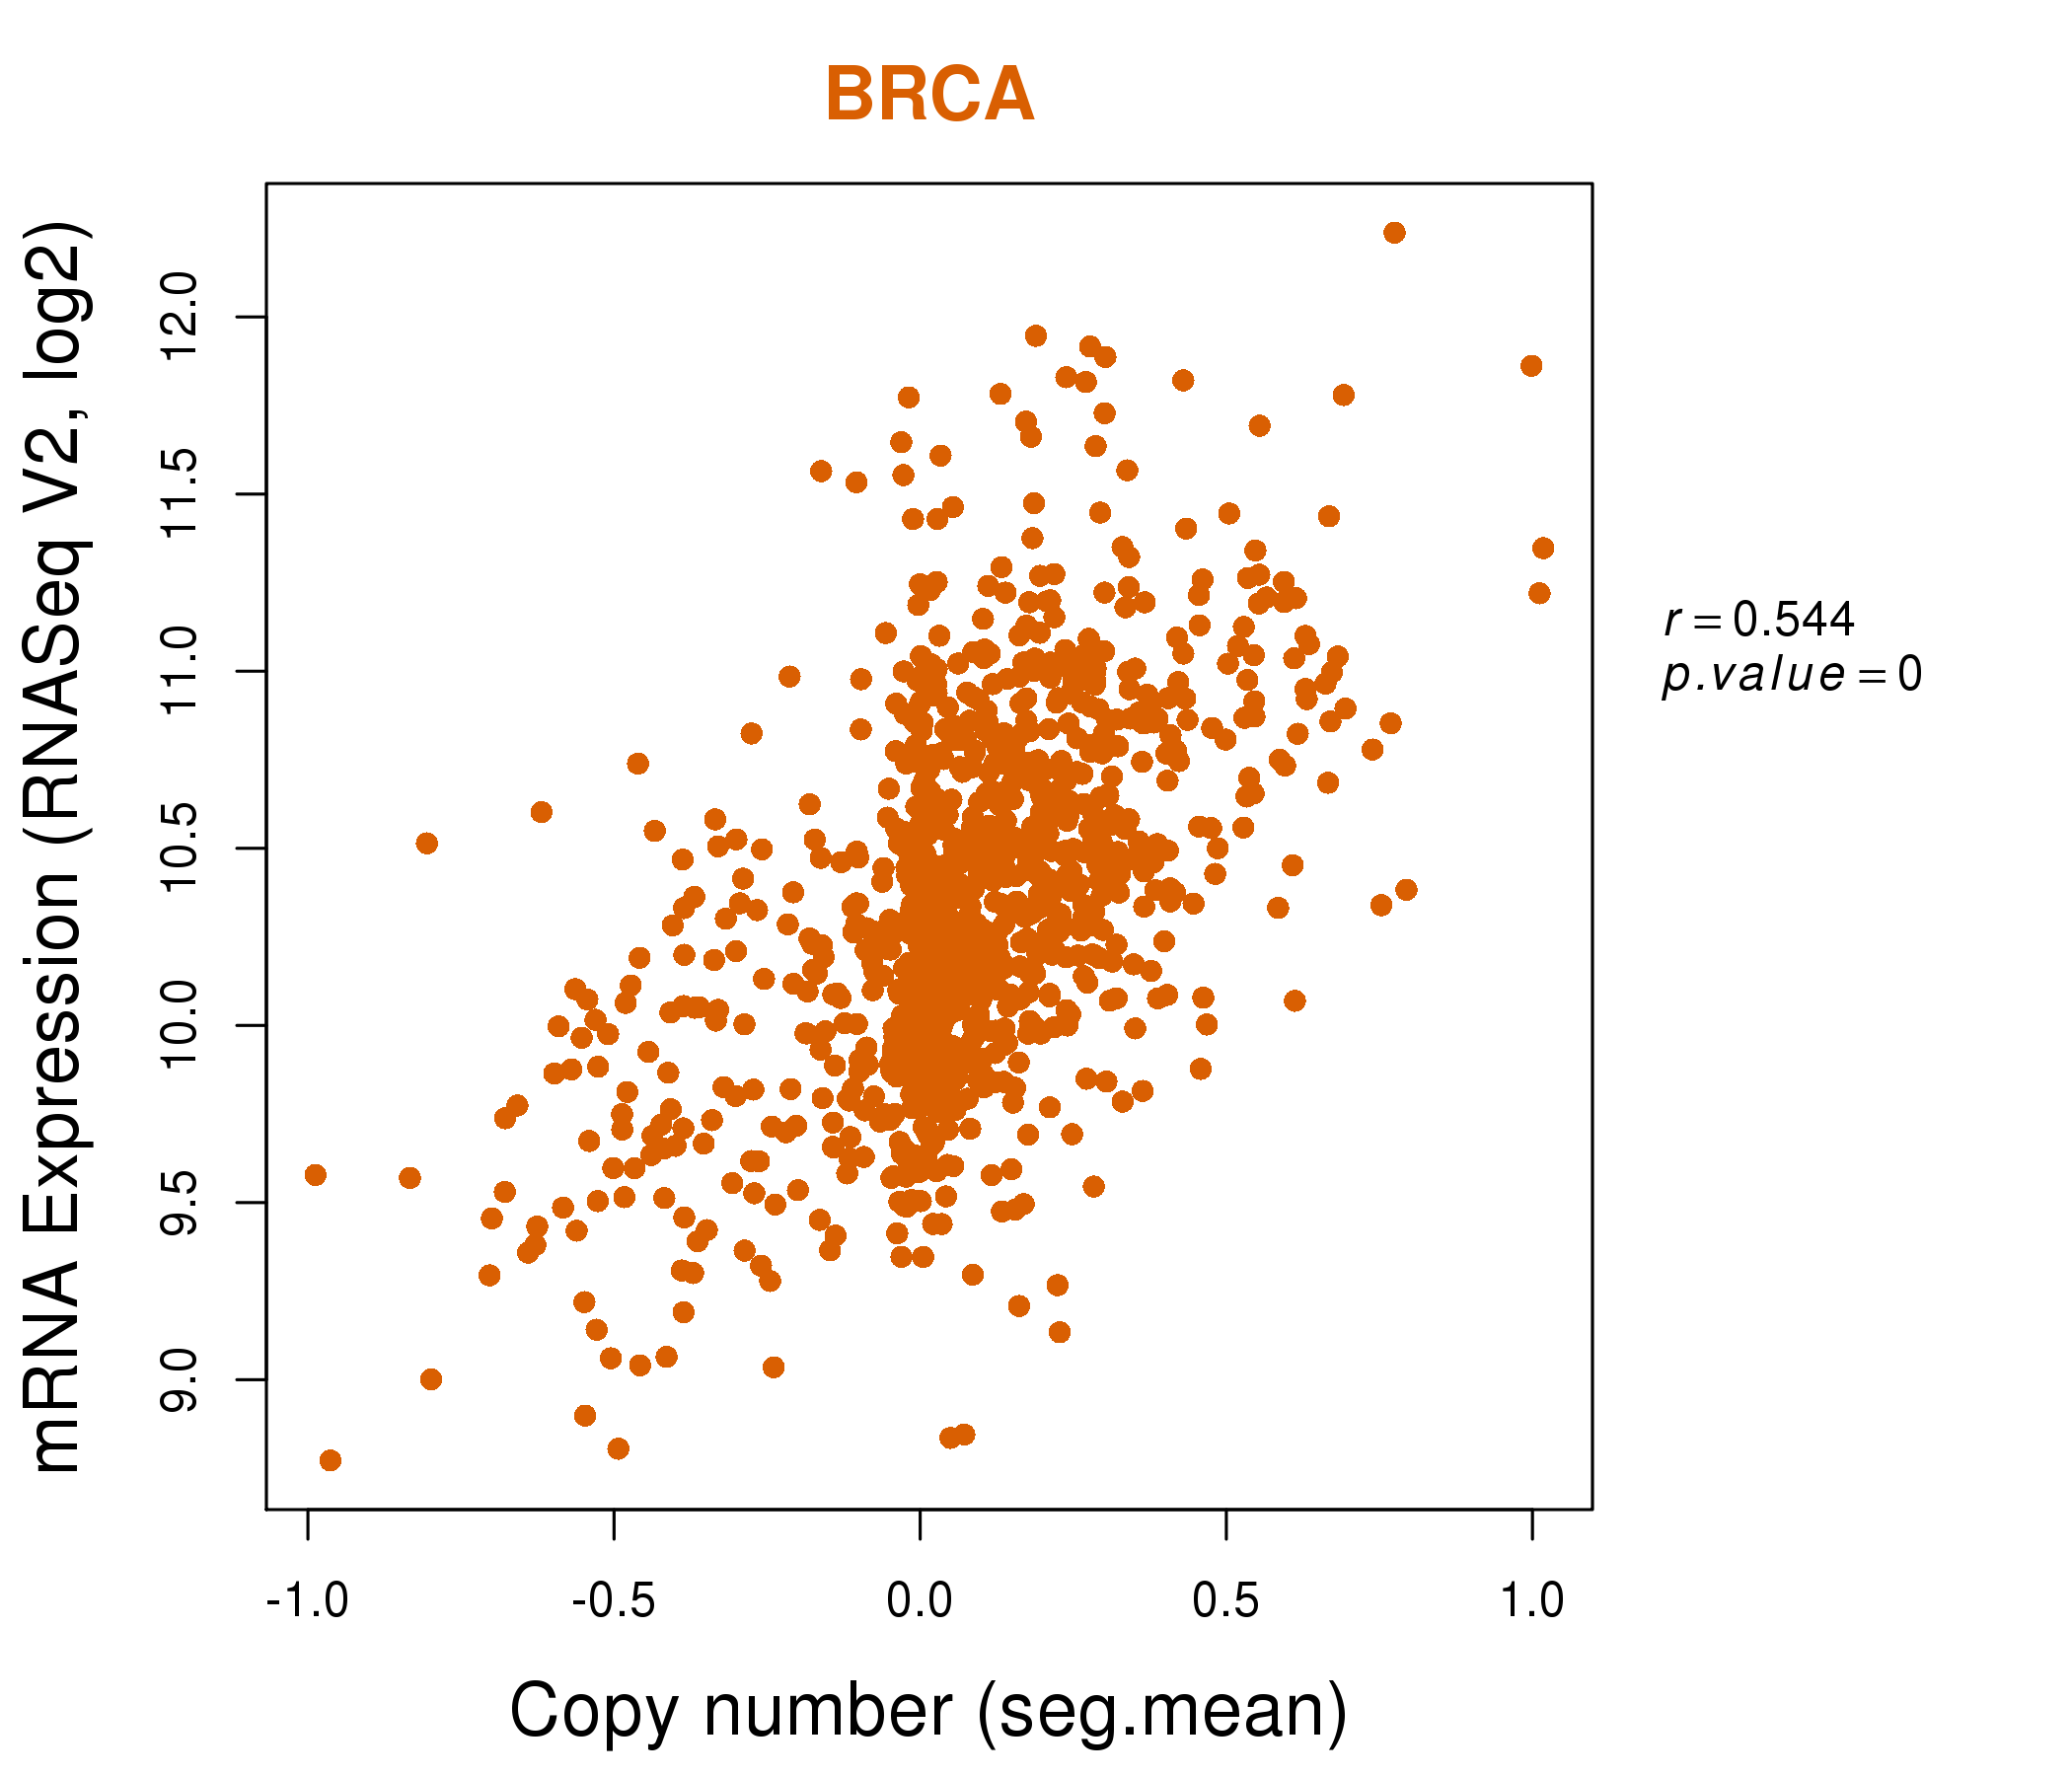
| * Normalized gene expression data of RNASeqV2 was extracted from TCGA using R package TCGA-Assembler. The URLs of all public data files on TCGA DCC data server were gathered at Jan-05-2015. Only eight cancer types have enough normal control samples for differential expression analysis. (t test, adjusted p<0.05 (using Benjamini-Hochberg FDR)) |
 |
| Top |
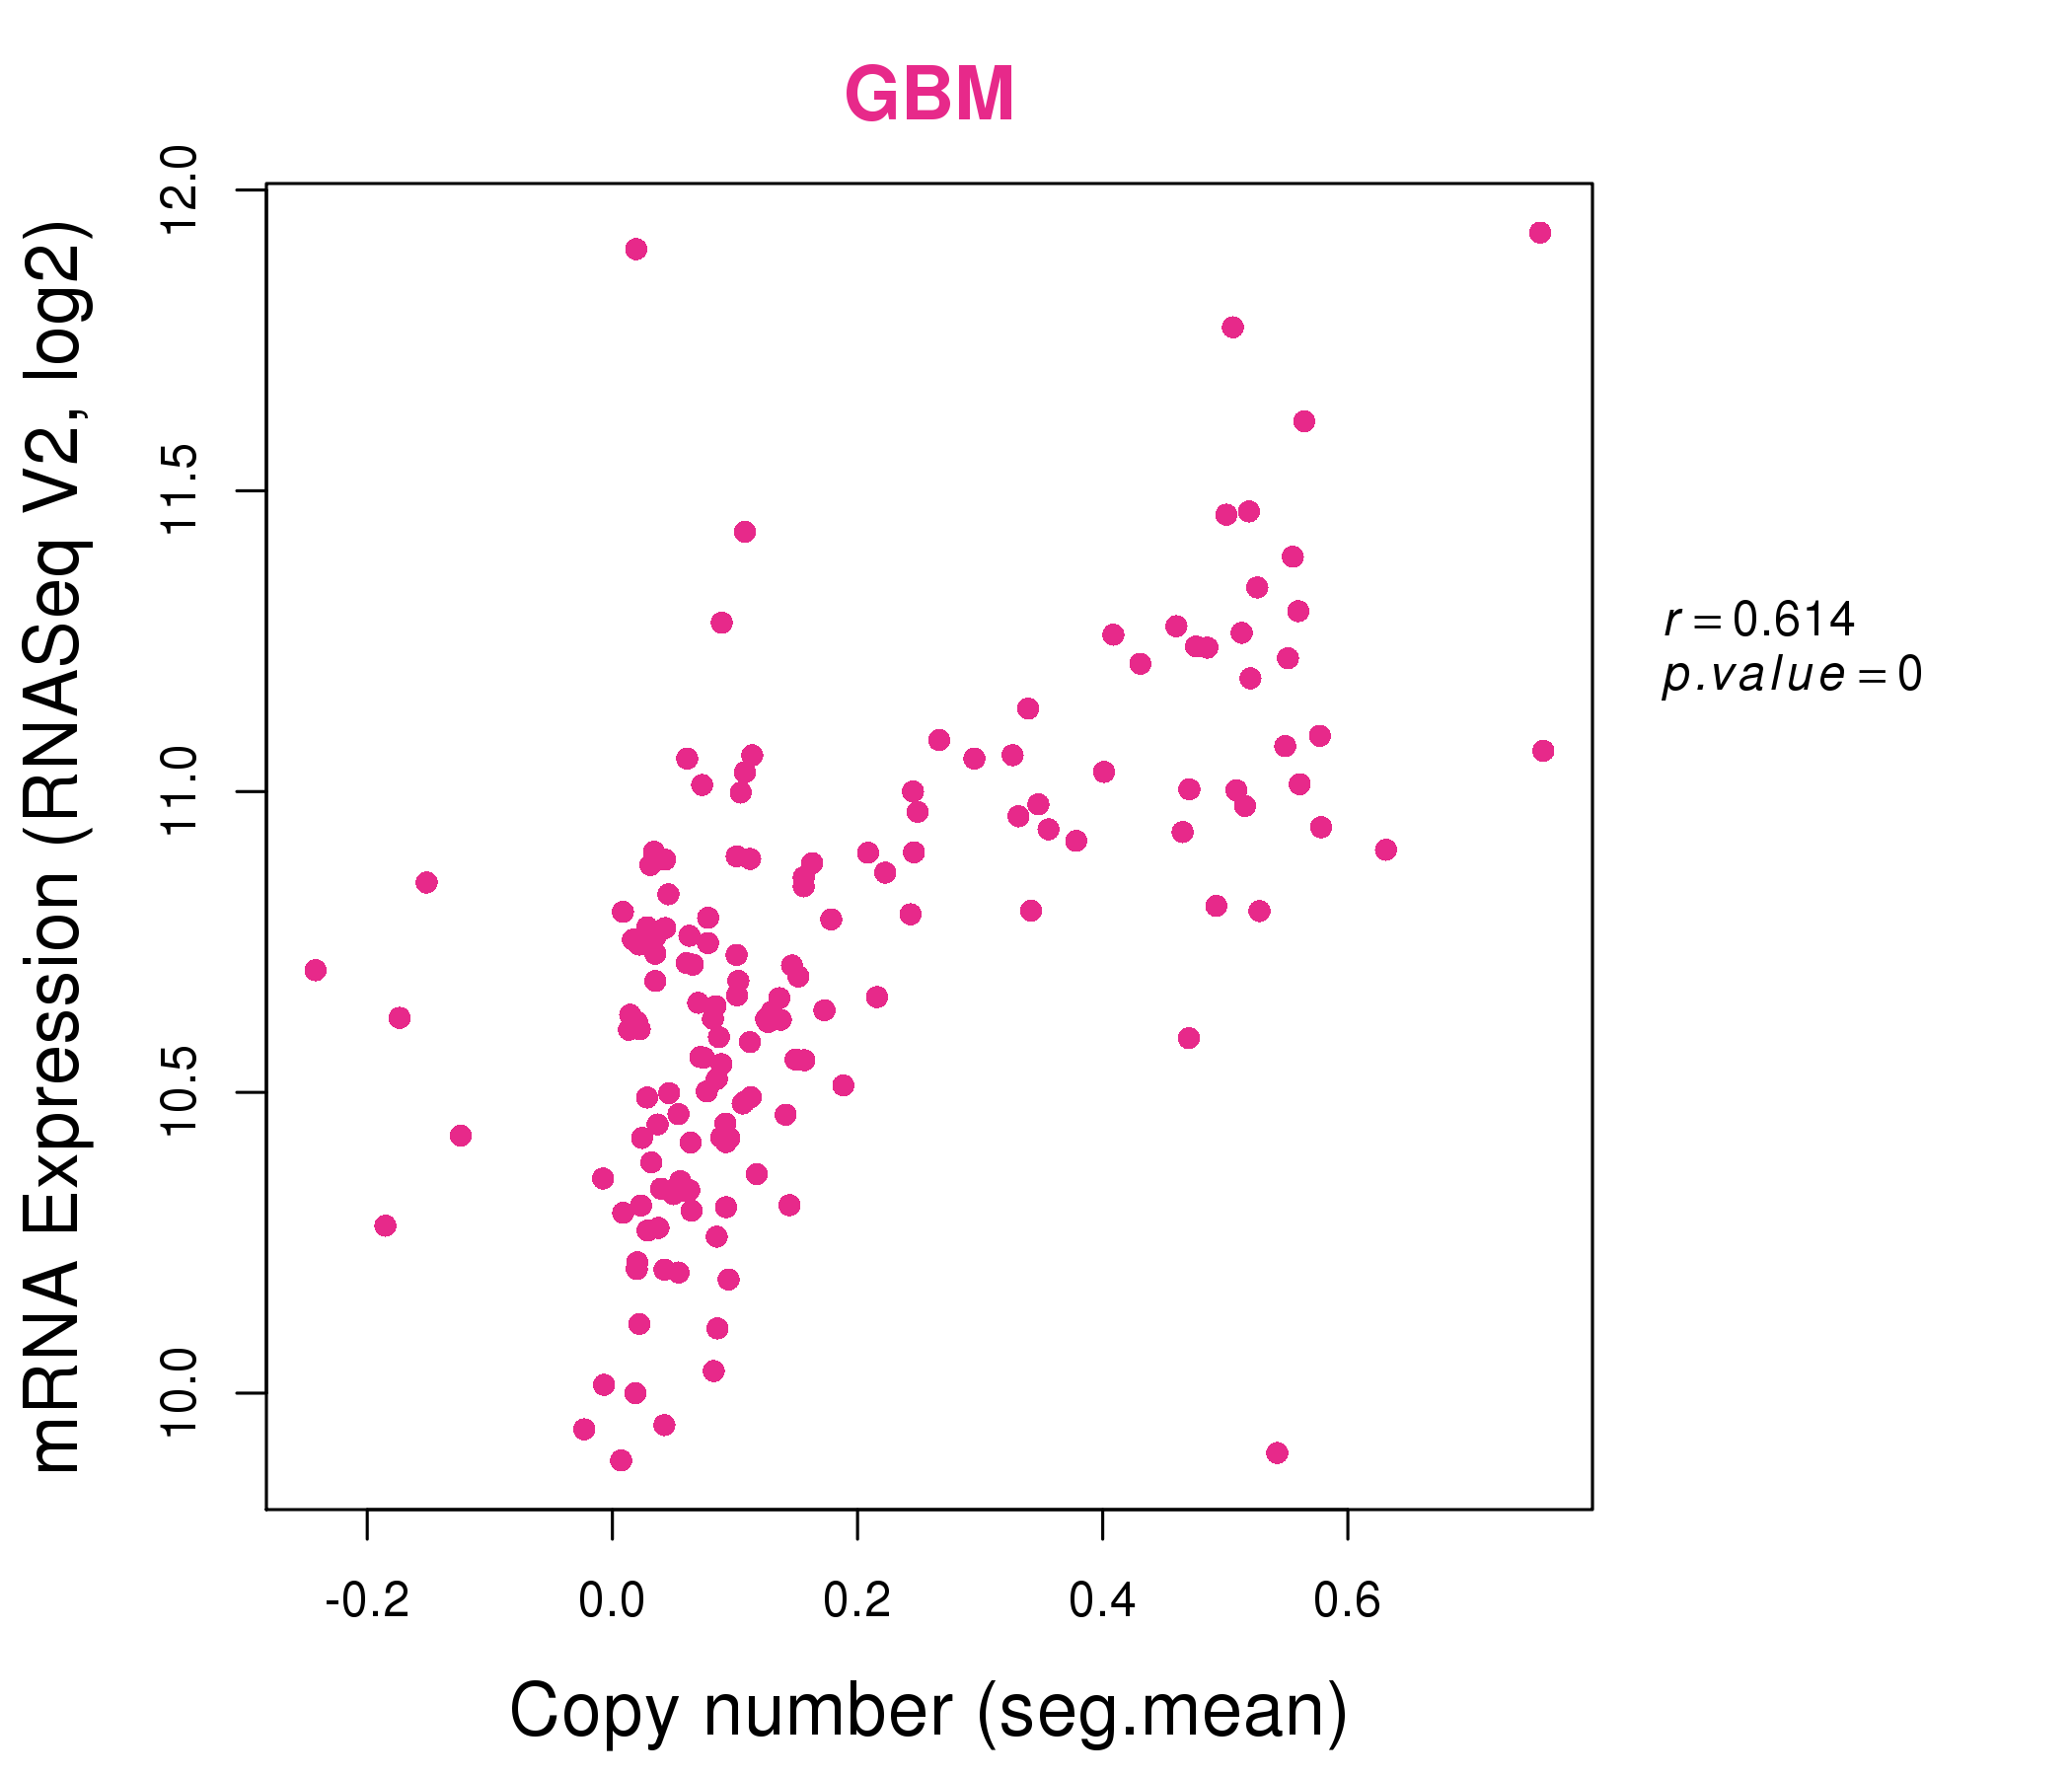
| * This plots show the correlation between CNV and gene expression. |
: Open all plots for all cancer types
 |
|
 |
|
| Top |
| Gene-Gene Network Information |
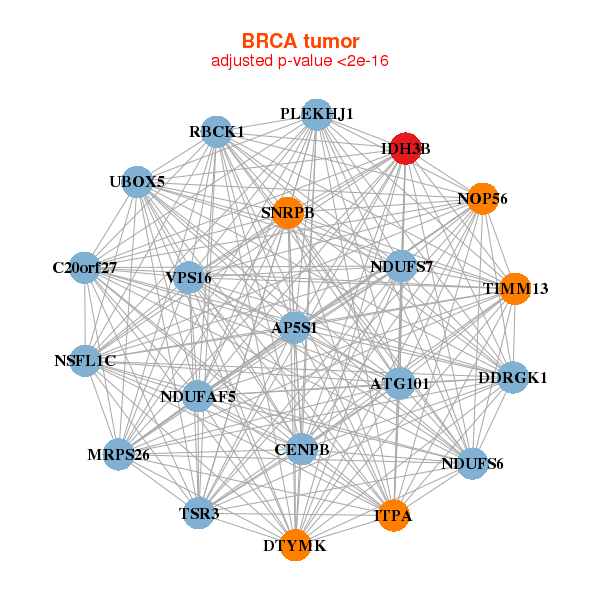
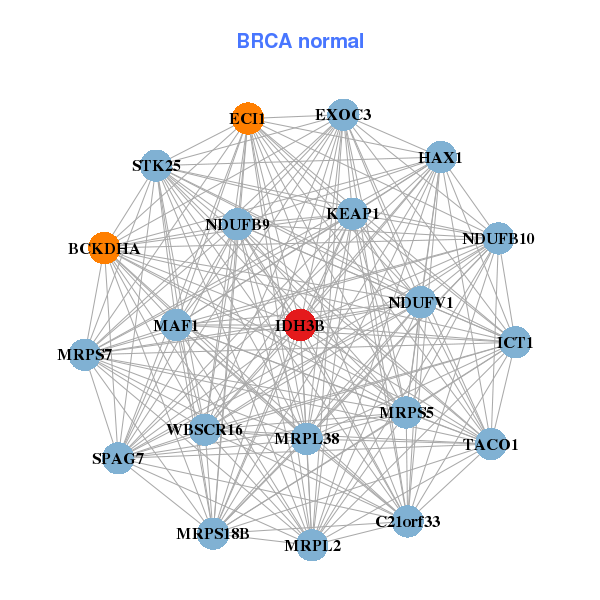
| * Co-Expression network figures were drawn using R package igraph. Only the top 20 genes with the highest correlations were shown. Red circle: input gene, orange circle: cell metabolism gene, sky circle: other gene |
: Open all plots for all cancer types
 |
| ||||
| ATG101,TSR3,C20orf27,AP5S1,NDUFAF5,CENPB,DDRGK1, DTYMK,IDH3B,ITPA,MRPS26,NDUFS6,NDUFS7,NOP56, NSFL1C,PLEKHJ1,RBCK1,SNRPB,TIMM13,UBOX5,VPS16 | BCKDHA,C21orf33,ECI1,EXOC3,HAX1,ICT1,IDH3B, KEAP1,MAF1,MRPL2,MRPL38,MRPS18B,MRPS5,MRPS7, NDUFB10,NDUFB9,NDUFV1,SPAG7,STK25,TACO1,WBSCR16 | ||||
 |
| ||||
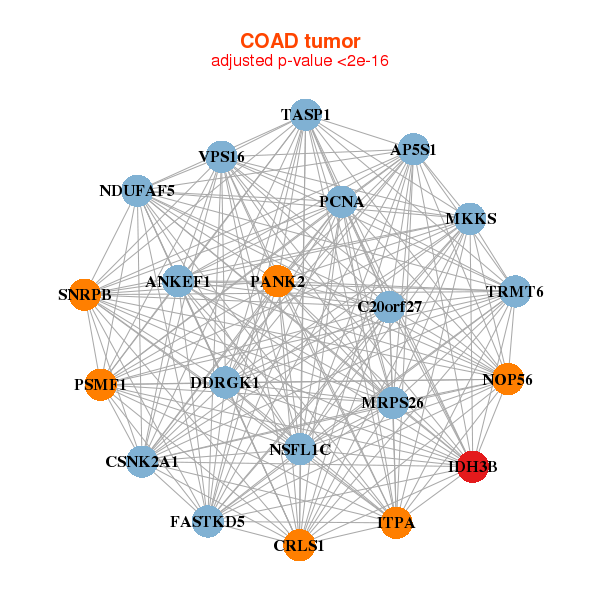
| ANKEF1,C20orf27,AP5S1,NDUFAF5,CRLS1,CSNK2A1,DDRGK1, FASTKD5,IDH3B,ITPA,MKKS,MRPS26,NOP56,NSFL1C, PANK2,PCNA,PSMF1,SNRPB,TASP1,TRMT6,VPS16 | ATP5A1,ATP5G1,CYC1,ERAL1,FBXW9,FH,IDH3B, ITPA,MDH2,MRPL12,MRPL2,MRPL38,MRPS12,NDUFS3, NDUFS6,POLDIP2,PPIA,TIMM13,UBAC1,UQCR10,UQCRC2 |
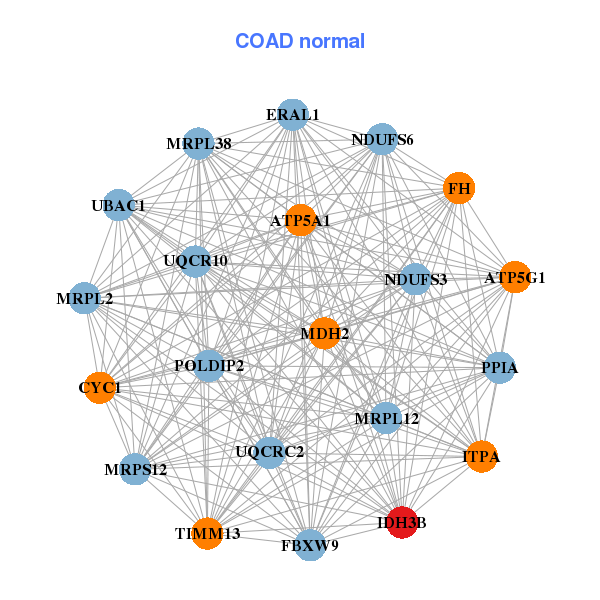
| * Co-Expression network figures were drawn using R package igraph. Only the top 20 genes with the highest correlations were shown. Red circle: input gene, orange circle: cell metabolism gene, sky circle: other gene |
: Open all plots for all cancer types
| Top |
: Open all interacting genes' information including KEGG pathway for all interacting genes from DAVID
| Top |
| Pharmacological Information for IDH3B |
| DB Category | DB Name | DB's ID and Url link |
| * Gene Centered Interaction Network. |
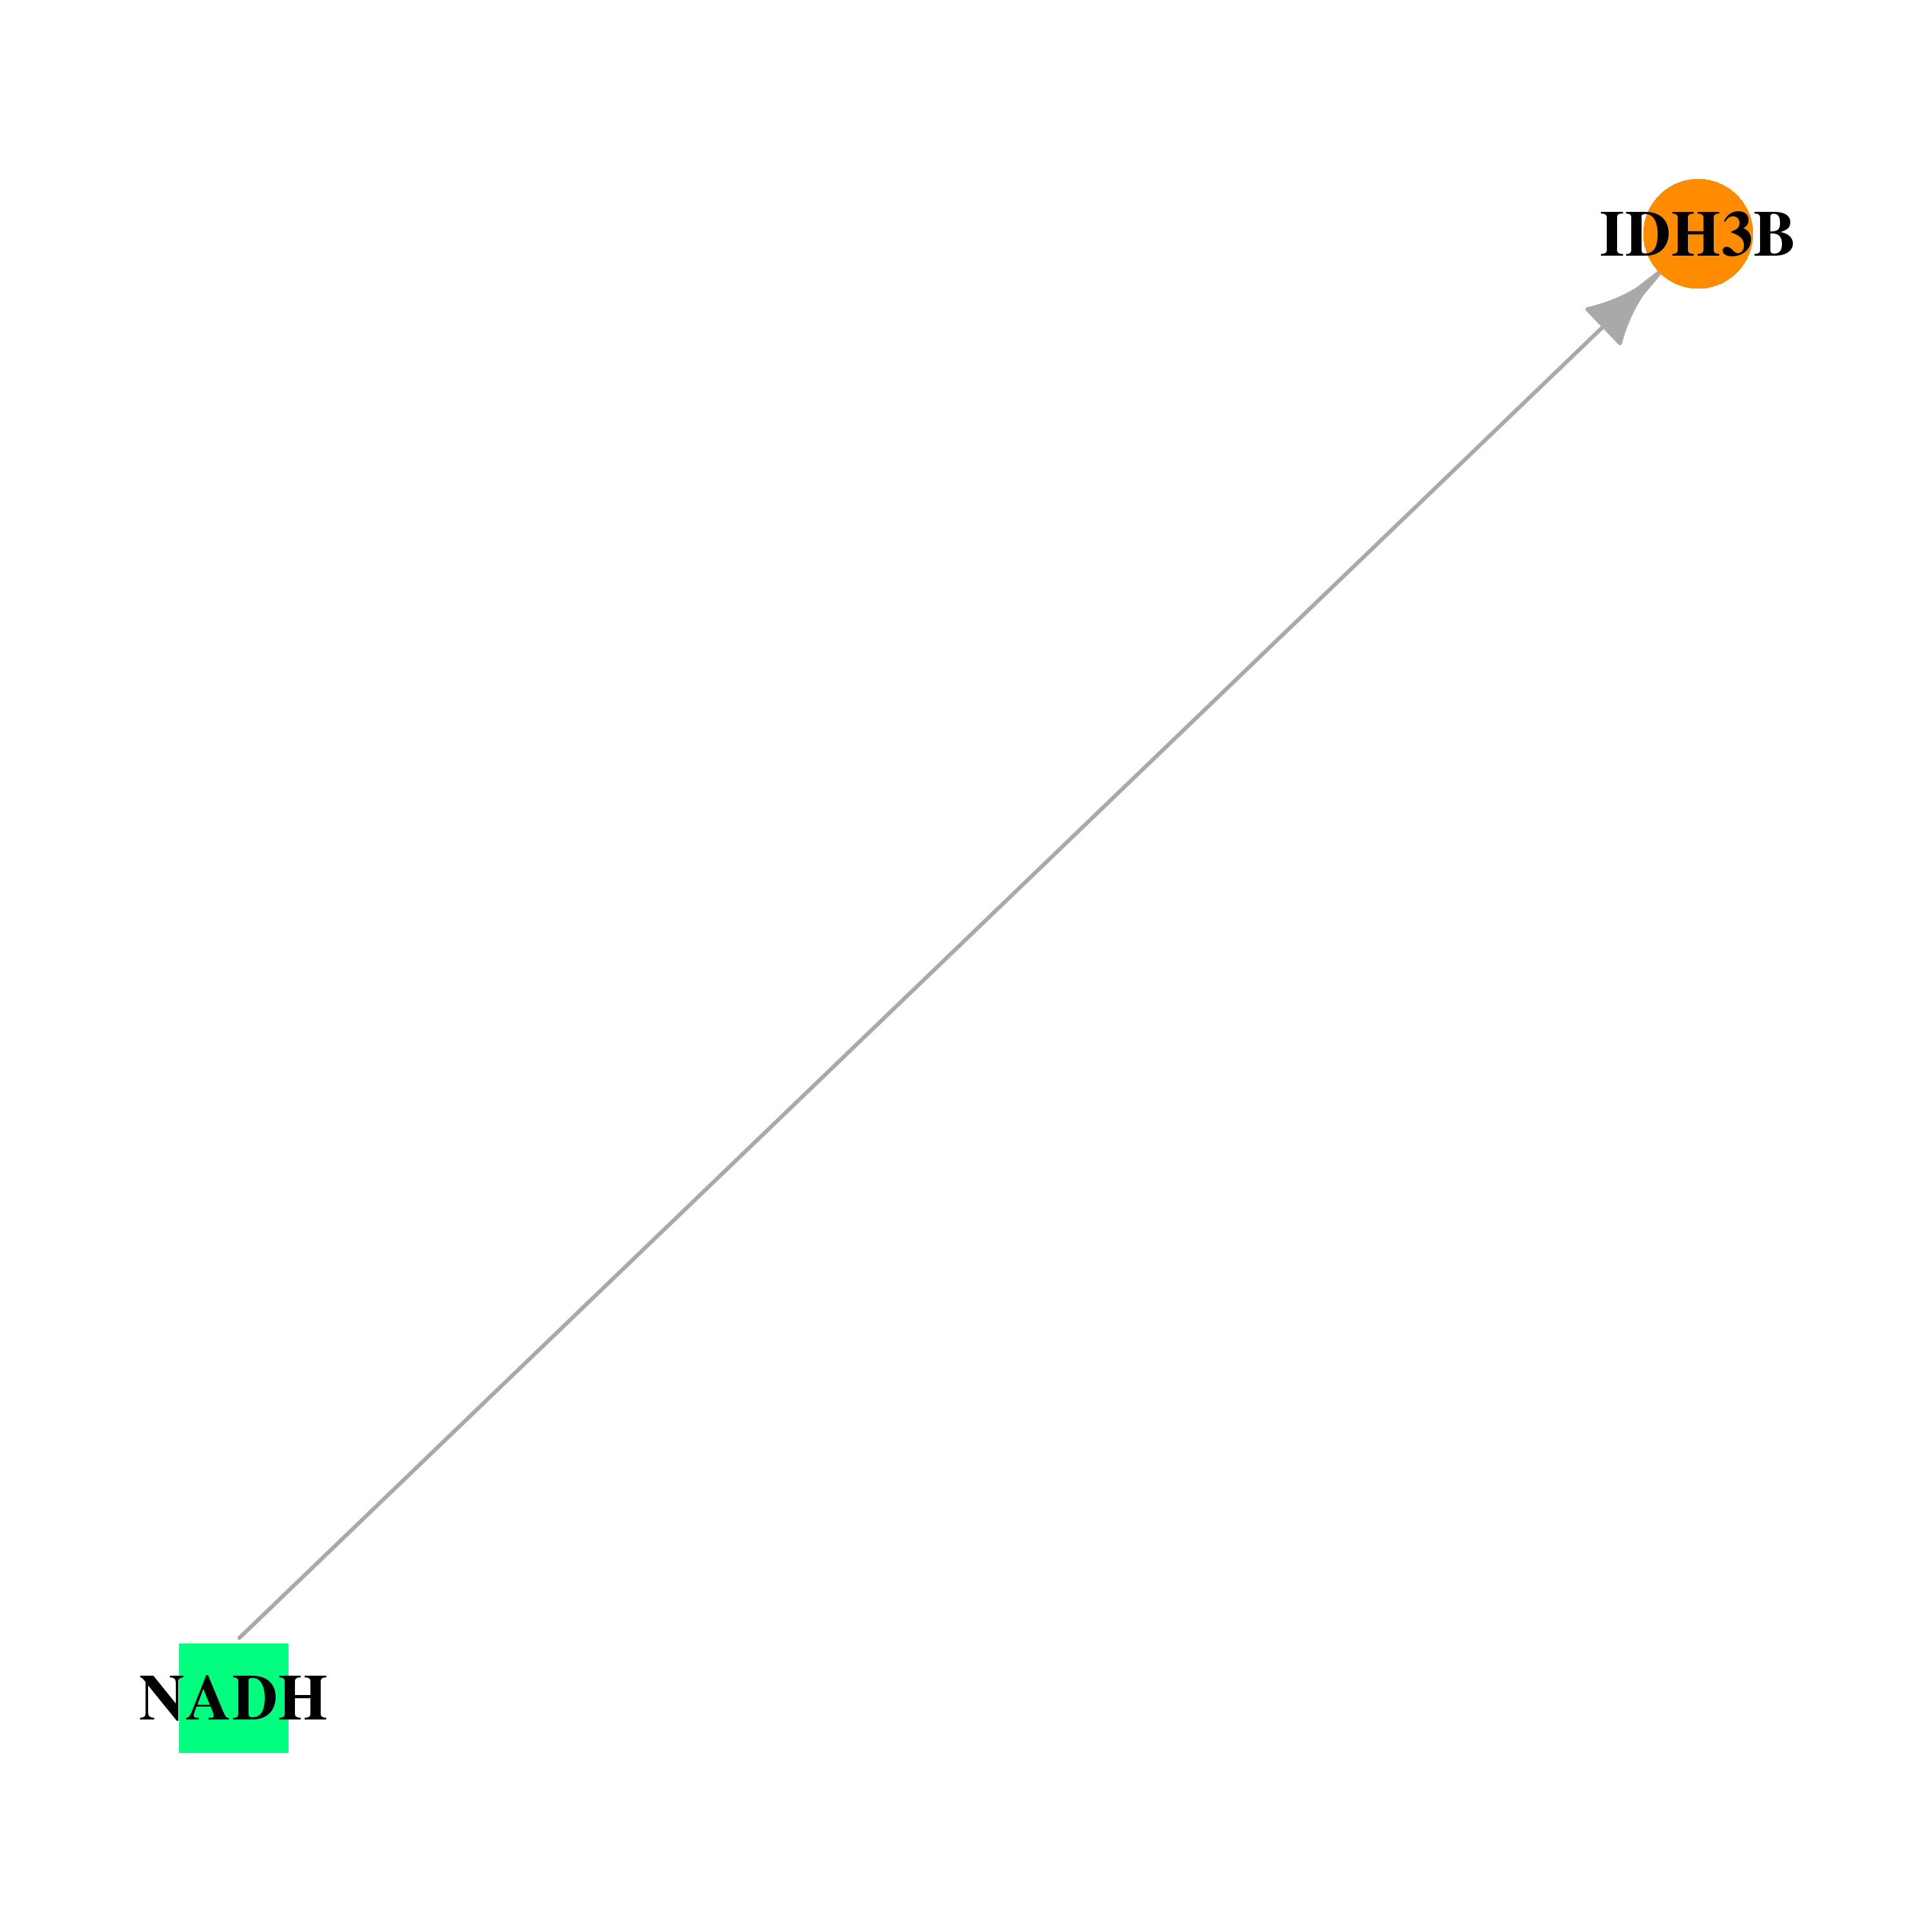 |
| * Drug Centered Interaction Network. |
| DrugBank ID | Target Name | Drug Groups | Generic Name | Drug Centered Network | Drug Structure |
| DB00157 | isocitrate dehydrogenase 3 (NAD+) beta | approved; nutraceutical | NADH |  |  |
| Top |
| Cross referenced IDs for IDH3B |
| * We obtained these cross-references from Uniprot database. It covers 150 different DBs, 18 categories. http://www.uniprot.org/help/cross_references_section |
: Open all cross reference information
|
Copyright © 2016-Present - The Univsersity of Texas Health Science Center at Houston @ |