|
||||||||||||||||||||
| |
| Phenotypic Information (metabolism pathway, cancer, disease, phenome) |
| |
| |
| Gene-Gene Network Information: Co-Expression Network, Interacting Genes & KEGG |
| |
|


| Gene Summary for IDH3G |
| Basic gene info. | Gene symbol | IDH3G |
| Gene name | isocitrate dehydrogenase 3 (NAD+) gamma | |
| Synonyms | H-IDHG | |
| Cytomap | UCSC genome browser: Xq28 | |
| Genomic location | chrX :153051220-153059967 | |
| Type of gene | protein-coding | |
| RefGenes | NM_004135.3, NM_174869.2, | |
| Ensembl id | ENSG00000267989 | |
| Description | IDH-gammaNAD (H)-specific isocitrate dehydrogenase gamma subunitNAD(+)-specific ICDH subunit gammaNAD+-specific ICDHisocitrate dehydrogenase [NAD] subunit gamma, mitochondrialisocitrate dehydrogenase, NAD(+)-specific, mitochondrial, gamma subunitiso | |
| Modification date | 20141207 | |
| dbXrefs | MIM : 300089 | |
| HGNC : HGNC | ||
| Ensembl : ENSG00000067829 | ||
| HPRD : 02100 | ||
| Vega : OTTHUMG00000024219 | ||
| Protein | UniProt: go to UniProt's Cross Reference DB Table | |
| Expression | CleanEX: HS_IDH3G | |
| BioGPS: 3421 | ||
| Gene Expression Atlas: ENSG00000267989 | ||
| The Human Protein Atlas: ENSG00000267989 | ||
| Pathway | NCI Pathway Interaction Database: IDH3G | |
| KEGG: IDH3G | ||
| REACTOME: IDH3G | ||
| ConsensusPathDB | ||
| Pathway Commons: IDH3G | ||
| Metabolism | MetaCyc: IDH3G | |
| HUMANCyc: IDH3G | ||
| Regulation | Ensembl's Regulation: ENSG00000267989 | |
| miRBase: chrX :153,051,220-153,059,967 | ||
| TargetScan: NM_004135 | ||
| cisRED: ENSG00000267989 | ||
| Context | iHOP: IDH3G | |
| cancer metabolism search in PubMed: IDH3G | ||
| UCL Cancer Institute: IDH3G | ||
| Assigned class in ccmGDB | C | |
| Top |
| Phenotypic Information for IDH3G(metabolism pathway, cancer, disease, phenome) |
| Cancer | CGAP: IDH3G |
| Familial Cancer Database: IDH3G | |
| * This gene is included in those cancer gene databases. |
|
|
|
|
|
|
| ||||||||||||||
Oncogene 1 | Significant driver gene in | |||||||||||||||||||
| cf) number; DB name 1 Oncogene; http://nar.oxfordjournals.org/content/35/suppl_1/D721.long, 2 Tumor Suppressor gene; https://bioinfo.uth.edu/TSGene/, 3 Cancer Gene Census; http://www.nature.com/nrc/journal/v4/n3/abs/nrc1299.html, 4 CancerGenes; http://nar.oxfordjournals.org/content/35/suppl_1/D721.long, 5 Network of Cancer Gene; http://ncg.kcl.ac.uk/index.php, 1Therapeutic Vulnerabilities in Cancer; http://cbio.mskcc.org/cancergenomics/statius/ |
| REACTOME_PYRUVATE_METABOLISM_AND_CITRIC_ACID_TCA_CYCLE REACTOME_METABOLISM_OF_PROTEINS | |
| OMIM | |
| Orphanet | |
| Disease | KEGG Disease: IDH3G |
| MedGen: IDH3G (Human Medical Genetics with Condition) | |
| ClinVar: IDH3G | |
| Phenotype | MGI: IDH3G (International Mouse Phenotyping Consortium) |
| PhenomicDB: IDH3G | |
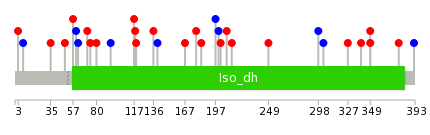
| Mutations for IDH3G |
| * Under tables are showing count per each tissue to give us broad intuition about tissue specific mutation patterns.You can go to the detailed page for each mutation database's web site. |
| There's no structural variation information in COSMIC data for this gene. |
| * From mRNA Sanger sequences, Chitars2.0 arranged chimeric transcripts. This table shows IDH3G related fusion information. |
| ID | Head Gene | Tail Gene | Accession | Gene_a | qStart_a | qEnd_a | Chromosome_a | tStart_a | tEnd_a | Gene_a | qStart_a | qEnd_a | Chromosome_a | tStart_a | tEnd_a |
| BC008758 | IDH3G | 1 | 1661 | X | 153051222 | 153059836 | UBE2Q2P2 | 1653 | 2354 | 15 | 82664400 | 82665101 | |
| AW390706 | IDH3G | 1 | 107 | X | 153051322 | 153051428 | PKP2 | 102 | 387 | 12 | 32949101 | 32955490 | |
| BF902554 | DAZAP1 | 8 | 241 | 19 | 1419767 | 1420000 | IDH3G | 237 | 371 | X | 153052996 | 153053355 | |
| Top |
| There's no copy number variation information in COSMIC data for this gene. |
| Top |
|
 |
| Top |
| Stat. for Non-Synonymous SNVs (# total SNVs=26) | (# total SNVs=13) |
 |  |
(# total SNVs=0) | (# total SNVs=0) |
| Top |
| * When you move the cursor on each content, you can see more deailed mutation information on the Tooltip. Those are primary_site,primary_histology,mutation(aa),pubmedID. |
| GRCh37 position | Mutation(aa) | Unique sampleID count |
| chr23:153053041-153053041 | p.G184G | 2 |
| chr23:153053582-153053582 | p.E119K | 2 |
| chr23:153051702-153051702 | p.R349C | 2 |
| chr23:153055739-153055739 | p.S48S | 1 |
| chr23:153052927-153052927 | p.A222A | 1 |
| chr23:153053287-153053287 | p.L177L | 1 |
| chr23:153051711-153051711 | p.T346P | 1 |
| chr23:153055231-153055231 | p.N94N | 1 |
| chr23:153056285-153056285 | p.P35S | 1 |
| chr23:153052943-153052943 | p.T217M | 1 |
| Top |
|
 |
| Point Mutation/ Tissue ID | 1 | 2 | 3 | 4 | 5 | 6 | 7 | 8 | 9 | 10 | 11 | 12 | 13 | 14 | 15 | 16 | 17 | 18 | 19 | 20 |
| # sample | 1 | 5 | 2 | 2 | 3 | 2 | 6 | 2 | 9 | |||||||||||
| # mutation | 1 | 5 | 2 | 2 | 3 | 2 | 6 | 2 | 10 | |||||||||||
| nonsynonymous SNV | 1 | 4 | 1 | 2 | 2 | 2 | 1 | 2 | 8 | |||||||||||
| synonymous SNV | 1 | 1 | 1 | 5 | 2 |
| cf) Tissue ID; Tissue type (1; BLCA[Bladder Urothelial Carcinoma], 2; BRCA[Breast invasive carcinoma], 3; CESC[Cervical squamous cell carcinoma and endocervical adenocarcinoma], 4; COAD[Colon adenocarcinoma], 5; GBM[Glioblastoma multiforme], 6; Glioma Low Grade, 7; HNSC[Head and Neck squamous cell carcinoma], 8; KICH[Kidney Chromophobe], 9; KIRC[Kidney renal clear cell carcinoma], 10; KIRP[Kidney renal papillary cell carcinoma], 11; LAML[Acute Myeloid Leukemia], 12; LUAD[Lung adenocarcinoma], 13; LUSC[Lung squamous cell carcinoma], 14; OV[Ovarian serous cystadenocarcinoma ], 15; PAAD[Pancreatic adenocarcinoma], 16; PRAD[Prostate adenocarcinoma], 17; SKCM[Skin Cutaneous Melanoma], 18:STAD[Stomach adenocarcinoma], 19:THCA[Thyroid carcinoma], 20:UCEC[Uterine Corpus Endometrial Carcinoma]) |
| Top |
| * We represented just top 10 SNVs. When you move the cursor on each content, you can see more deailed mutation information on the Tooltip. Those are primary_site, primary_histology, mutation(aa), pubmedID. |
| Genomic Position | Mutation(aa) | Unique sampleID count |
| chrX:153053319 | p.R213H,IDH3G | 1 |
| chrX:153055703 | p.L71P,IDH3G | 1 |
| chrX:153052271 | p.A208V,IDH3G | 1 |
| chrX:153053398 | p.G62G,IDH3G | 1 |
| chrX:153055714 | p.E202K,IDH3G | 1 |
| chrX:153052286 | p.I60I,IDH3G | 1 |
| chrX:153053531 | p.V57M,IDH3G | 1 |
| chrX:153055738 | p.I200I,IDH3G | 1 |
| chrX:153052538 | p.A49T,IDH3G | 1 |
| chrX:153053582 | p.S197S,IDH3G | 1 |
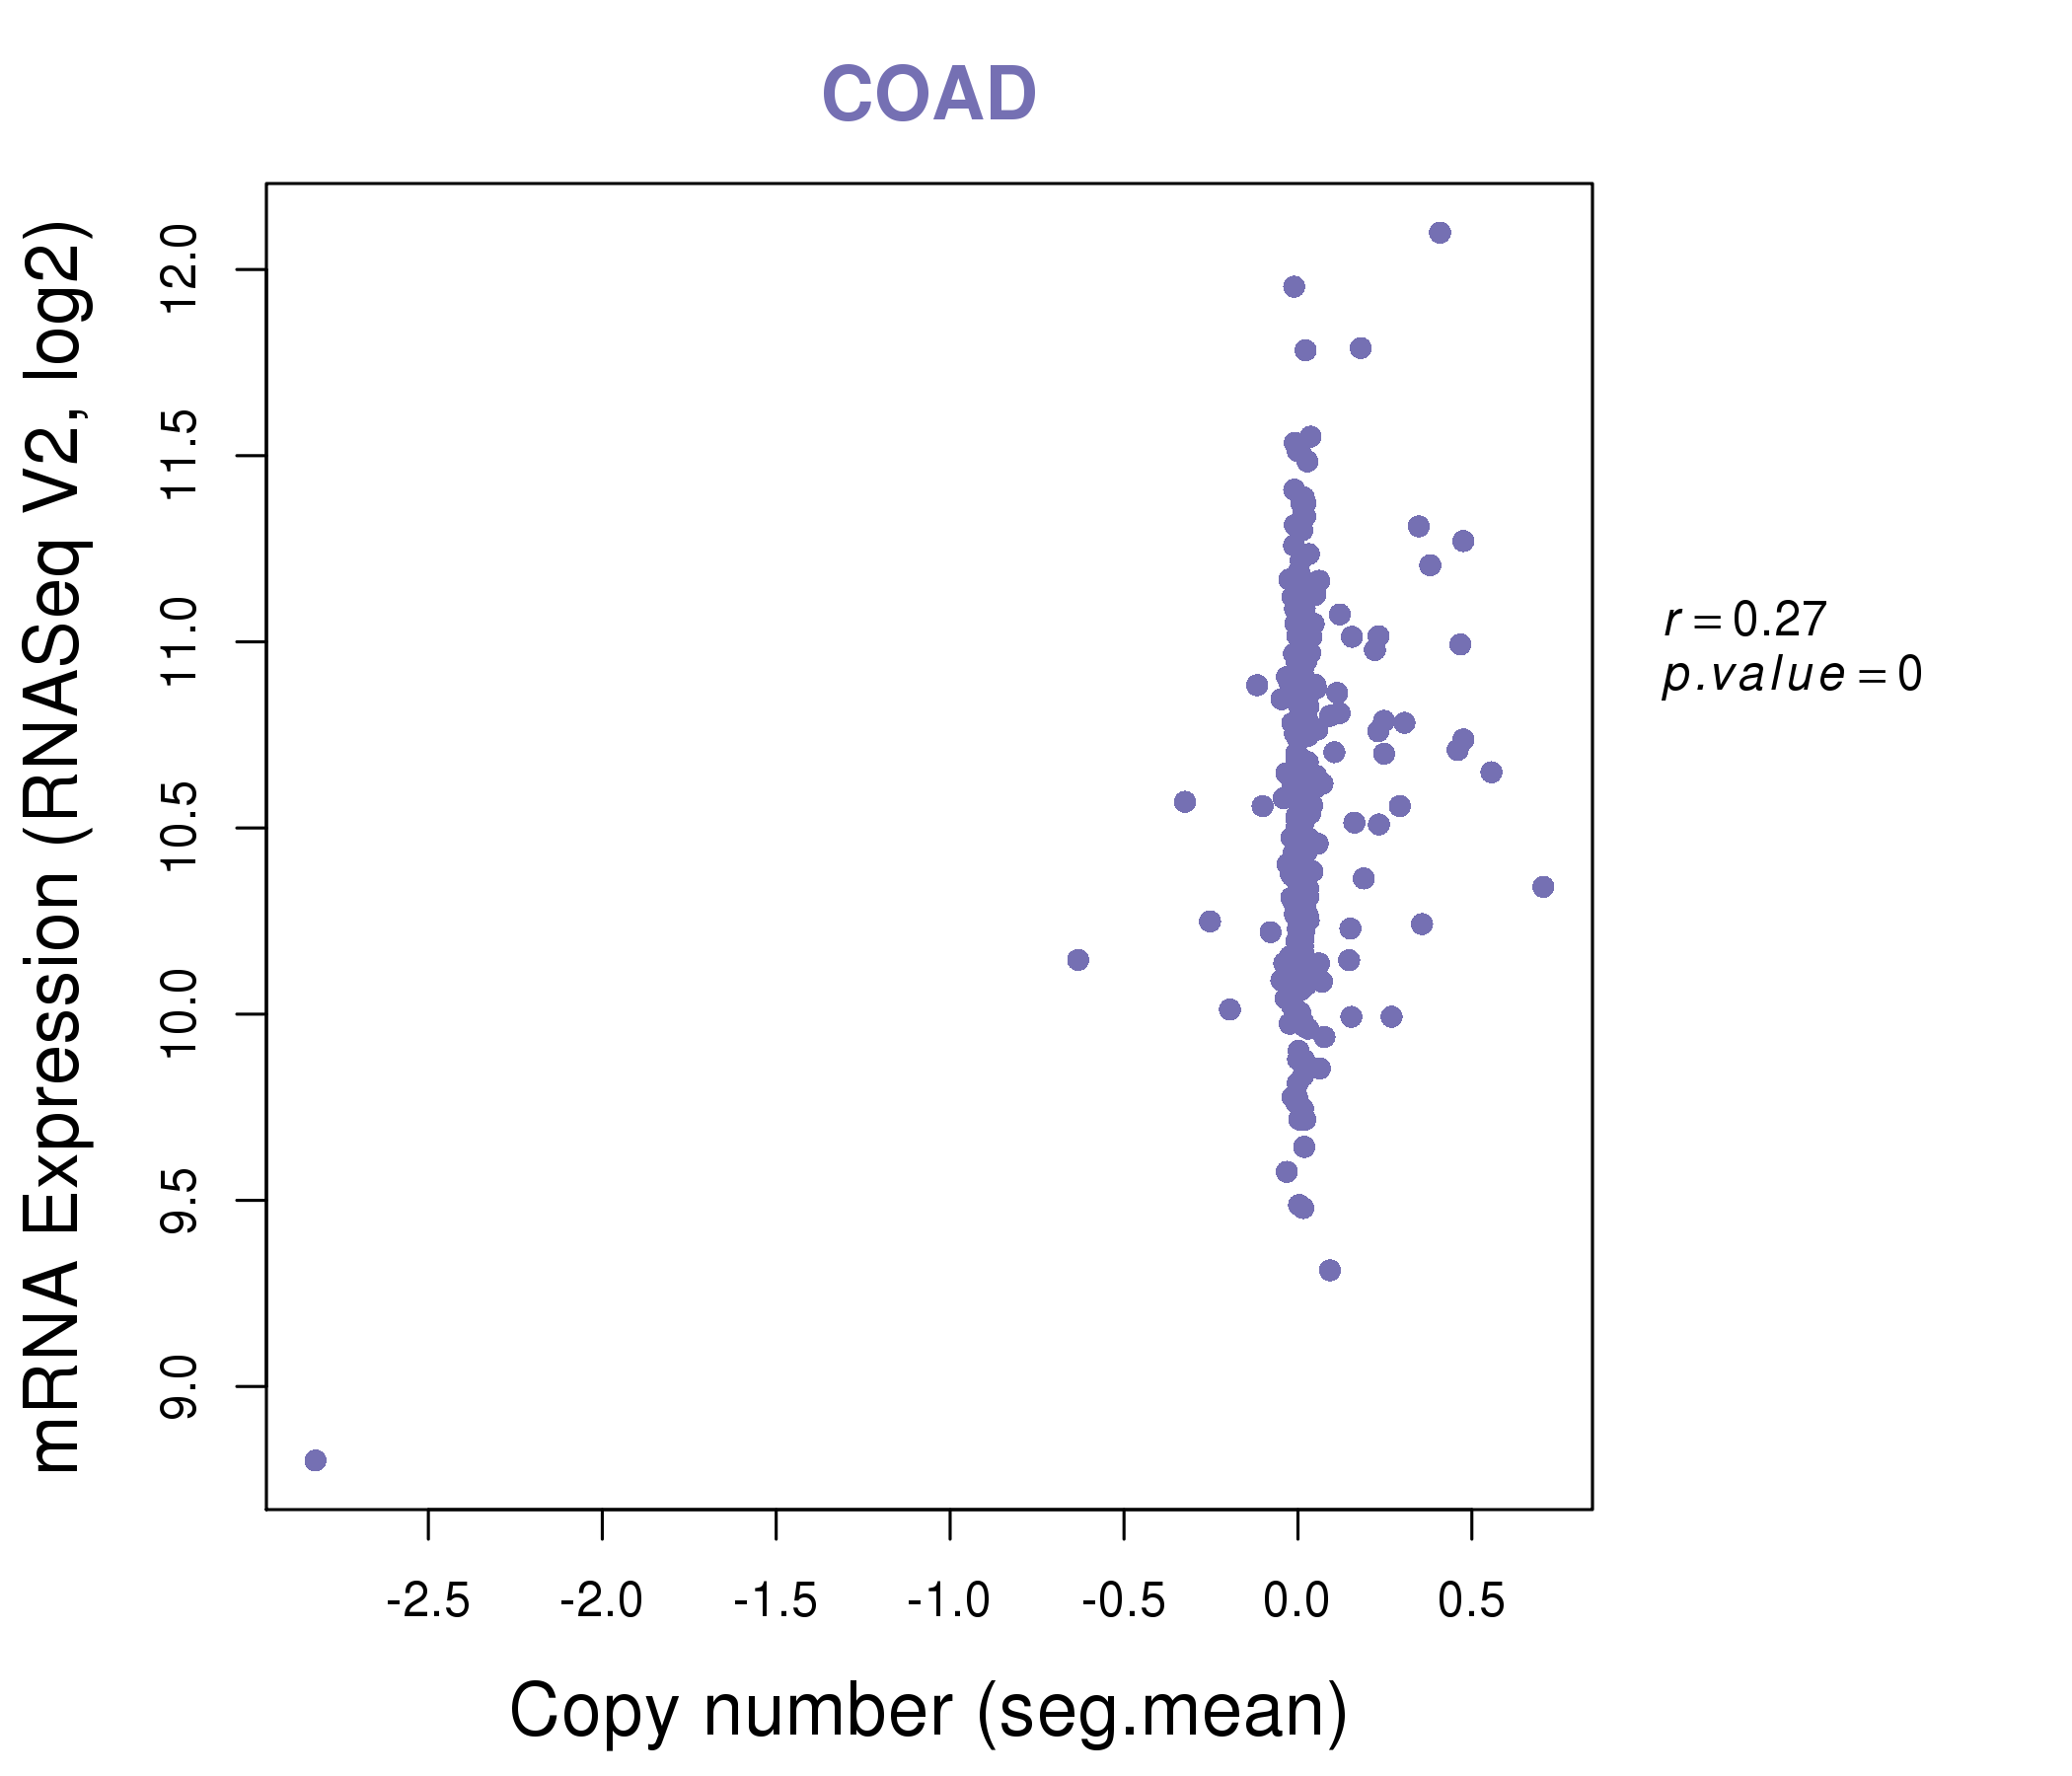
| * Copy number data were extracted from TCGA using R package TCGA-Assembler. The URLs of all public data files on TCGA DCC data server were gathered on Jan-05-2015. Function ProcessCNAData in TCGA-Assembler package was used to obtain gene-level copy number value which is calculated as the average copy number of the genomic region of a gene. |
 |
| cf) Tissue ID[Tissue type]: BLCA[Bladder Urothelial Carcinoma], BRCA[Breast invasive carcinoma], CESC[Cervical squamous cell carcinoma and endocervical adenocarcinoma], COAD[Colon adenocarcinoma], GBM[Glioblastoma multiforme], Glioma Low Grade, HNSC[Head and Neck squamous cell carcinoma], KICH[Kidney Chromophobe], KIRC[Kidney renal clear cell carcinoma], KIRP[Kidney renal papillary cell carcinoma], LAML[Acute Myeloid Leukemia], LUAD[Lung adenocarcinoma], LUSC[Lung squamous cell carcinoma], OV[Ovarian serous cystadenocarcinoma ], PAAD[Pancreatic adenocarcinoma], PRAD[Prostate adenocarcinoma], SKCM[Skin Cutaneous Melanoma], STAD[Stomach adenocarcinoma], THCA[Thyroid carcinoma], UCEC[Uterine Corpus Endometrial Carcinoma] |
| Top |
| Gene Expression for IDH3G |
| * CCLE gene expression data were extracted from CCLE_Expression_Entrez_2012-10-18.res: Gene-centric RMA-normalized mRNA expression data. |
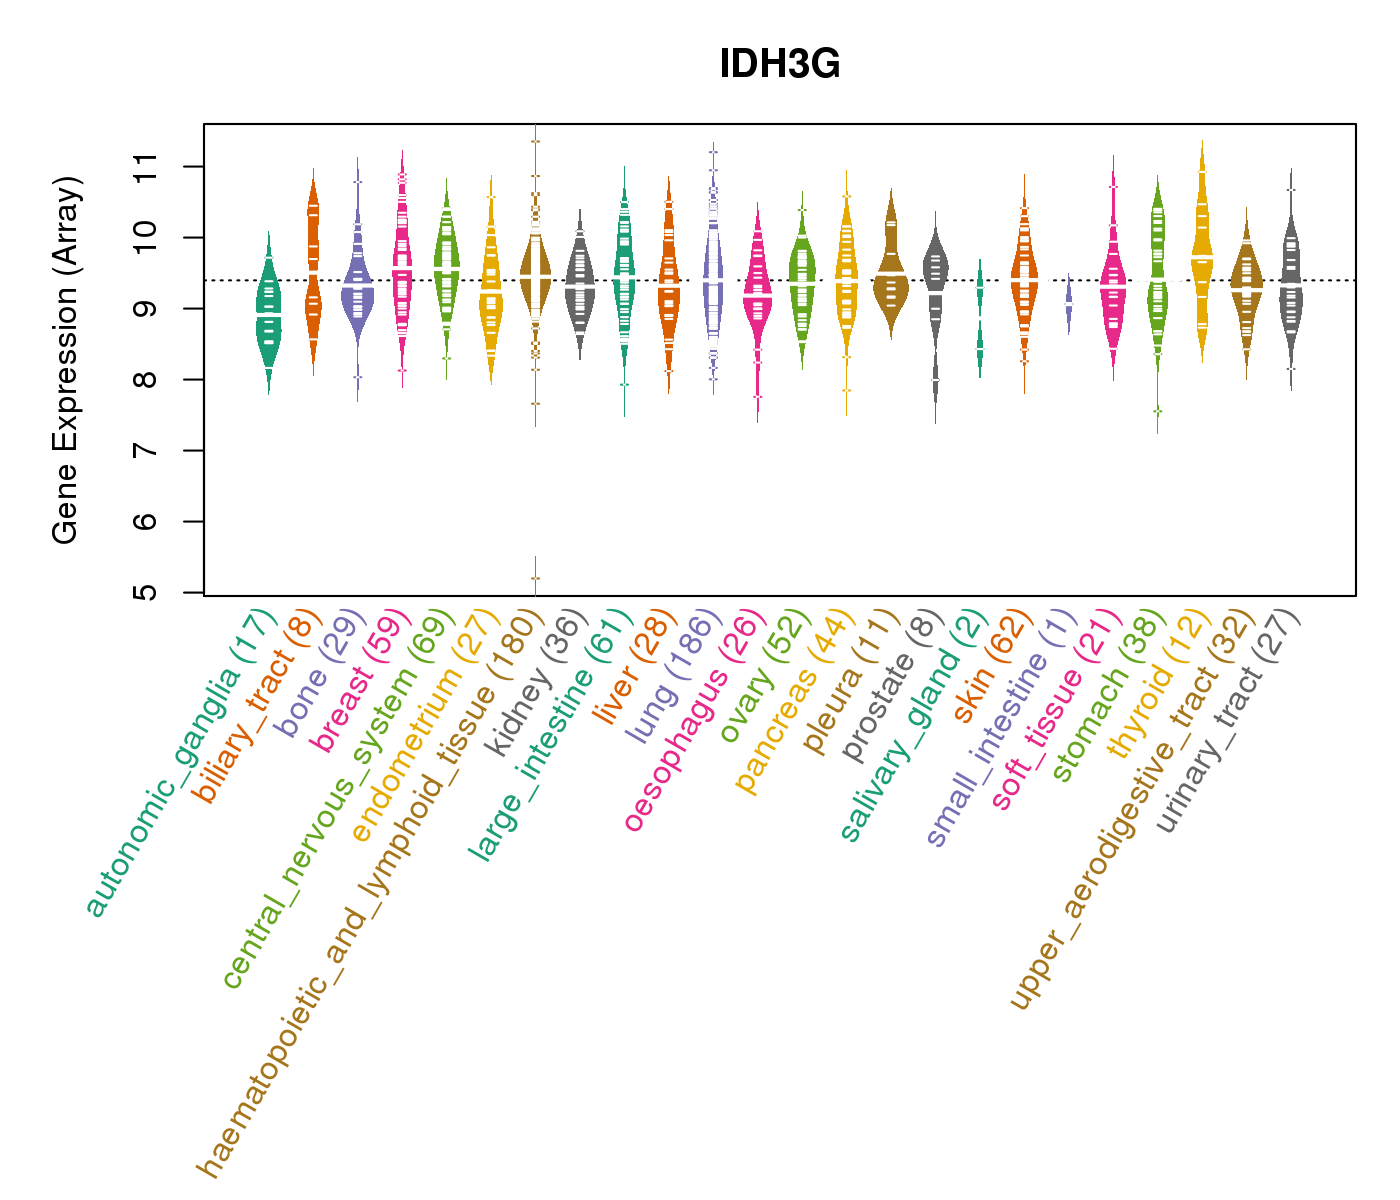 |
| * Normalized gene expression data of RNASeqV2 was extracted from TCGA using R package TCGA-Assembler. The URLs of all public data files on TCGA DCC data server were gathered at Jan-05-2015. Only eight cancer types have enough normal control samples for differential expression analysis. (t test, adjusted p<0.05 (using Benjamini-Hochberg FDR)) |
 |
| Top |
| * This plots show the correlation between CNV and gene expression. |
: Open all plots for all cancer types
 |
|
 |
|


| Top |
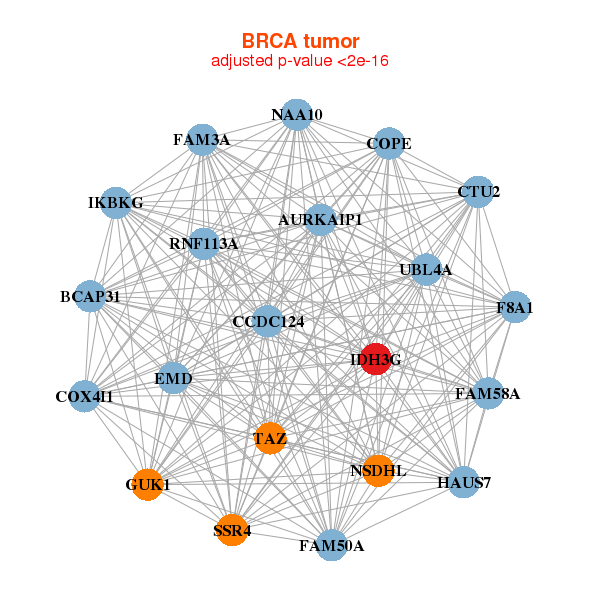
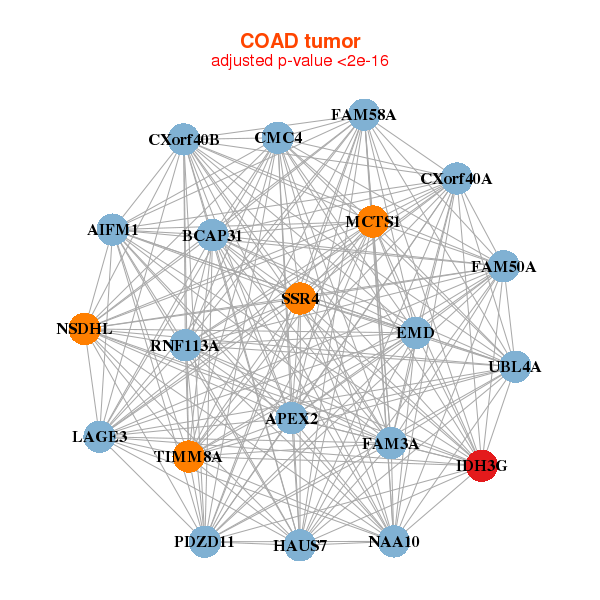
| Gene-Gene Network Information |
| * Co-Expression network figures were drawn using R package igraph. Only the top 20 genes with the highest correlations were shown. Red circle: input gene, orange circle: cell metabolism gene, sky circle: other gene |
: Open all plots for all cancer types
 |
| ||||
| AURKAIP1,BCAP31,CCDC124,COPE,COX4I1,CTU2,EMD, F8A1,FAM3A,FAM50A,FAM58A,GUK1,HAUS7,IDH3G, IKBKG,NAA10,NSDHL,RNF113A,SSR4,TAZ,UBL4A | ANAPC11,AURKAIP1,C19orf53,C19orf70,CLPP,COX4I1,CUEDC2, GPS1,IDH3G,MRPL28,MRPL4,MRPS18A,NAA10,NDUFA11, NDUFA13,NDUFB7,POLR2I,THAP4,UBE2M,WDR13,ZNF511 | ||||
 |
| ||||
| AIFM1,APEX2,BCAP31,CXorf40A,CXorf40B,EMD,FAM3A, FAM50A,FAM58A,HAUS7,IDH3G,LAGE3,MCTS1,CMC4, NAA10,NSDHL,PDZD11,RNF113A,SSR4,TIMM8A,UBL4A | ATP5D,AURKAIP1,CAPNS1,CHCHD10,COQ4,ECHS1,ENDOG, ETFB,FAM173A,GTF3C5,IDH3G,MAP2K2,MDH2,MRPL23, NDUFS7,NDUFV1,PGLS,PPAP2C,PTGES2,TALDO1,UQCRC1 |

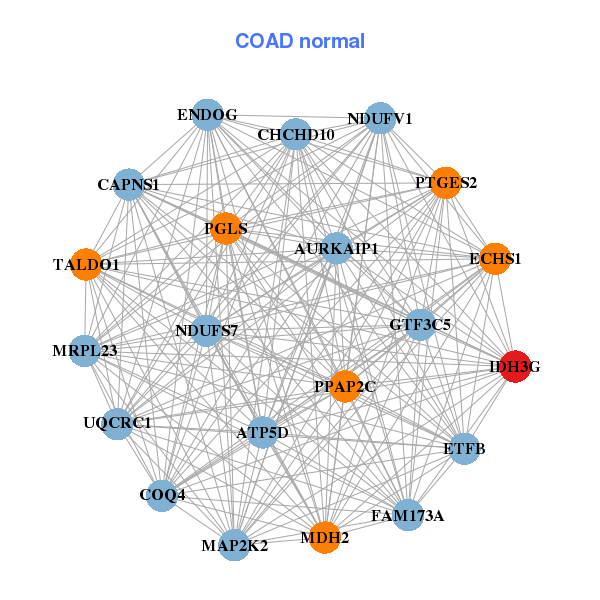
| * Co-Expression network figures were drawn using R package igraph. Only the top 20 genes with the highest correlations were shown. Red circle: input gene, orange circle: cell metabolism gene, sky circle: other gene |
: Open all plots for all cancer types
| Top |
: Open all interacting genes' information including KEGG pathway for all interacting genes from DAVID
| Top |
| Pharmacological Information for IDH3G |
| DB Category | DB Name | DB's ID and Url link |
| * Gene Centered Interaction Network. |
 |
| * Drug Centered Interaction Network. |
| DrugBank ID | Target Name | Drug Groups | Generic Name | Drug Centered Network | Drug Structure |
| DB00157 | isocitrate dehydrogenase 3 (NAD+) gamma | approved; nutraceutical | NADH |  |  |
| Top |
| Cross referenced IDs for IDH3G |
| * We obtained these cross-references from Uniprot database. It covers 150 different DBs, 18 categories. http://www.uniprot.org/help/cross_references_section |
: Open all cross reference information
|
Copyright © 2016-Present - The Univsersity of Texas Health Science Center at Houston @ |