|
||||||||||||||||||||
| |
| Phenotypic Information (metabolism pathway, cancer, disease, phenome) |
| |
| |
| Gene-Gene Network Information: Co-Expression Network, Interacting Genes & KEGG |
| |
|


| Gene Summary for IDI1 |
| Basic gene info. | Gene symbol | IDI1 |
| Gene name | isopentenyl-diphosphate delta isomerase 1 | |
| Synonyms | IPP1|IPPI1 | |
| Cytomap | UCSC genome browser: 10p15.3 | |
| Genomic location | chr10 :1085963-1095061 | |
| Type of gene | protein-coding | |
| RefGenes | NM_004508.2, | |
| Ensembl id | ENSG00000067064 | |
| Description | IPP isomerase 1isopentenyl diphosphate dimethylallyl diphosphate isomerase 1isopentenyl pyrophosphate isomerase 1isopentenyl-diphosphate Delta-isomerase 1 | |
| Modification date | 20141207 | |
| dbXrefs | MIM : 604055 | |
| HGNC : HGNC | ||
| Ensembl : ENSG00000067064 | ||
| HPRD : 07235 | ||
| Vega : OTTHUMG00000017536 | ||
| Protein | UniProt: go to UniProt's Cross Reference DB Table | |
| Expression | CleanEX: HS_IDI1 | |
| BioGPS: 3422 | ||
| Gene Expression Atlas: ENSG00000067064 | ||
| The Human Protein Atlas: ENSG00000067064 | ||
| Pathway | NCI Pathway Interaction Database: IDI1 | |
| KEGG: IDI1 | ||
| REACTOME: IDI1 | ||
| ConsensusPathDB | ||
| Pathway Commons: IDI1 | ||
| Metabolism | MetaCyc: IDI1 | |
| HUMANCyc: IDI1 | ||
| Regulation | Ensembl's Regulation: ENSG00000067064 | |
| miRBase: chr10 :1,085,963-1,095,061 | ||
| TargetScan: NM_004508 | ||
| cisRED: ENSG00000067064 | ||
| Context | iHOP: IDI1 | |
| cancer metabolism search in PubMed: IDI1 | ||
| UCL Cancer Institute: IDI1 | ||
| Assigned class in ccmGDB | C | |
| Top |
| Phenotypic Information for IDI1(metabolism pathway, cancer, disease, phenome) |
| Cancer | CGAP: IDI1 |
| Familial Cancer Database: IDI1 | |
| * This gene is included in those cancer gene databases. |
|
|
|
|
|
|
| ||||||||||||||
Oncogene 1 | Significant driver gene in | |||||||||||||||||||
| cf) number; DB name 1 Oncogene; http://nar.oxfordjournals.org/content/35/suppl_1/D721.long, 2 Tumor Suppressor gene; https://bioinfo.uth.edu/TSGene/, 3 Cancer Gene Census; http://www.nature.com/nrc/journal/v4/n3/abs/nrc1299.html, 4 CancerGenes; http://nar.oxfordjournals.org/content/35/suppl_1/D721.long, 5 Network of Cancer Gene; http://ncg.kcl.ac.uk/index.php, 1Therapeutic Vulnerabilities in Cancer; http://cbio.mskcc.org/cancergenomics/statius/ |
| REACTOME_METABOLISM_OF_LIPIDS_AND_LIPOPROTEINS | |
| OMIM | |
| Orphanet | |
| Disease | KEGG Disease: IDI1 |
| MedGen: IDI1 (Human Medical Genetics with Condition) | |
| ClinVar: IDI1 | |
| Phenotype | MGI: IDI1 (International Mouse Phenotyping Consortium) |
| PhenomicDB: IDI1 | |
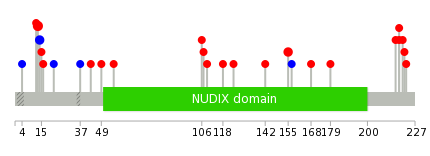
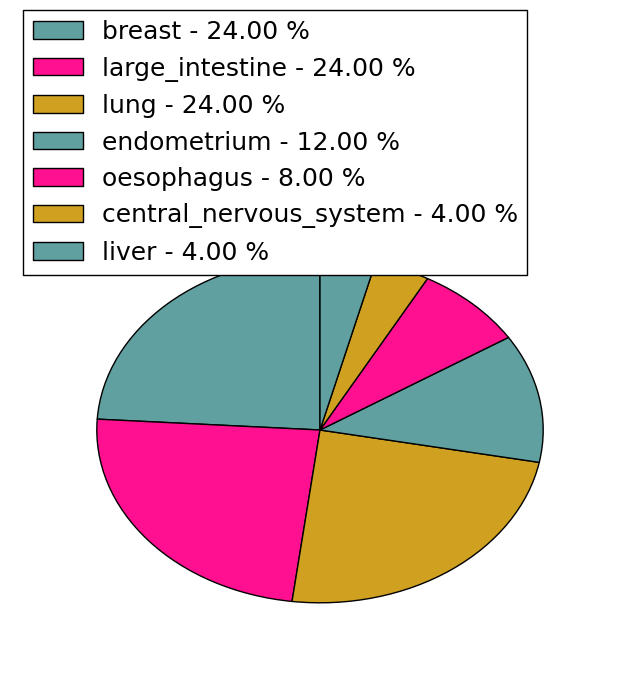
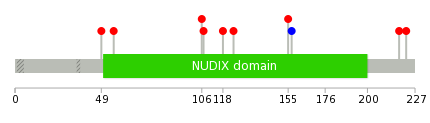
| Mutations for IDI1 |
| * Under tables are showing count per each tissue to give us broad intuition about tissue specific mutation patterns.You can go to the detailed page for each mutation database's web site. |
| There's no structural variation information in COSMIC data for this gene. |
| * From mRNA Sanger sequences, Chitars2.0 arranged chimeric transcripts. This table shows IDI1 related fusion information. |
| ID | Head Gene | Tail Gene | Accession | Gene_a | qStart_a | qEnd_a | Chromosome_a | tStart_a | tEnd_a | Gene_a | qStart_a | qEnd_a | Chromosome_a | tStart_a | tEnd_a |
| BE708329 | IDI1 | 1 | 178 | 10 | 1091338 | 1091515 | CRTC3 | 170 | 246 | 15 | 91122129 | 91122205 | |
| Top |
| There's no copy number variation information in COSMIC data for this gene. |
| Top |
|
 |
| Top |
| Stat. for Non-Synonymous SNVs (# total SNVs=25) | (# total SNVs=5) |
 | 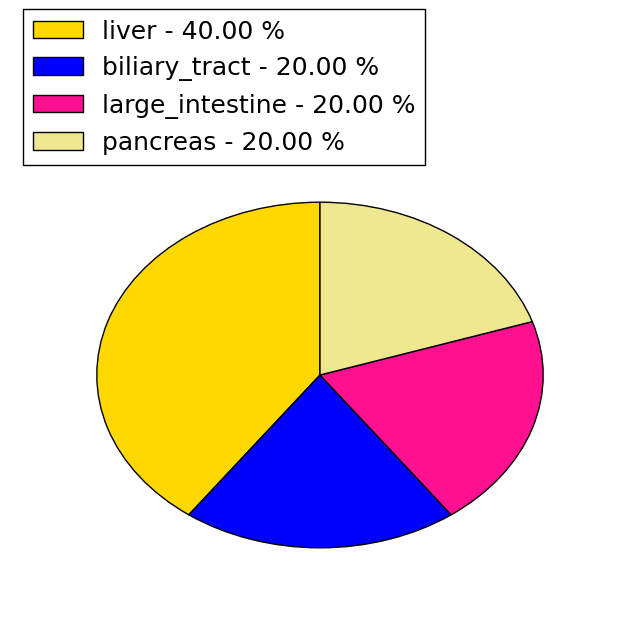 |
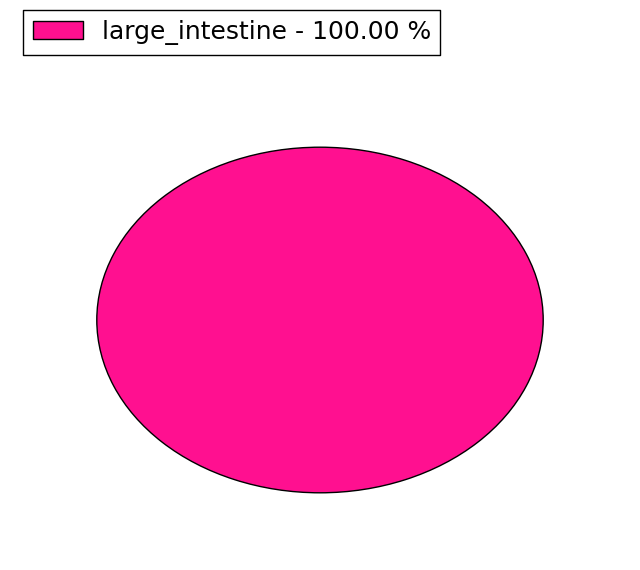
(# total SNVs=1) | (# total SNVs=1) |
 |  |
| Top |
| * When you move the cursor on each content, you can see more deailed mutation information on the Tooltip. Those are primary_site,primary_histology,mutation(aa),pubmedID. |
| GRCh37 position | Mutation(aa) | Unique sampleID count |
| chr10:1094906-1094906 | p.C13Y | 3 |
| chr10:1094902-1094902 | p.A14A | 2 |
| chr10:1087227-1087227 | p.P252L | 2 |
| chr10:1088646-1088646 | p.E155K | 2 |
| chr10:1087324-1087324 | p.P220S | 1 |
| chr10:1089294-1089294 | p.T118I | 1 |
| chr10:1094878-1094878 | p.A22A | 1 |
| chr10:1087138-1087138 | p.Y282H | 1 |
| chr10:1087328-1087328 | p.L218F | 1 |
| chr10:1089321-1089321 | p.R109Q | 1 |
| Top |
|
 |
| Point Mutation/ Tissue ID | 1 | 2 | 3 | 4 | 5 | 6 | 7 | 8 | 9 | 10 | 11 | 12 | 13 | 14 | 15 | 16 | 17 | 18 | 19 | 20 |
| # sample | 2 | 2 | 1 | 1 | 1 | 2 | ||||||||||||||
| # mutation | 2 | 2 | 1 | 1 | 2 | 3 | ||||||||||||||
| nonsynonymous SNV | 2 | 1 | 1 | 1 | 1 | 3 | ||||||||||||||
| synonymous SNV | 1 | 1 |
| cf) Tissue ID; Tissue type (1; BLCA[Bladder Urothelial Carcinoma], 2; BRCA[Breast invasive carcinoma], 3; CESC[Cervical squamous cell carcinoma and endocervical adenocarcinoma], 4; COAD[Colon adenocarcinoma], 5; GBM[Glioblastoma multiforme], 6; Glioma Low Grade, 7; HNSC[Head and Neck squamous cell carcinoma], 8; KICH[Kidney Chromophobe], 9; KIRC[Kidney renal clear cell carcinoma], 10; KIRP[Kidney renal papillary cell carcinoma], 11; LAML[Acute Myeloid Leukemia], 12; LUAD[Lung adenocarcinoma], 13; LUSC[Lung squamous cell carcinoma], 14; OV[Ovarian serous cystadenocarcinoma ], 15; PAAD[Pancreatic adenocarcinoma], 16; PRAD[Prostate adenocarcinoma], 17; SKCM[Skin Cutaneous Melanoma], 18:STAD[Stomach adenocarcinoma], 19:THCA[Thyroid carcinoma], 20:UCEC[Uterine Corpus Endometrial Carcinoma]) |
| Top |
| * We represented just top 10 SNVs. When you move the cursor on each content, you can see more deailed mutation information on the Tooltip. Those are primary_site, primary_histology, mutation(aa), pubmedID. |
| Genomic Position | Mutation(aa) | Unique sampleID count |
| chr10:1087328 | p.A259A | 1 |
| chr10:1088638 | p.I256T | 1 |
| chr10:1088646 | p.P222H | 1 |
| chr10:1089276 | p.L218F | 1 |
| chr10:1089294 | p.D157D | 1 |
| chr10:1089327 | p.E155K | 1 |
| chr10:1089329 | p.L124R | 1 |
| chr10:1090086 | p.T118I | 1 |
| chr10:1087205 | p.L107S | 1 |
| chr10:1090107 | p.L106F | 1 |
| * Copy number data were extracted from TCGA using R package TCGA-Assembler. The URLs of all public data files on TCGA DCC data server were gathered on Jan-05-2015. Function ProcessCNAData in TCGA-Assembler package was used to obtain gene-level copy number value which is calculated as the average copy number of the genomic region of a gene. |
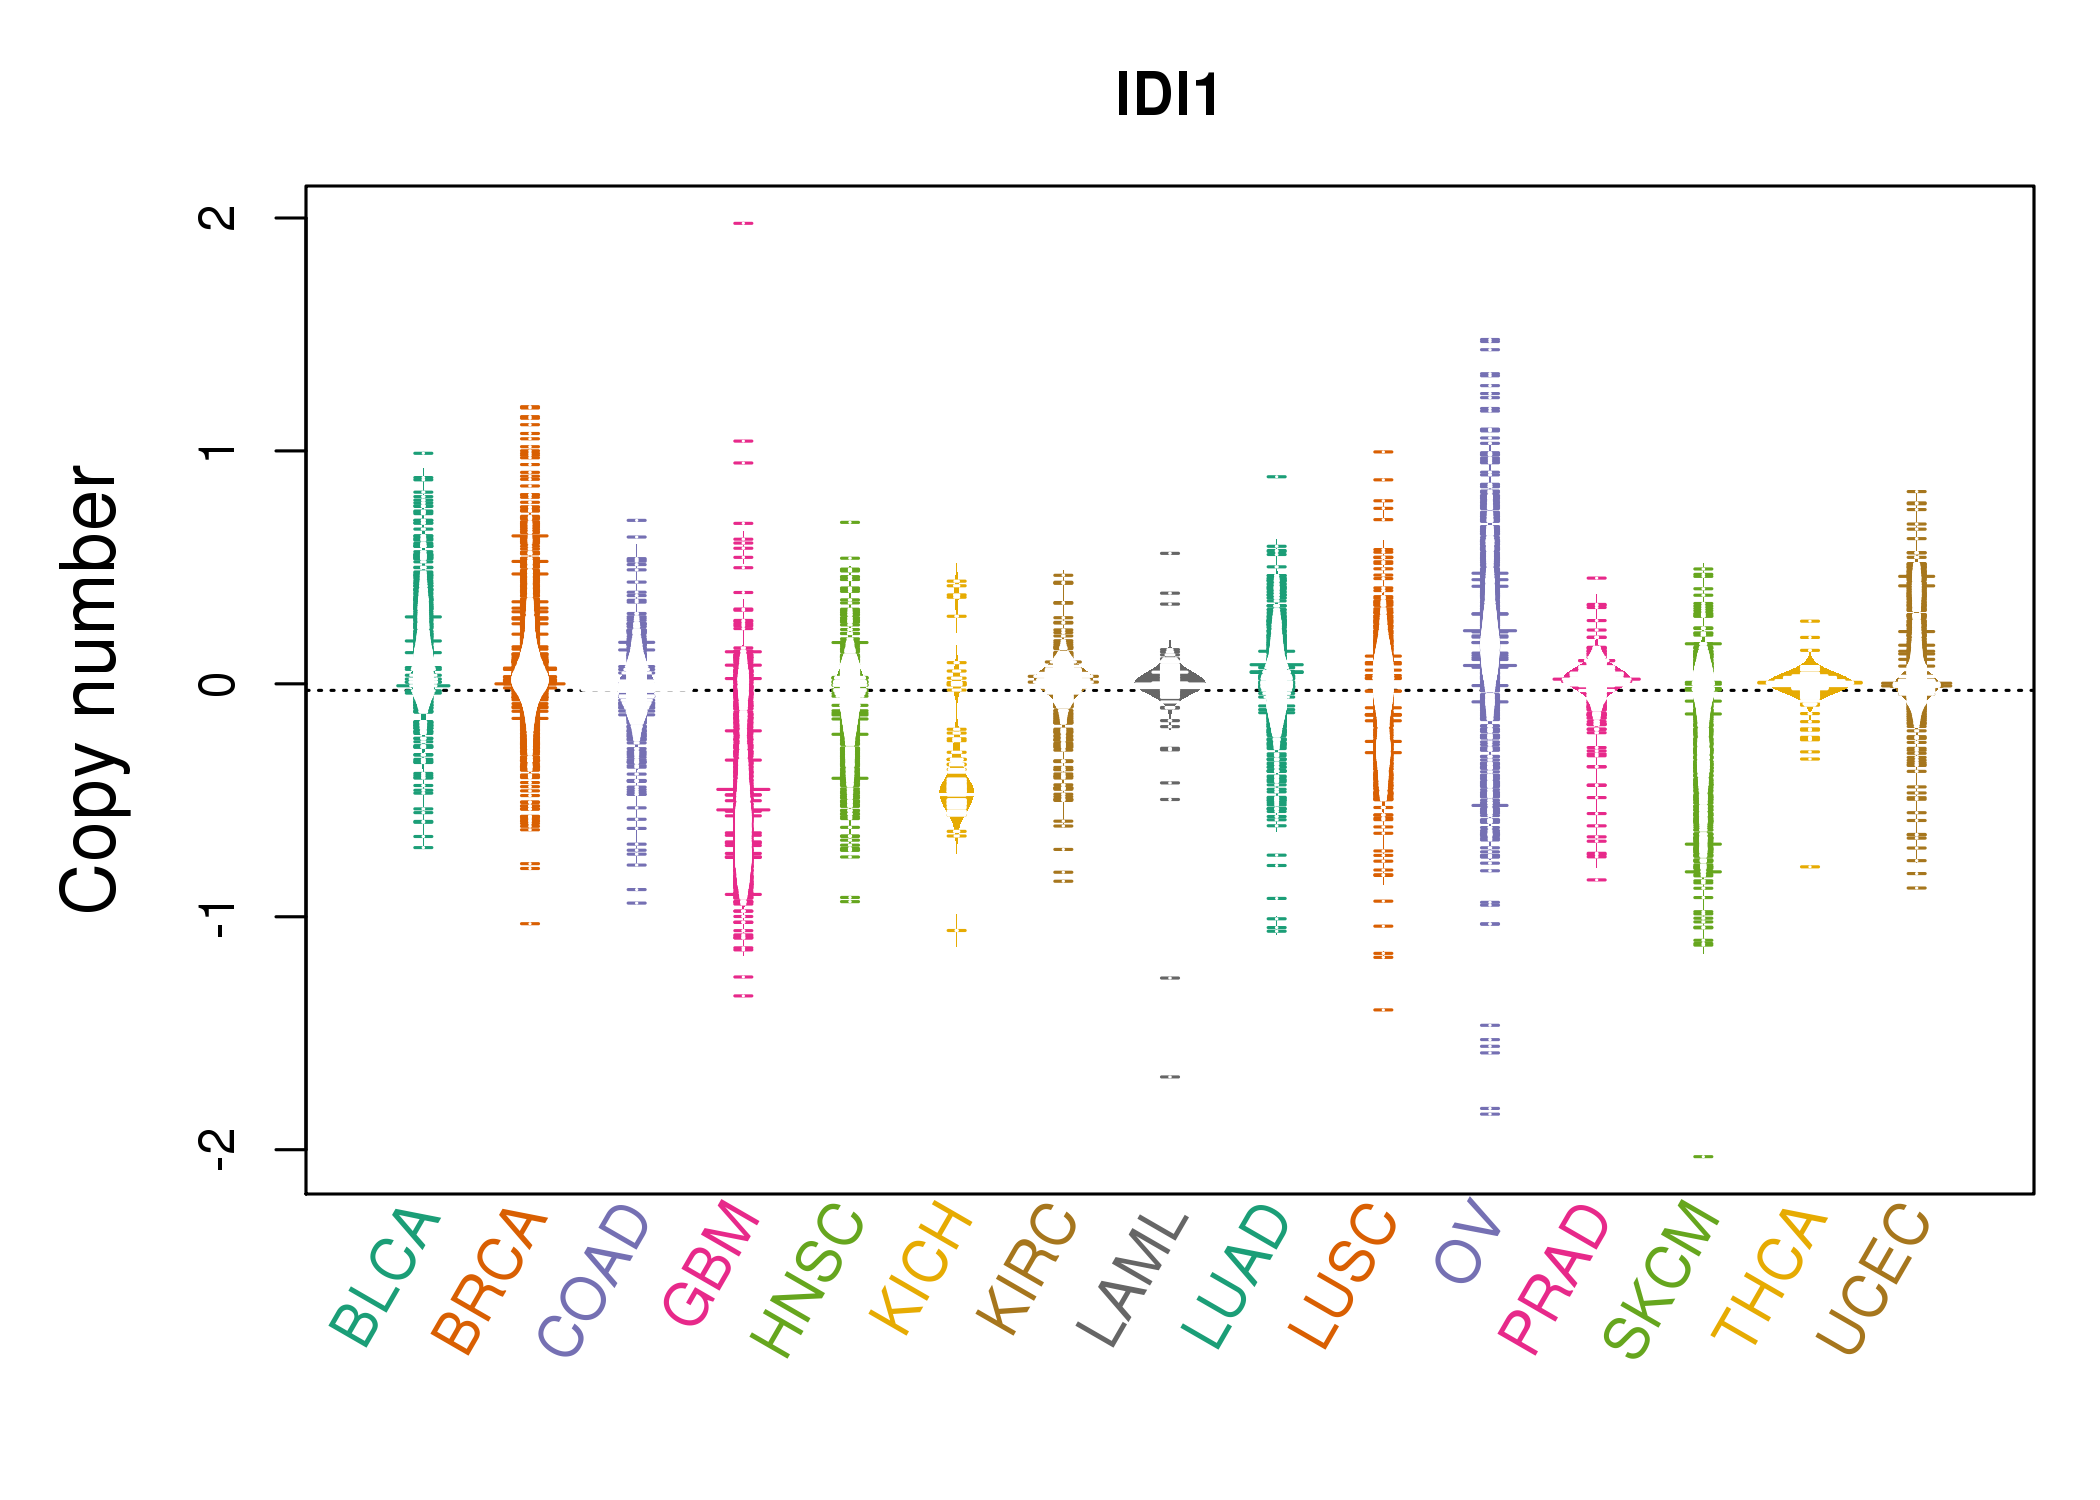 |
| cf) Tissue ID[Tissue type]: BLCA[Bladder Urothelial Carcinoma], BRCA[Breast invasive carcinoma], CESC[Cervical squamous cell carcinoma and endocervical adenocarcinoma], COAD[Colon adenocarcinoma], GBM[Glioblastoma multiforme], Glioma Low Grade, HNSC[Head and Neck squamous cell carcinoma], KICH[Kidney Chromophobe], KIRC[Kidney renal clear cell carcinoma], KIRP[Kidney renal papillary cell carcinoma], LAML[Acute Myeloid Leukemia], LUAD[Lung adenocarcinoma], LUSC[Lung squamous cell carcinoma], OV[Ovarian serous cystadenocarcinoma ], PAAD[Pancreatic adenocarcinoma], PRAD[Prostate adenocarcinoma], SKCM[Skin Cutaneous Melanoma], STAD[Stomach adenocarcinoma], THCA[Thyroid carcinoma], UCEC[Uterine Corpus Endometrial Carcinoma] |
| Top |
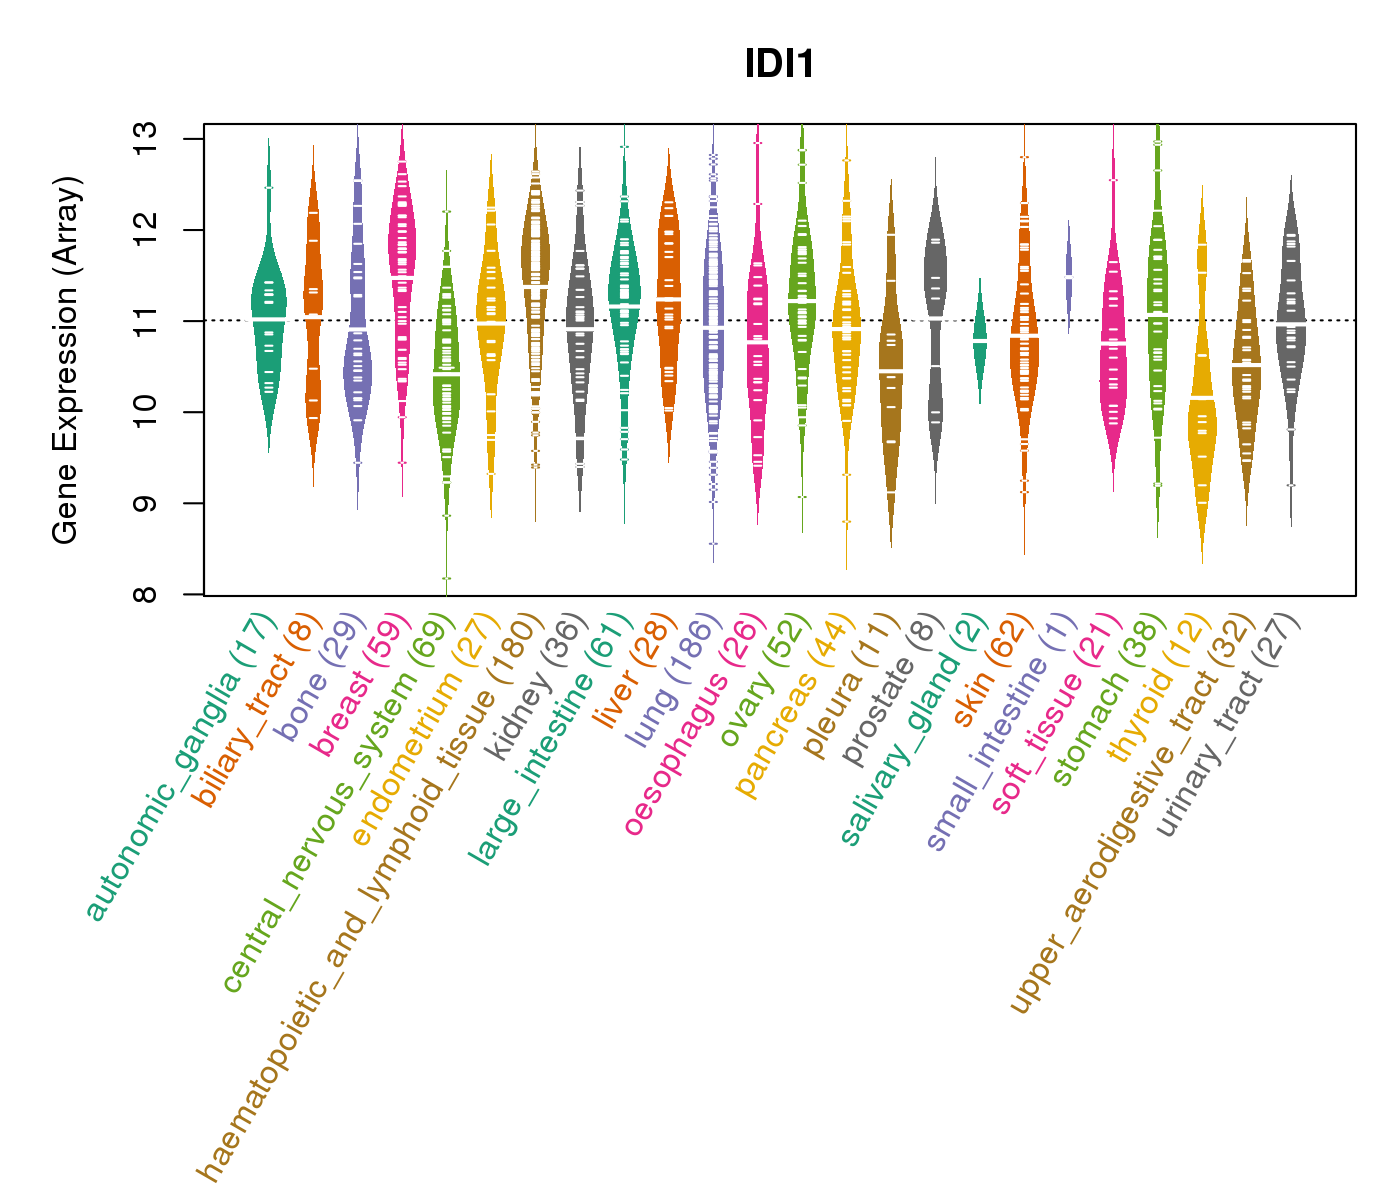
| Gene Expression for IDI1 |
| * CCLE gene expression data were extracted from CCLE_Expression_Entrez_2012-10-18.res: Gene-centric RMA-normalized mRNA expression data. |
 |
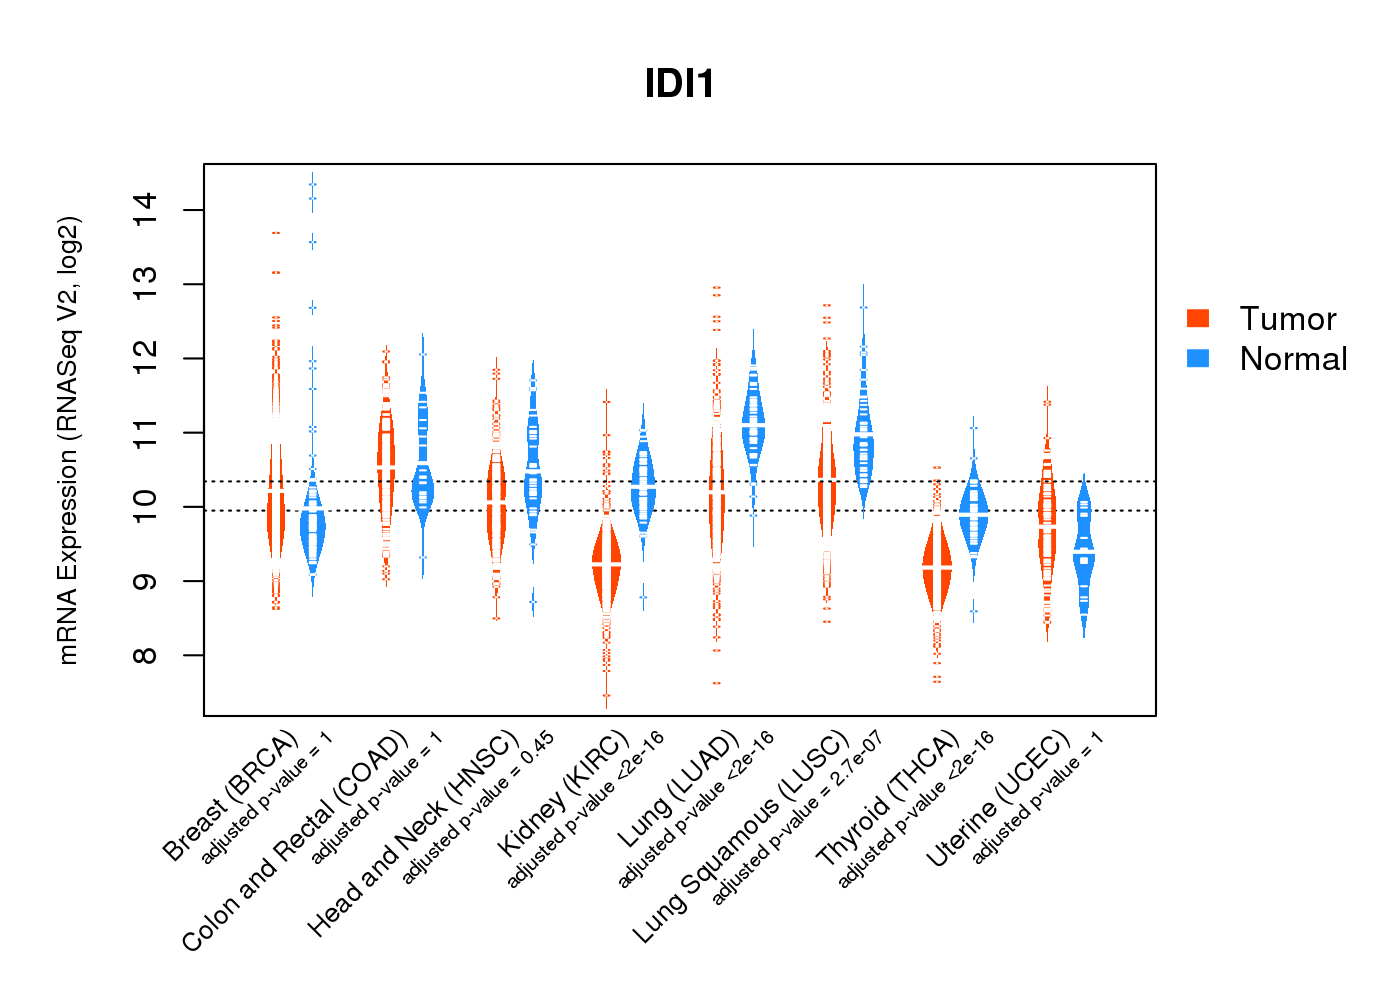
| * Normalized gene expression data of RNASeqV2 was extracted from TCGA using R package TCGA-Assembler. The URLs of all public data files on TCGA DCC data server were gathered at Jan-05-2015. Only eight cancer types have enough normal control samples for differential expression analysis. (t test, adjusted p<0.05 (using Benjamini-Hochberg FDR)) |
 |
| Top |
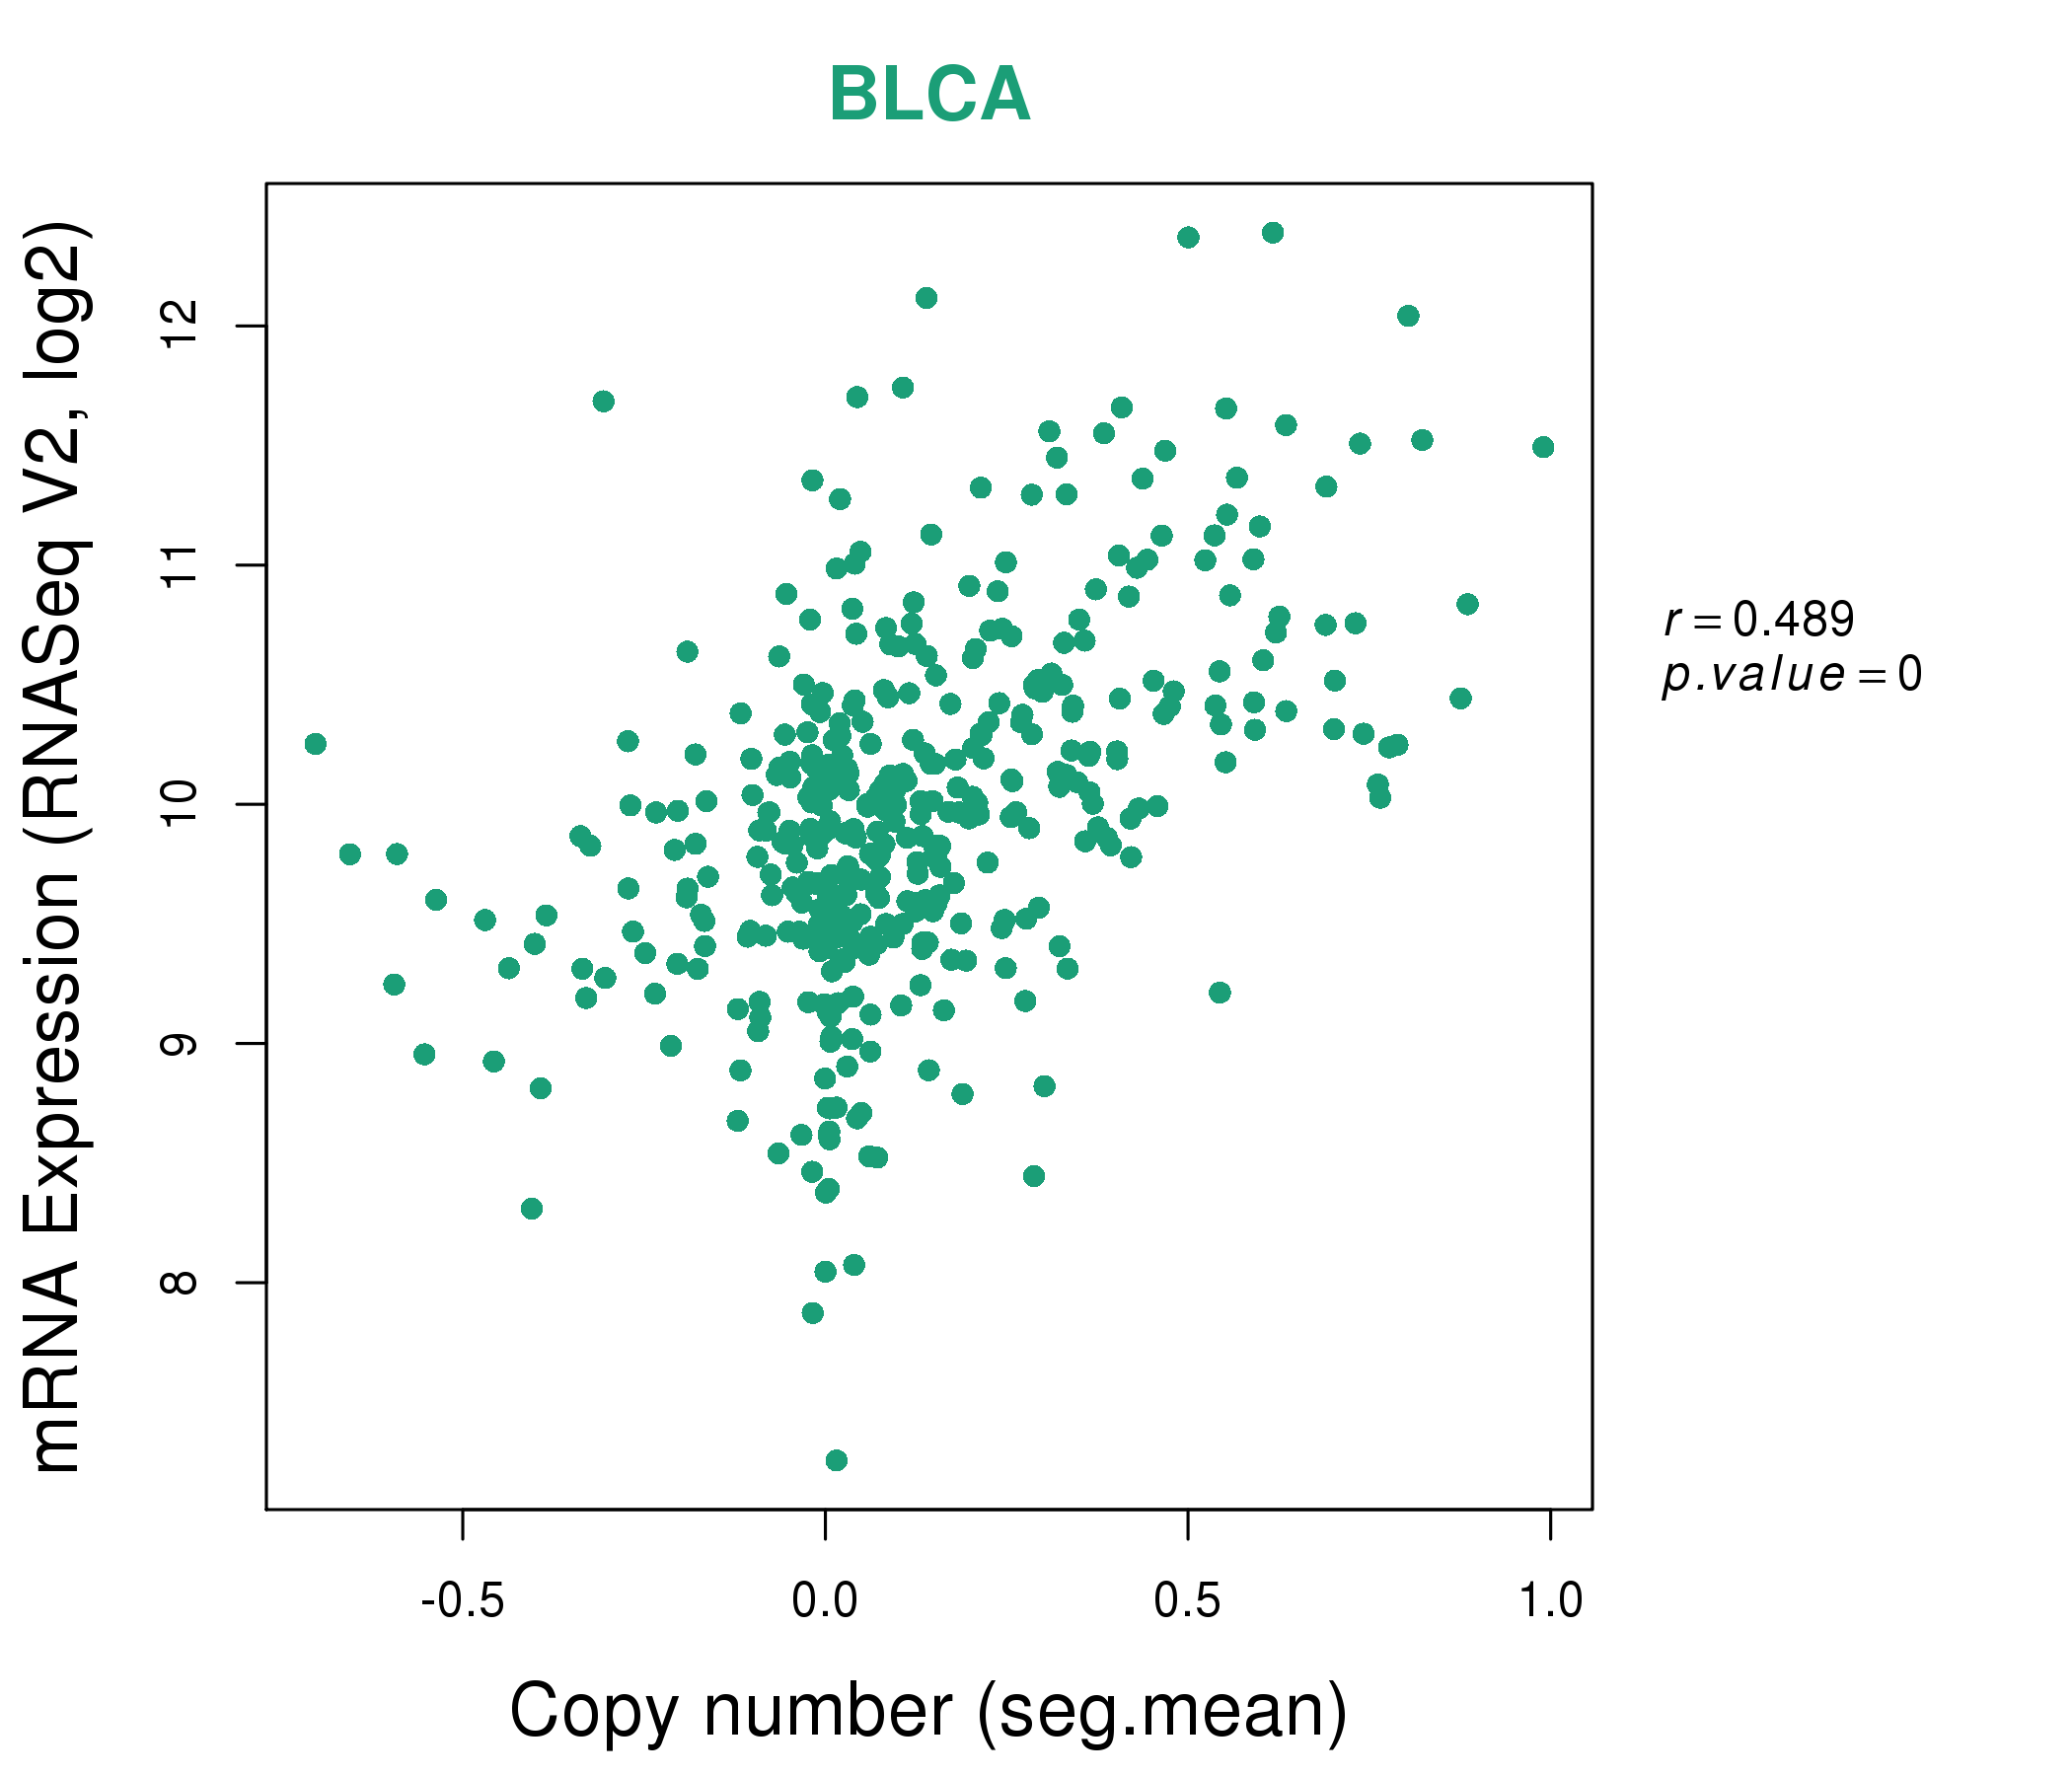
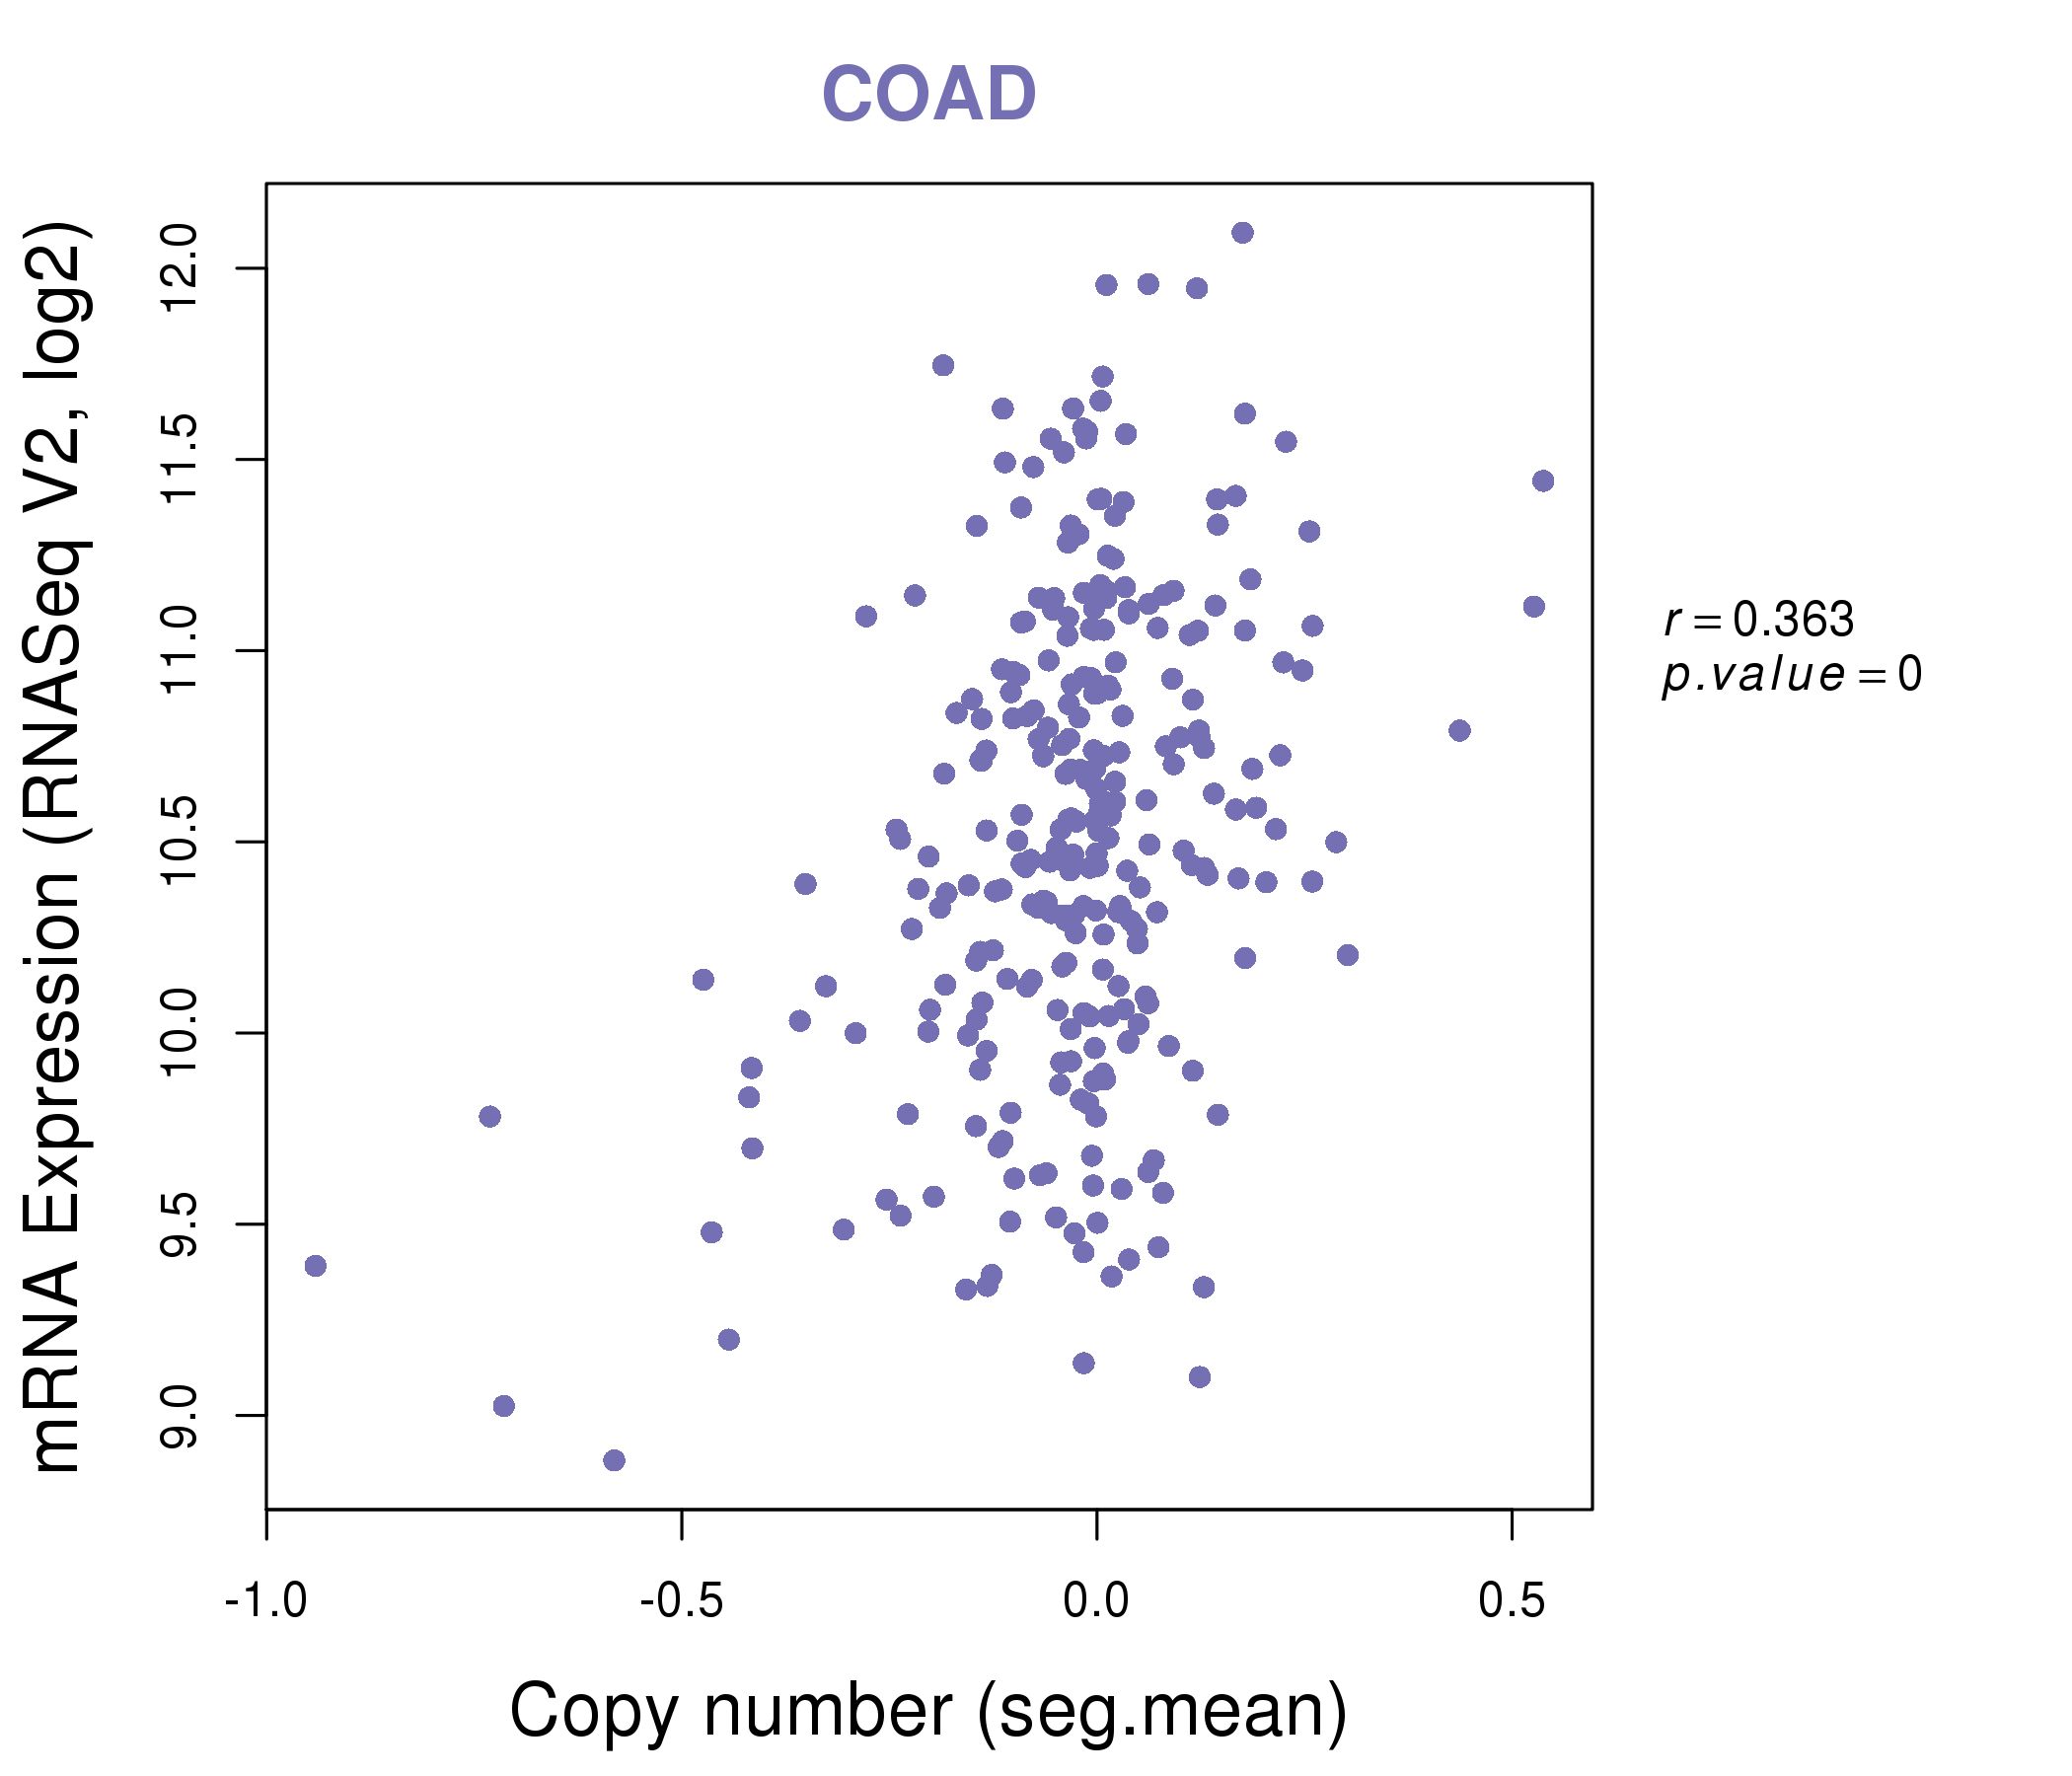
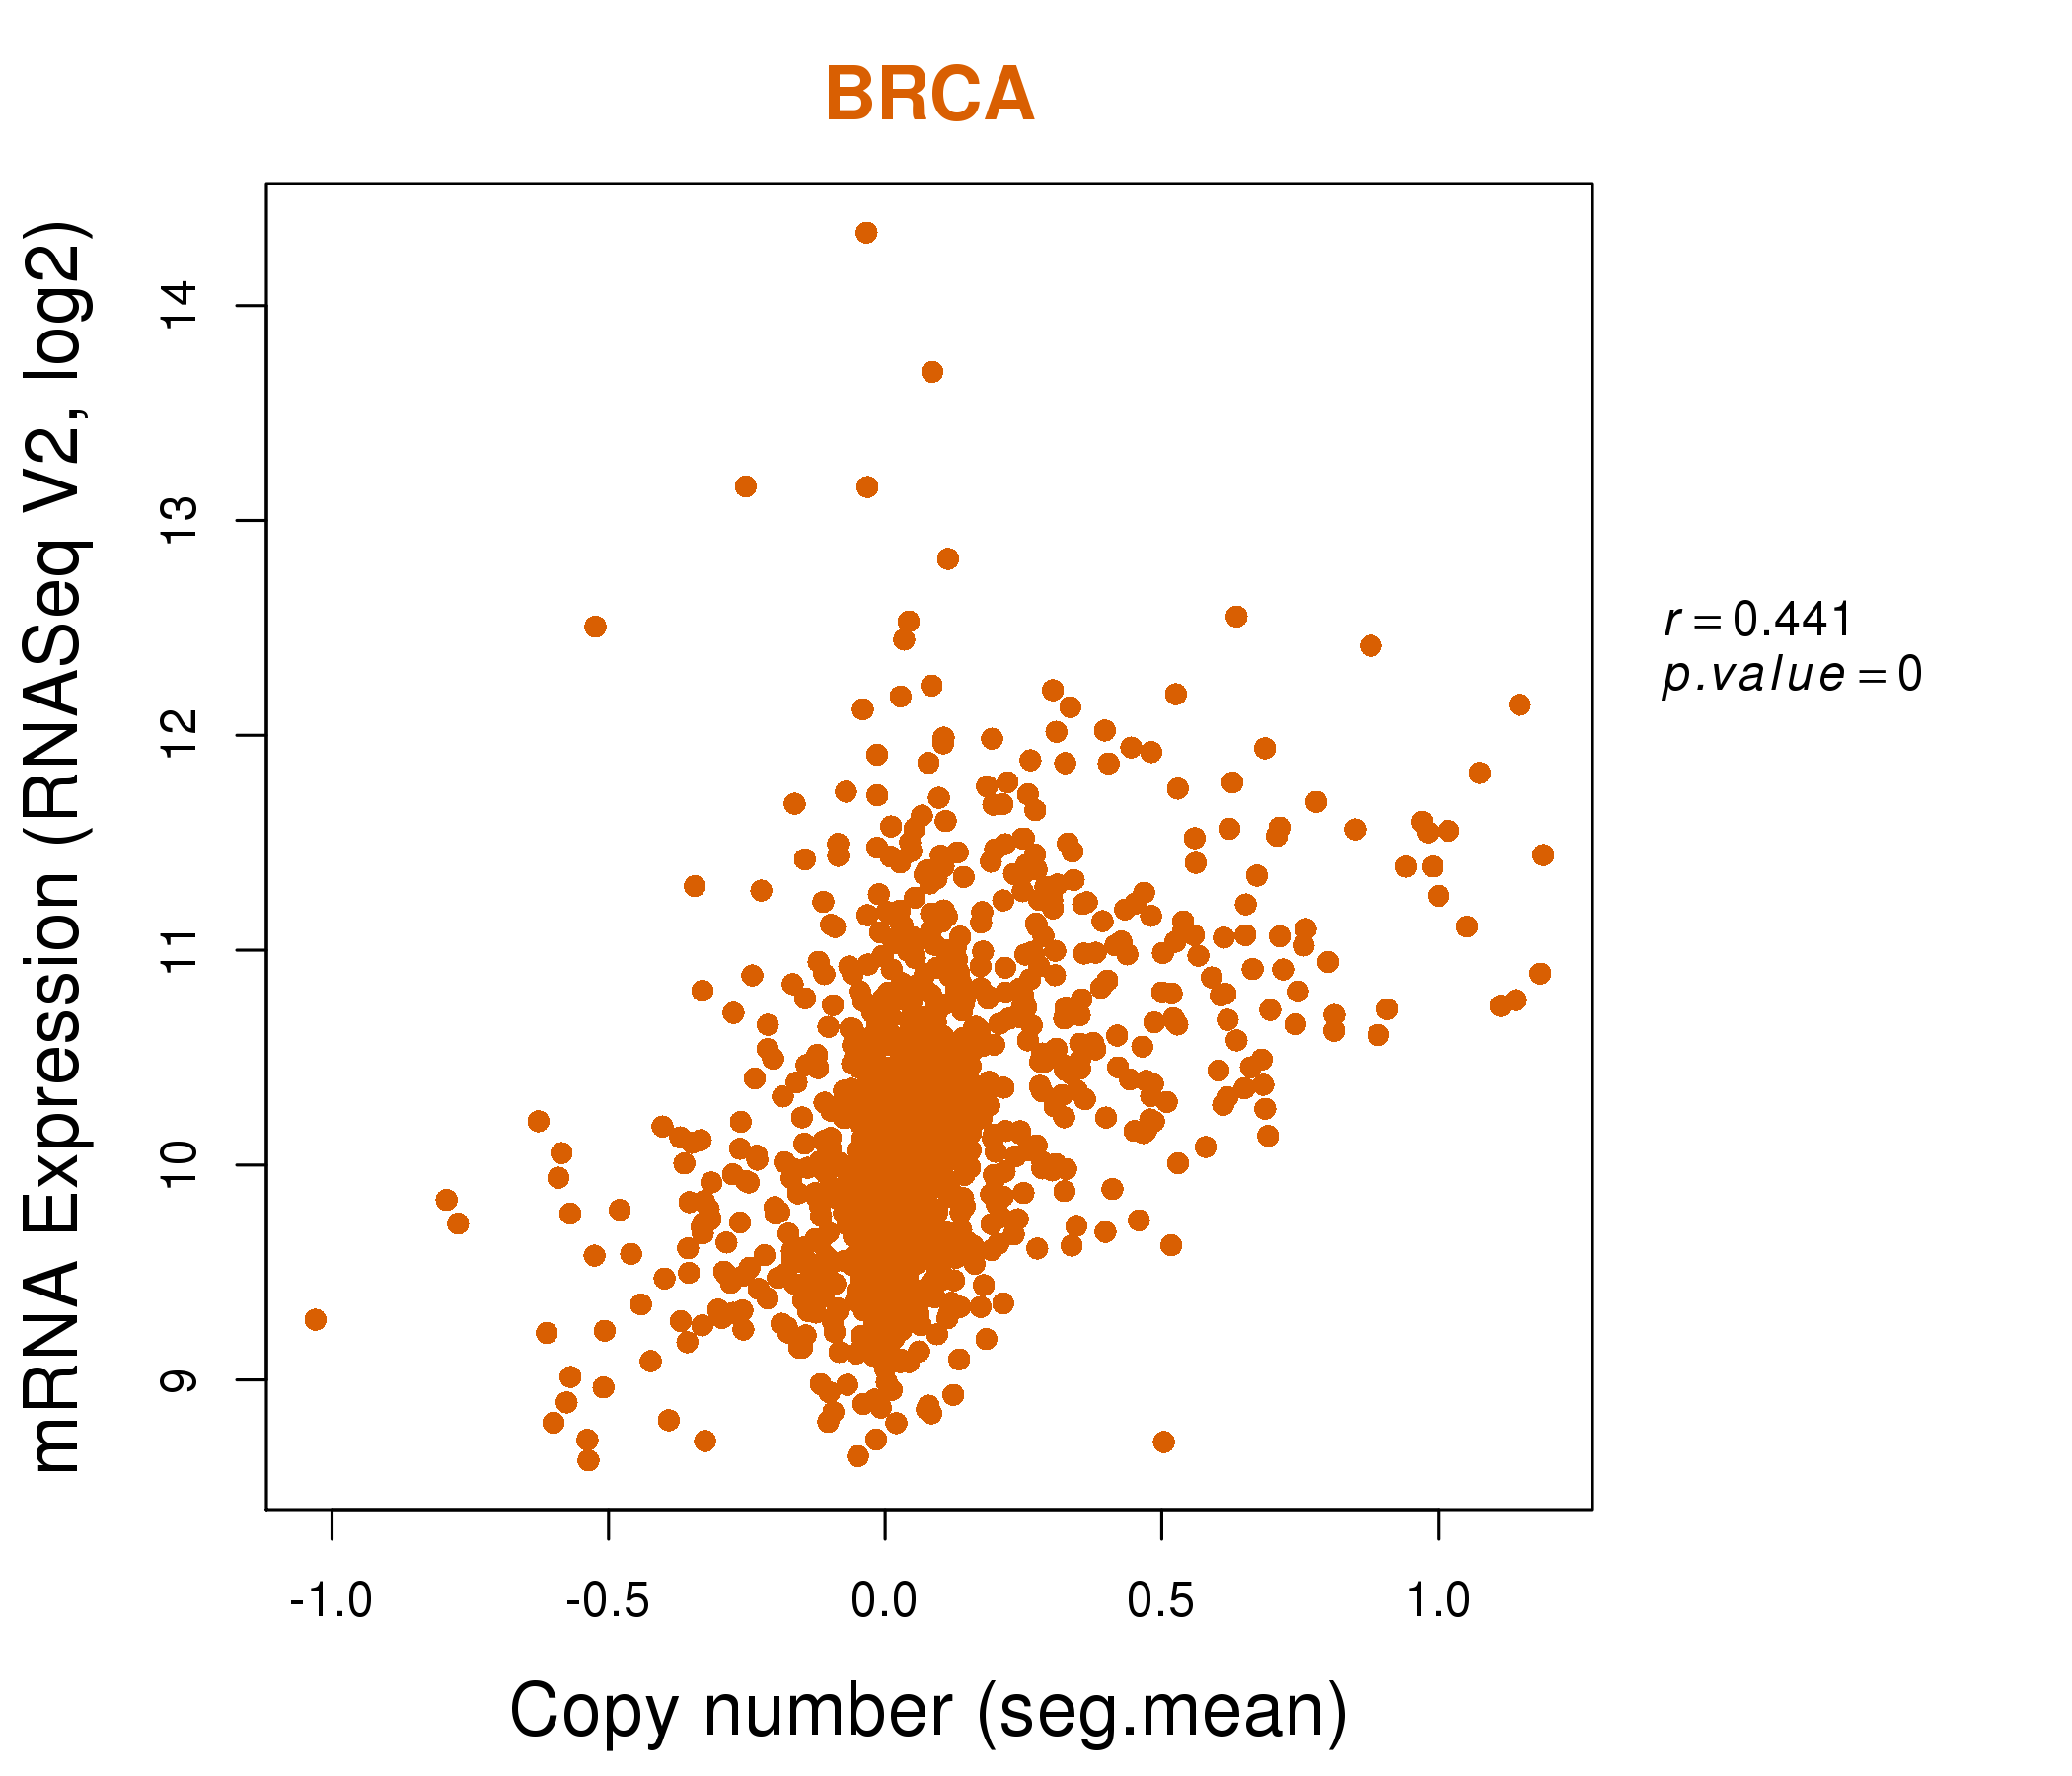
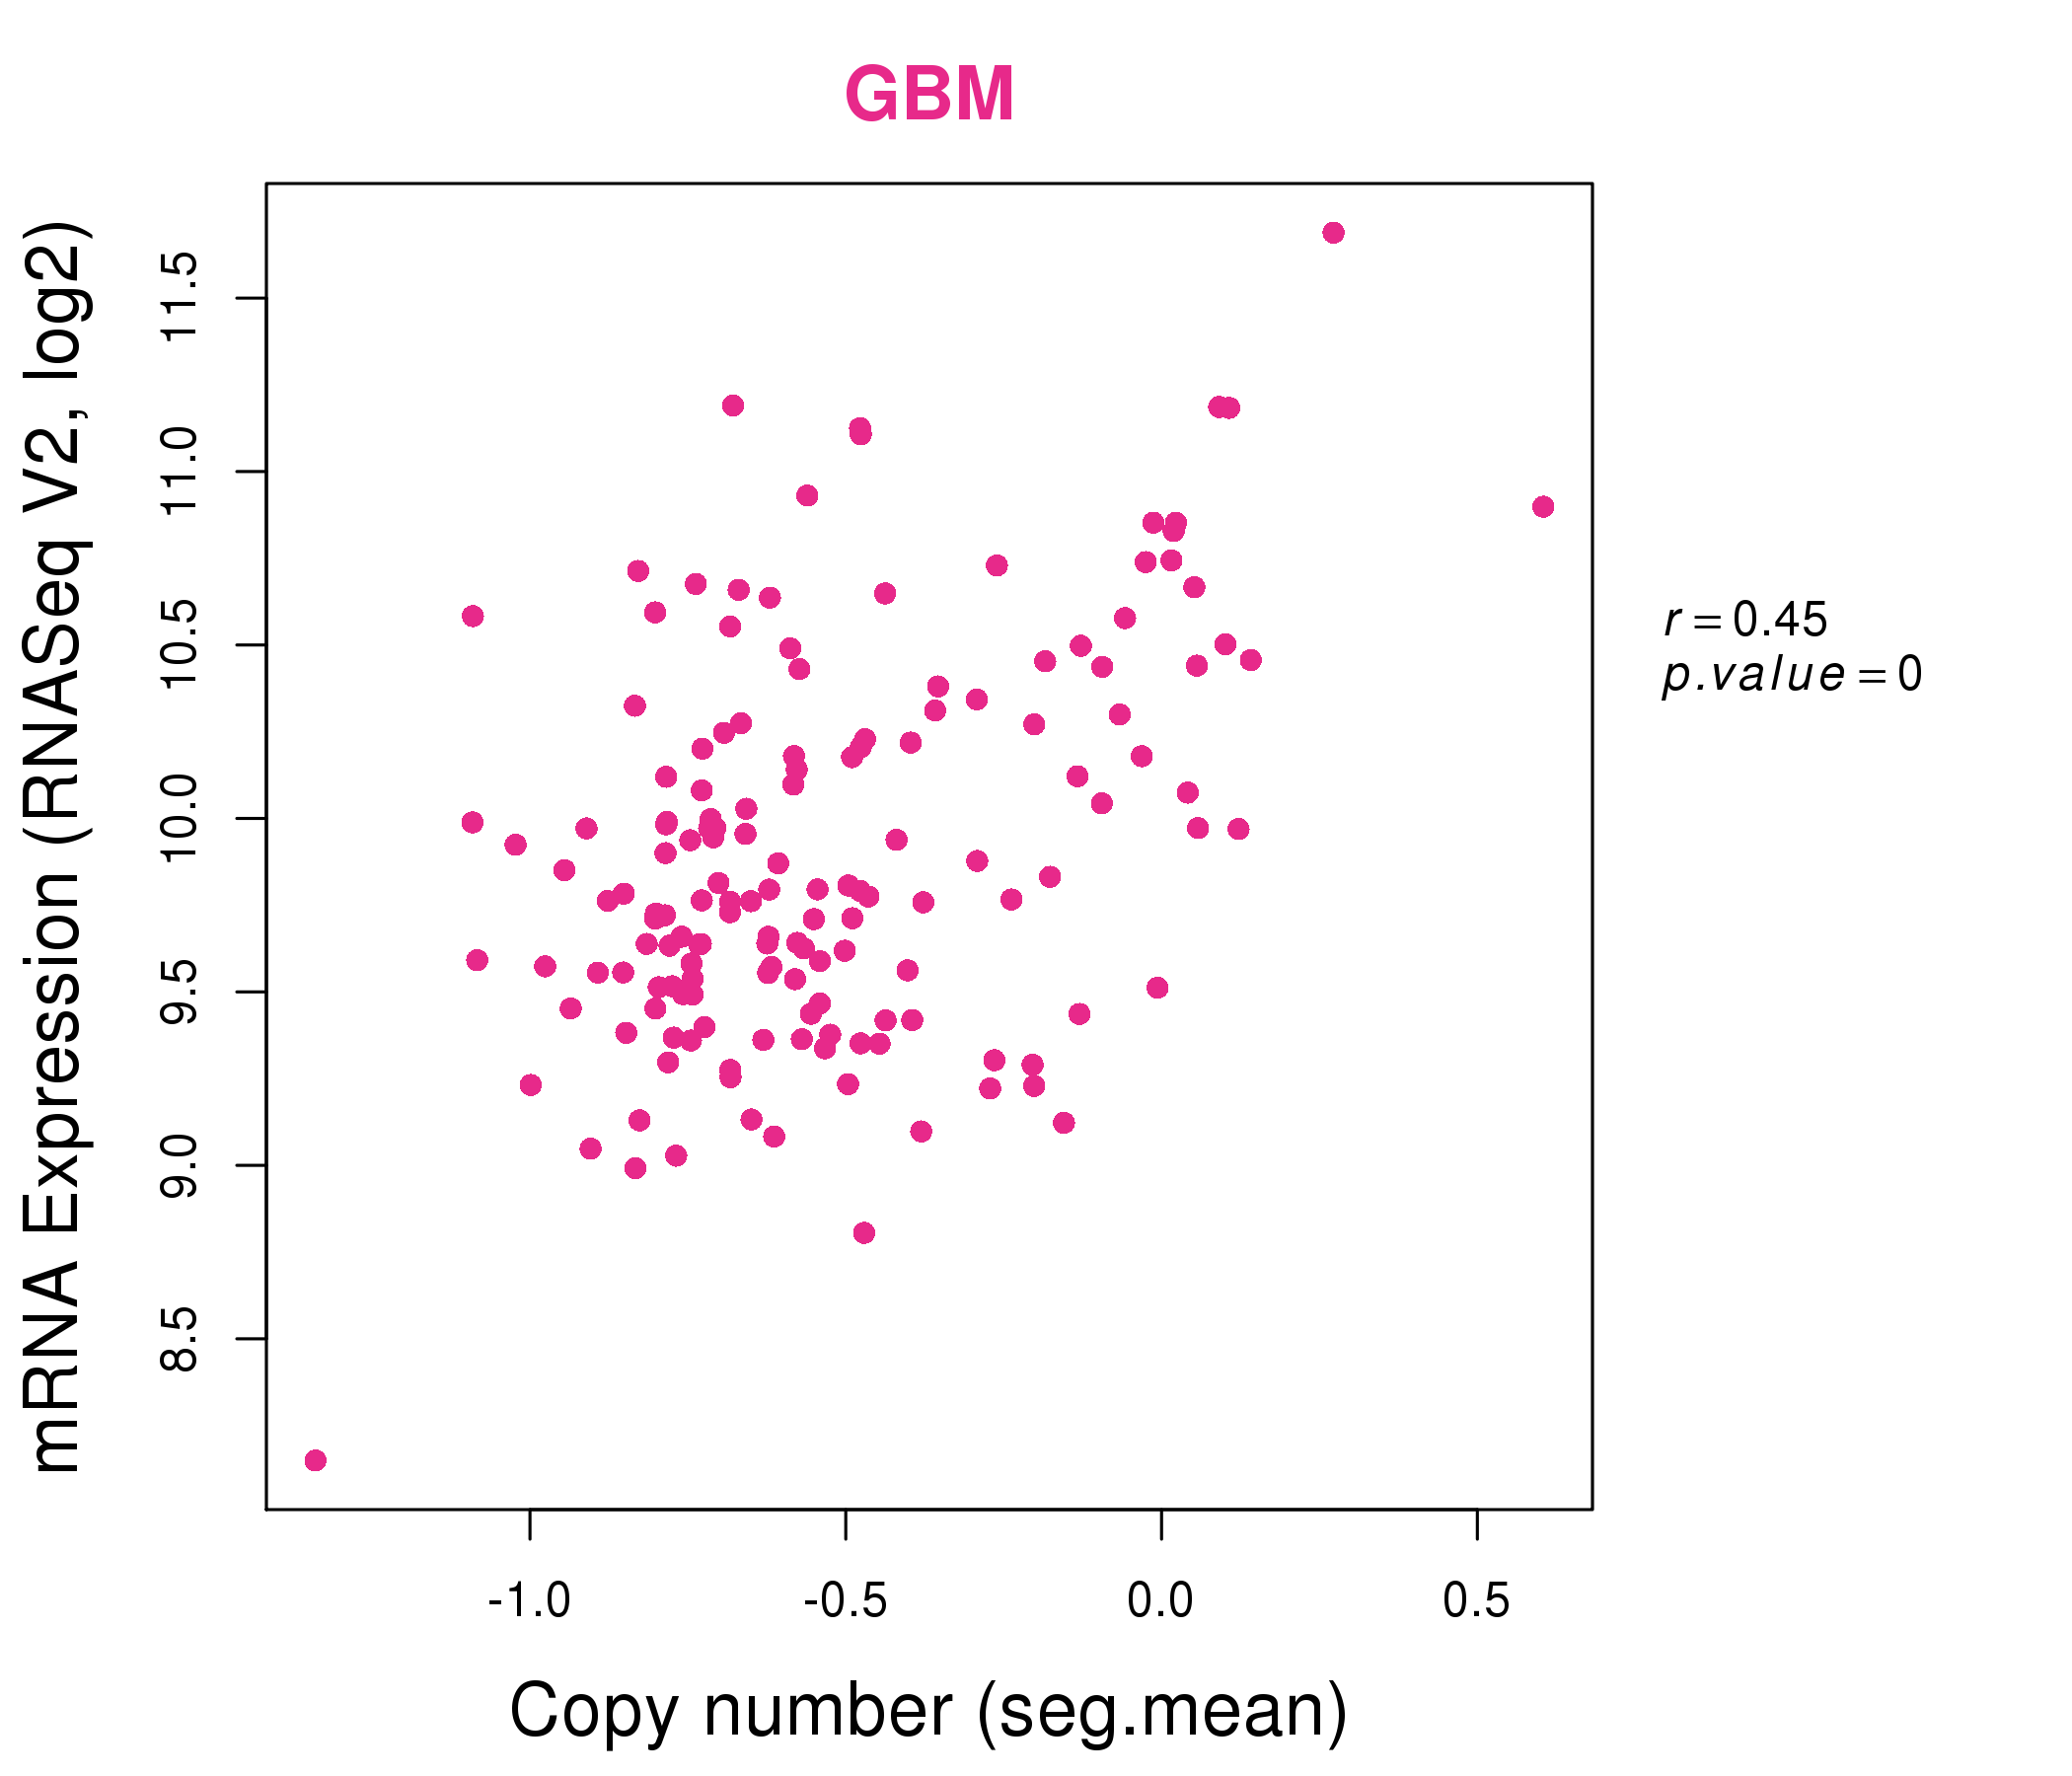
| * This plots show the correlation between CNV and gene expression. |
: Open all plots for all cancer types
 |
|
 |
|
| Top |
| Gene-Gene Network Information |
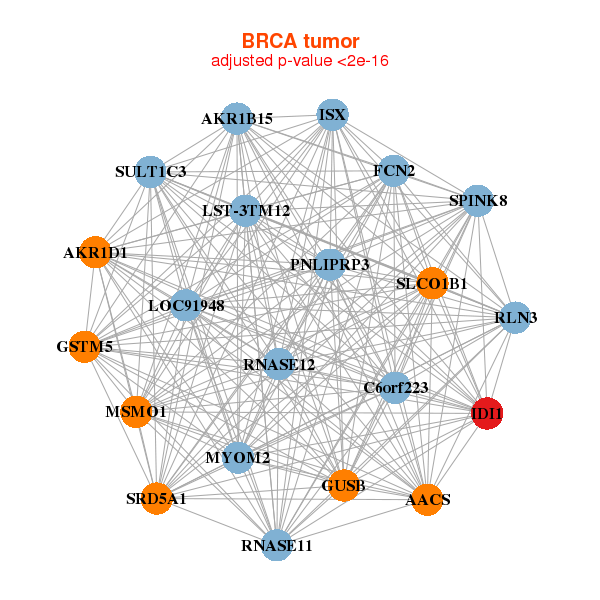
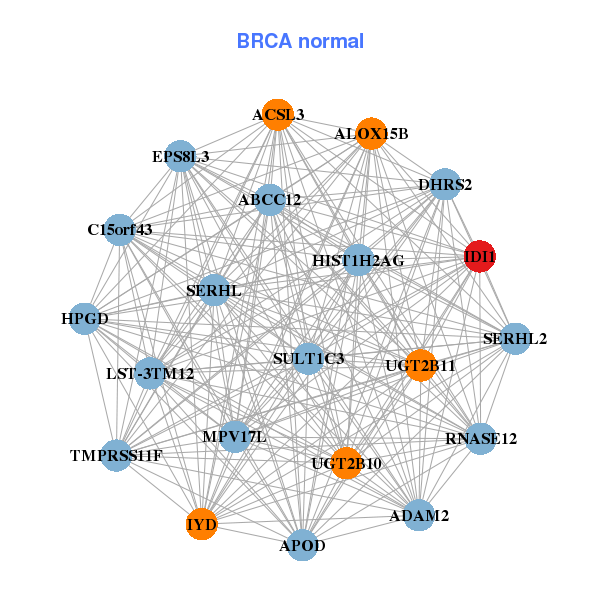
| * Co-Expression network figures were drawn using R package igraph. Only the top 20 genes with the highest correlations were shown. Red circle: input gene, orange circle: cell metabolism gene, sky circle: other gene |
: Open all plots for all cancer types
 |
| ||||
| AACS,AKR1B15,AKR1D1,C6orf223,FCN2,GSTM5,GUSB, IDI1,ISX,LOC91948,LST-3TM12,MYOM2,PNLIPRP3,RLN3, RNASE11,RNASE12,MSMO1,SLCO1B1,SPINK8,SRD5A1,SULT1C3 | ABCC12,ACSL3,ADAM2,ALOX15B,APOD,C15orf43,DHRS2, EPS8L3,HIST1H2AG,HPGD,IDI1,IYD,LST-3TM12,MPV17L, RNASE12,SERHL2,SERHL,SULT1C3,TMPRSS11F,UGT2B10,UGT2B11 | ||||
 |
| ||||
| ACAT2,ATP5C1,CYP51A1,DBI,DHCR24,DHCR7,EBP, FDPS,GHITM,HMGCR,HMGCS1,HSD17B7,HSPA14,IDH1, IDI1,INSIG1,MVD,PDCD10,MSMO1,SC5D,STARD4 | ACAT2,C14orf1,DNAJA1,EBP,ELOVL6,FDFT1,FDPS, HMGCS1,HSD17B7,IDI1,INSIG1,MVK,NSDHL,PLA2G3, PPA1,PRND,PSMA3,RDH11,MSMO1,SC5D,STARD4 |

| * Co-Expression network figures were drawn using R package igraph. Only the top 20 genes with the highest correlations were shown. Red circle: input gene, orange circle: cell metabolism gene, sky circle: other gene |
: Open all plots for all cancer types
| Top |
: Open all interacting genes' information including KEGG pathway for all interacting genes from DAVID
| Top |
| Pharmacological Information for IDI1 |
| DB Category | DB Name | DB's ID and Url link |
| * Gene Centered Interaction Network. |
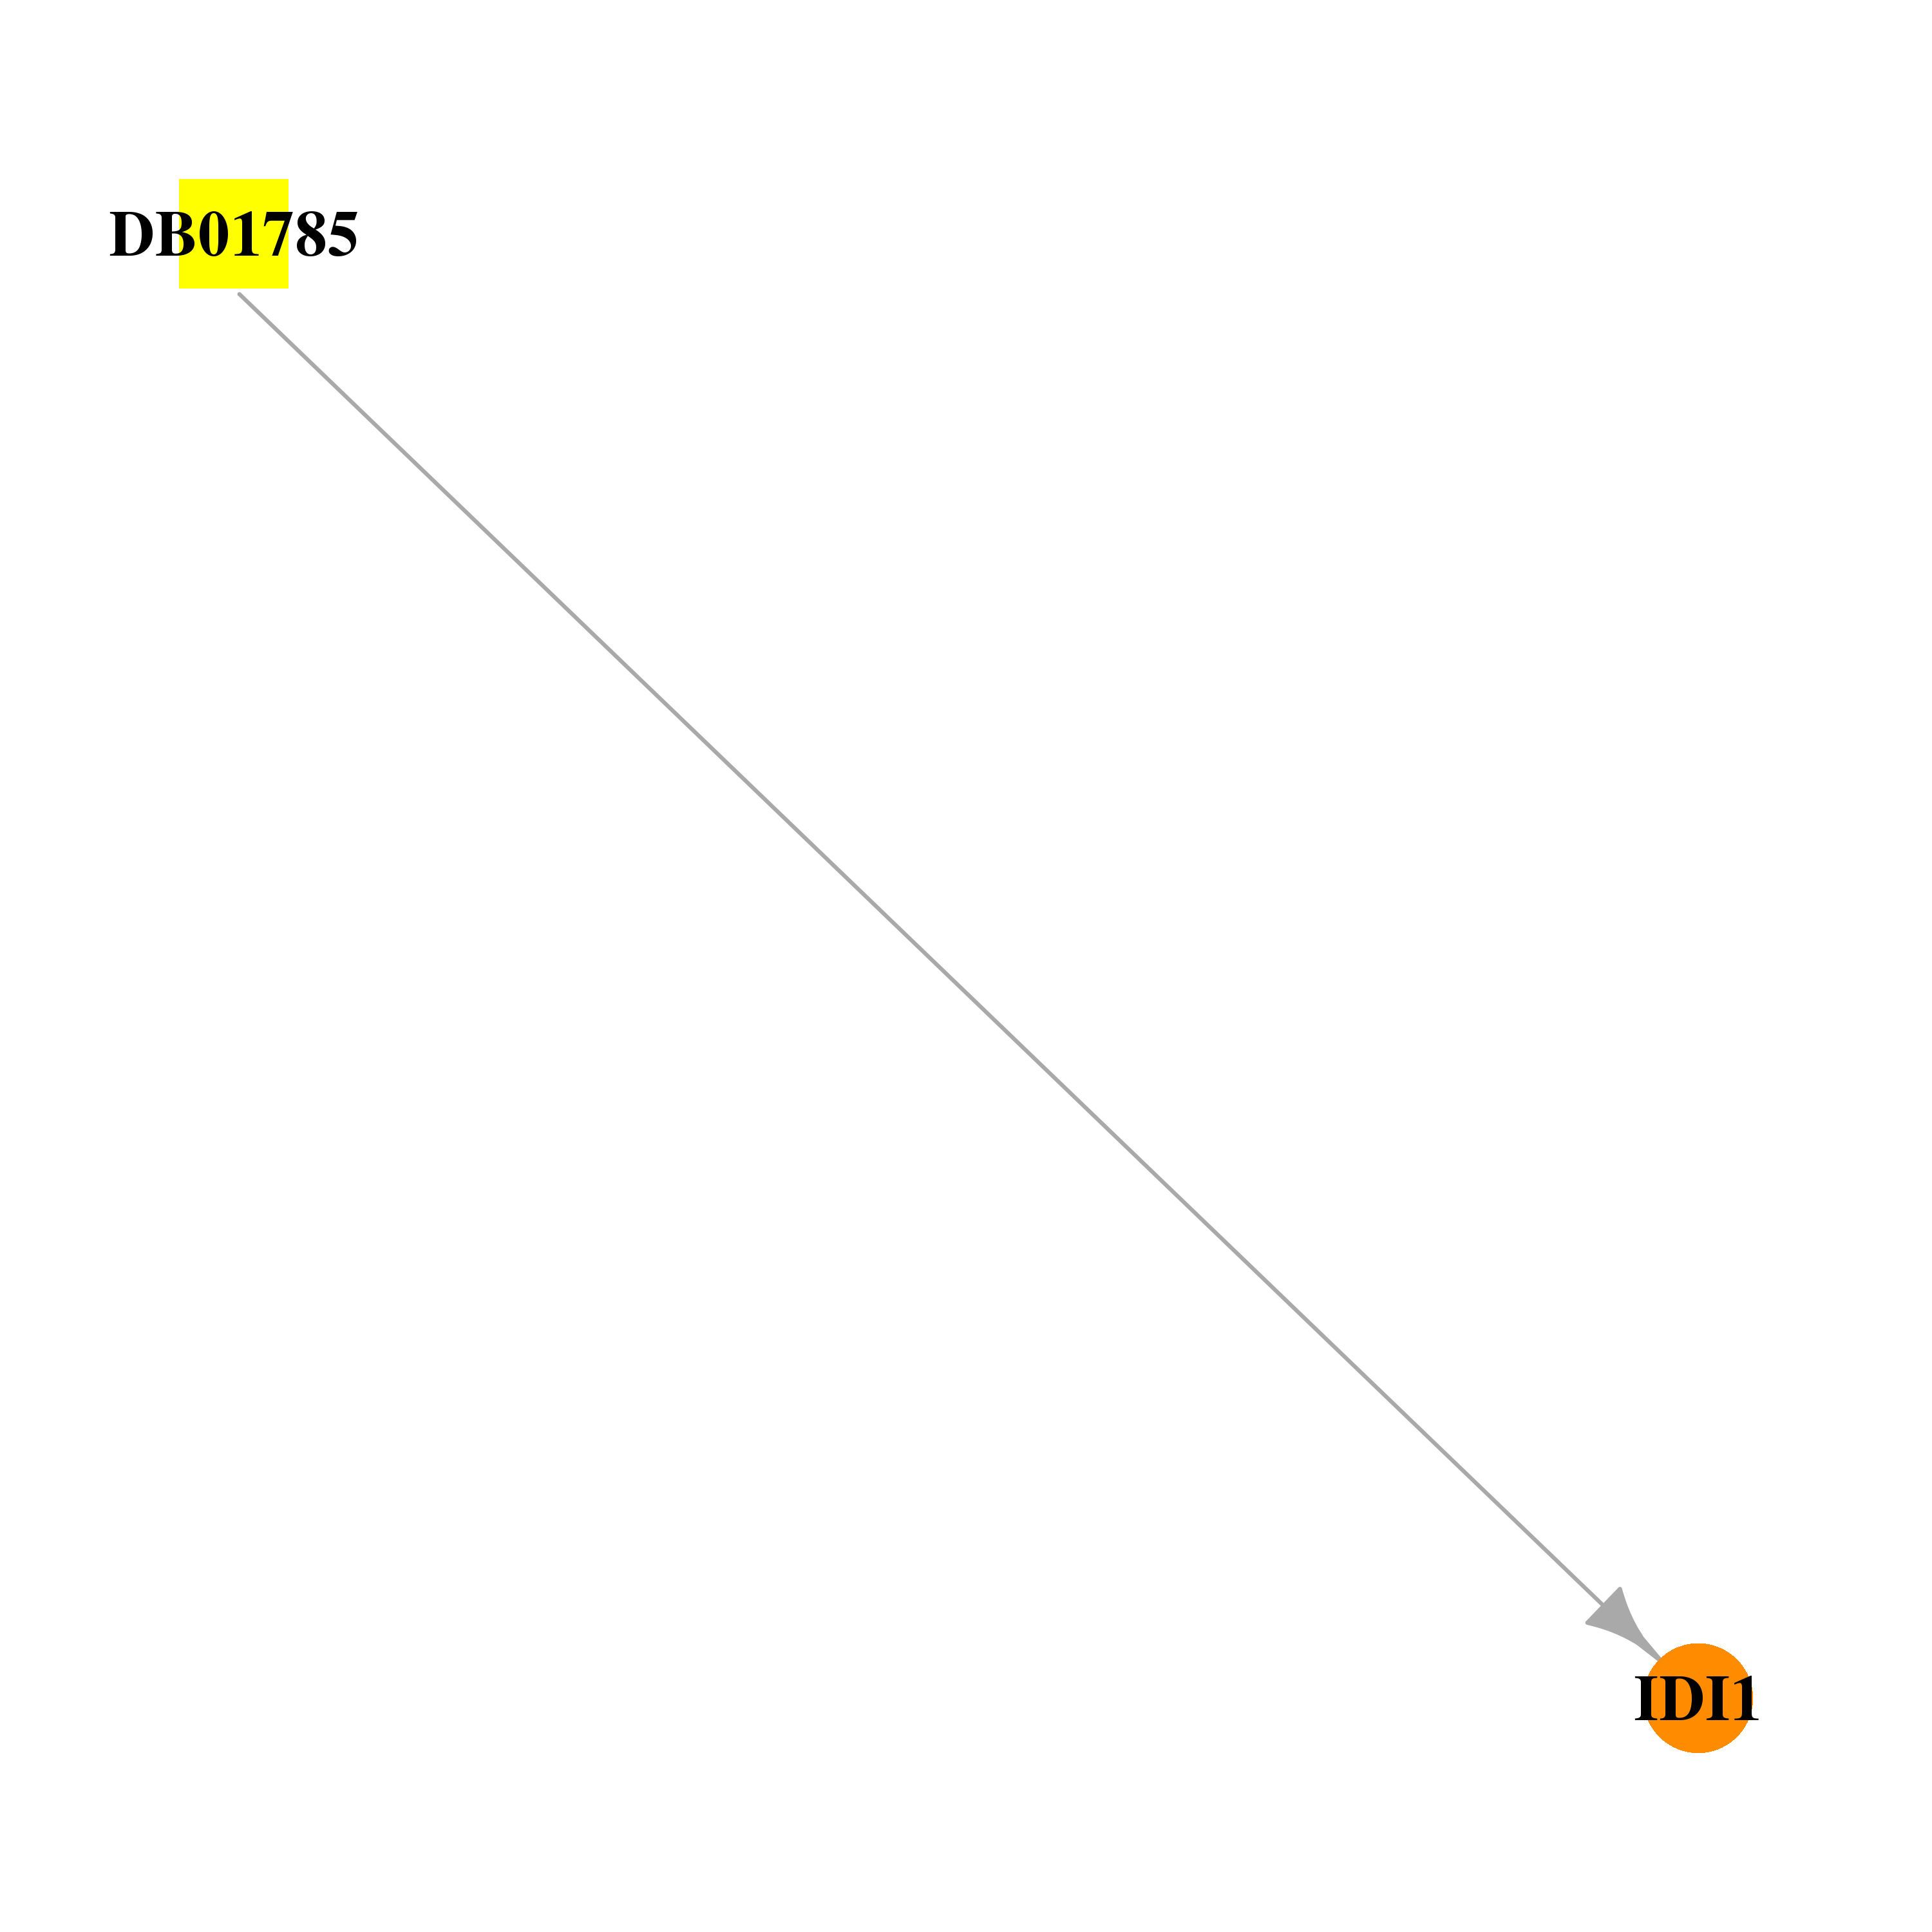 |
| * Drug Centered Interaction Network. |
| DrugBank ID | Target Name | Drug Groups | Generic Name | Drug Centered Network | Drug Structure |
| DB01785 | isopentenyl-diphosphate delta isomerase 1 | experimental | Dimethylallyl Diphosphate | 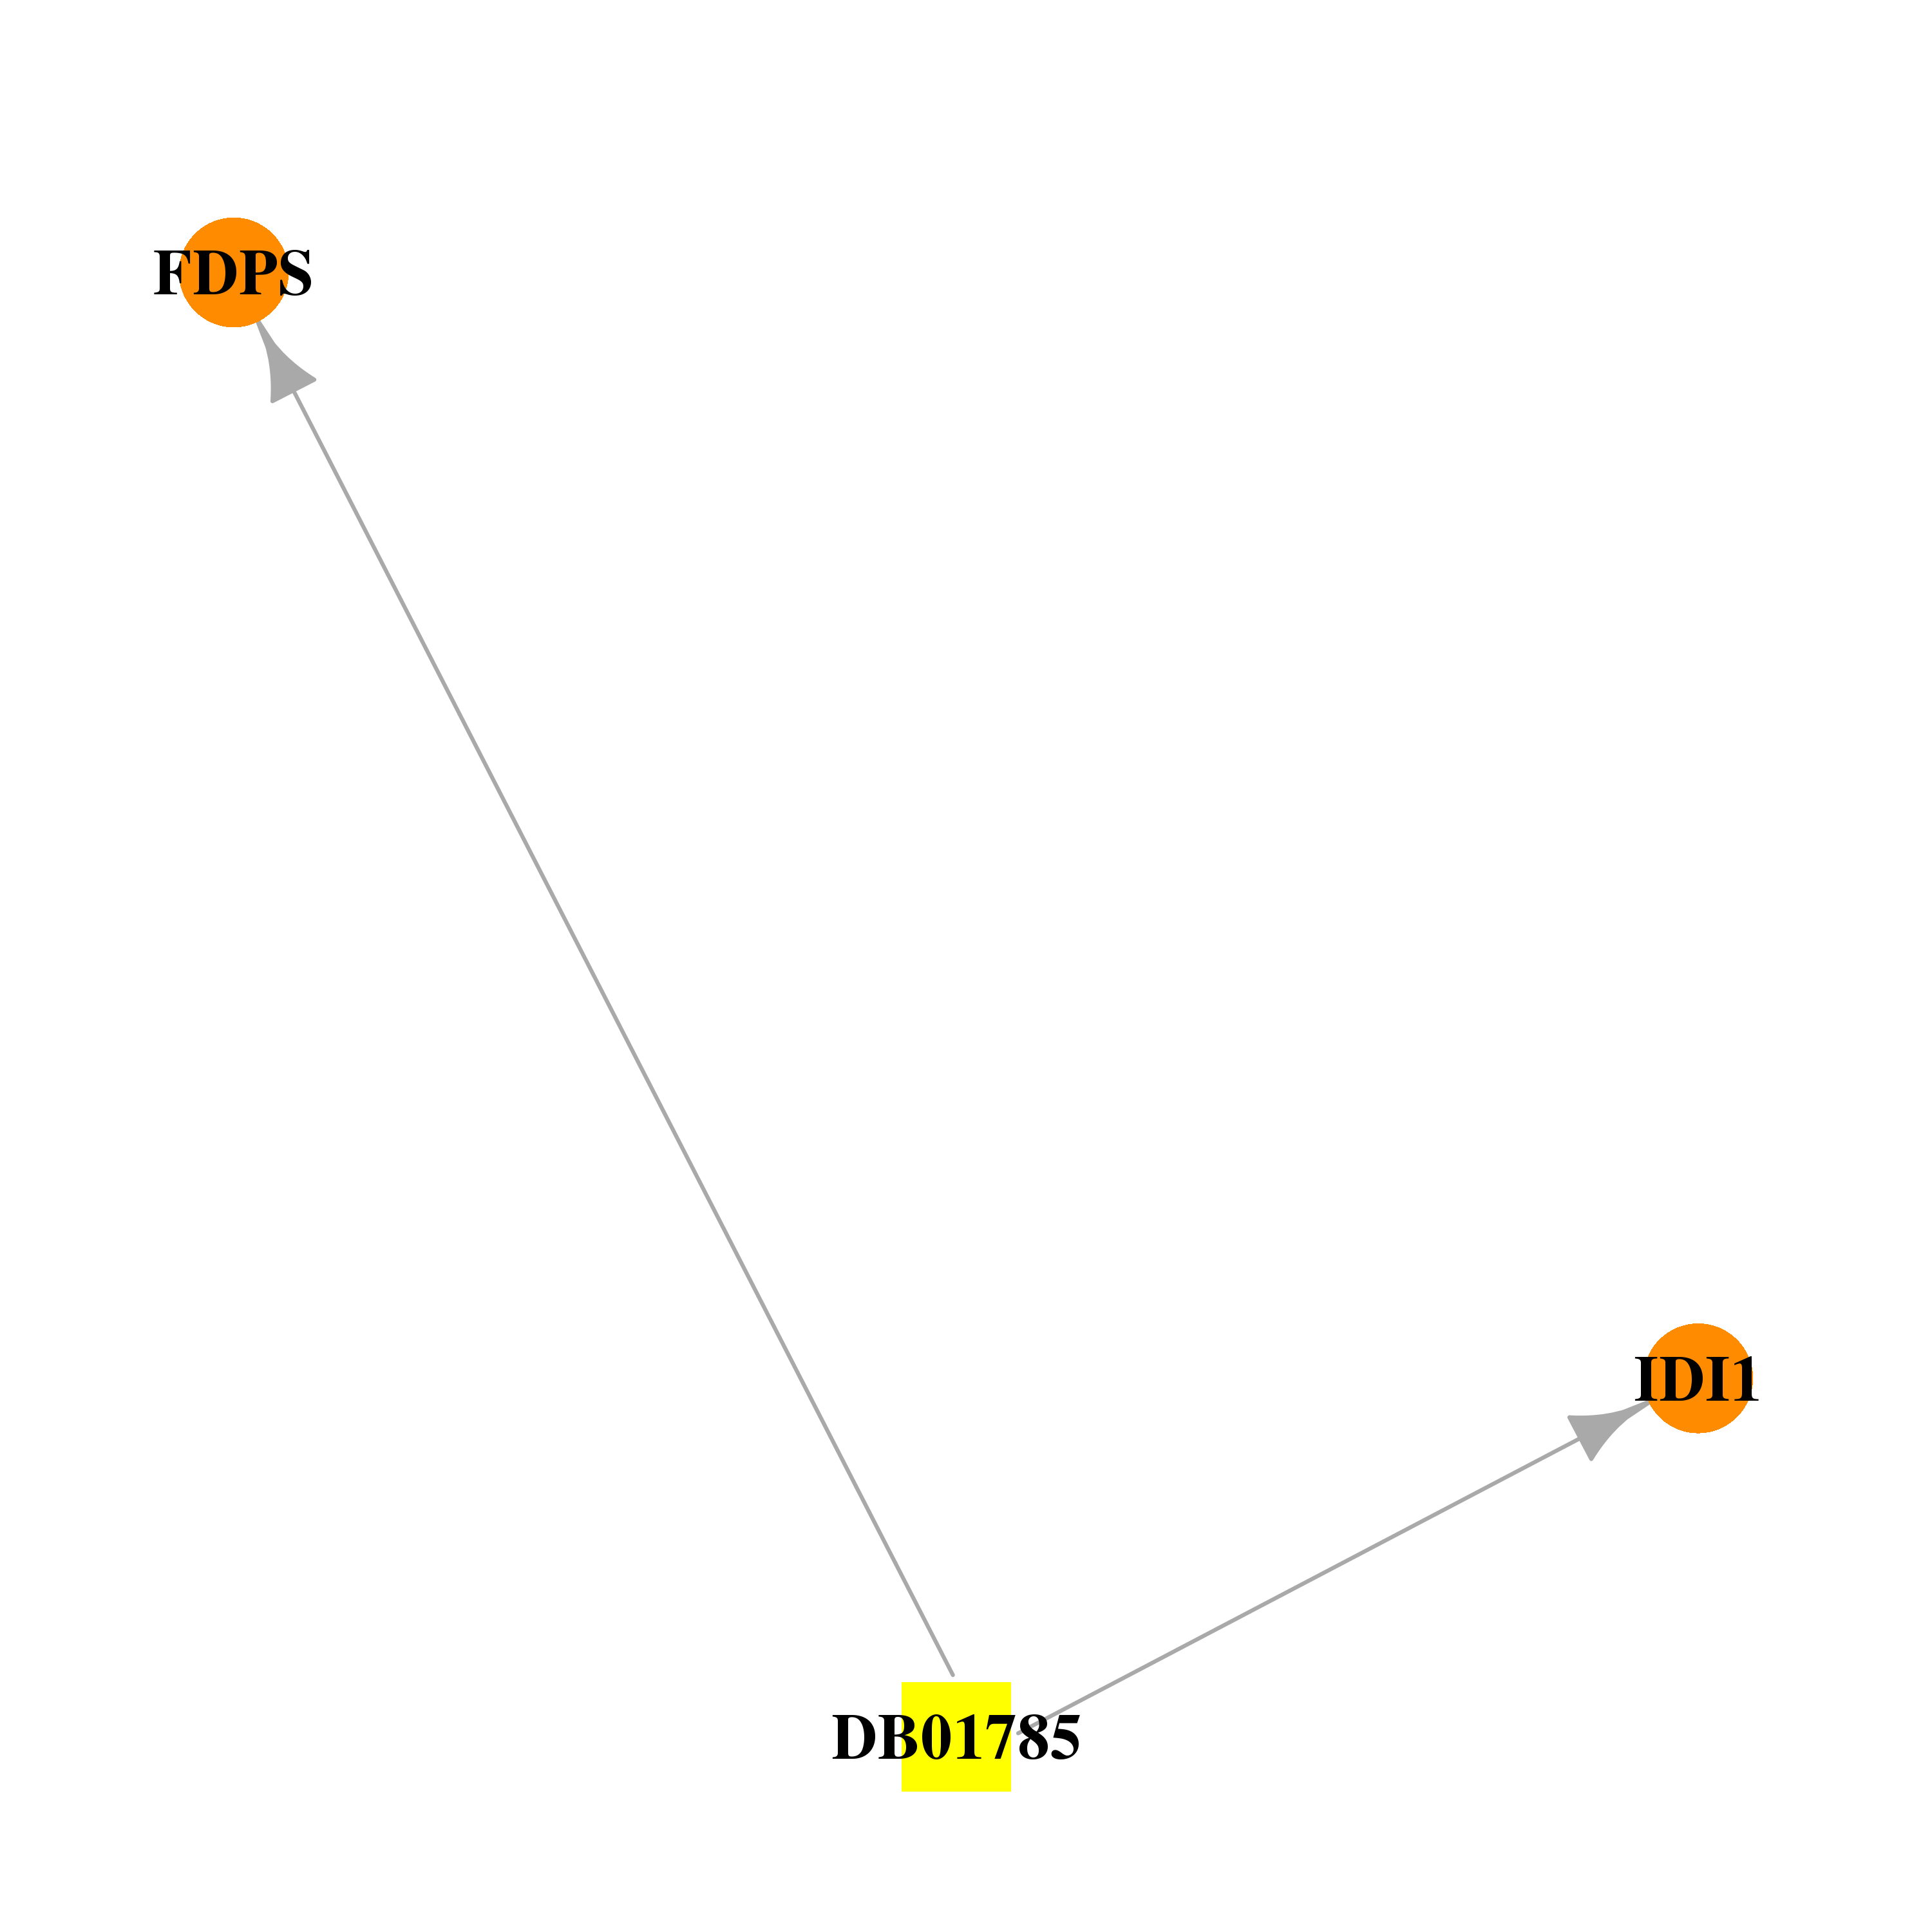 | 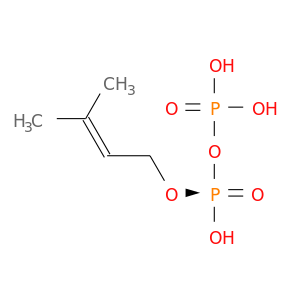 |
| Top |
| Cross referenced IDs for IDI1 |
| * We obtained these cross-references from Uniprot database. It covers 150 different DBs, 18 categories. http://www.uniprot.org/help/cross_references_section |
: Open all cross reference information
|
Copyright © 2016-Present - The Univsersity of Texas Health Science Center at Houston @ |