|
||||||||||||||||||||
| |
| Phenotypic Information (metabolism pathway, cancer, disease, phenome) |
| |
| |
| Gene-Gene Network Information: Co-Expression Network, Interacting Genes & KEGG |
| |
|


| Gene Summary for IDS |
| Top |
| Phenotypic Information for IDS(metabolism pathway, cancer, disease, phenome) |
| Cancer | CGAP: IDS |
| Familial Cancer Database: IDS | |
| * This gene is included in those cancer gene databases. |
|
|
|
|
|
| . | ||||||||||||||
Oncogene 1 | Significant driver gene in | |||||||||||||||||||
| cf) number; DB name 1 Oncogene; http://nar.oxfordjournals.org/content/35/suppl_1/D721.long, 2 Tumor Suppressor gene; https://bioinfo.uth.edu/TSGene/, 3 Cancer Gene Census; http://www.nature.com/nrc/journal/v4/n3/abs/nrc1299.html, 4 CancerGenes; http://nar.oxfordjournals.org/content/35/suppl_1/D721.long, 5 Network of Cancer Gene; http://ncg.kcl.ac.uk/index.php, 1Therapeutic Vulnerabilities in Cancer; http://cbio.mskcc.org/cancergenomics/statius/ |
| REACTOME_METABOLISM_OF_CARBOHYDRATES | |
| OMIM | |
| Orphanet | |
| Disease | KEGG Disease: IDS |
| MedGen: IDS (Human Medical Genetics with Condition) | |
| ClinVar: IDS | |
| Phenotype | MGI: IDS (International Mouse Phenotyping Consortium) |
| PhenomicDB: IDS | |
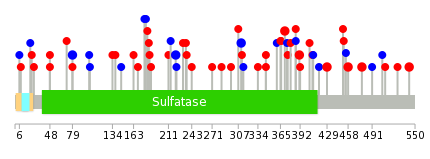
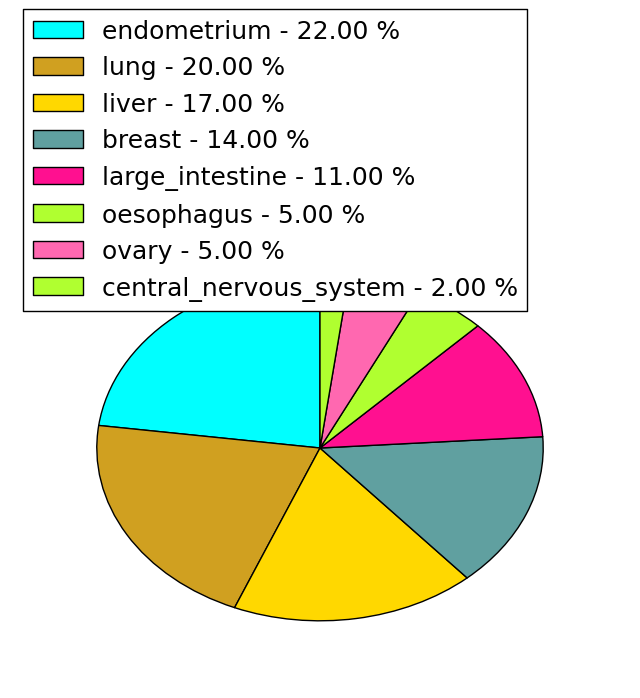
| Mutations for IDS |
| * Under tables are showing count per each tissue to give us broad intuition about tissue specific mutation patterns.You can go to the detailed page for each mutation database's web site. |
| There's no structural variation information in COSMIC data for this gene. |
| * From mRNA Sanger sequences, Chitars2.0 arranged chimeric transcripts. This table shows IDS related fusion information. |
| ID | Head Gene | Tail Gene | Accession | Gene_a | qStart_a | qEnd_a | Chromosome_a | tStart_a | tEnd_a | Gene_a | qStart_a | qEnd_a | Chromosome_a | tStart_a | tEnd_a |
| BP384531 | IDS | 1 | 65 | X | 148564535 | 148564599 | PAIP2 | 64 | 376 | 5 | 138705082 | 138705389 | |
| BU622671 | IDS | 18 | 348 | X | 148560300 | 148560630 | SNHG3 | 345 | 580 | 1 | 28835590 | 28835825 | |
| BF059161 | IDS | 2 | 297 | X | 148560303 | 148560598 | PUM2 | 295 | 480 | 2 | 20493460 | 20493645 | |
| AW138862 | TAOK1 | 1 | 392 | 17 | 27766509 | 27766899 | IDS | 391 | 446 | X | 148561784 | 148561839 | |
| BU735117 | PGAM5 | 15 | 223 | 12 | 133299111 | 133299320 | IDS | 220 | 380 | X | 148560838 | 148560998 | |
| CB268858 | IDS | 3 | 213 | X | 148587469 | 148587686 | IDS | 213 | 500 | X | 148592898 | 148607295 | |
| BX509939 | IDS | 1 | 290 | X | 148560307 | 148560595 | AFMID | 276 | 671 | 17 | 76202062 | 76203316 | |
| AA984459 | PPM1K | 2 | 55 | 4 | 89205095 | 89205148 | IDS | 54 | 409 | X | 148561256 | 148561611 | |
| CB306816 | IDS | 17 | 345 | X | 148564072 | 148564400 | IDS | 343 | 454 | X | 148564409 | 148564520 | |
| U66054 | IDS | 1 | 187 | X | 148571843 | 148577934 | LOC100131434 | 185 | 425 | X | 148615706 | 148626977 | |
| BX647783 | AFMID | 2 | 644 | 17 | 76183443 | 76203316 | IDS | 630 | 925 | X | 148560300 | 148560595 | |
| AW628693 | IDS | 4 | 223 | X | 148592932 | 148593151 | IDS | 222 | 443 | X | 148571844 | 148577970 | |
| U66053 | LOC100131434 | 1 | 302 | X | 148615706 | 148626977 | IDS | 300 | 487 | X | 148571843 | 148577935 | |
| Top |
| There's no copy number variation information in COSMIC data for this gene. |
| Top |
|
 |
| Top |
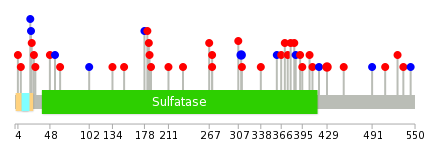
| Stat. for Non-Synonymous SNVs (# total SNVs=35) | (# total SNVs=17) |
 |  |
(# total SNVs=1) | (# total SNVs=0) |
 |
| Top |
| * When you move the cursor on each content, you can see more deailed mutation information on the Tooltip. Those are primary_site,primary_histology,mutation(aa),pubmedID. |
| GRCh37 position | Mutation(aa) | Unique sampleID count |
| chr23:148586605-148586605 | p.C21C | 2 |
| chr23:148564500-148564500 | p.S477F | 2 |
| chr23:148564557-148564557 | p.R458H | 2 |
| chr23:148568465-148568465 | p.M391V | 2 |
| chr23:148585690-148585690 | p.A79A | 2 |
| chr23:148564645-148564645 | p.V429I | 2 |
| chr23:148564306-148564306 | p.G542R | 2 |
| chr23:148571918-148571918 | p.V311V | 2 |
| chr23:148579685-148579685 | p.L221L | 2 |
| chr23:148568525-148568525 | p.P371A | 2 |
| Top |
|
 |
| Point Mutation/ Tissue ID | 1 | 2 | 3 | 4 | 5 | 6 | 7 | 8 | 9 | 10 | 11 | 12 | 13 | 14 | 15 | 16 | 17 | 18 | 19 | 20 |
| # sample | 1 | 5 | 2 | 1 | 3 | 3 | 5 | 1 | 1 | 8 | 4 | 1 | 11 | |||||||
| # mutation | 1 | 5 | 2 | 1 | 4 | 3 | 5 | 1 | 1 | 8 | 4 | 1 | 12 | |||||||
| nonsynonymous SNV | 1 | 3 | 2 | 3 | 2 | 4 | 1 | 1 | 7 | 3 | 1 | 8 | ||||||||
| synonymous SNV | 2 | 1 | 1 | 1 | 1 | 1 | 1 | 4 |
| cf) Tissue ID; Tissue type (1; BLCA[Bladder Urothelial Carcinoma], 2; BRCA[Breast invasive carcinoma], 3; CESC[Cervical squamous cell carcinoma and endocervical adenocarcinoma], 4; COAD[Colon adenocarcinoma], 5; GBM[Glioblastoma multiforme], 6; Glioma Low Grade, 7; HNSC[Head and Neck squamous cell carcinoma], 8; KICH[Kidney Chromophobe], 9; KIRC[Kidney renal clear cell carcinoma], 10; KIRP[Kidney renal papillary cell carcinoma], 11; LAML[Acute Myeloid Leukemia], 12; LUAD[Lung adenocarcinoma], 13; LUSC[Lung squamous cell carcinoma], 14; OV[Ovarian serous cystadenocarcinoma ], 15; PAAD[Pancreatic adenocarcinoma], 16; PRAD[Prostate adenocarcinoma], 17; SKCM[Skin Cutaneous Melanoma], 18:STAD[Stomach adenocarcinoma], 19:THCA[Thyroid carcinoma], 20:UCEC[Uterine Corpus Endometrial Carcinoma]) |
| Top |
| * We represented just top 10 SNVs. When you move the cursor on each content, you can see more deailed mutation information on the Tooltip. Those are primary_site, primary_histology, mutation(aa), pubmedID. |
| Genomic Position | Mutation(aa) | Unique sampleID count |
| chrX:148564645 | p.V311V,IDS | 2 |
| chrX:148571918 | p.V429I,IDS | 2 |
| chrX:148564354 | p.S491S,IDS | 1 |
| chrX:148584859 | p.G312D,IDS | 1 |
| chrX:148568486 | p.R4H | 1 |
| chrX:148586645 | p.Y452H,IDS | 1 |
| chrX:148577945 | p.P62A,IDS | 1 |
| chrX:148564405 | p.L307S,IDS | 1 |
| chrX:148584954 | p.G55G,IDS | 1 |
| chrX:148568501 | p.V418V,IDS | 1 |
| * Copy number data were extracted from TCGA using R package TCGA-Assembler. The URLs of all public data files on TCGA DCC data server were gathered on Jan-05-2015. Function ProcessCNAData in TCGA-Assembler package was used to obtain gene-level copy number value which is calculated as the average copy number of the genomic region of a gene. |
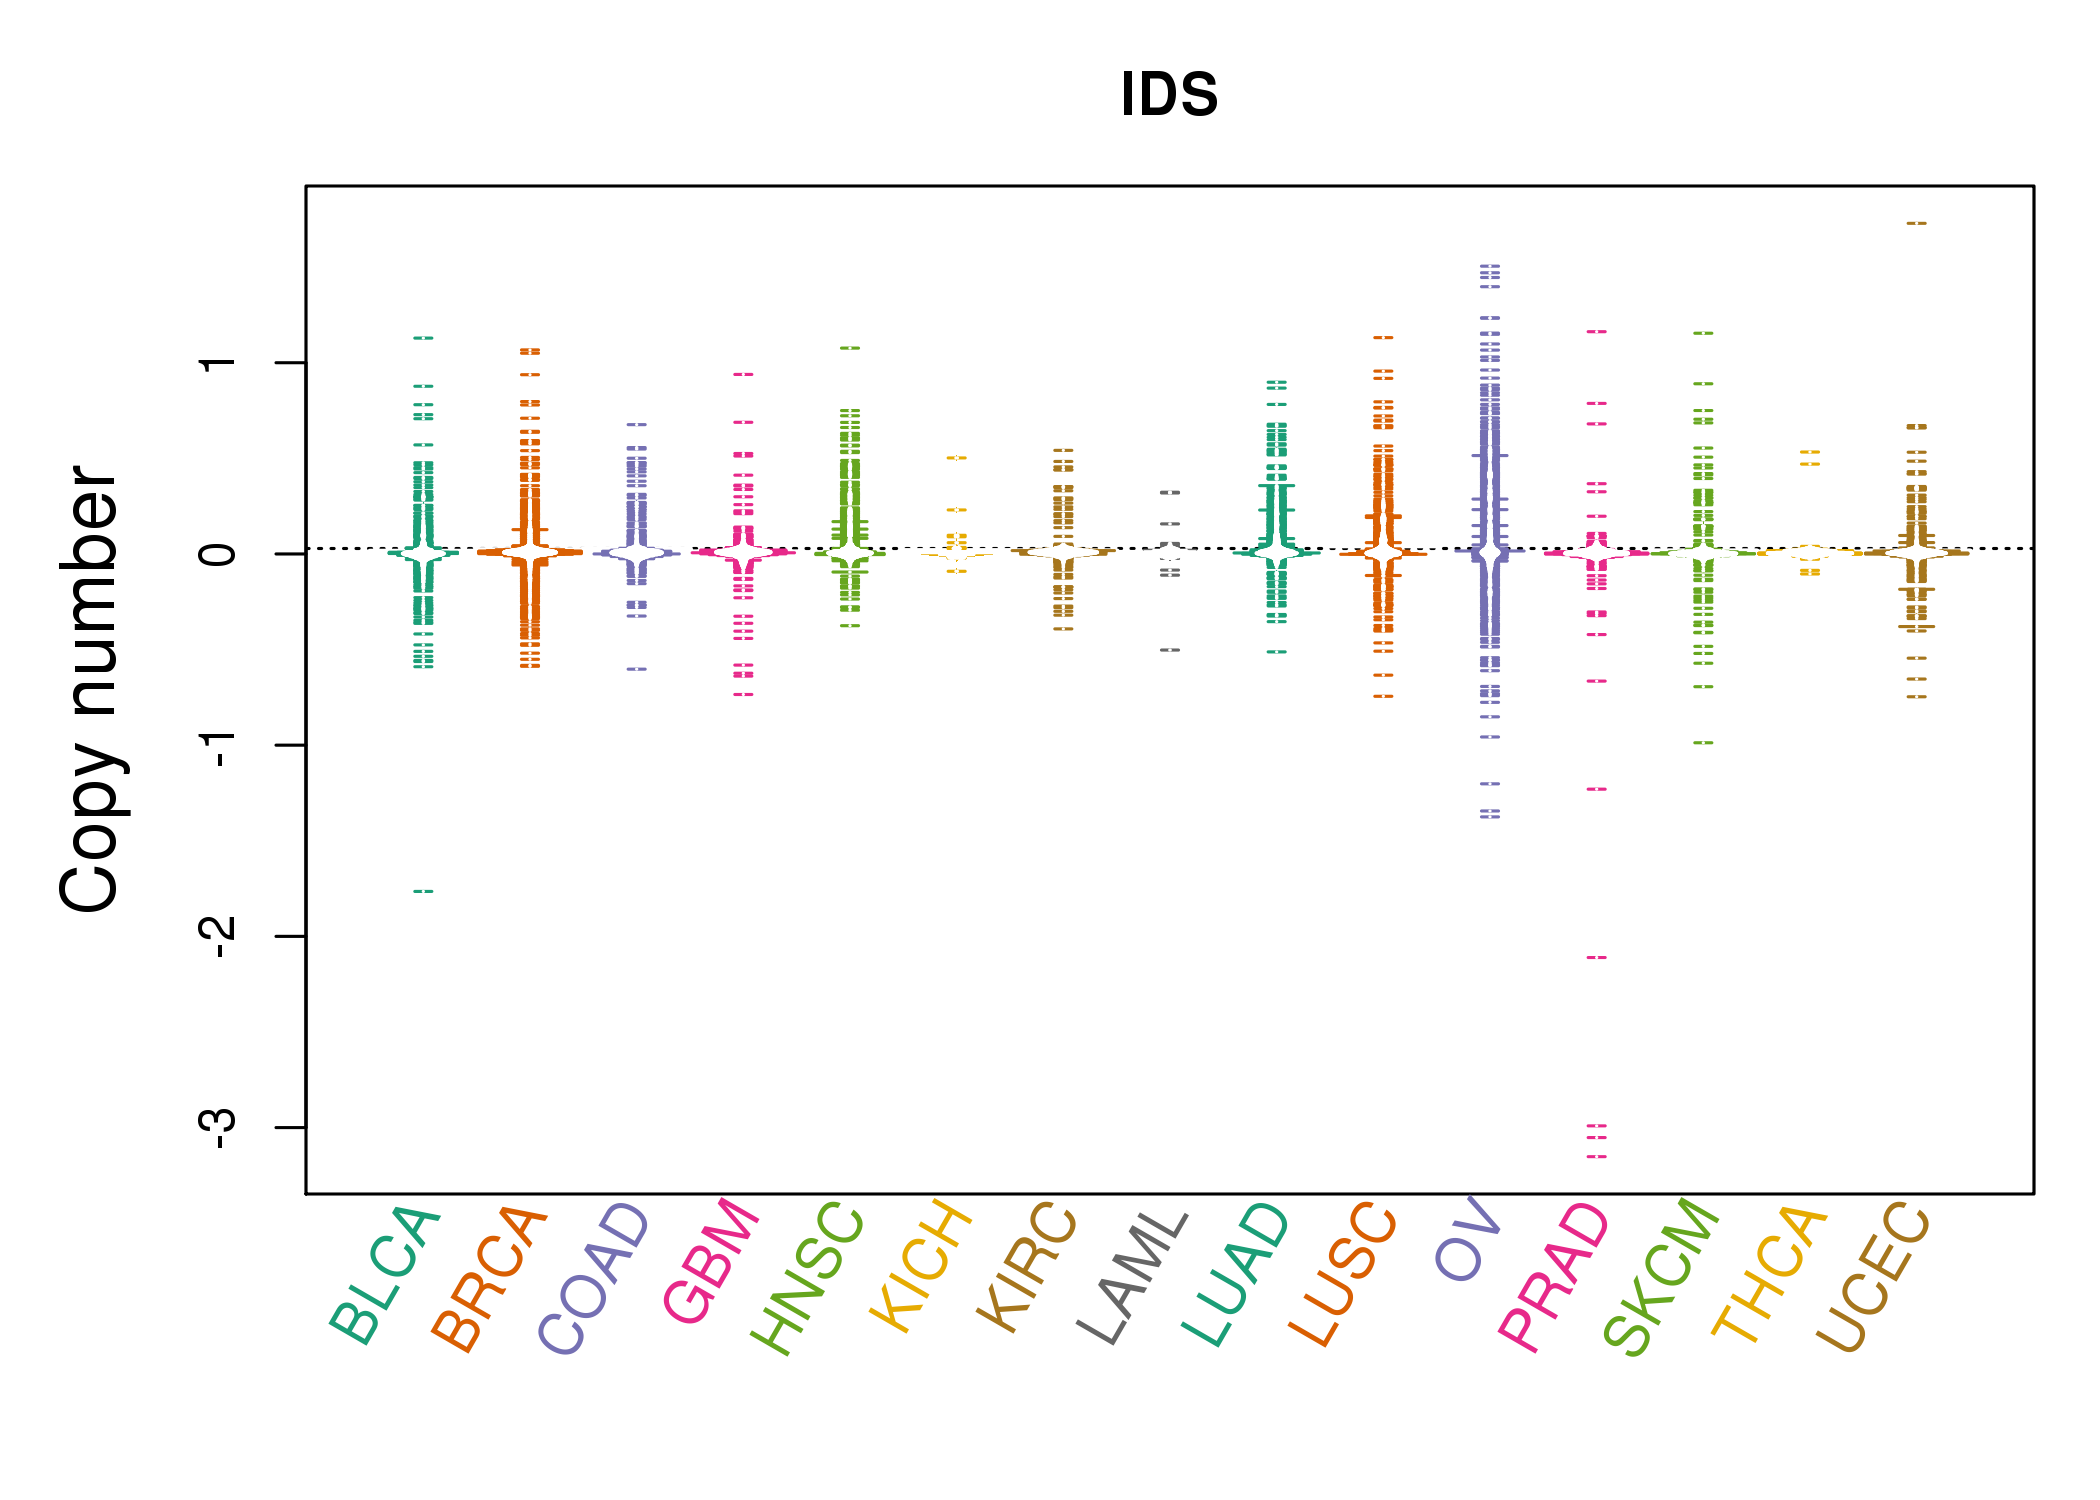 |
| cf) Tissue ID[Tissue type]: BLCA[Bladder Urothelial Carcinoma], BRCA[Breast invasive carcinoma], CESC[Cervical squamous cell carcinoma and endocervical adenocarcinoma], COAD[Colon adenocarcinoma], GBM[Glioblastoma multiforme], Glioma Low Grade, HNSC[Head and Neck squamous cell carcinoma], KICH[Kidney Chromophobe], KIRC[Kidney renal clear cell carcinoma], KIRP[Kidney renal papillary cell carcinoma], LAML[Acute Myeloid Leukemia], LUAD[Lung adenocarcinoma], LUSC[Lung squamous cell carcinoma], OV[Ovarian serous cystadenocarcinoma ], PAAD[Pancreatic adenocarcinoma], PRAD[Prostate adenocarcinoma], SKCM[Skin Cutaneous Melanoma], STAD[Stomach adenocarcinoma], THCA[Thyroid carcinoma], UCEC[Uterine Corpus Endometrial Carcinoma] |
| Top |
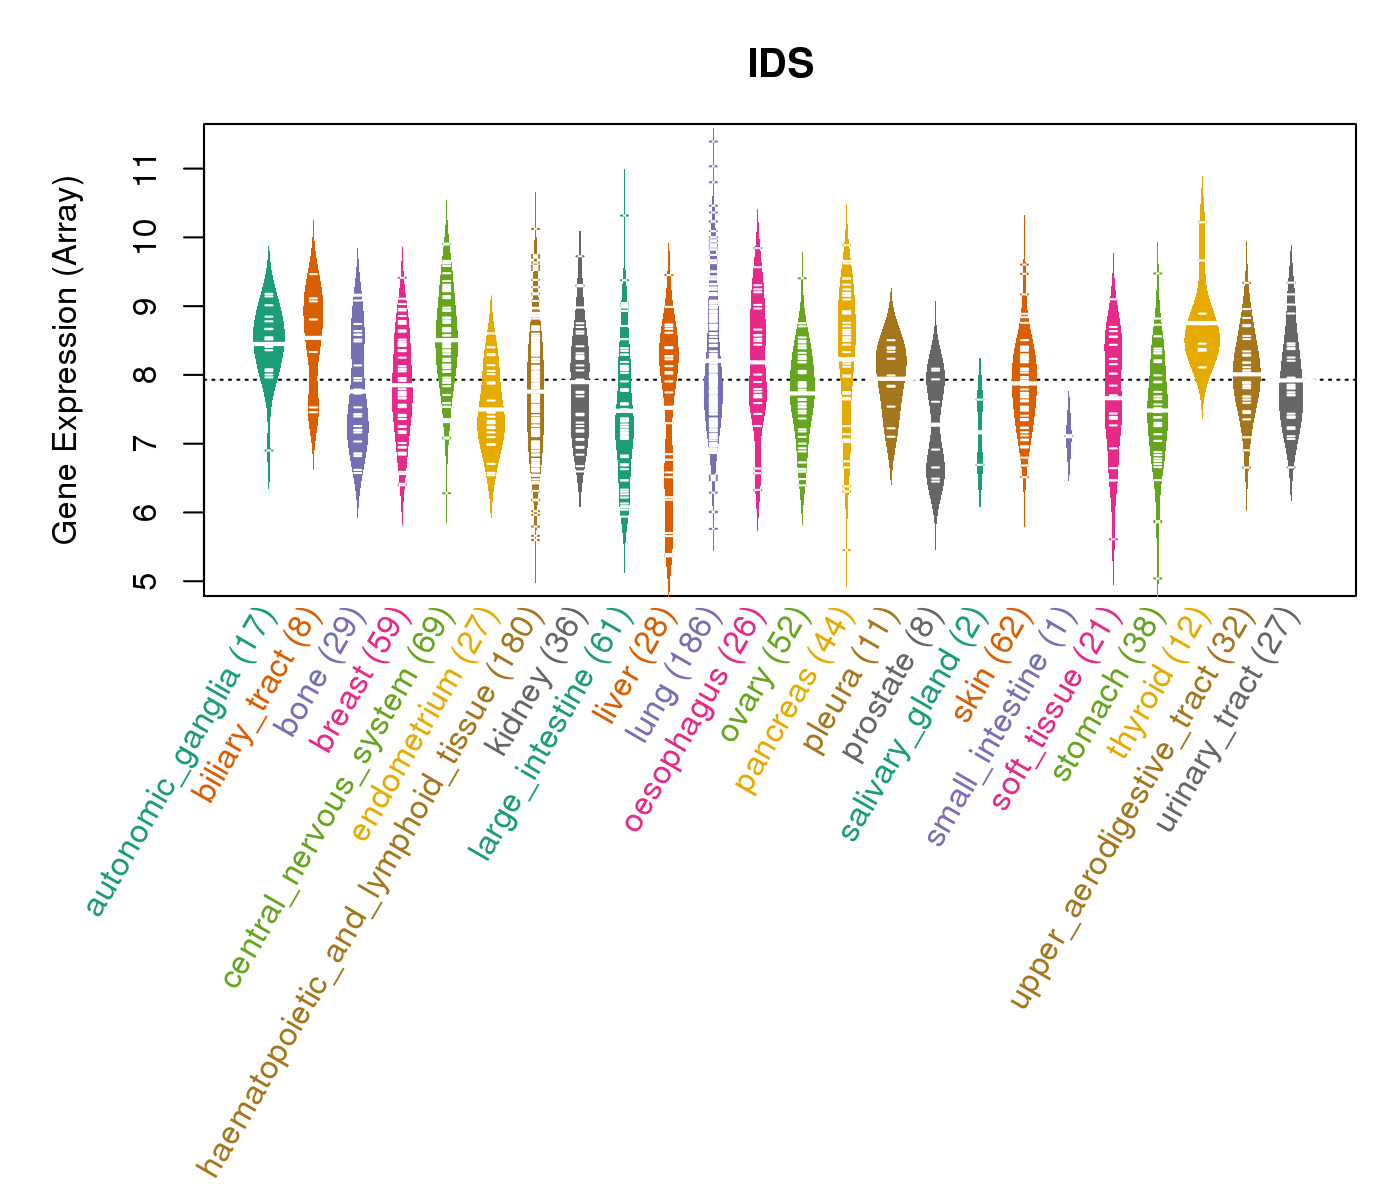
| Gene Expression for IDS |
| * CCLE gene expression data were extracted from CCLE_Expression_Entrez_2012-10-18.res: Gene-centric RMA-normalized mRNA expression data. |
 |
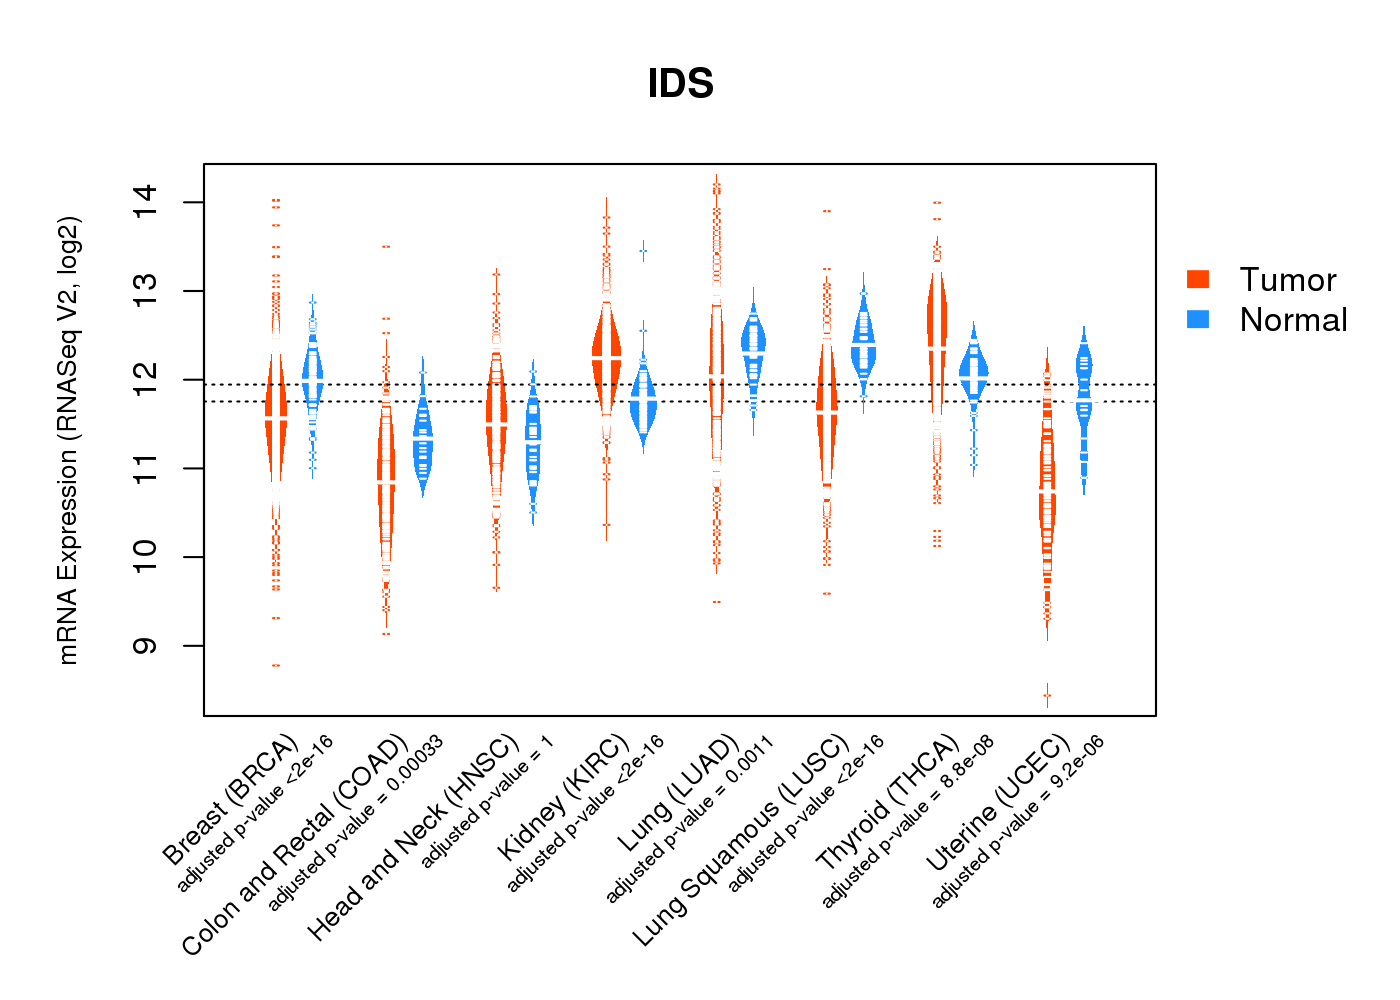
| * Normalized gene expression data of RNASeqV2 was extracted from TCGA using R package TCGA-Assembler. The URLs of all public data files on TCGA DCC data server were gathered at Jan-05-2015. Only eight cancer types have enough normal control samples for differential expression analysis. (t test, adjusted p<0.05 (using Benjamini-Hochberg FDR)) |
 |
| Top |
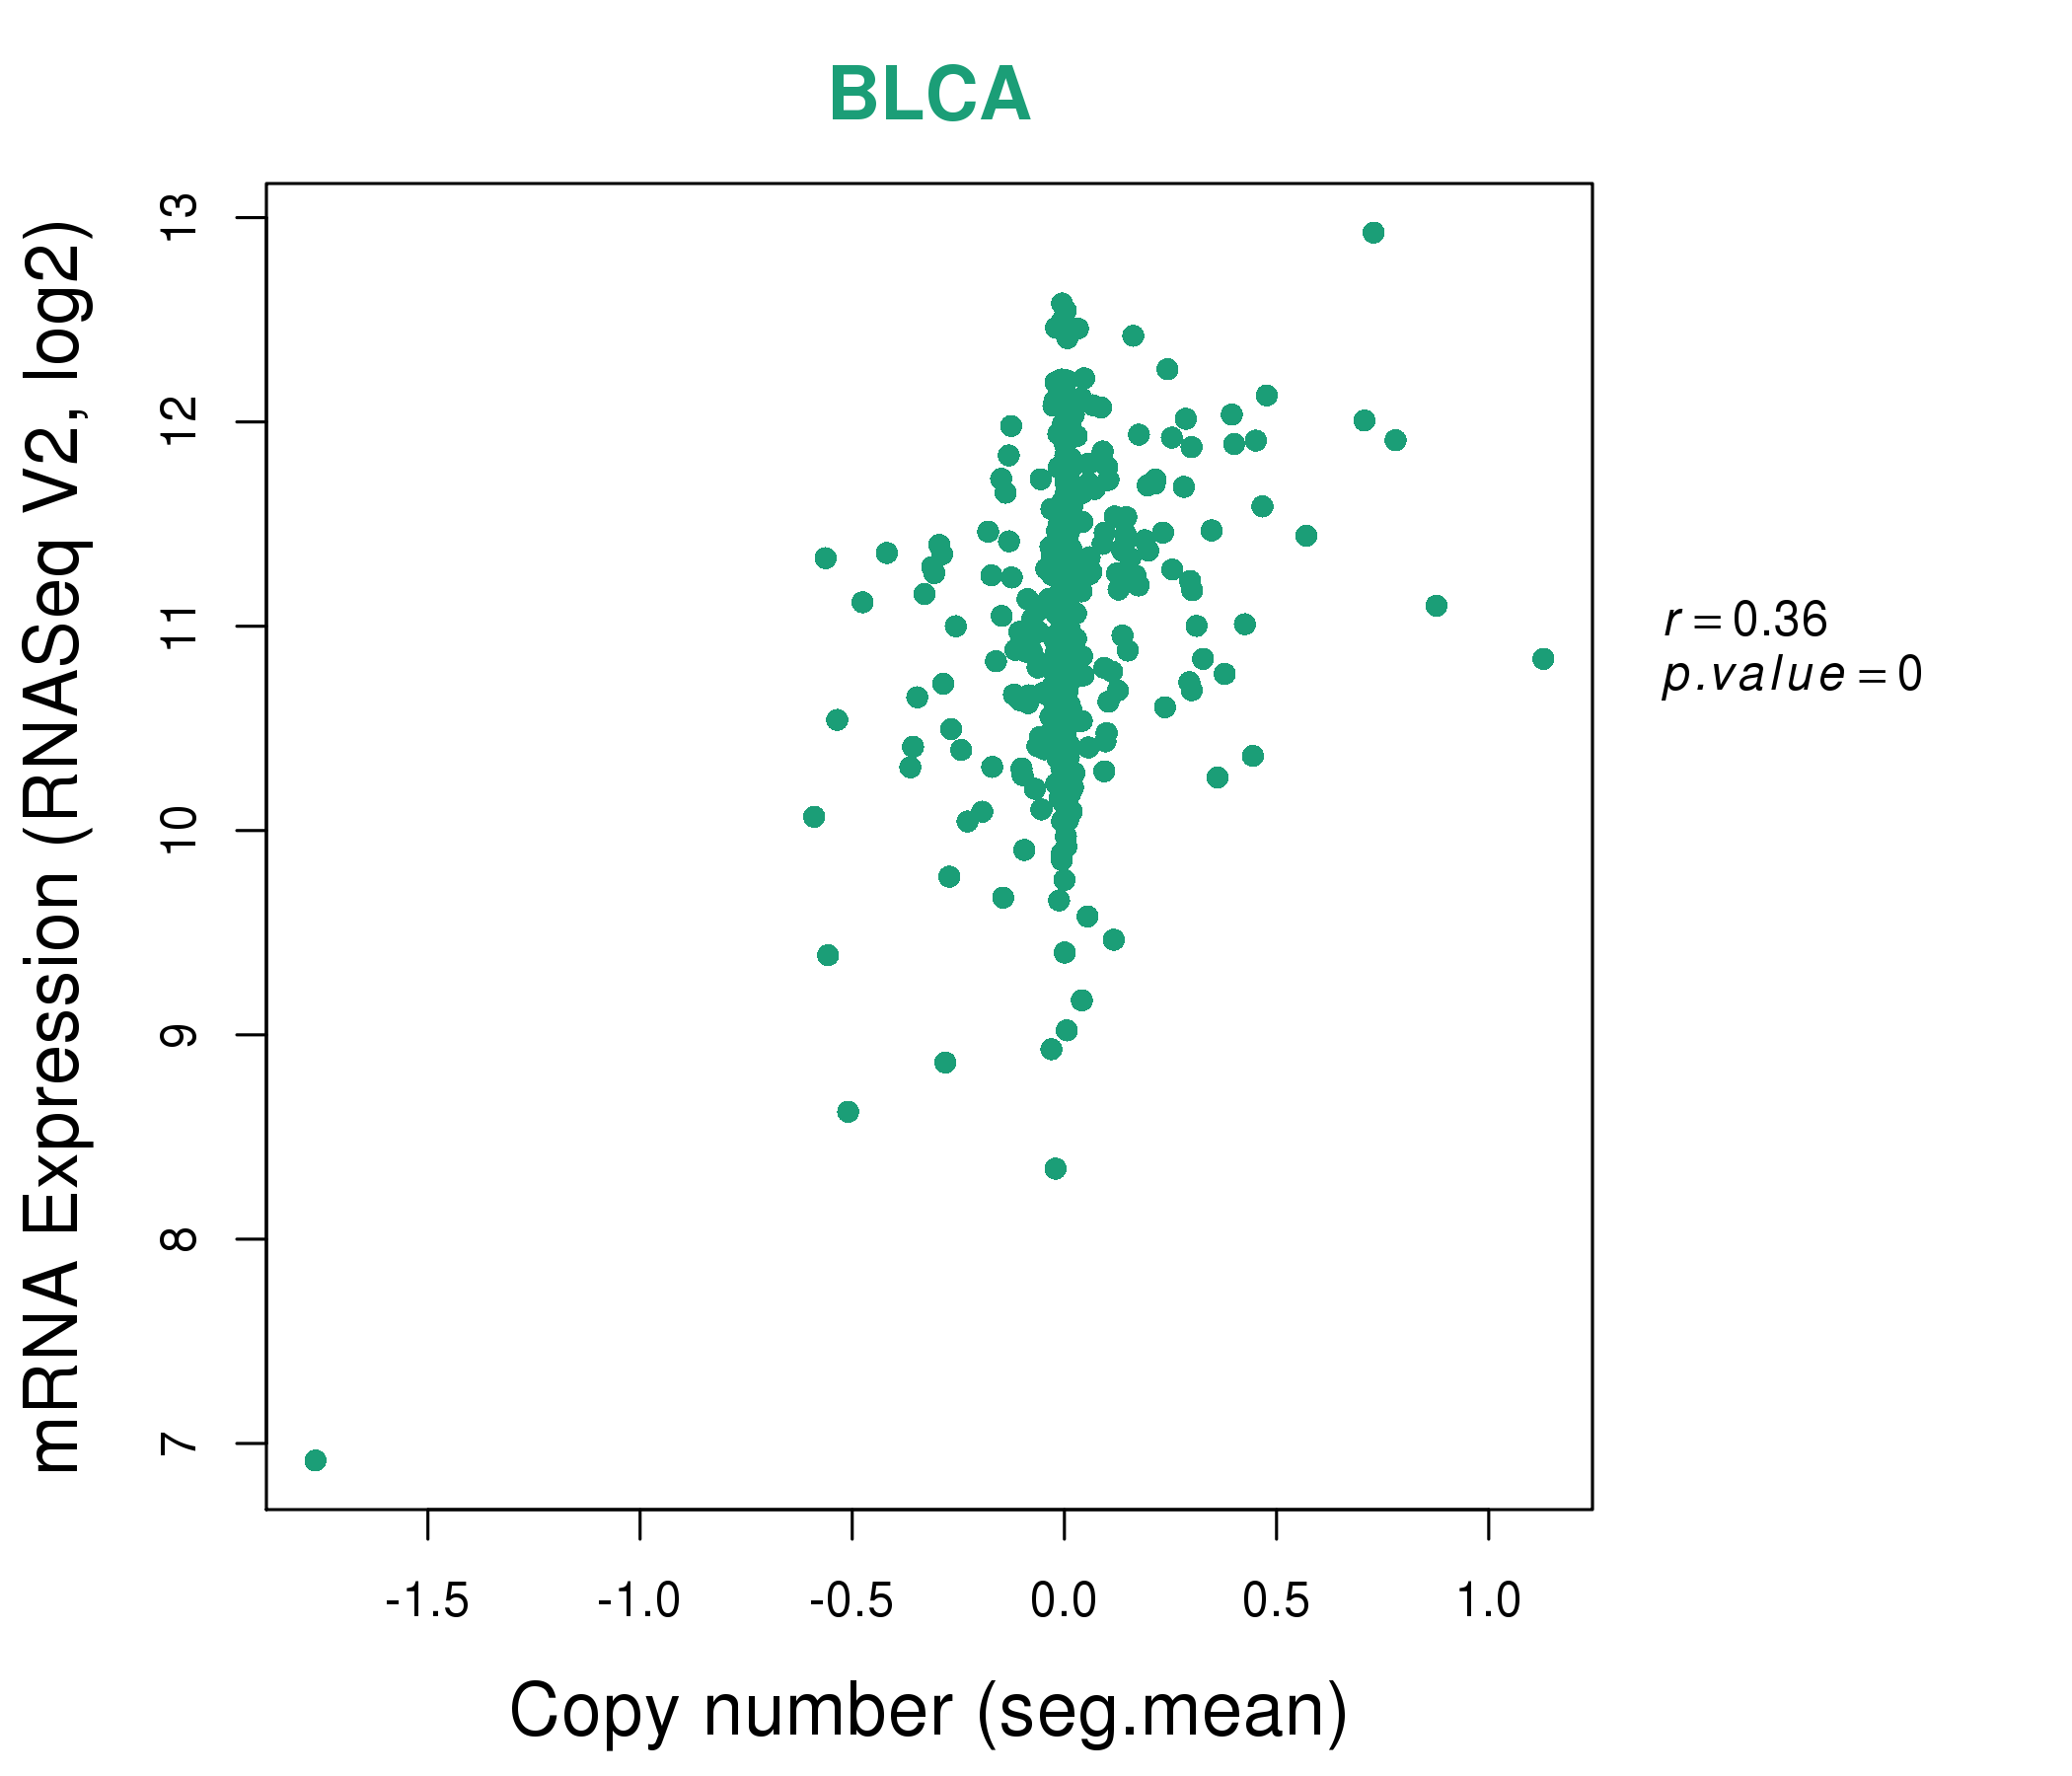
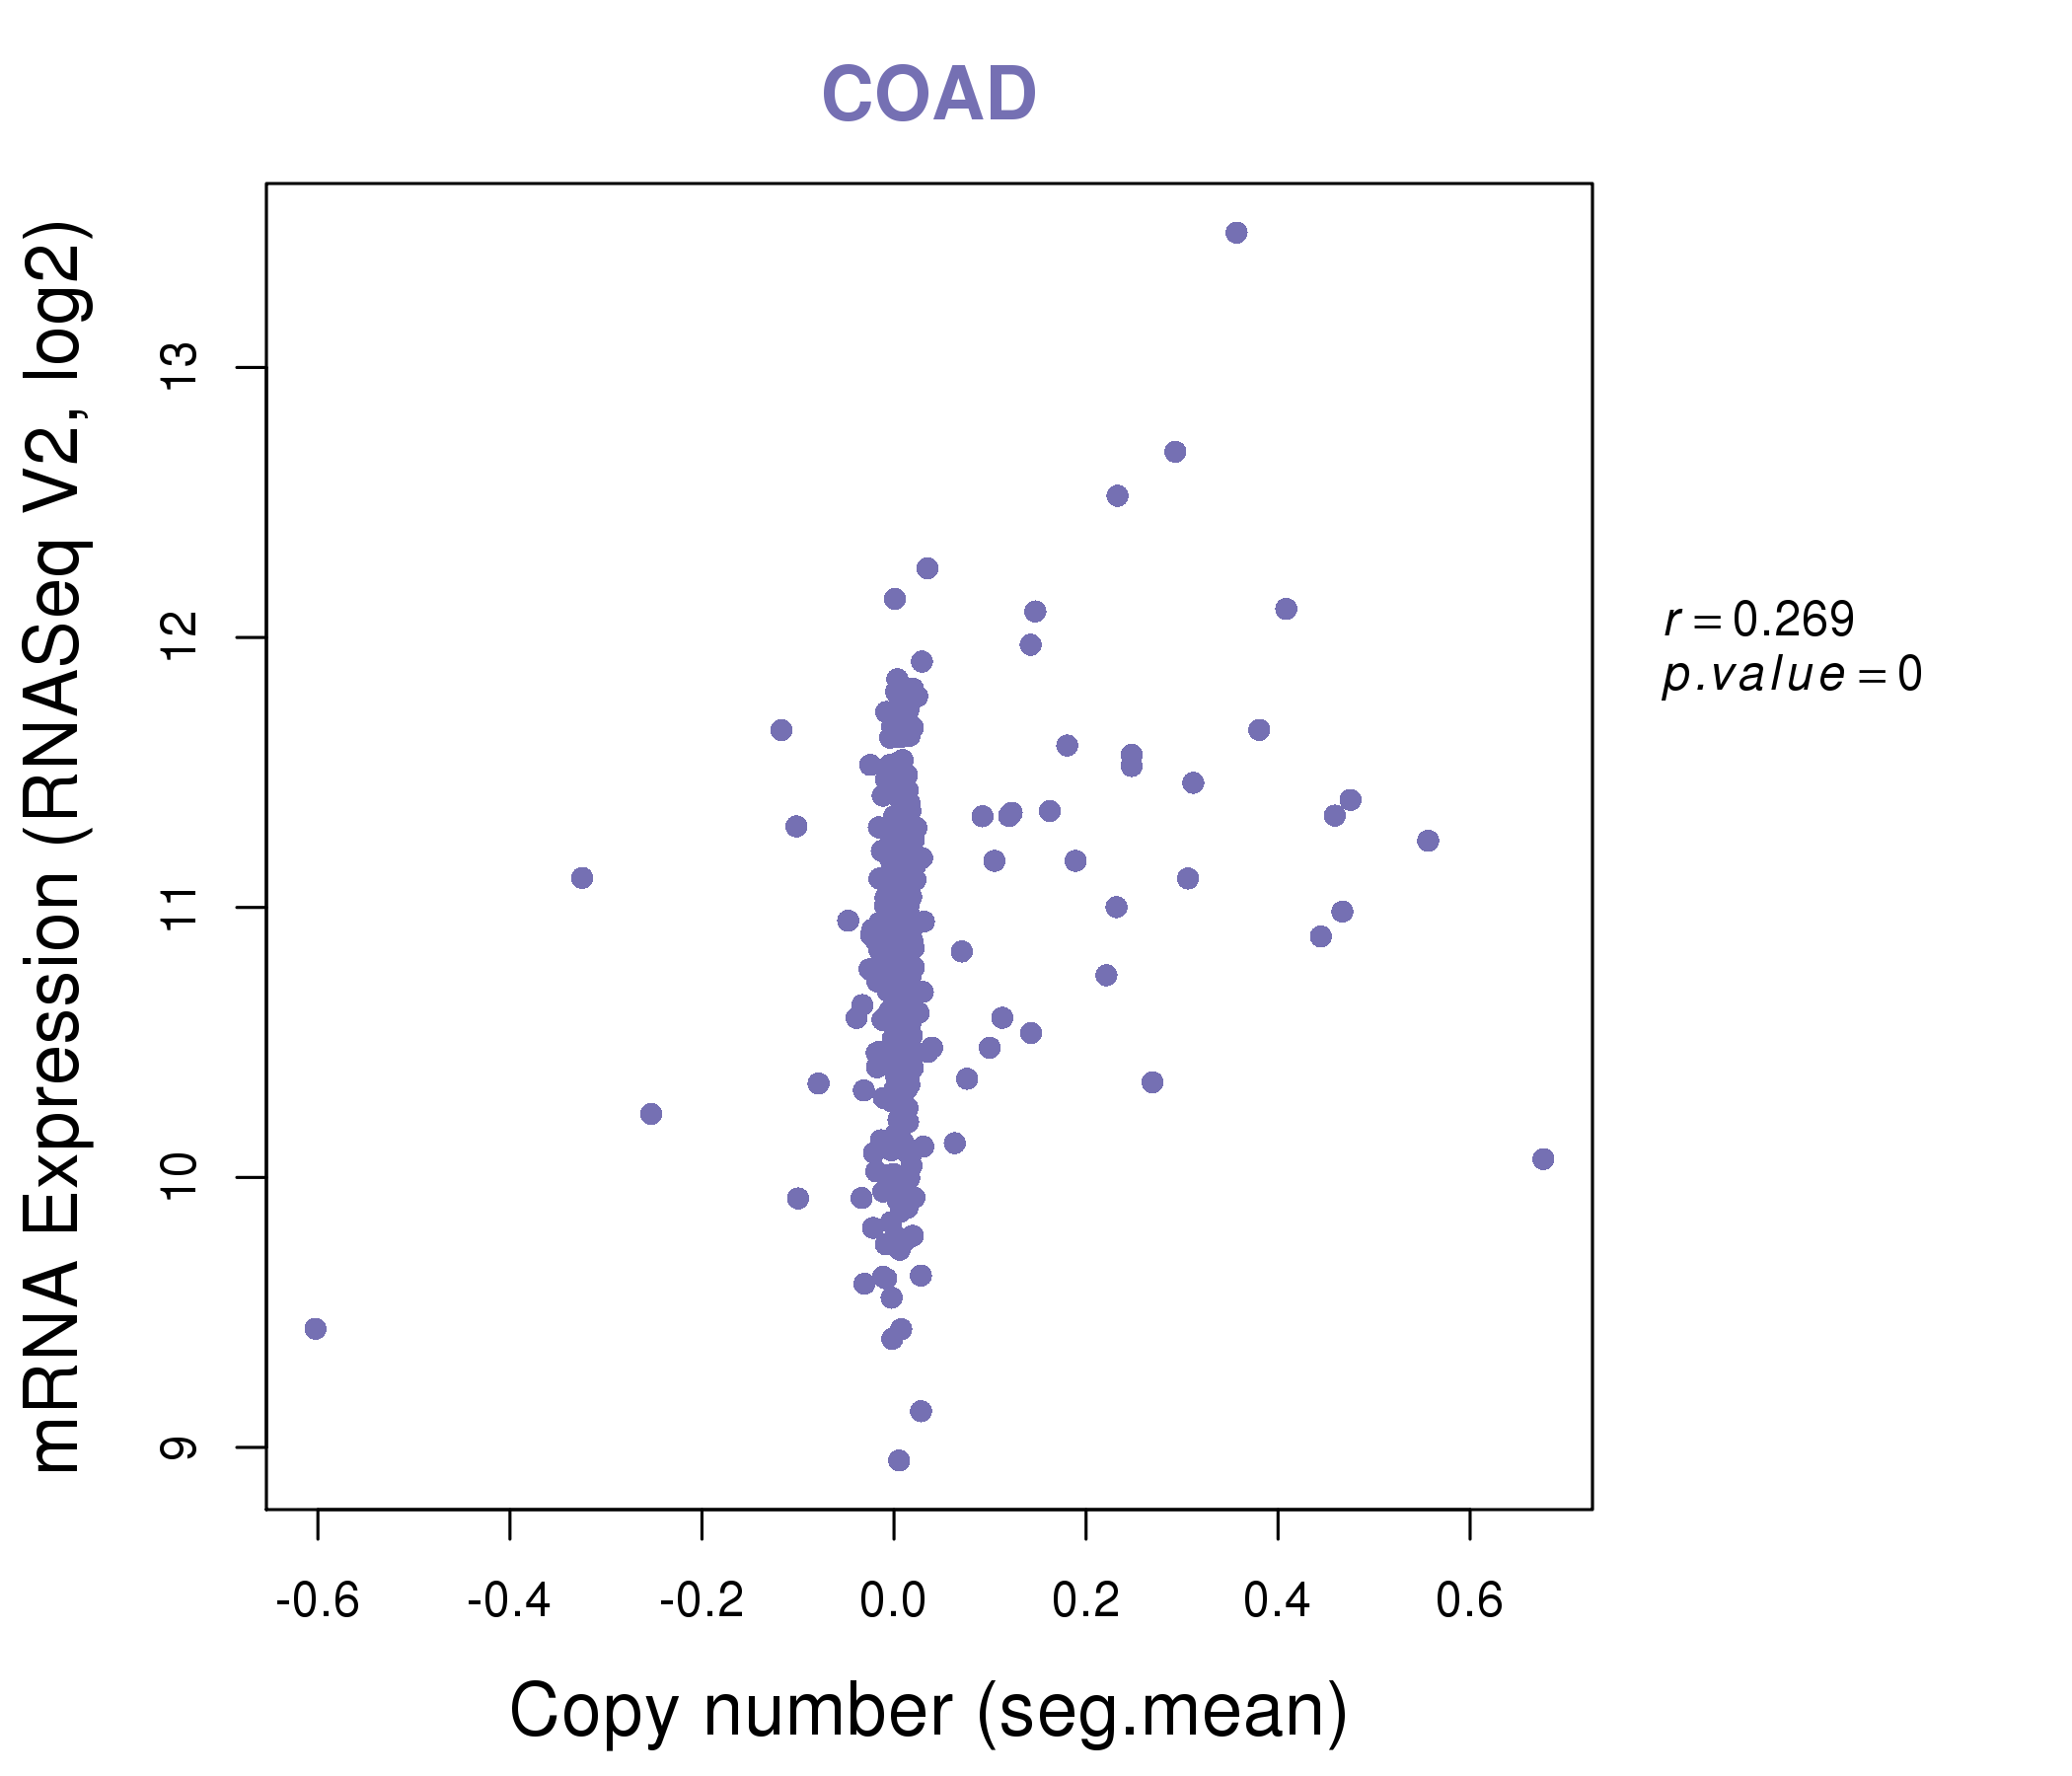
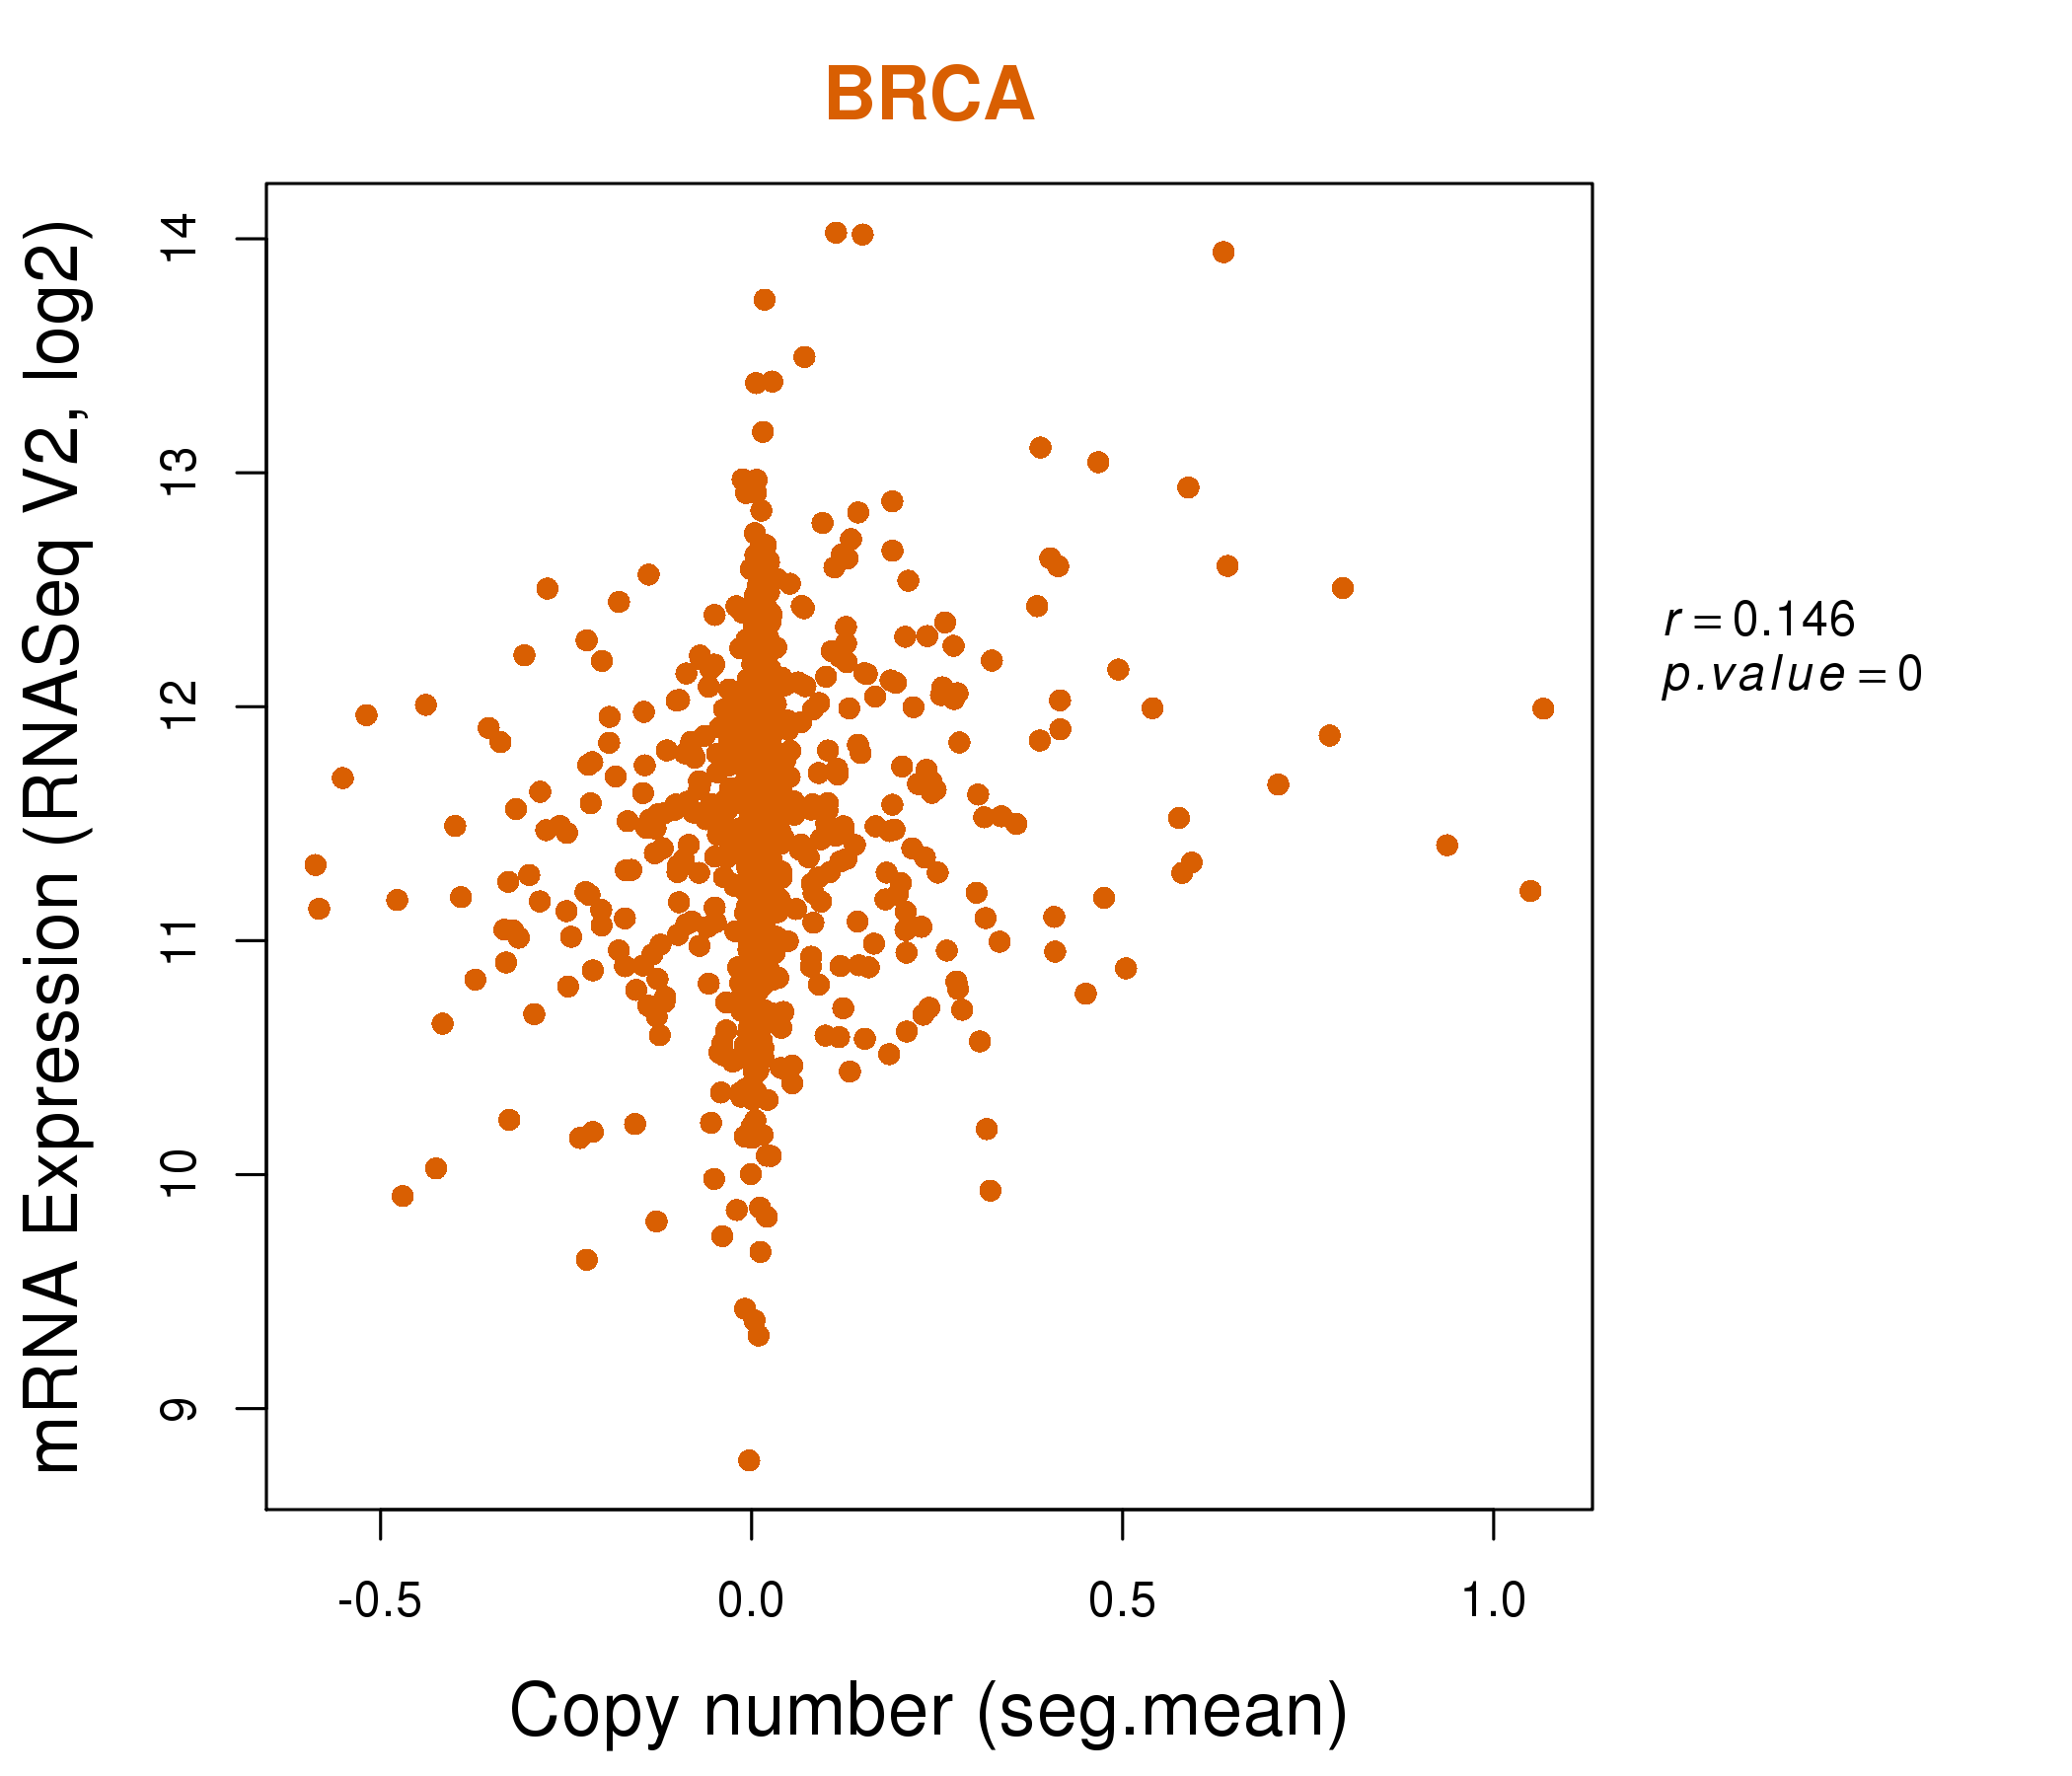
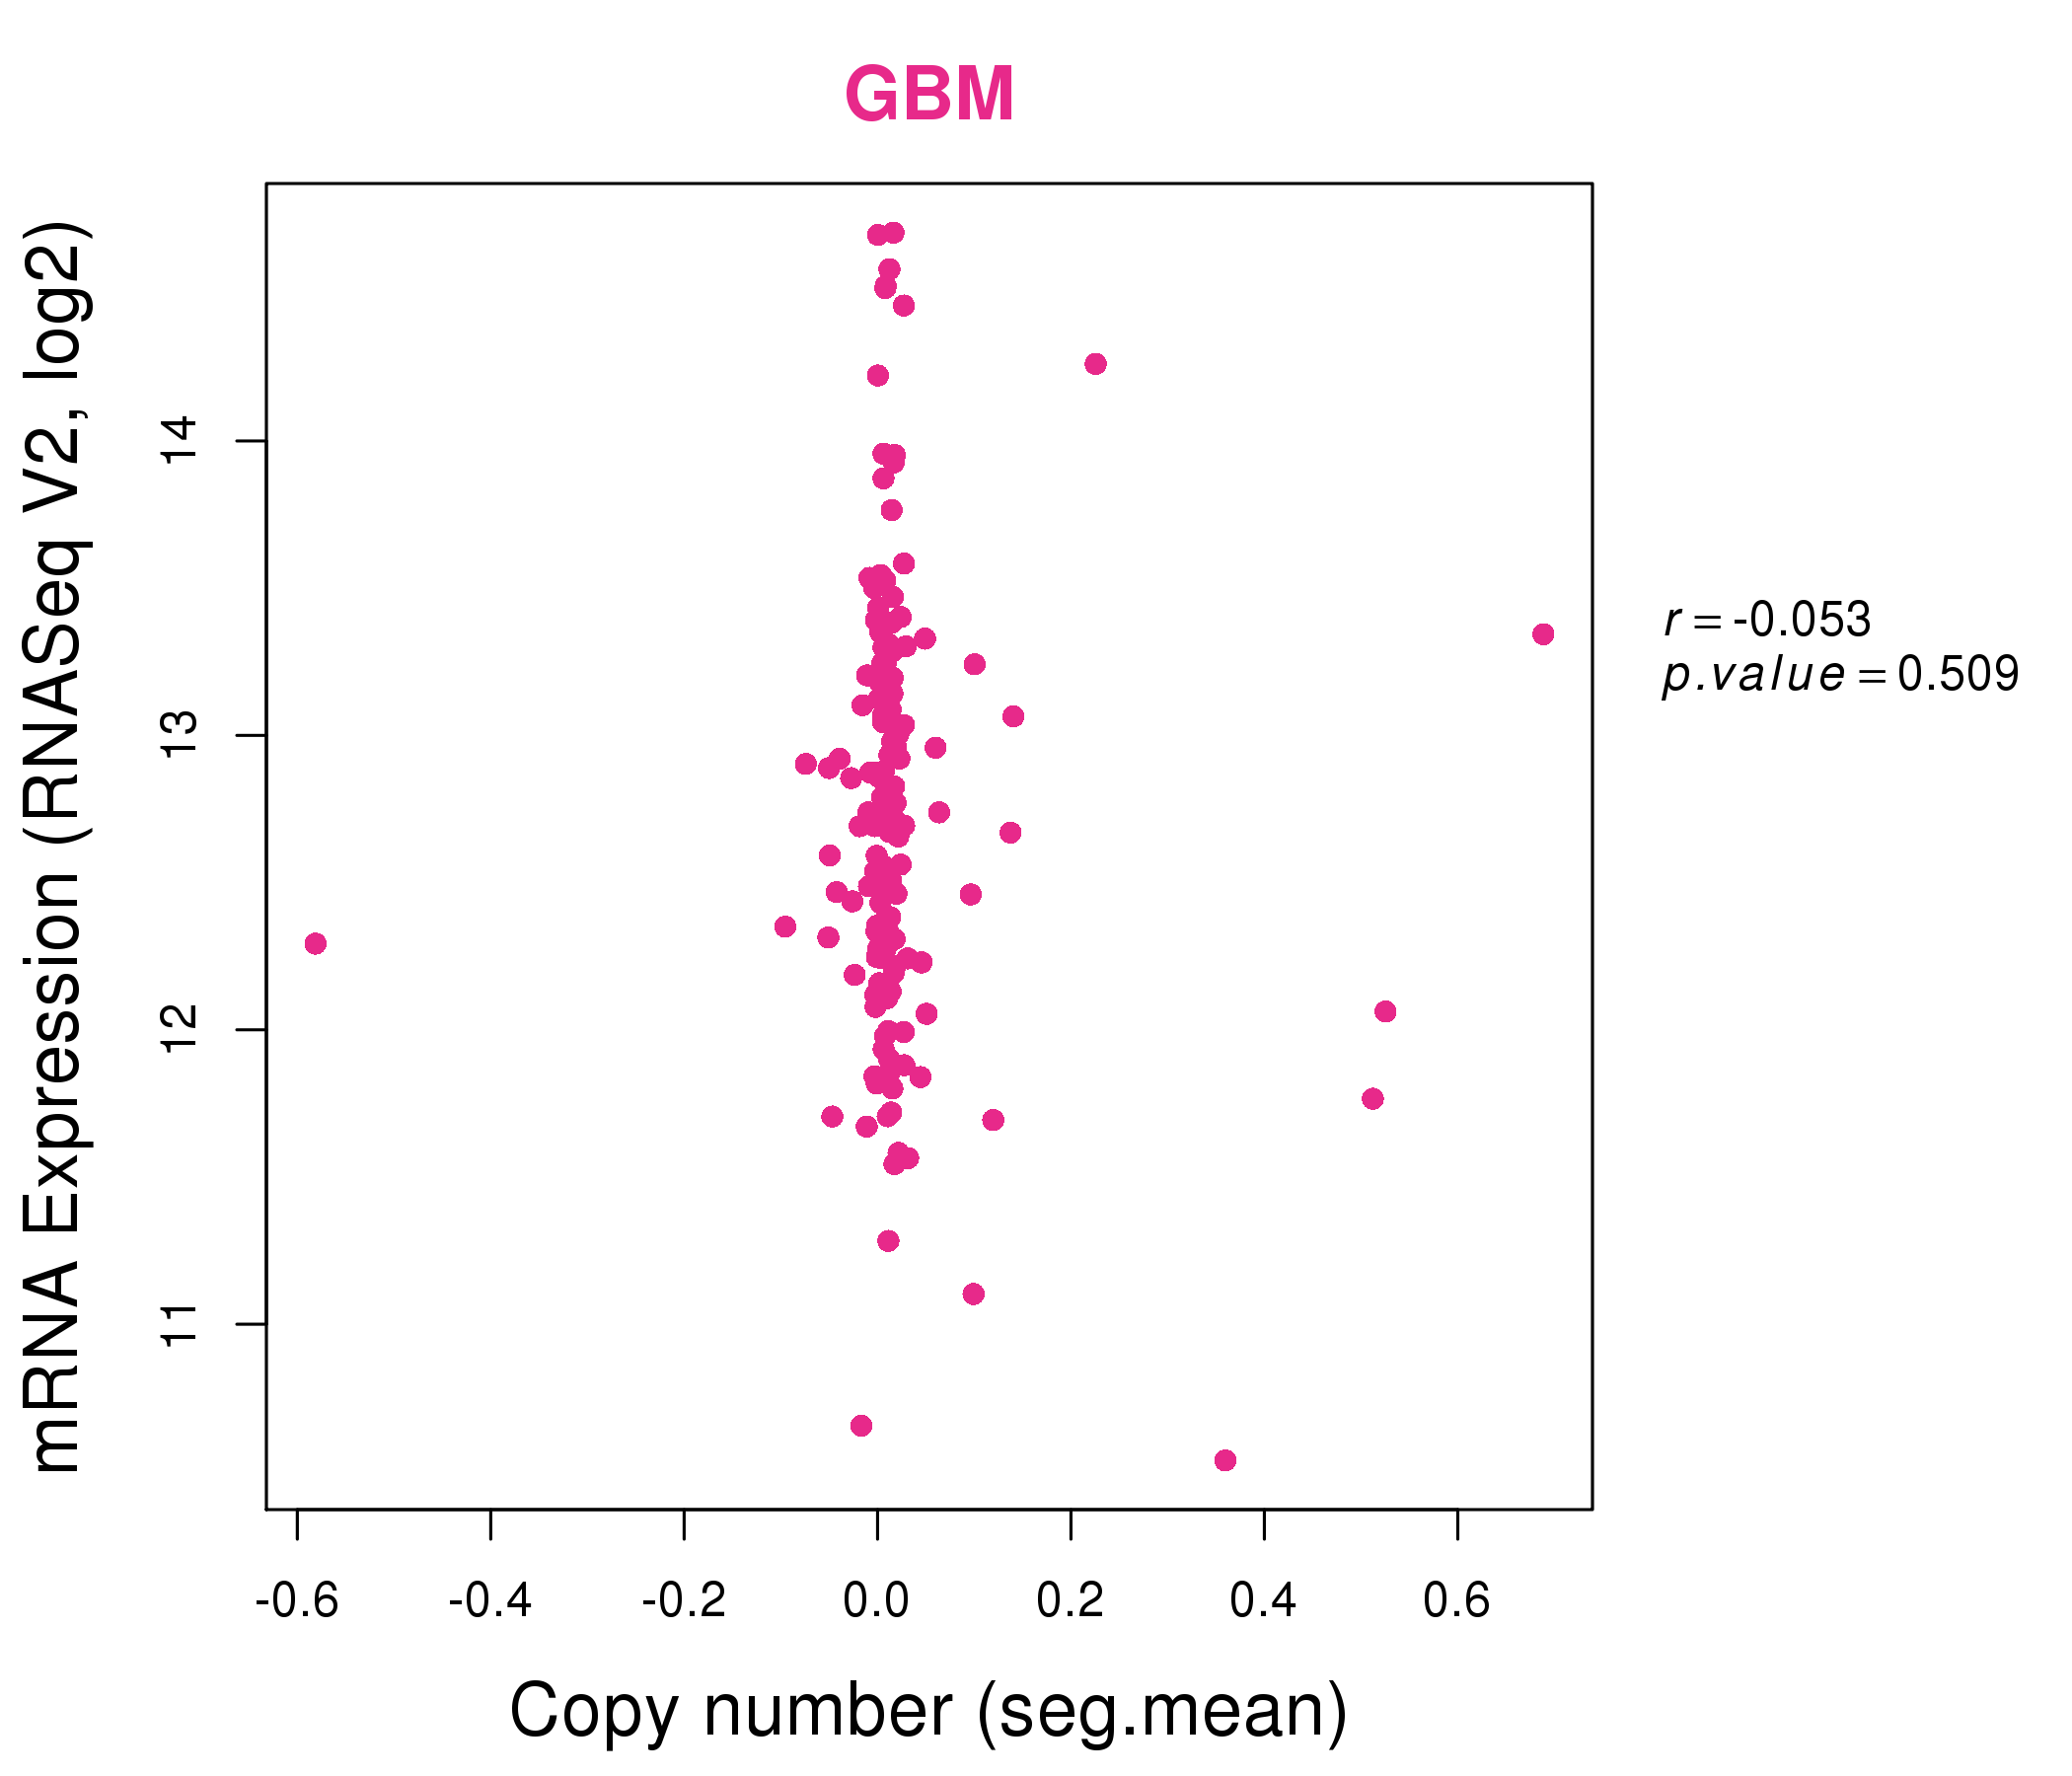
| * This plots show the correlation between CNV and gene expression. |
: Open all plots for all cancer types
 |
|
 |
|
| Top |
| Gene-Gene Network Information |
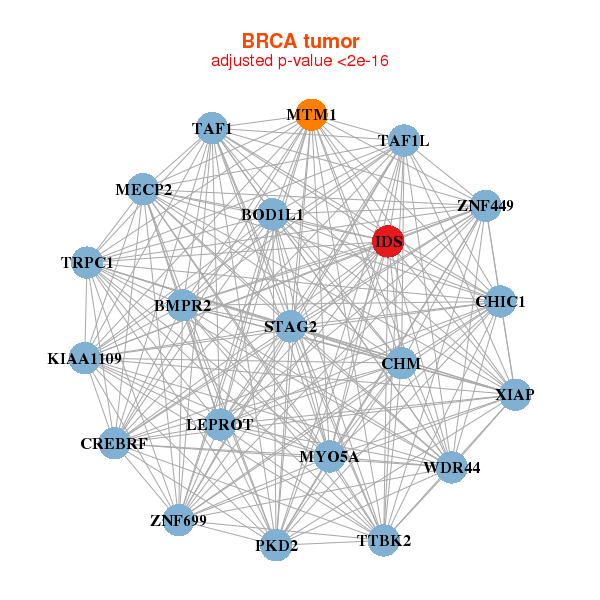
| * Co-Expression network figures were drawn using R package igraph. Only the top 20 genes with the highest correlations were shown. Red circle: input gene, orange circle: cell metabolism gene, sky circle: other gene |
: Open all plots for all cancer types
 |
|
| BMPR2,BOD1L1,CREBRF,CHIC1,CHM,IDS,KIAA1109, LEPROT,MECP2,MTM1,MYO5A,PKD2,STAG2,TAF1, TAF1L,TRPC1,TTBK2,WDR44,XIAP,ZNF449,ZNF699 | ACAP2,AKT3,BBS7,C16orf52,CA5B,CAMSAP2,CEP120, CHIC1,FAM135A,IDS,KDSR,KRAS,MALT1,MIER1, PAQR3,PCGF5,PJA2,TMEM30A,TRPC1,UBL3,ZDHHC17 |
 |
|
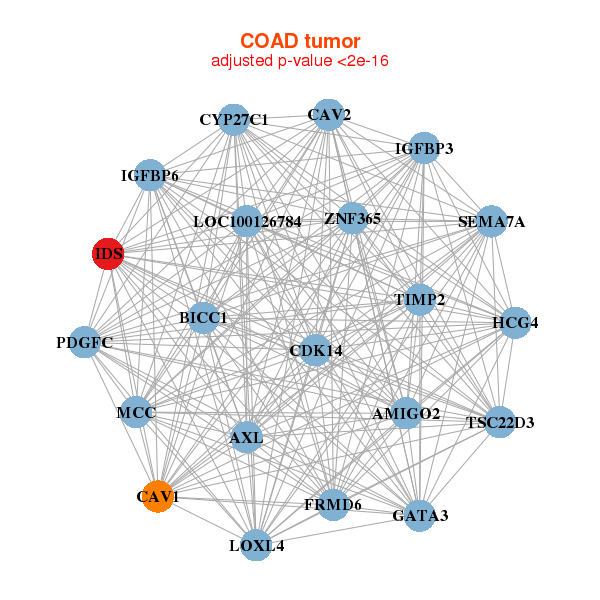
| AMIGO2,AXL,BICC1,CAV1,CAV2,CDK14,CYP27C1, FRMD6,GATA3,HCG4,IDS,IGFBP3,IGFBP6,LOC100126784, LOXL4,MCC,PDGFC,SEMA7A,TIMP2,TSC22D3,ZNF365 | ABCD1,CDIP1,CDC42EP4,CRY2,FOXN3,GABARAPL1,GATSL1, GTF2IP1,HOXC5,IDS,MAOB,MED29,MGC45800,PLA2G4C, RAB11FIP3,SERINC1,SORCS3,STAT6,TBC1D13,TMEM25,TPPP |
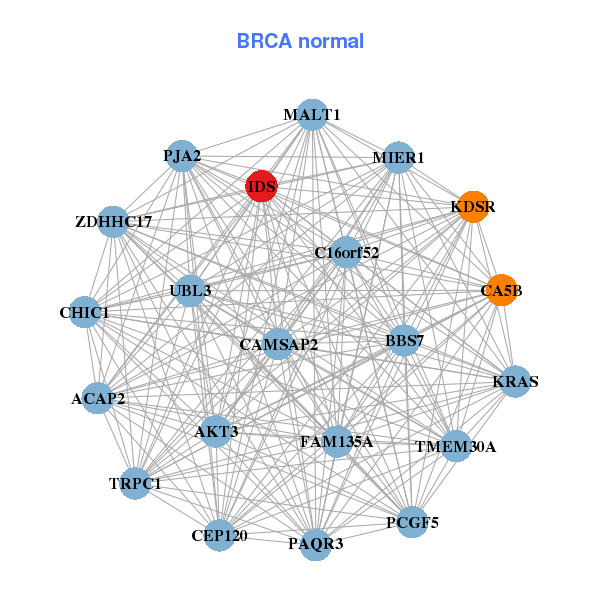
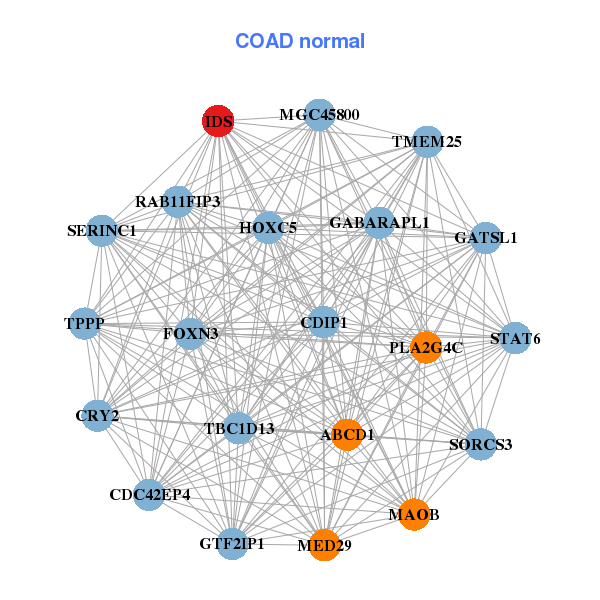
| * Co-Expression network figures were drawn using R package igraph. Only the top 20 genes with the highest correlations were shown. Red circle: input gene, orange circle: cell metabolism gene, sky circle: other gene |
: Open all plots for all cancer types
| Top |
: Open all interacting genes' information including KEGG pathway for all interacting genes from DAVID
| Top |
| Pharmacological Information for IDS |
| There's no related Drug. |
| Top |
| Cross referenced IDs for IDS |
| * We obtained these cross-references from Uniprot database. It covers 150 different DBs, 18 categories. http://www.uniprot.org/help/cross_references_section |
: Open all cross reference information
|
Copyright © 2016-Present - The Univsersity of Texas Health Science Center at Houston @ |