|
||||||||||||||||||||
| |
| Phenotypic Information (metabolism pathway, cancer, disease, phenome) |
| |
| |
| Gene-Gene Network Information: Co-Expression Network, Interacting Genes & KEGG |
| |
|


| Gene Summary for APOC2 |
| Basic gene info. | Gene symbol | APOC2 |
| Gene name | apolipoprotein C-II | |
| Synonyms | APO-CII|APOC-II | |
| Cytomap | UCSC genome browser: 19q13.2 | |
| Genomic location | chr19 :45449238-45452822 | |
| Type of gene | protein-coding | |
| RefGenes | NM_000483.4, | |
| Ensembl id | ENSG00000224916 | |
| Description | apolipoprotein C2 | |
| Modification date | 20141207 | |
| dbXrefs | MIM : 608083 | |
| HGNC : HGNC | ||
| Ensembl : ENSG00000224916 | ||
| HPRD : 07457 | ||
| Protein | UniProt: go to UniProt's Cross Reference DB Table | |
| Expression | CleanEX: HS_APOC2 | |
| BioGPS: 344 | ||
| Gene Expression Atlas: ENSG00000224916 | ||
| The Human Protein Atlas: ENSG00000224916 | ||
| Pathway | NCI Pathway Interaction Database: APOC2 | |
| KEGG: APOC2 | ||
| REACTOME: APOC2 | ||
| ConsensusPathDB | ||
| Pathway Commons: APOC2 | ||
| Metabolism | MetaCyc: APOC2 | |
| HUMANCyc: APOC2 | ||
| Regulation | Ensembl's Regulation: ENSG00000224916 | |
| miRBase: chr19 :45,449,238-45,452,822 | ||
| TargetScan: NM_000483 | ||
| cisRED: ENSG00000224916 | ||
| Context | iHOP: APOC2 | |
| cancer metabolism search in PubMed: APOC2 | ||
| UCL Cancer Institute: APOC2 | ||
| Assigned class in ccmGDB | C | |
| Top |
| Phenotypic Information for APOC2(metabolism pathway, cancer, disease, phenome) |
| Cancer | CGAP: APOC2 |
| Familial Cancer Database: APOC2 | |
| * This gene is included in those cancer gene databases. |
|
|
|
|
|
| . | ||||||||||||||
Oncogene 1 | Significant driver gene in | |||||||||||||||||||
| cf) number; DB name 1 Oncogene; http://nar.oxfordjournals.org/content/35/suppl_1/D721.long, 2 Tumor Suppressor gene; https://bioinfo.uth.edu/TSGene/, 3 Cancer Gene Census; http://www.nature.com/nrc/journal/v4/n3/abs/nrc1299.html, 4 CancerGenes; http://nar.oxfordjournals.org/content/35/suppl_1/D721.long, 5 Network of Cancer Gene; http://ncg.kcl.ac.uk/index.php, 1Therapeutic Vulnerabilities in Cancer; http://cbio.mskcc.org/cancergenomics/statius/ |
| REACTOME_METABOLISM_OF_LIPIDS_AND_LIPOPROTEINS REACTOME_LIPOPROTEIN_METABOLISM | |
| OMIM | |
| Orphanet | |
| Disease | KEGG Disease: APOC2 |
| MedGen: APOC2 (Human Medical Genetics with Condition) | |
| ClinVar: APOC2 | |
| Phenotype | MGI: APOC2 (International Mouse Phenotyping Consortium) |
| PhenomicDB: APOC2 | |
| Mutations for APOC2 |
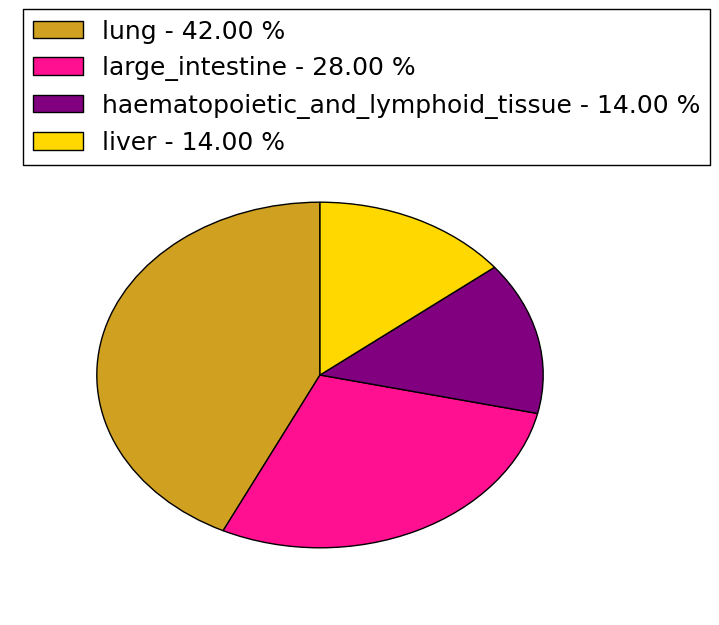
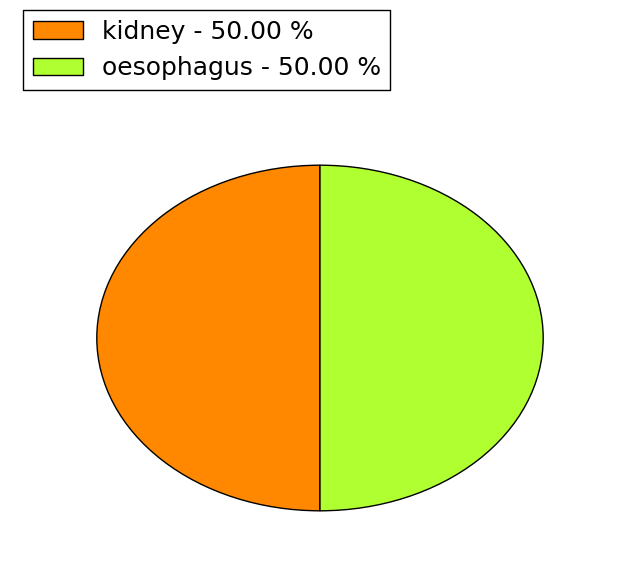
| * Under tables are showing count per each tissue to give us broad intuition about tissue specific mutation patterns.You can go to the detailed page for each mutation database's web site. |
| There's no structural variation information in COSMIC data for this gene. |
| * From mRNA Sanger sequences, Chitars2.0 arranged chimeric transcripts. This table shows APOC2 related fusion information. |
| ID | Head Gene | Tail Gene | Accession | Gene_a | qStart_a | qEnd_a | Chromosome_a | tStart_a | tEnd_a | Gene_a | qStart_a | qEnd_a | Chromosome_a | tStart_a | tEnd_a |
| Top |
| There's no copy number variation information in COSMIC data for this gene. |
| Top |
|
 |
| Top |
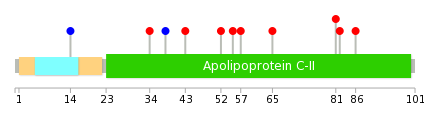
| Stat. for Non-Synonymous SNVs (# total SNVs=7) | (# total SNVs=2) |
 |  |
(# total SNVs=0) | (# total SNVs=0) |
| Top |
| * When you move the cursor on each content, you can see more deailed mutation information on the Tooltip. Those are primary_site,primary_histology,mutation(aa),pubmedID. |
| GRCh37 position | Mutation(aa) | Unique sampleID count |
| chr19:45452065-45452065 | p.A55T | 1 |
| chr19:45452071-45452071 | p.N57D | 1 |
| chr19:45452096-45452096 | p.P65L | 1 |
| chr19:45452442-45452442 | p.A81D | 1 |
| chr19:45452446-45452446 | p.M82I | 1 |
| chr19:45452457-45452457 | p.T86K | 1 |
| chr19:45451775-45451775 | p.L14L | 1 |
| chr19:45452505-45452505 | p.*102L | 1 |
| chr19:45452002-45452002 | p.P34S | 1 |
| chr19:45452016-45452016 | p.T38T | 1 |
| Top |
|
 |
| Point Mutation/ Tissue ID | 1 | 2 | 3 | 4 | 5 | 6 | 7 | 8 | 9 | 10 | 11 | 12 | 13 | 14 | 15 | 16 | 17 | 18 | 19 | 20 |
| # sample | 1 | 2 | 1 | 2 | ||||||||||||||||
| # mutation | 1 | 2 | 1 | 2 | ||||||||||||||||
| nonsynonymous SNV | 1 | 2 | 1 | 2 | ||||||||||||||||
| synonymous SNV |
| cf) Tissue ID; Tissue type (1; BLCA[Bladder Urothelial Carcinoma], 2; BRCA[Breast invasive carcinoma], 3; CESC[Cervical squamous cell carcinoma and endocervical adenocarcinoma], 4; COAD[Colon adenocarcinoma], 5; GBM[Glioblastoma multiforme], 6; Glioma Low Grade, 7; HNSC[Head and Neck squamous cell carcinoma], 8; KICH[Kidney Chromophobe], 9; KIRC[Kidney renal clear cell carcinoma], 10; KIRP[Kidney renal papillary cell carcinoma], 11; LAML[Acute Myeloid Leukemia], 12; LUAD[Lung adenocarcinoma], 13; LUSC[Lung squamous cell carcinoma], 14; OV[Ovarian serous cystadenocarcinoma ], 15; PAAD[Pancreatic adenocarcinoma], 16; PRAD[Prostate adenocarcinoma], 17; SKCM[Skin Cutaneous Melanoma], 18:STAD[Stomach adenocarcinoma], 19:THCA[Thyroid carcinoma], 20:UCEC[Uterine Corpus Endometrial Carcinoma]) |
| Top |
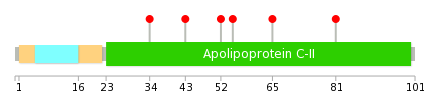
| * We represented just top 10 SNVs. When you move the cursor on each content, you can see more deailed mutation information on the Tooltip. Those are primary_site, primary_histology, mutation(aa), pubmedID. |
| Genomic Position | Mutation(aa) | Unique sampleID count |
| chr19:45452442 | p.P34S | 1 |
| chr19:45452002 | p.S43C | 1 |
| chr19:45452030 | p.K52N | 1 |
| chr19:45452058 | p.A55V | 1 |
| chr19:45452066 | p.P65L | 1 |
| chr19:45452096 | p.A81D | 1 |
| * Copy number data were extracted from TCGA using R package TCGA-Assembler. The URLs of all public data files on TCGA DCC data server were gathered on Jan-05-2015. Function ProcessCNAData in TCGA-Assembler package was used to obtain gene-level copy number value which is calculated as the average copy number of the genomic region of a gene. |
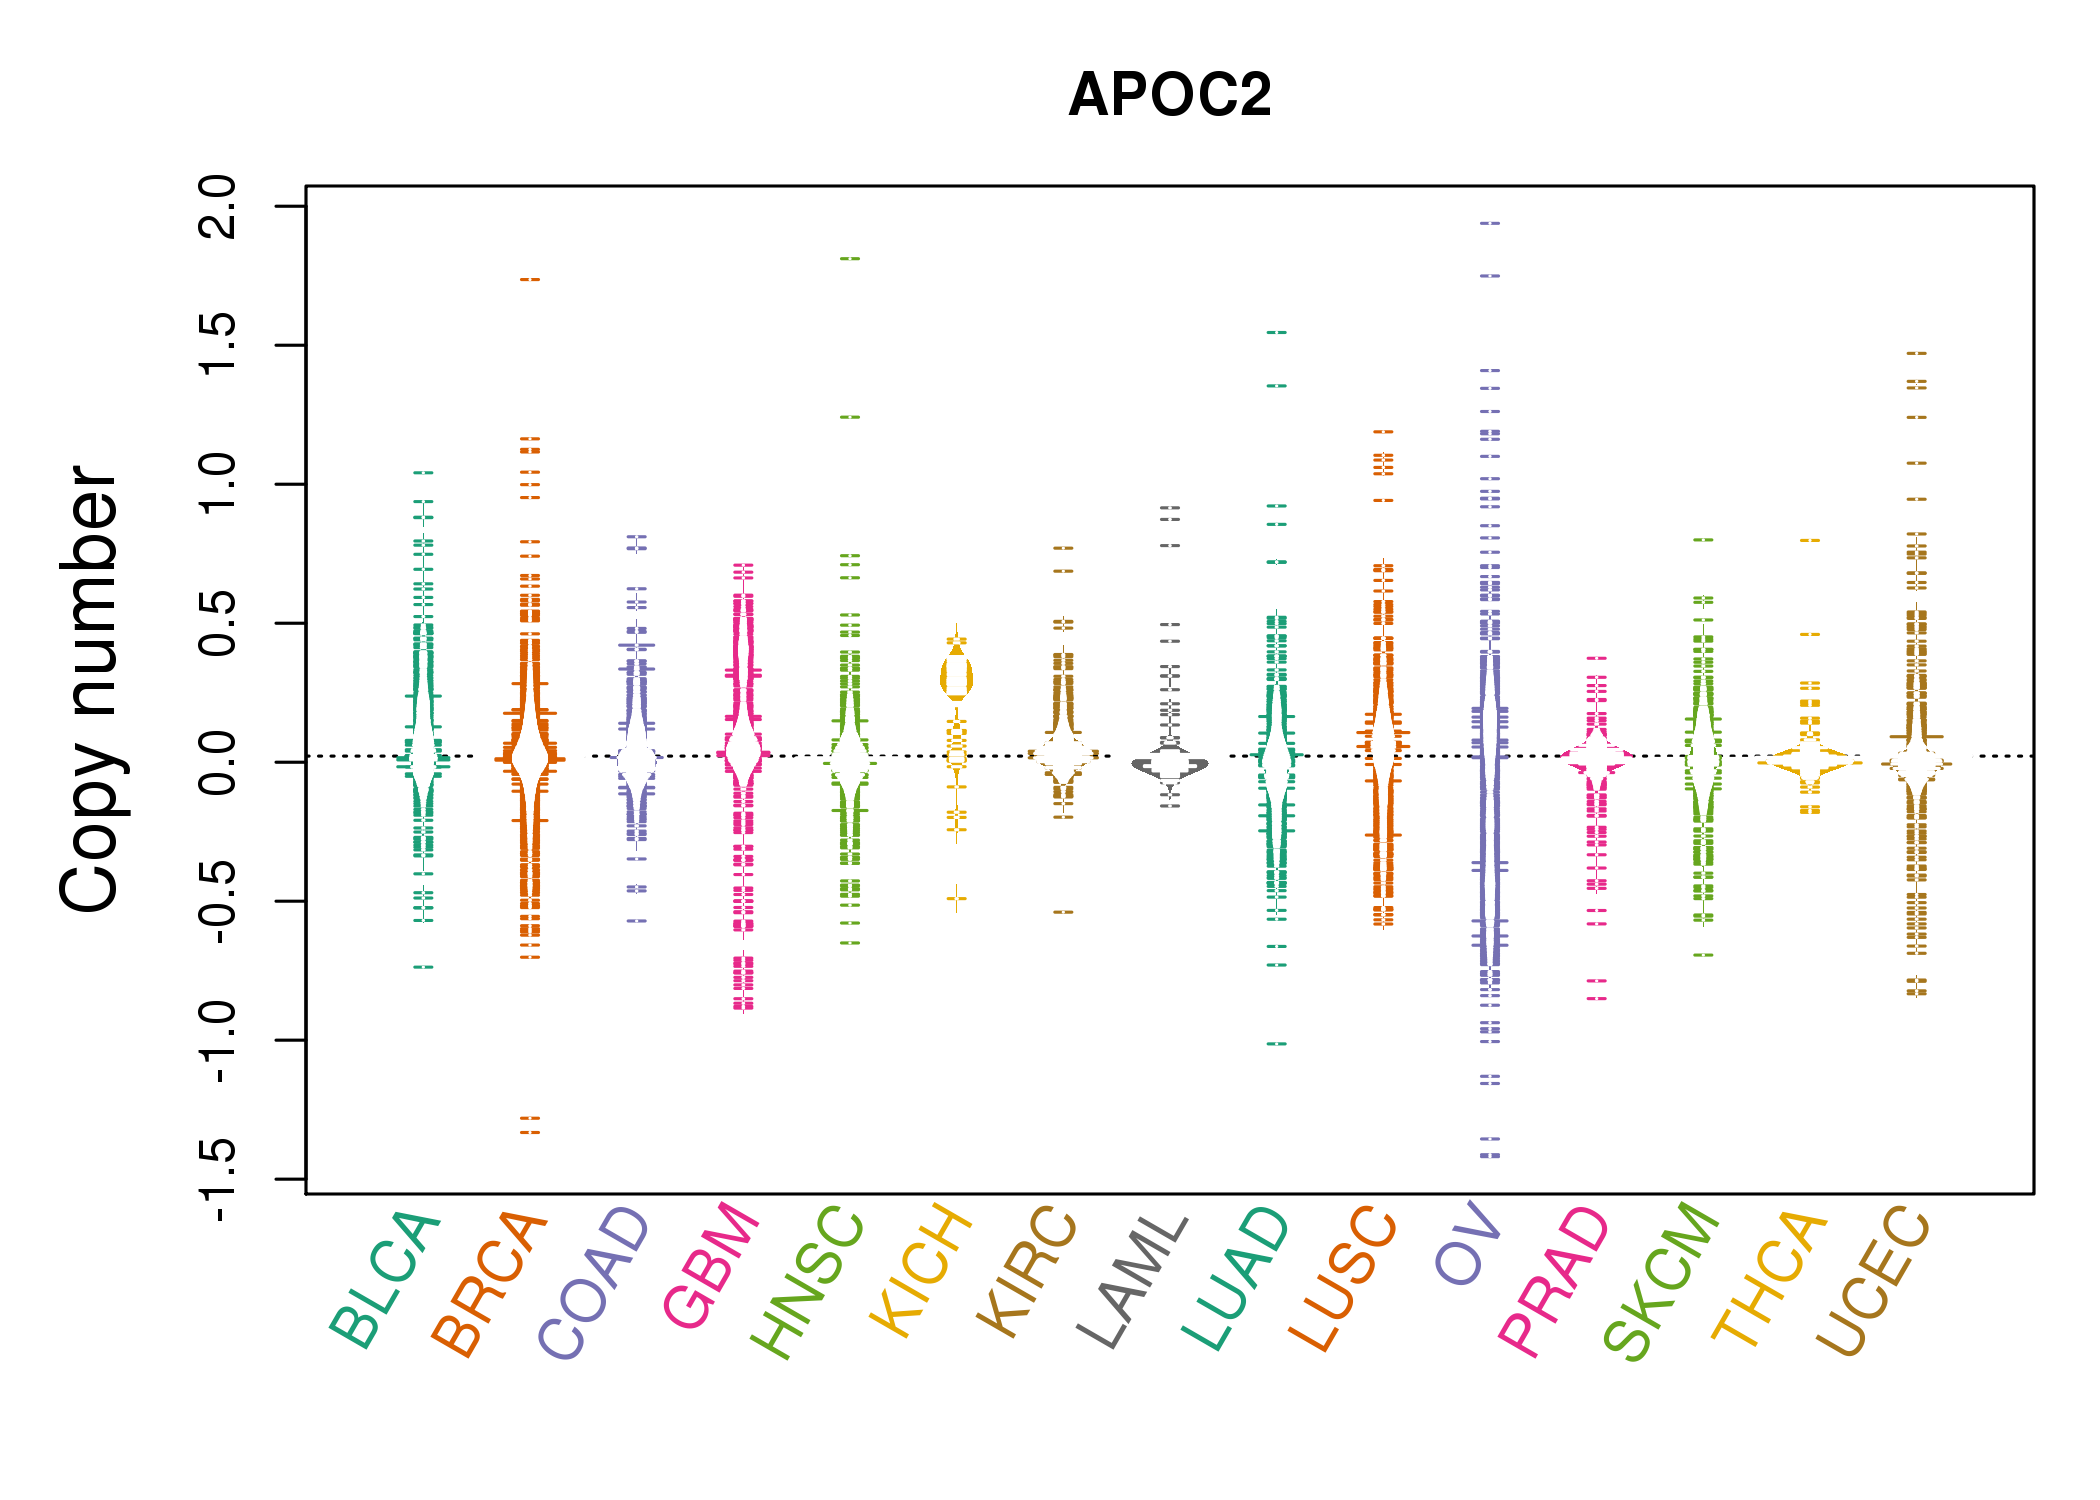 |
| cf) Tissue ID[Tissue type]: BLCA[Bladder Urothelial Carcinoma], BRCA[Breast invasive carcinoma], CESC[Cervical squamous cell carcinoma and endocervical adenocarcinoma], COAD[Colon adenocarcinoma], GBM[Glioblastoma multiforme], Glioma Low Grade, HNSC[Head and Neck squamous cell carcinoma], KICH[Kidney Chromophobe], KIRC[Kidney renal clear cell carcinoma], KIRP[Kidney renal papillary cell carcinoma], LAML[Acute Myeloid Leukemia], LUAD[Lung adenocarcinoma], LUSC[Lung squamous cell carcinoma], OV[Ovarian serous cystadenocarcinoma ], PAAD[Pancreatic adenocarcinoma], PRAD[Prostate adenocarcinoma], SKCM[Skin Cutaneous Melanoma], STAD[Stomach adenocarcinoma], THCA[Thyroid carcinoma], UCEC[Uterine Corpus Endometrial Carcinoma] |
| Top |
| Gene Expression for APOC2 |
| * CCLE gene expression data were extracted from CCLE_Expression_Entrez_2012-10-18.res: Gene-centric RMA-normalized mRNA expression data. |
 |
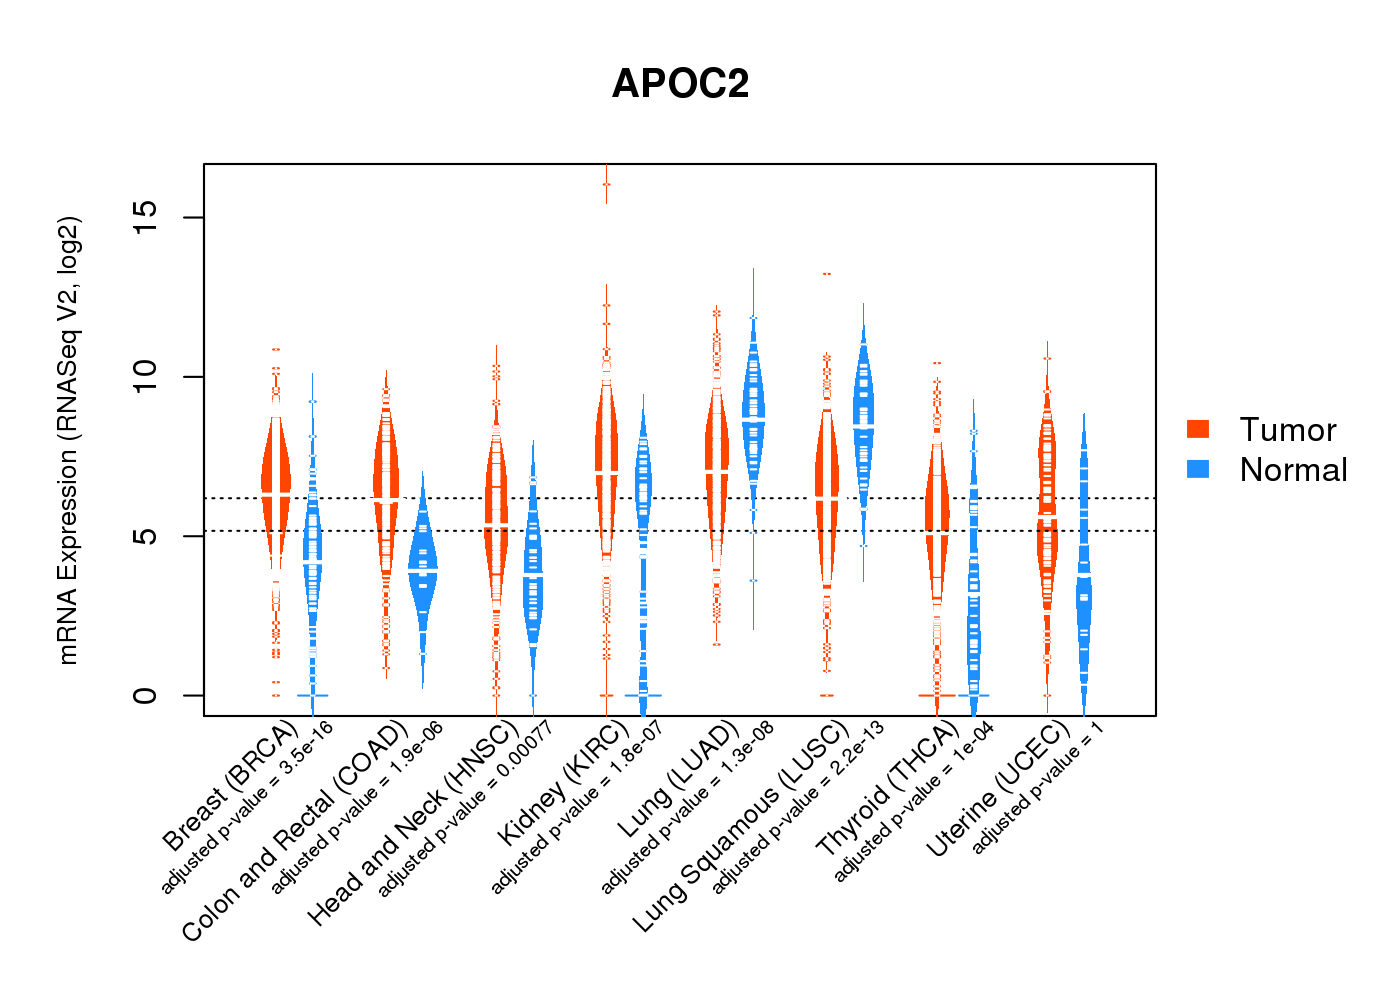
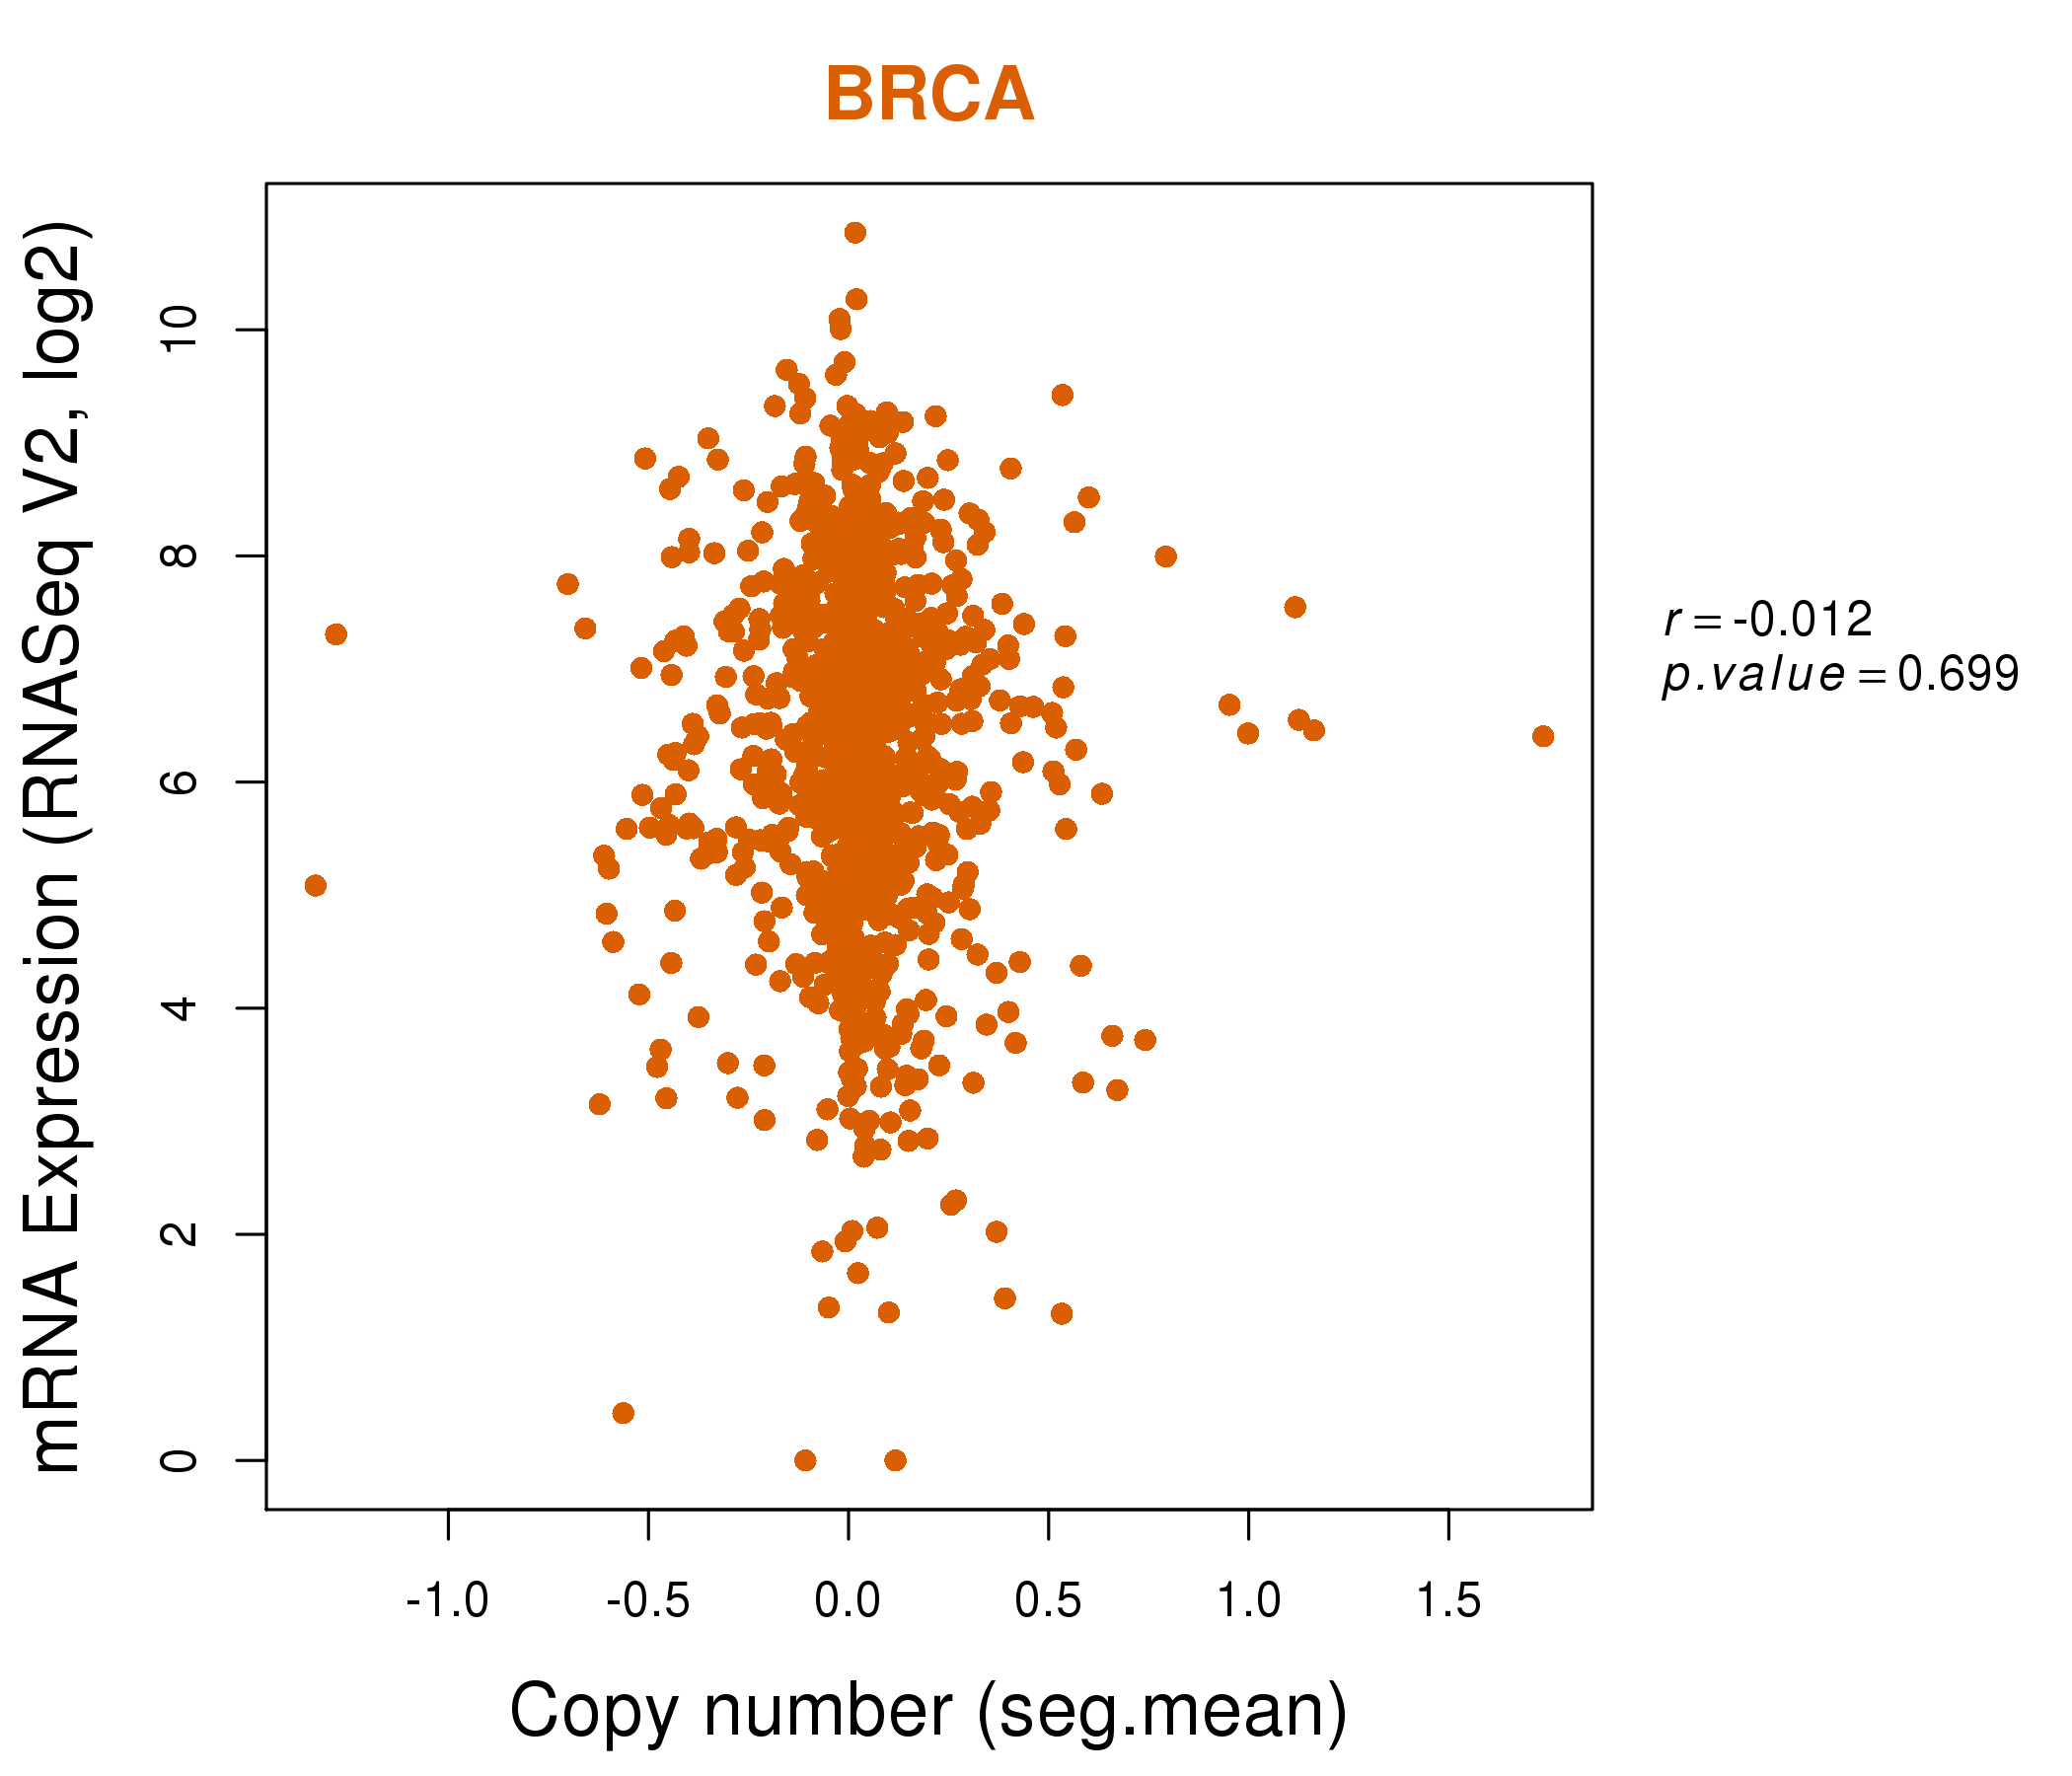
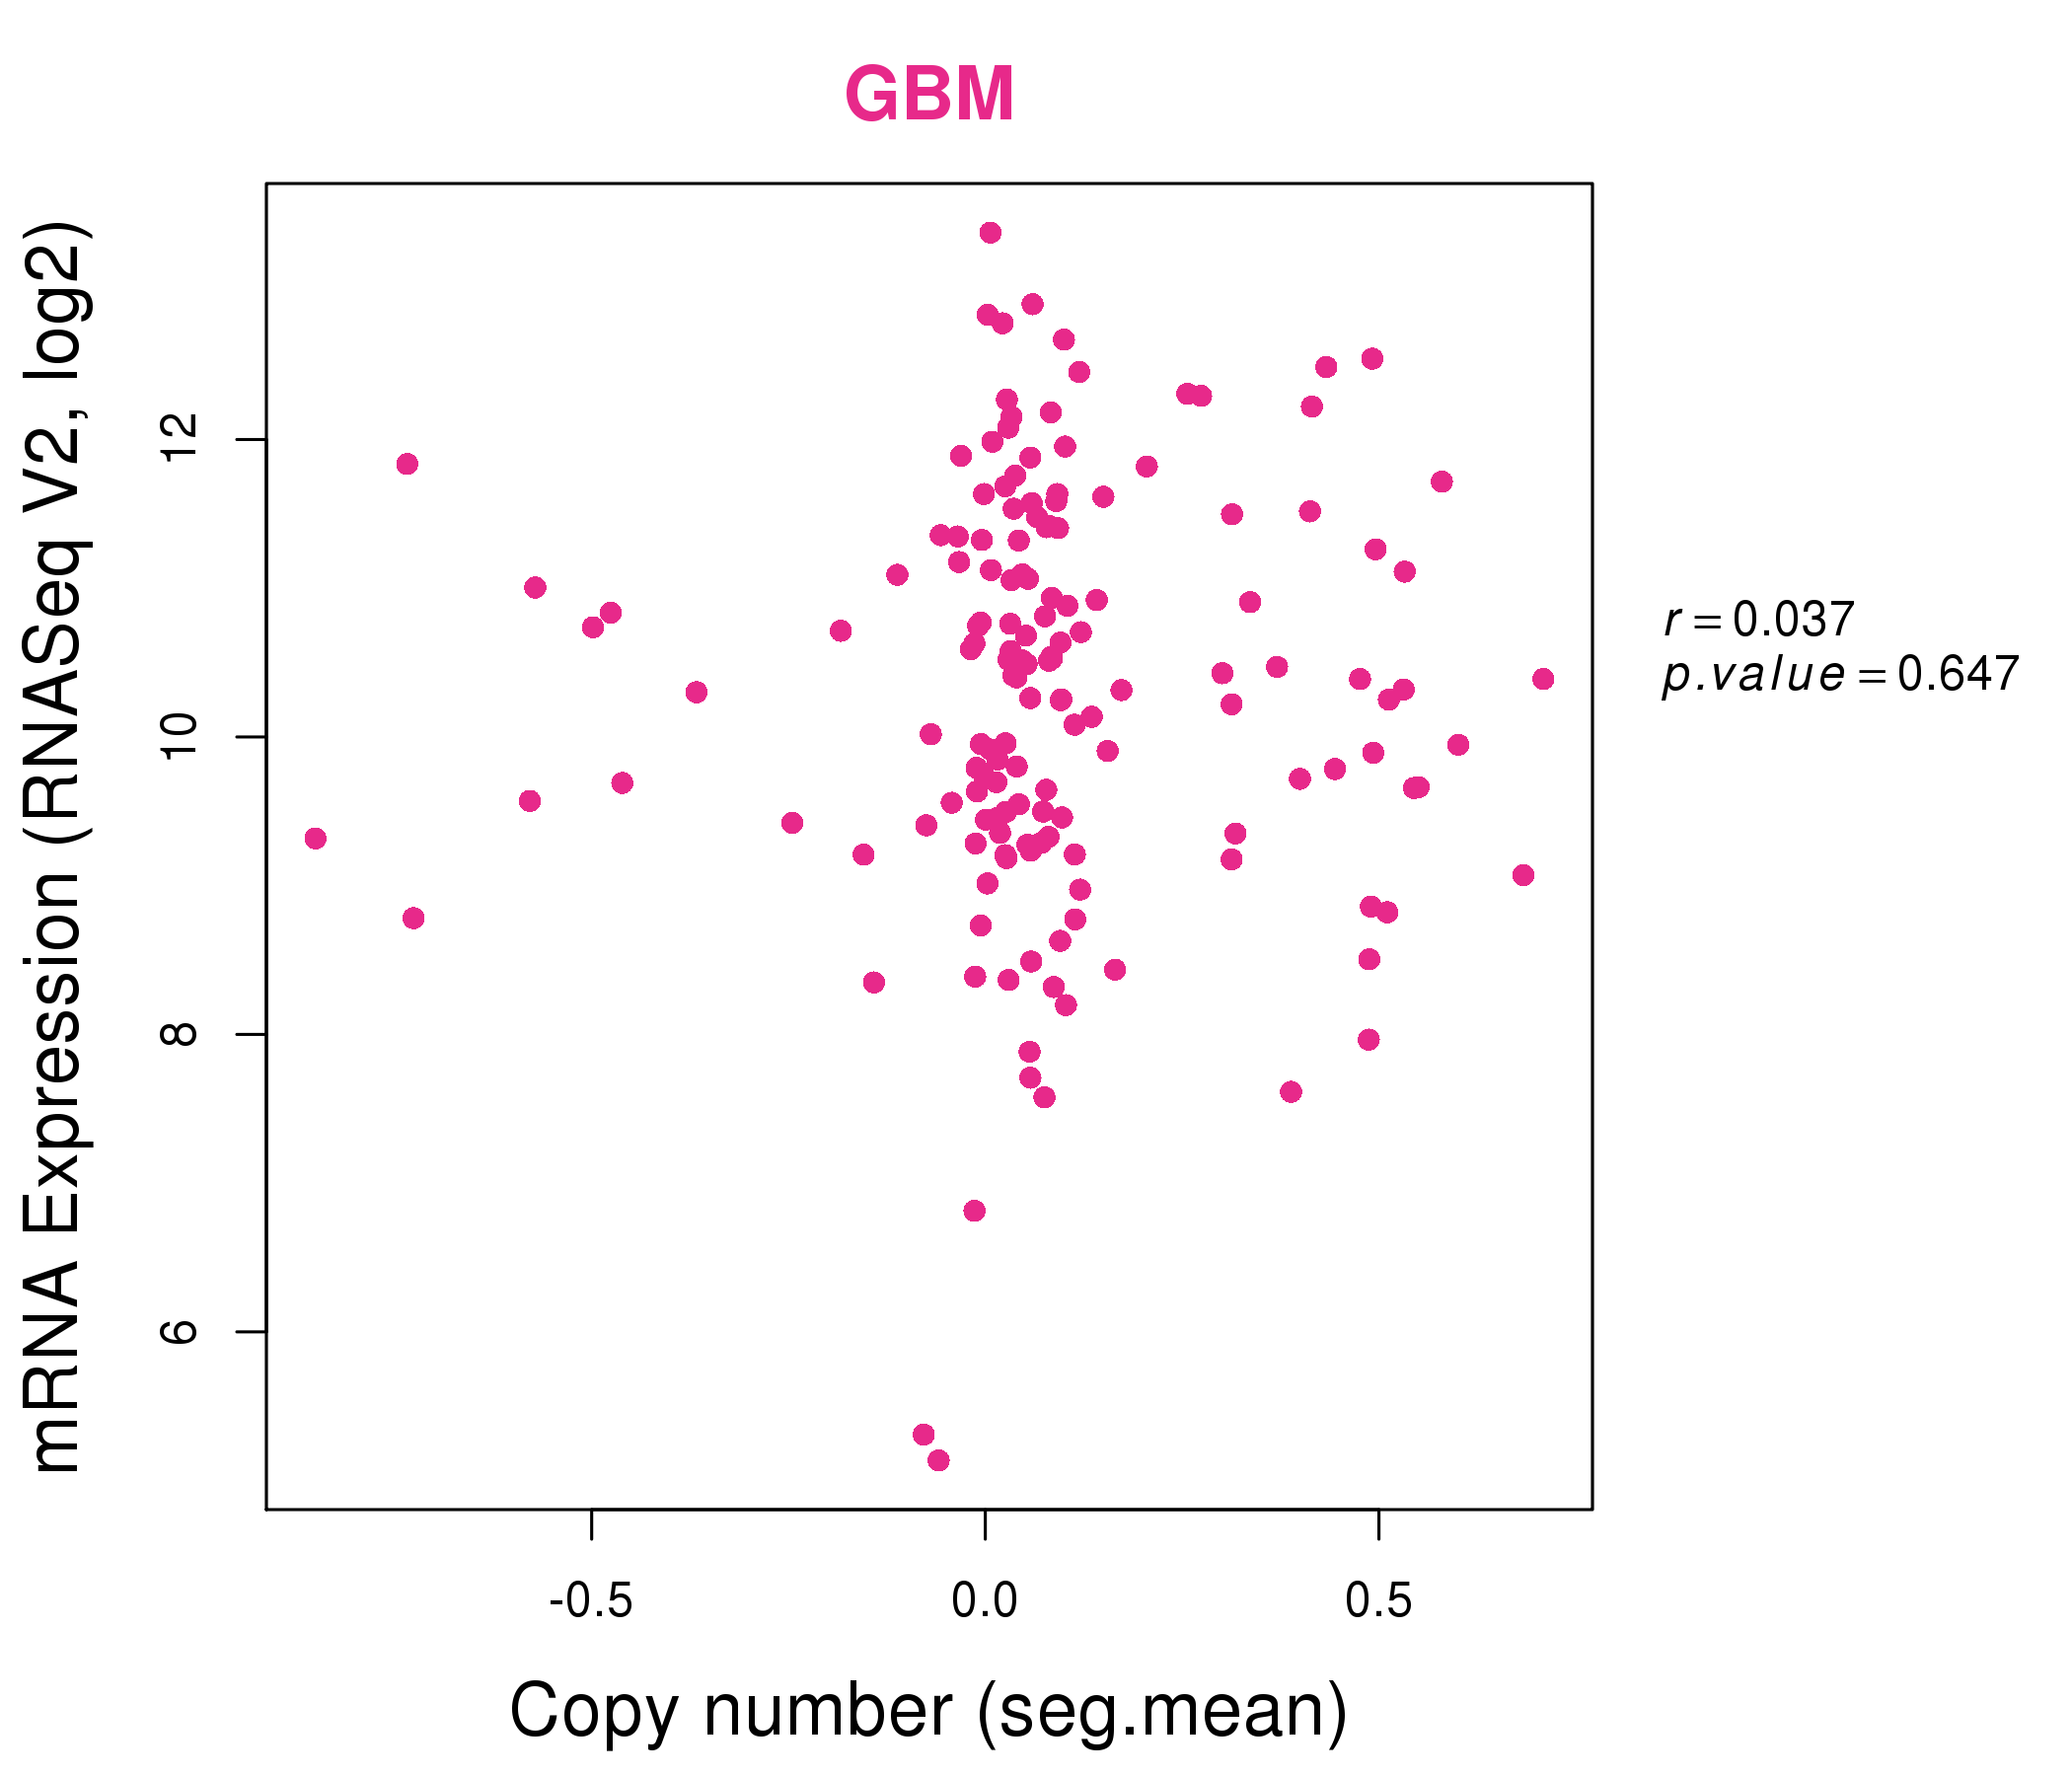
| * Normalized gene expression data of RNASeqV2 was extracted from TCGA using R package TCGA-Assembler. The URLs of all public data files on TCGA DCC data server were gathered at Jan-05-2015. Only eight cancer types have enough normal control samples for differential expression analysis. (t test, adjusted p<0.05 (using Benjamini-Hochberg FDR)) |
 |
| Top |
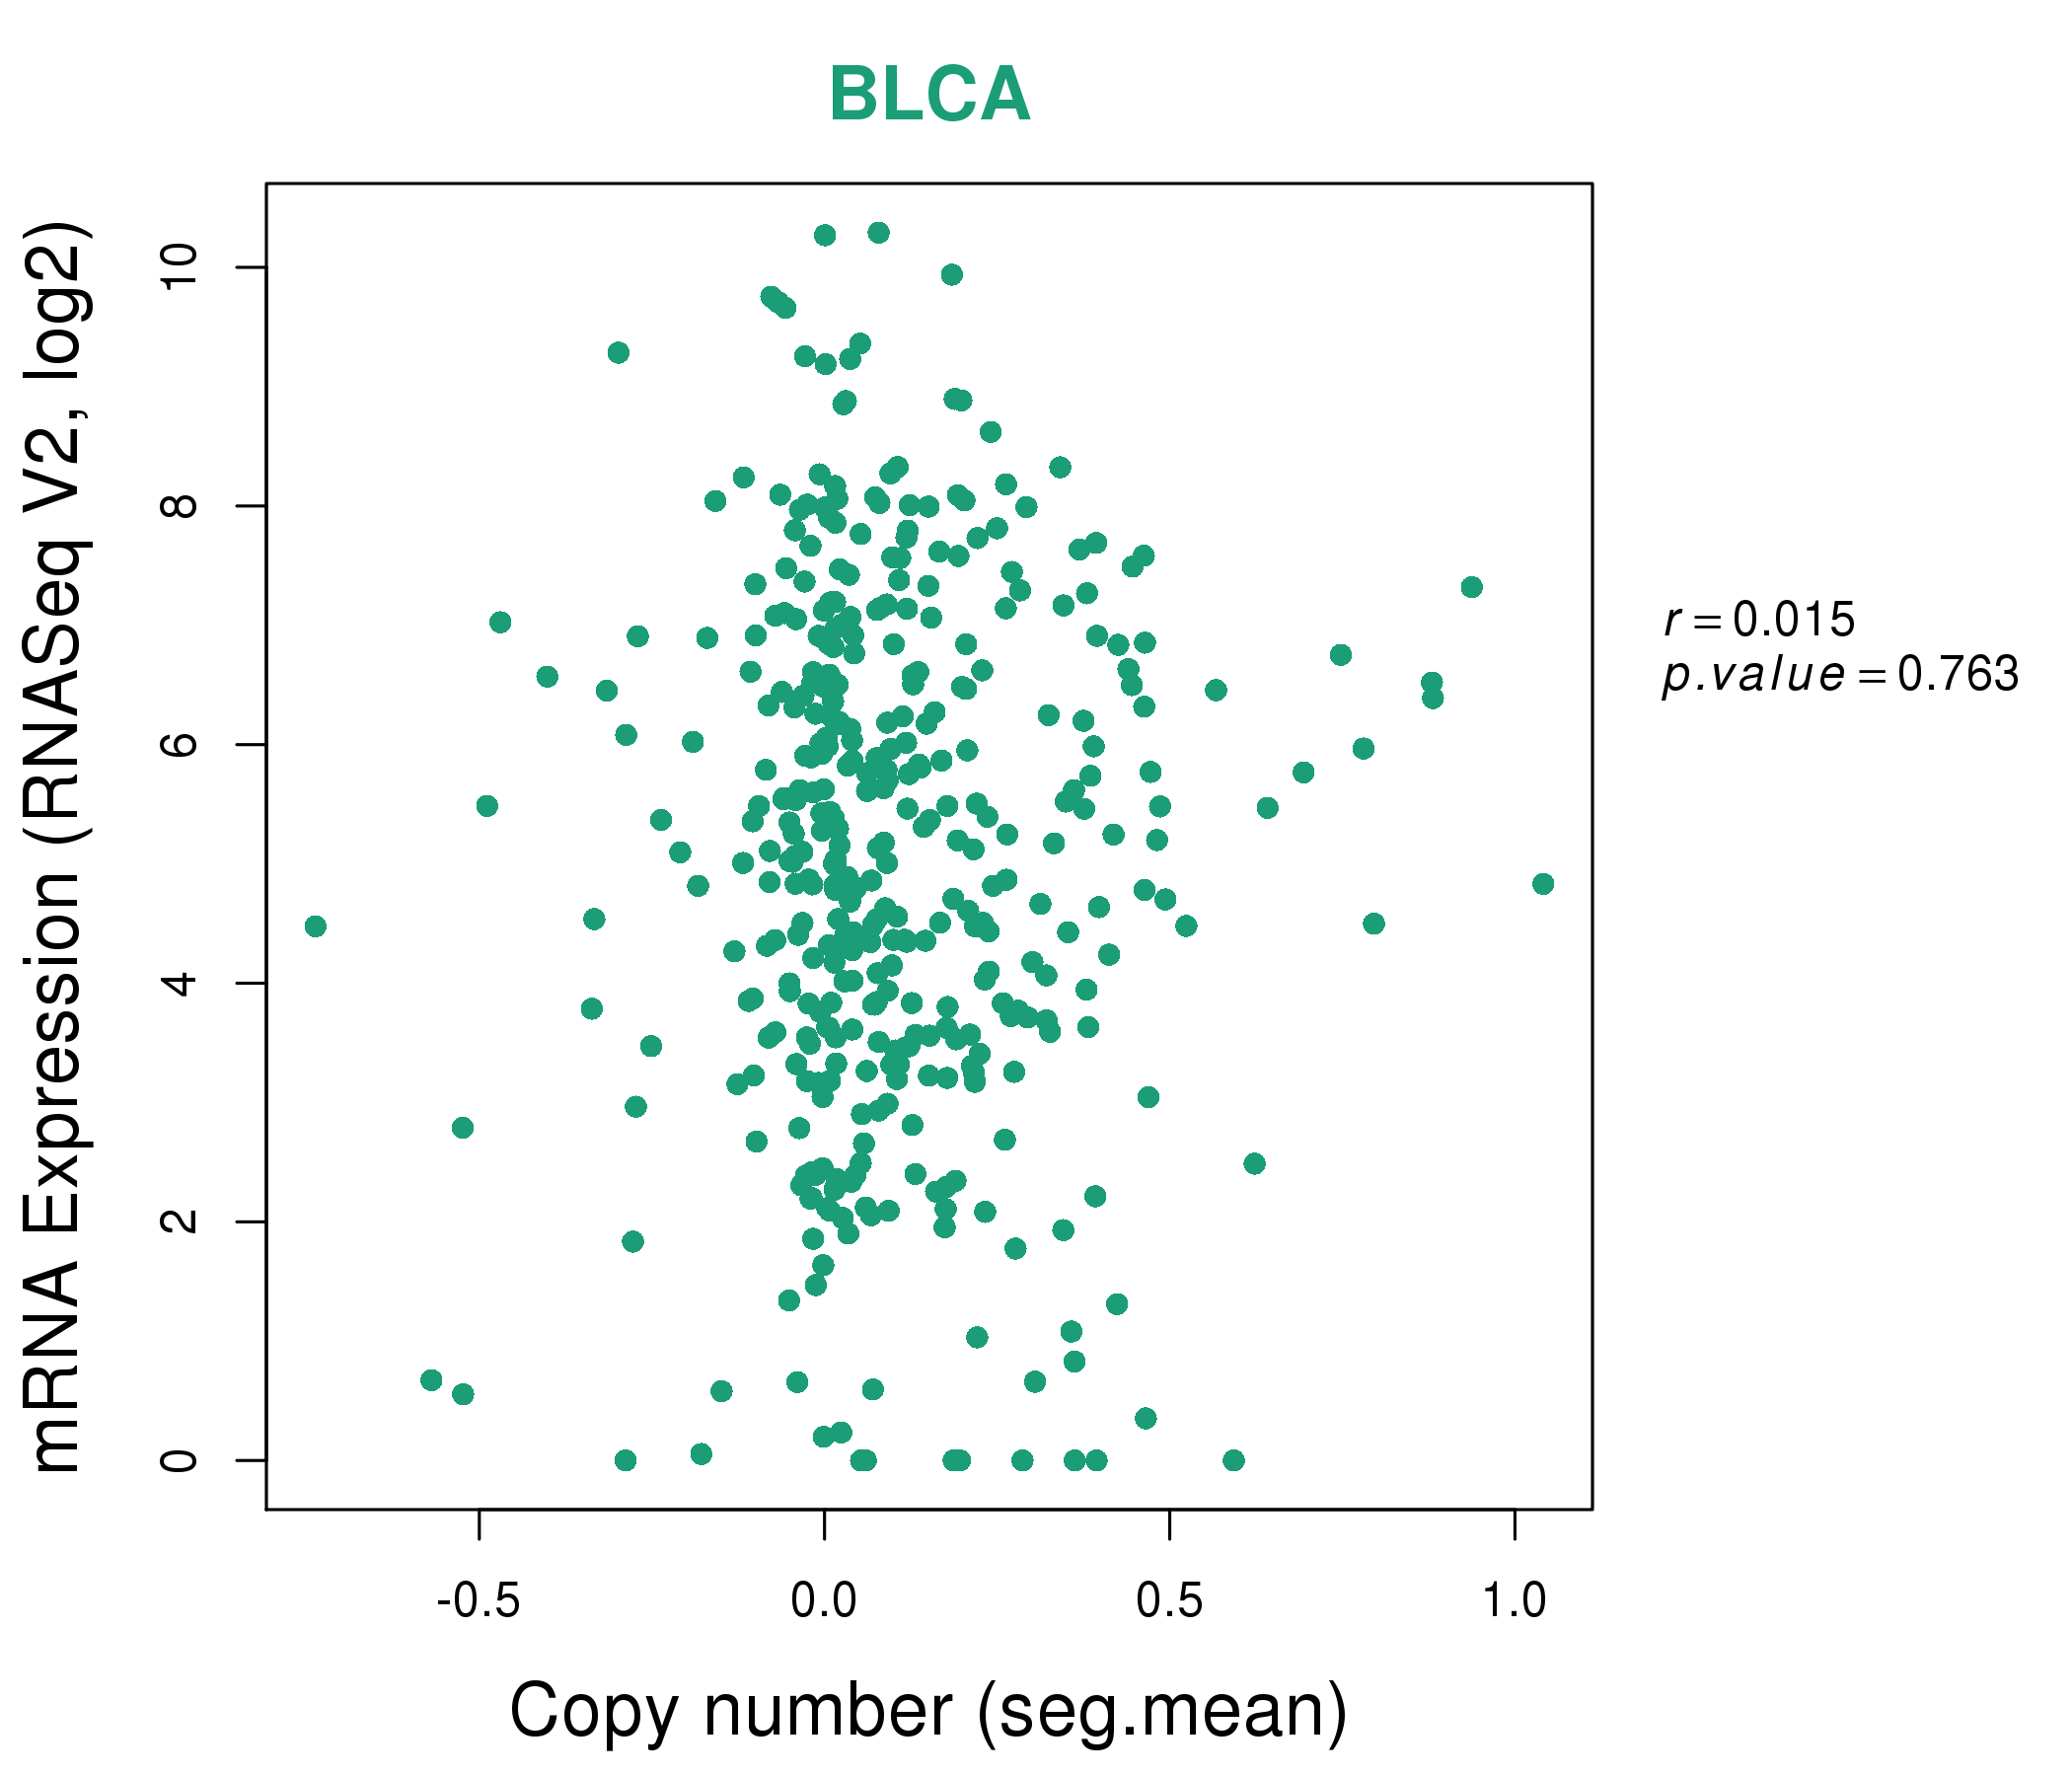
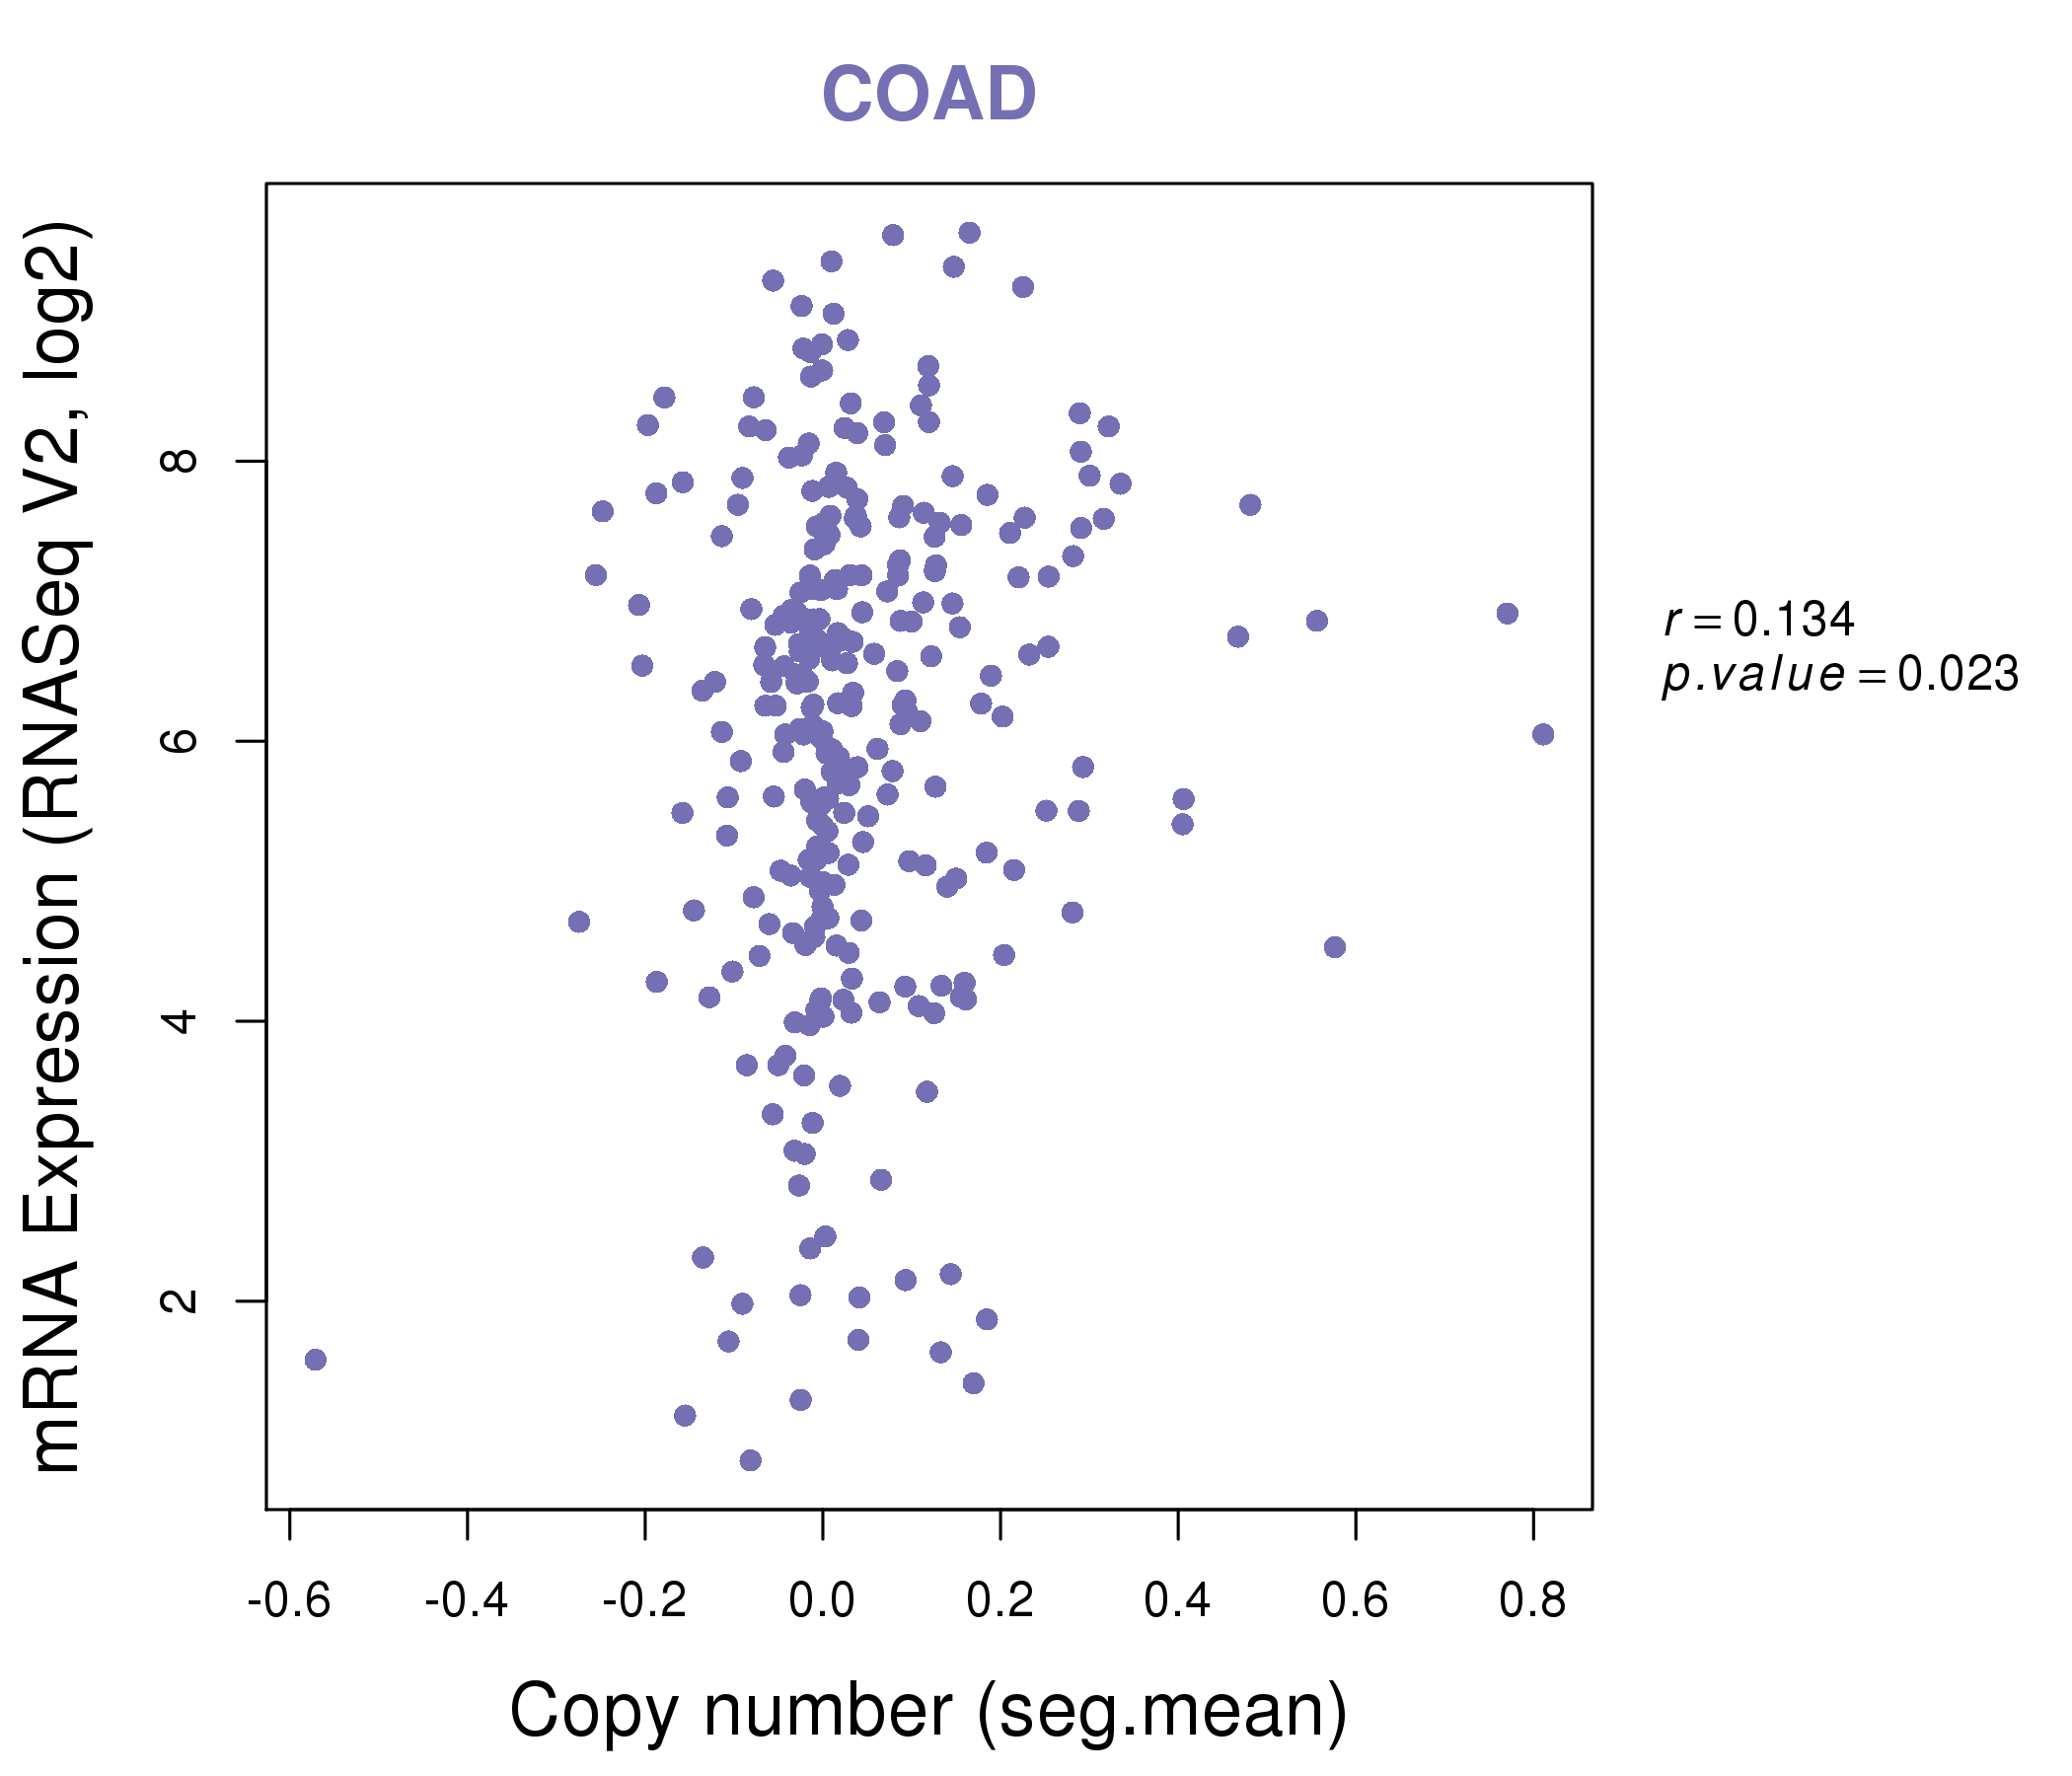
| * This plots show the correlation between CNV and gene expression. |
: Open all plots for all cancer types
 |
|
 |
|
| Top |
| Gene-Gene Network Information |
| * Co-Expression network figures were drawn using R package igraph. Only the top 20 genes with the highest correlations were shown. Red circle: input gene, orange circle: cell metabolism gene, sky circle: other gene |
: Open all plots for all cancer types
 |
|
| APCS,APOA2,APOC2,APOC3,APOC4,ASGR2,C8A, C9,CA5A,CATSPER1,CREB3L3,CRP,F2,FABP1, HAMP,HP,ITIH1,ITIH3,PLG,SERPINC1,TM4SF5 | ADAM8,SOWAHD,APOC1,APOC2,ATP6V0D2,BIRC7,CD300LF, CHIT1,DNAJC5B,HS3ST2,HTRA4,ITGAD,LILRA4,MEP1A, PDE6G,PKD2L1,RAB42,SCN10A,SDS,SLC6A7,SPATA12 |
 |
|
| ACP5,APOC1,APOC2,APOE,BCAM,CTSZ,DFNA5, EVA1B,GJC3,GPNMB,HSD17B14,KLHDC8B,LTBP3,OLR1, OSCAR,OTOA,PRAM1,TM4SF19,DCSTAMP,TREM2,TYROBP | ACE2,ALPI,APOC2,FUOM,CBR1,CIDEB,DGAT1, FADS6,FOXD1,KRT14,LOC148709,MMEL1,NAT8B,PDIA2, PLA2G12B,PLCB3,SIGLEC15,SLC15A1,SLC7A7,TMEM220,USH1G |

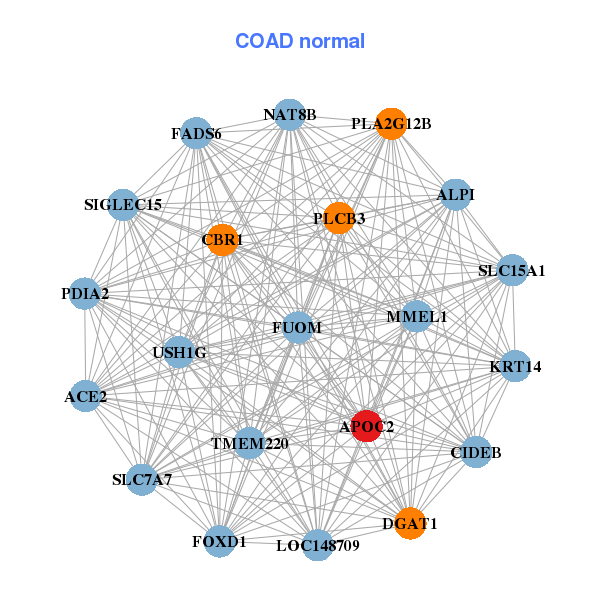
| * Co-Expression network figures were drawn using R package igraph. Only the top 20 genes with the highest correlations were shown. Red circle: input gene, orange circle: cell metabolism gene, sky circle: other gene |
: Open all plots for all cancer types
| Top |
: Open all interacting genes' information including KEGG pathway for all interacting genes from DAVID
| Top |
| Pharmacological Information for APOC2 |
| There's no related Drug. |
| Top |
| Cross referenced IDs for APOC2 |
| * We obtained these cross-references from Uniprot database. It covers 150 different DBs, 18 categories. http://www.uniprot.org/help/cross_references_section |
: Open all cross reference information
|
Copyright © 2016-Present - The Univsersity of Texas Health Science Center at Houston @ |