|
||||||||||||||||||||
| |
| Phenotypic Information (metabolism pathway, cancer, disease, phenome) |
| |
| |
| Gene-Gene Network Information: Co-Expression Network, Interacting Genes & KEGG |
| |
|


| Gene Summary for APOC3 |
| Basic gene info. | Gene symbol | APOC3 |
| Gene name | apolipoprotein C-III | |
| Synonyms | APOCIII|HALP2 | |
| Cytomap | UCSC genome browser: 11q23.3 | |
| Genomic location | chr11 :116700623-116703787 | |
| Type of gene | protein-coding | |
| RefGenes | NM_000040.1, | |
| Ensembl id | ENSG00000110245 | |
| Description | apo-CIIIapoC-IIIapolipoprotein C3 | |
| Modification date | 20141207 | |
| dbXrefs | MIM : 107720 | |
| HGNC : HGNC | ||
| Ensembl : ENSG00000110245 | ||
| HPRD : 00132 | ||
| Vega : OTTHUMG00000046115 | ||
| Protein | UniProt: go to UniProt's Cross Reference DB Table | |
| Expression | CleanEX: HS_APOC3 | |
| BioGPS: 345 | ||
| Gene Expression Atlas: ENSG00000110245 | ||
| The Human Protein Atlas: ENSG00000110245 | ||
| Pathway | NCI Pathway Interaction Database: APOC3 | |
| KEGG: APOC3 | ||
| REACTOME: APOC3 | ||
| ConsensusPathDB | ||
| Pathway Commons: APOC3 | ||
| Metabolism | MetaCyc: APOC3 | |
| HUMANCyc: APOC3 | ||
| Regulation | Ensembl's Regulation: ENSG00000110245 | |
| miRBase: chr11 :116,700,623-116,703,787 | ||
| TargetScan: NM_000040 | ||
| cisRED: ENSG00000110245 | ||
| Context | iHOP: APOC3 | |
| cancer metabolism search in PubMed: APOC3 | ||
| UCL Cancer Institute: APOC3 | ||
| Assigned class in ccmGDB | C | |
| Top |
| Phenotypic Information for APOC3(metabolism pathway, cancer, disease, phenome) |
| Cancer | CGAP: APOC3 |
| Familial Cancer Database: APOC3 | |
| * This gene is included in those cancer gene databases. |
|
|
|
|
|
| . | ||||||||||||||
Oncogene 1 | Significant driver gene in | |||||||||||||||||||
| cf) number; DB name 1 Oncogene; http://nar.oxfordjournals.org/content/35/suppl_1/D721.long, 2 Tumor Suppressor gene; https://bioinfo.uth.edu/TSGene/, 3 Cancer Gene Census; http://www.nature.com/nrc/journal/v4/n3/abs/nrc1299.html, 4 CancerGenes; http://nar.oxfordjournals.org/content/35/suppl_1/D721.long, 5 Network of Cancer Gene; http://ncg.kcl.ac.uk/index.php, 1Therapeutic Vulnerabilities in Cancer; http://cbio.mskcc.org/cancergenomics/statius/ |
| REACTOME_METABOLISM_OF_LIPIDS_AND_LIPOPROTEINS REACTOME_LIPOPROTEIN_METABOLISM | |
| OMIM | |
| Orphanet | |
| Disease | KEGG Disease: APOC3 |
| MedGen: APOC3 (Human Medical Genetics with Condition) | |
| ClinVar: APOC3 | |
| Phenotype | MGI: APOC3 (International Mouse Phenotyping Consortium) |
| PhenomicDB: APOC3 | |
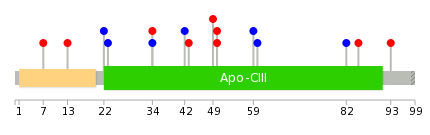
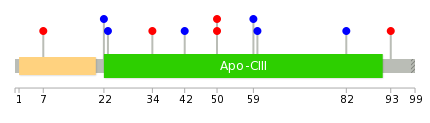
| Mutations for APOC3 |
| * Under tables are showing count per each tissue to give us broad intuition about tissue specific mutation patterns.You can go to the detailed page for each mutation database's web site. |
| There's no structural variation information in COSMIC data for this gene. |
| * From mRNA Sanger sequences, Chitars2.0 arranged chimeric transcripts. This table shows APOC3 related fusion information. |
| ID | Head Gene | Tail Gene | Accession | Gene_a | qStart_a | qEnd_a | Chromosome_a | tStart_a | tEnd_a | Gene_a | qStart_a | qEnd_a | Chromosome_a | tStart_a | tEnd_a |
| Top |
| There's no copy number variation information in COSMIC data for this gene. |
| Top |
|
 |
| Top |
| Stat. for Non-Synonymous SNVs (# total SNVs=9) | (# total SNVs=2) |
 |  |
(# total SNVs=0) | (# total SNVs=0) |
| Top |
| * When you move the cursor on each content, you can see more deailed mutation information on the Tooltip. Those are primary_site,primary_histology,mutation(aa),pubmedID. |
| GRCh37 position | Mutation(aa) | Unique sampleID count |
| chr11:116701581-116701581 | p.V50L | 2 |
| chr11:116703480-116703480 | p.R60R | 1 |
| chr11:116701354-116701354 | p.? | 1 |
| chr11:116703546-116703546 | p.S82S | 1 |
| chr11:116701499-116701499 | p.E22E | 1 |
| chr11:116703553-116703553 | p.W85R | 1 |
| chr11:116701502-116701502 | p.A23A | 1 |
| chr11:116703578-116703578 | p.P93Q | 1 |
| chr11:116701533-116701533 | p.G34C | 1 |
| chr11:116701535-116701535 | p.G34G | 1 |
| Top |
|
 |
| Point Mutation/ Tissue ID | 1 | 2 | 3 | 4 | 5 | 6 | 7 | 8 | 9 | 10 | 11 | 12 | 13 | 14 | 15 | 16 | 17 | 18 | 19 | 20 |
| # sample | 1 | 1 | 2 | 3 | 2 | 1 | 1 | |||||||||||||
| # mutation | 1 | 1 | 2 | 3 | 2 | 1 | 1 | |||||||||||||
| nonsynonymous SNV | 2 | 2 | 1 | |||||||||||||||||
| synonymous SNV | 1 | 1 | 1 | 2 | 1 |
| cf) Tissue ID; Tissue type (1; BLCA[Bladder Urothelial Carcinoma], 2; BRCA[Breast invasive carcinoma], 3; CESC[Cervical squamous cell carcinoma and endocervical adenocarcinoma], 4; COAD[Colon adenocarcinoma], 5; GBM[Glioblastoma multiforme], 6; Glioma Low Grade, 7; HNSC[Head and Neck squamous cell carcinoma], 8; KICH[Kidney Chromophobe], 9; KIRC[Kidney renal clear cell carcinoma], 10; KIRP[Kidney renal papillary cell carcinoma], 11; LAML[Acute Myeloid Leukemia], 12; LUAD[Lung adenocarcinoma], 13; LUSC[Lung squamous cell carcinoma], 14; OV[Ovarian serous cystadenocarcinoma ], 15; PAAD[Pancreatic adenocarcinoma], 16; PRAD[Prostate adenocarcinoma], 17; SKCM[Skin Cutaneous Melanoma], 18:STAD[Stomach adenocarcinoma], 19:THCA[Thyroid carcinoma], 20:UCEC[Uterine Corpus Endometrial Carcinoma]) |
| Top |
| * We represented just top 10 SNVs. When you move the cursor on each content, you can see more deailed mutation information on the Tooltip. Those are primary_site, primary_histology, mutation(aa), pubmedID. |
| Genomic Position | Mutation(aa) | Unique sampleID count |
| chr11:116701581 | p.V50L | 2 |
| chr11:116701502 | p.E22E | 1 |
| chr11:116701533 | p.A23A | 1 |
| chr11:116701559 | p.G34C | 1 |
| chr11:116701610 | p.T42T | 1 |
| chr11:116703480 | p.A59A | 1 |
| chr11:116703546 | p.R60R | 1 |
| chr11:116703578 | p.S82S | 1 |
| chr11:116701317 | p.P93Q | 1 |
| chr11:116701499 | p.L7V | 1 |
| * Copy number data were extracted from TCGA using R package TCGA-Assembler. The URLs of all public data files on TCGA DCC data server were gathered on Jan-05-2015. Function ProcessCNAData in TCGA-Assembler package was used to obtain gene-level copy number value which is calculated as the average copy number of the genomic region of a gene. |
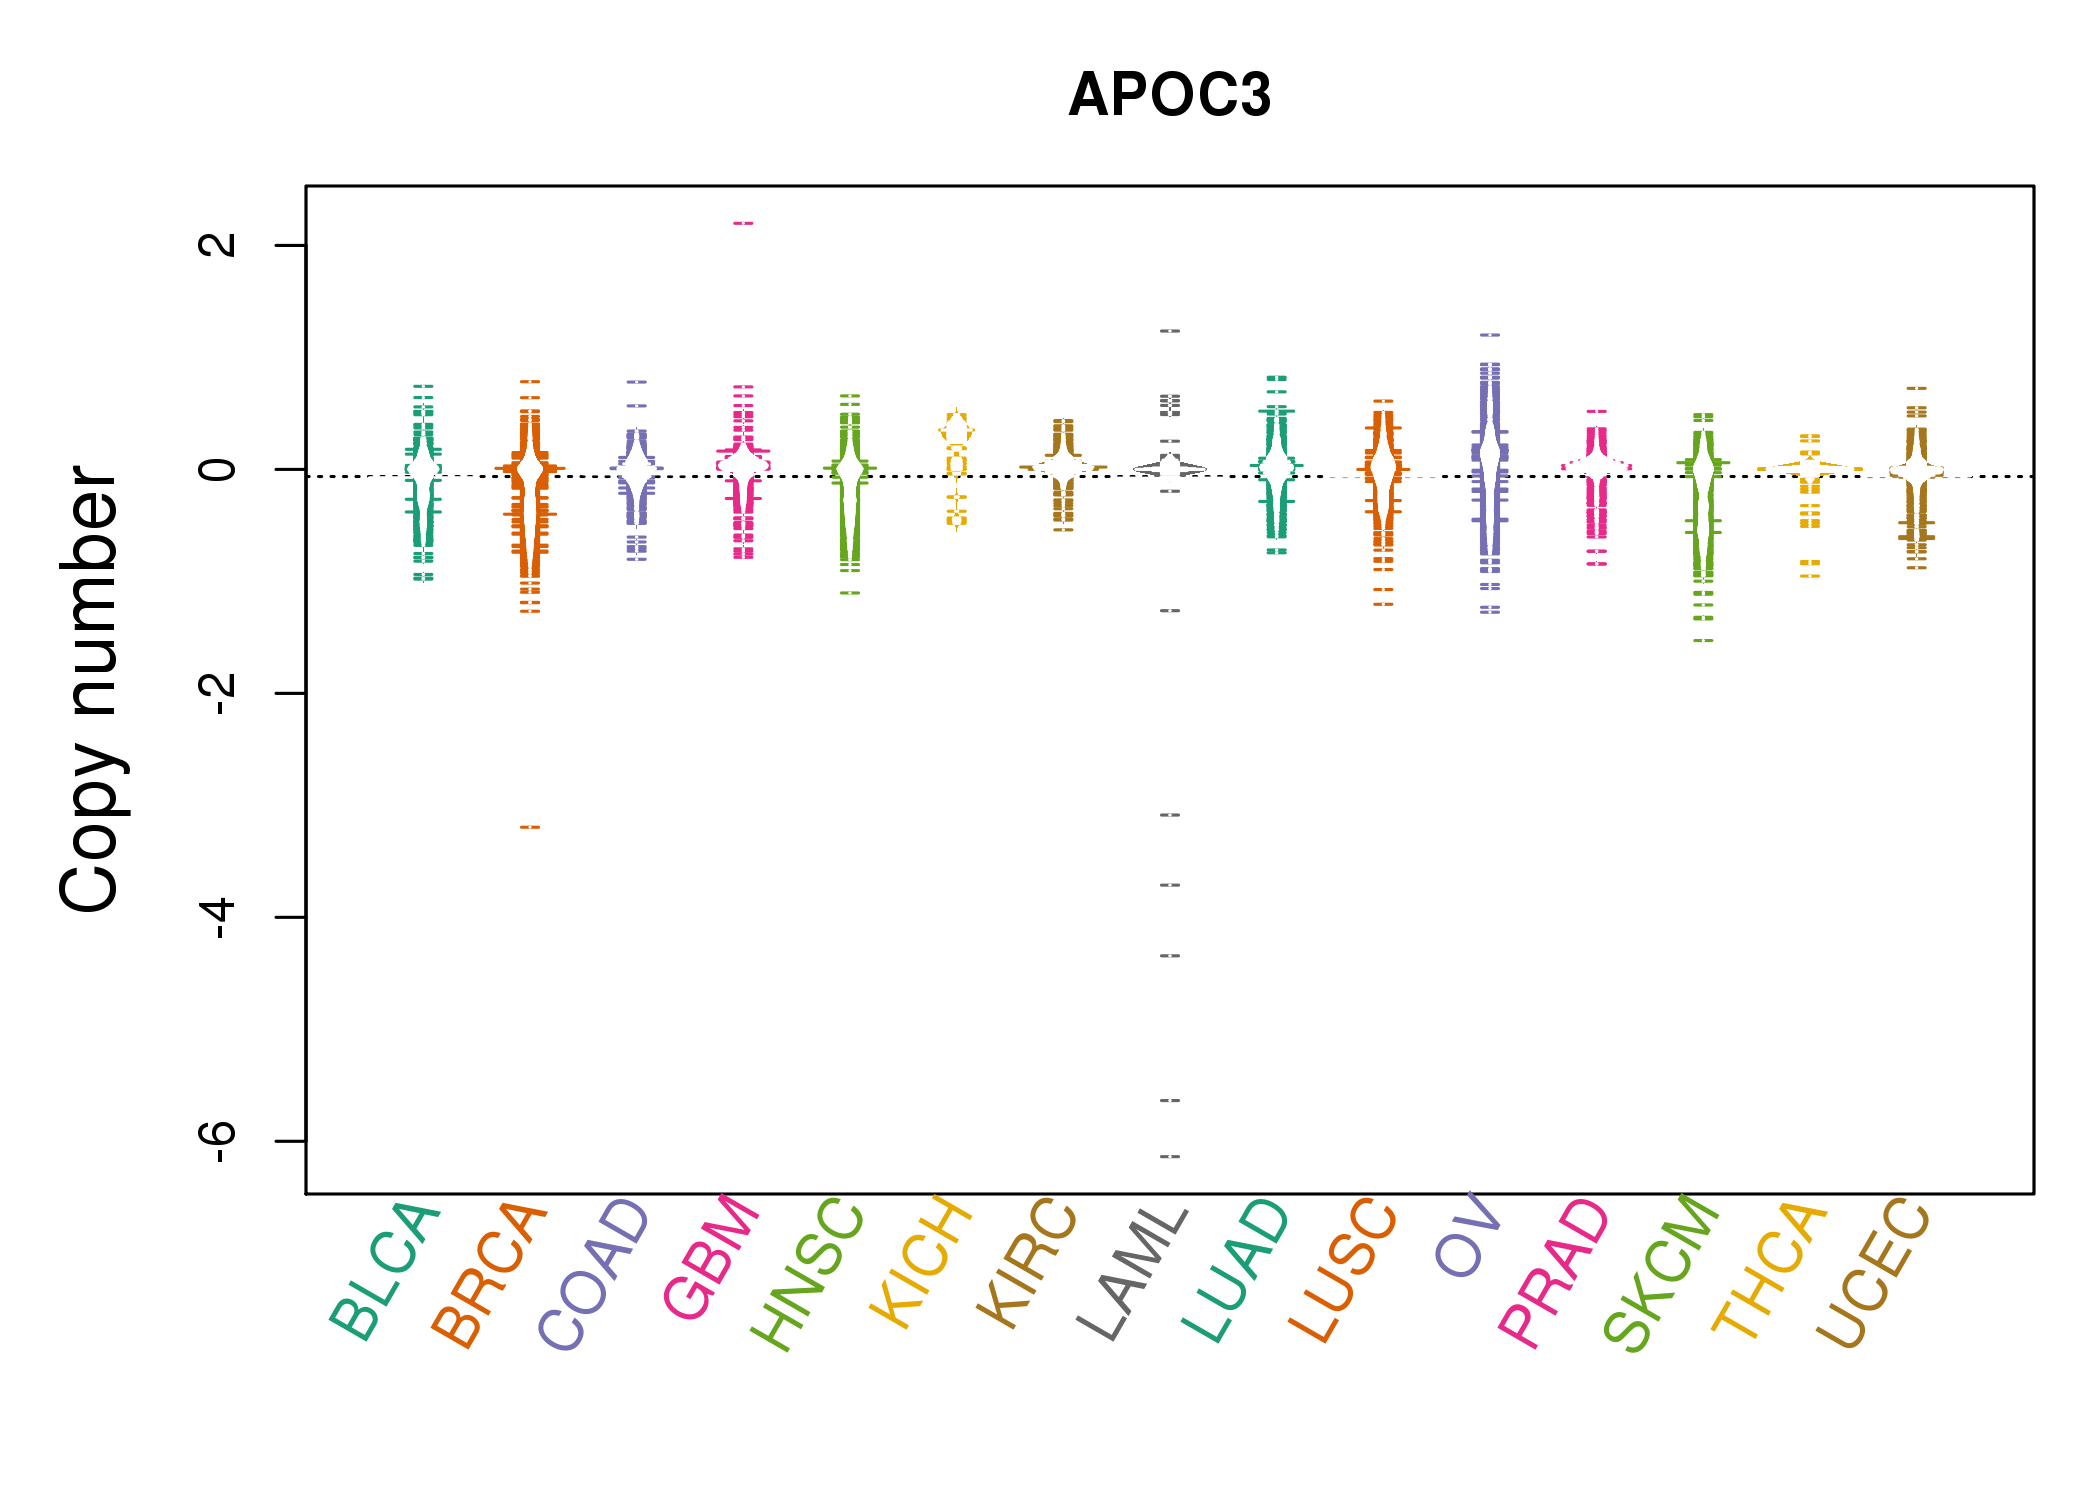 |
| cf) Tissue ID[Tissue type]: BLCA[Bladder Urothelial Carcinoma], BRCA[Breast invasive carcinoma], CESC[Cervical squamous cell carcinoma and endocervical adenocarcinoma], COAD[Colon adenocarcinoma], GBM[Glioblastoma multiforme], Glioma Low Grade, HNSC[Head and Neck squamous cell carcinoma], KICH[Kidney Chromophobe], KIRC[Kidney renal clear cell carcinoma], KIRP[Kidney renal papillary cell carcinoma], LAML[Acute Myeloid Leukemia], LUAD[Lung adenocarcinoma], LUSC[Lung squamous cell carcinoma], OV[Ovarian serous cystadenocarcinoma ], PAAD[Pancreatic adenocarcinoma], PRAD[Prostate adenocarcinoma], SKCM[Skin Cutaneous Melanoma], STAD[Stomach adenocarcinoma], THCA[Thyroid carcinoma], UCEC[Uterine Corpus Endometrial Carcinoma] |
| Top |
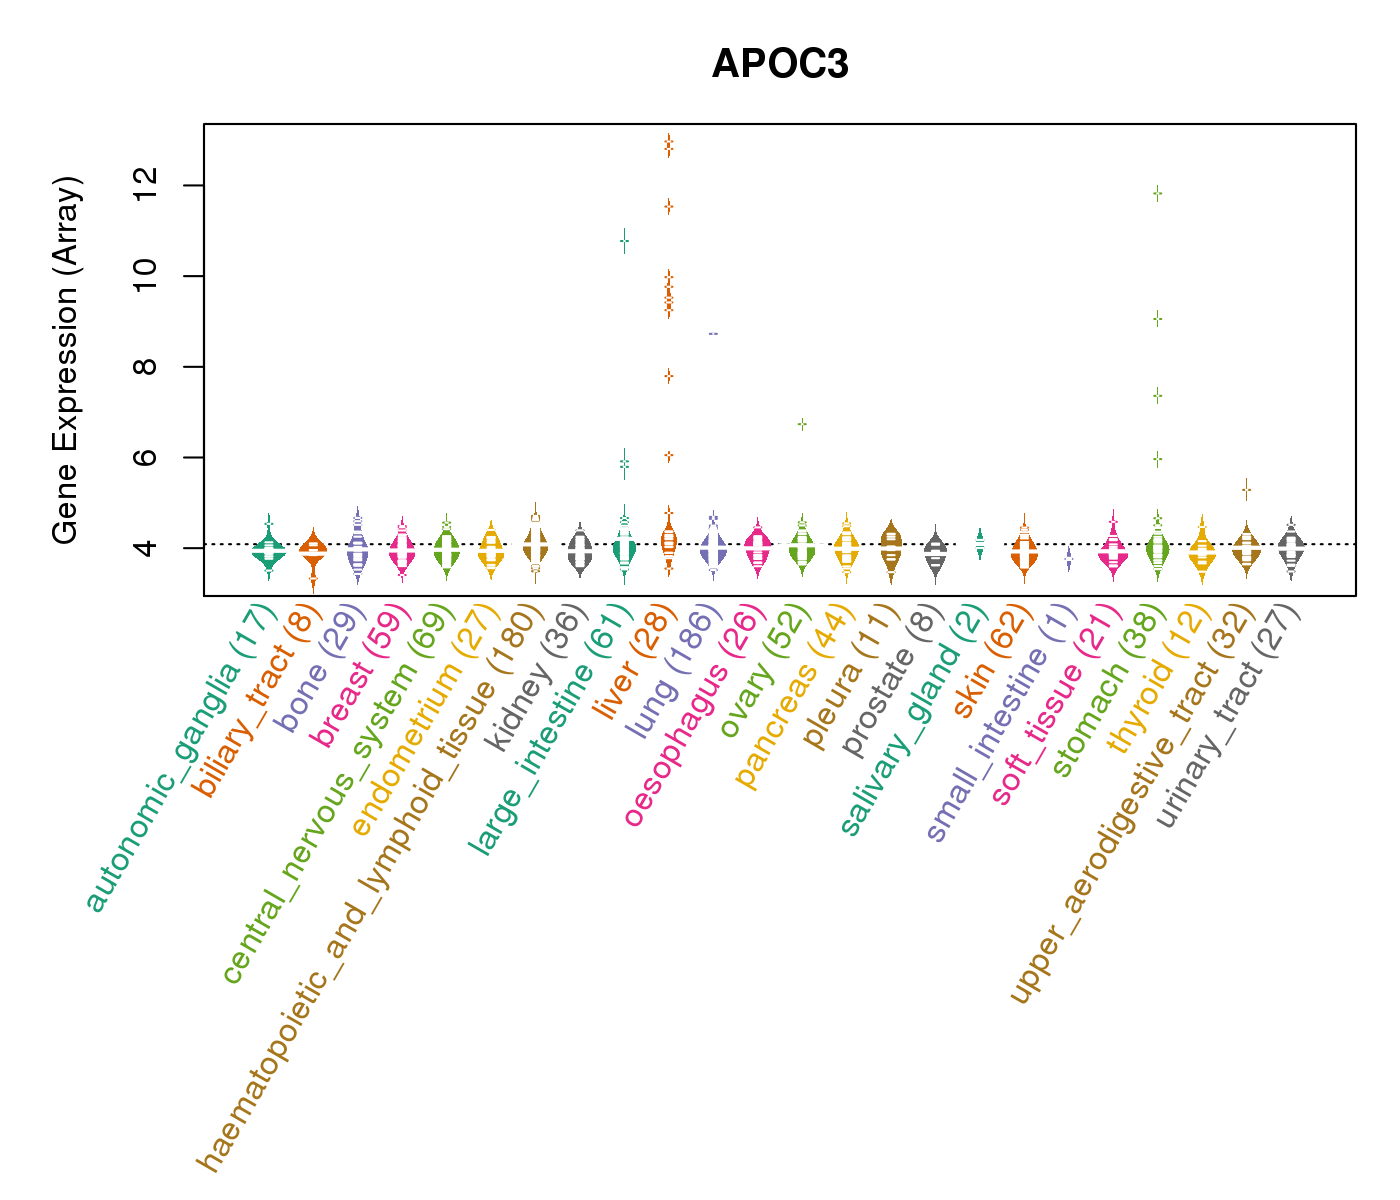
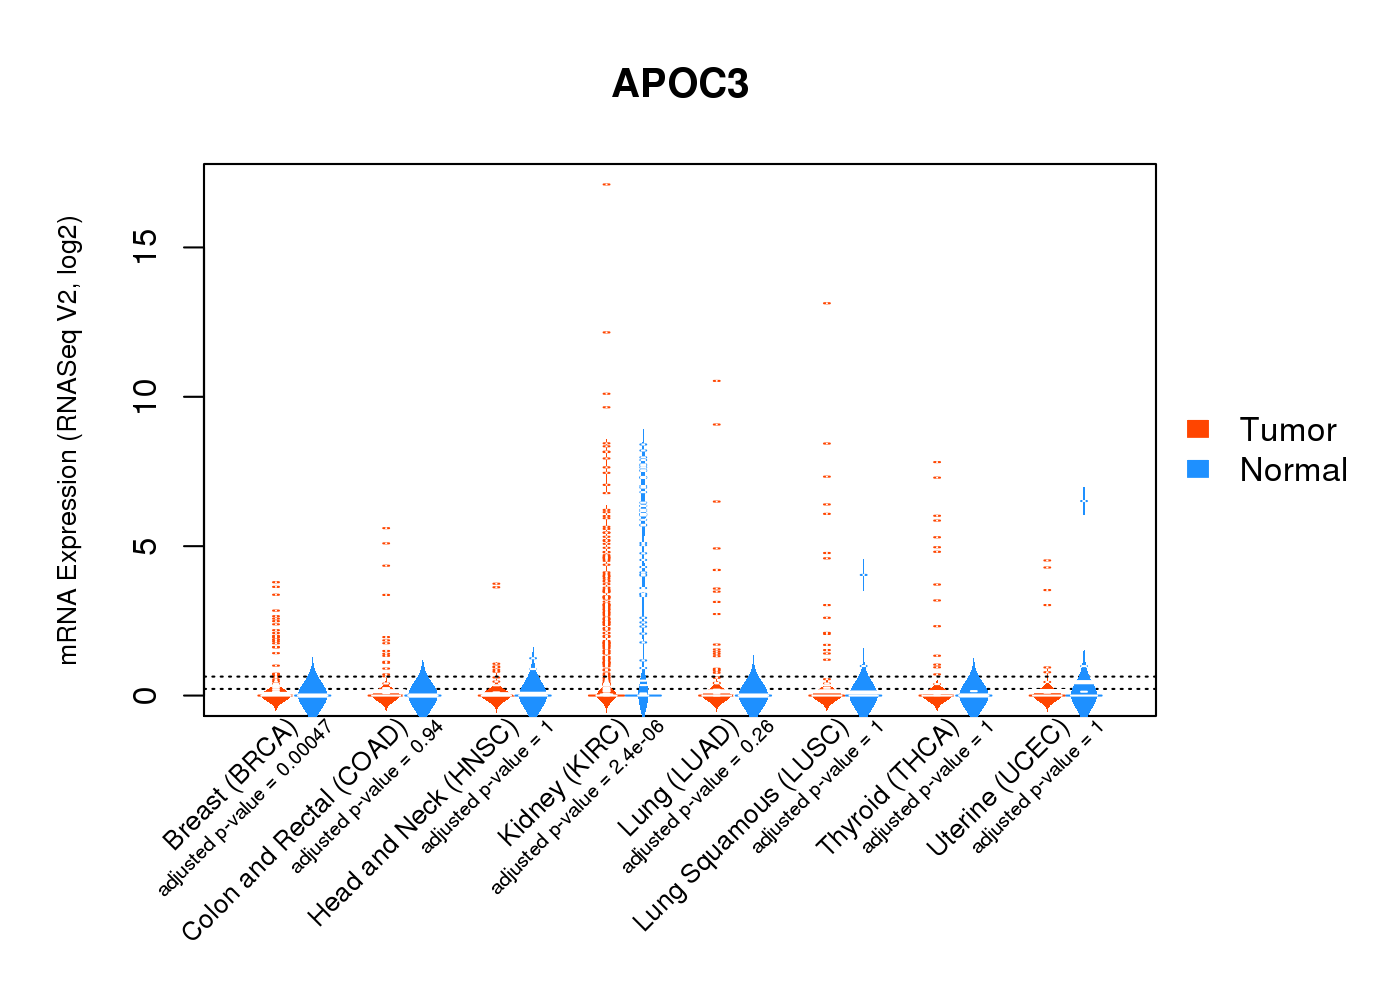
| Gene Expression for APOC3 |
| * CCLE gene expression data were extracted from CCLE_Expression_Entrez_2012-10-18.res: Gene-centric RMA-normalized mRNA expression data. |
 |
| * Normalized gene expression data of RNASeqV2 was extracted from TCGA using R package TCGA-Assembler. The URLs of all public data files on TCGA DCC data server were gathered at Jan-05-2015. Only eight cancer types have enough normal control samples for differential expression analysis. (t test, adjusted p<0.05 (using Benjamini-Hochberg FDR)) |
 |
| Top |
| * This plots show the correlation between CNV and gene expression. |
: Open all plots for all cancer types
 |
|
 |
|


| Top |
| Gene-Gene Network Information |
| * Co-Expression network figures were drawn using R package igraph. Only the top 20 genes with the highest correlations were shown. Red circle: input gene, orange circle: cell metabolism gene, sky circle: other gene |
: Open all plots for all cancer types
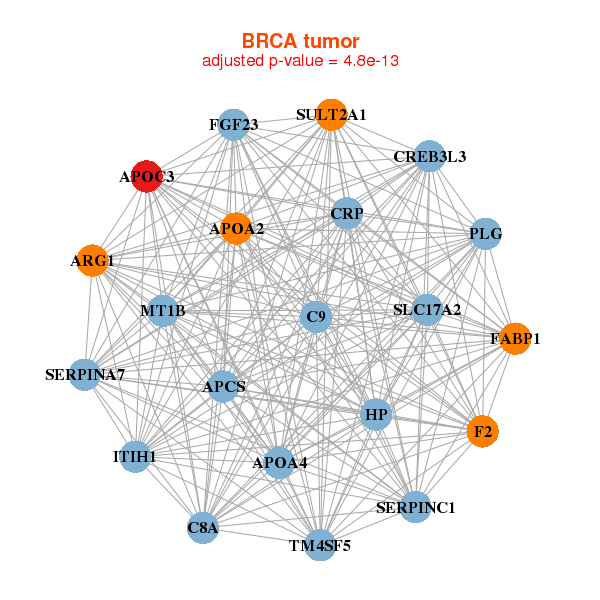 |
| ||||
| APCS,APOA2,APOA4,APOC3,ARG1,C8A,C9, CREB3L3,CRP,F2,FABP1,FGF23,HP,ITIH1, MT1B,PLG,SERPINA7,SERPINC1,SLC17A2,SULT2A1,TM4SF5 | ACSM2A,ACSM2B,AMN,APOC3,APOL4,BMP3,TBATA, CHGA,CHGB,CPO,DBH,NDRG4,ORM1,ORM2, PDZD7,PHOX2B,SLC18A1,SNORA14A,ST8SIA3,TH,TTC36 | ||||
 |
| ||||
| ALB,APOA1,APOA5,APOC3,C1orf185,RIIAD1,CEACAM16, CFHR2,CFHR5,DRD1,F9,FGG,ITIH1,LGSN, NEK10,NPHS2,RGS22,SERPINC1,SH3GL2,SPP2,ZDHHC11 | AADAC,APOA1,APOA4,APOB,APOC3,C17orf78,CRISP1, FAM99A,FAM99B,GSTA5,KCNJ13,LCE3E,LOC388428,MOS, ONECUT3,OR10H1,OR10H5,OR4N5,PWAR4___F2RL3___PAWR,SLC2A2,SPANXN3 |


| * Co-Expression network figures were drawn using R package igraph. Only the top 20 genes with the highest correlations were shown. Red circle: input gene, orange circle: cell metabolism gene, sky circle: other gene |
: Open all plots for all cancer types
| Top |
: Open all interacting genes' information including KEGG pathway for all interacting genes from DAVID
| Top |
| Pharmacological Information for APOC3 |
| DB Category | DB Name | DB's ID and Url link |
| * Gene Centered Interaction Network. |
 |
| * Drug Centered Interaction Network. |
| DrugBank ID | Target Name | Drug Groups | Generic Name | Drug Centered Network | Drug Structure |
| DB00363 | apolipoprotein C-III | approved | Clozapine | 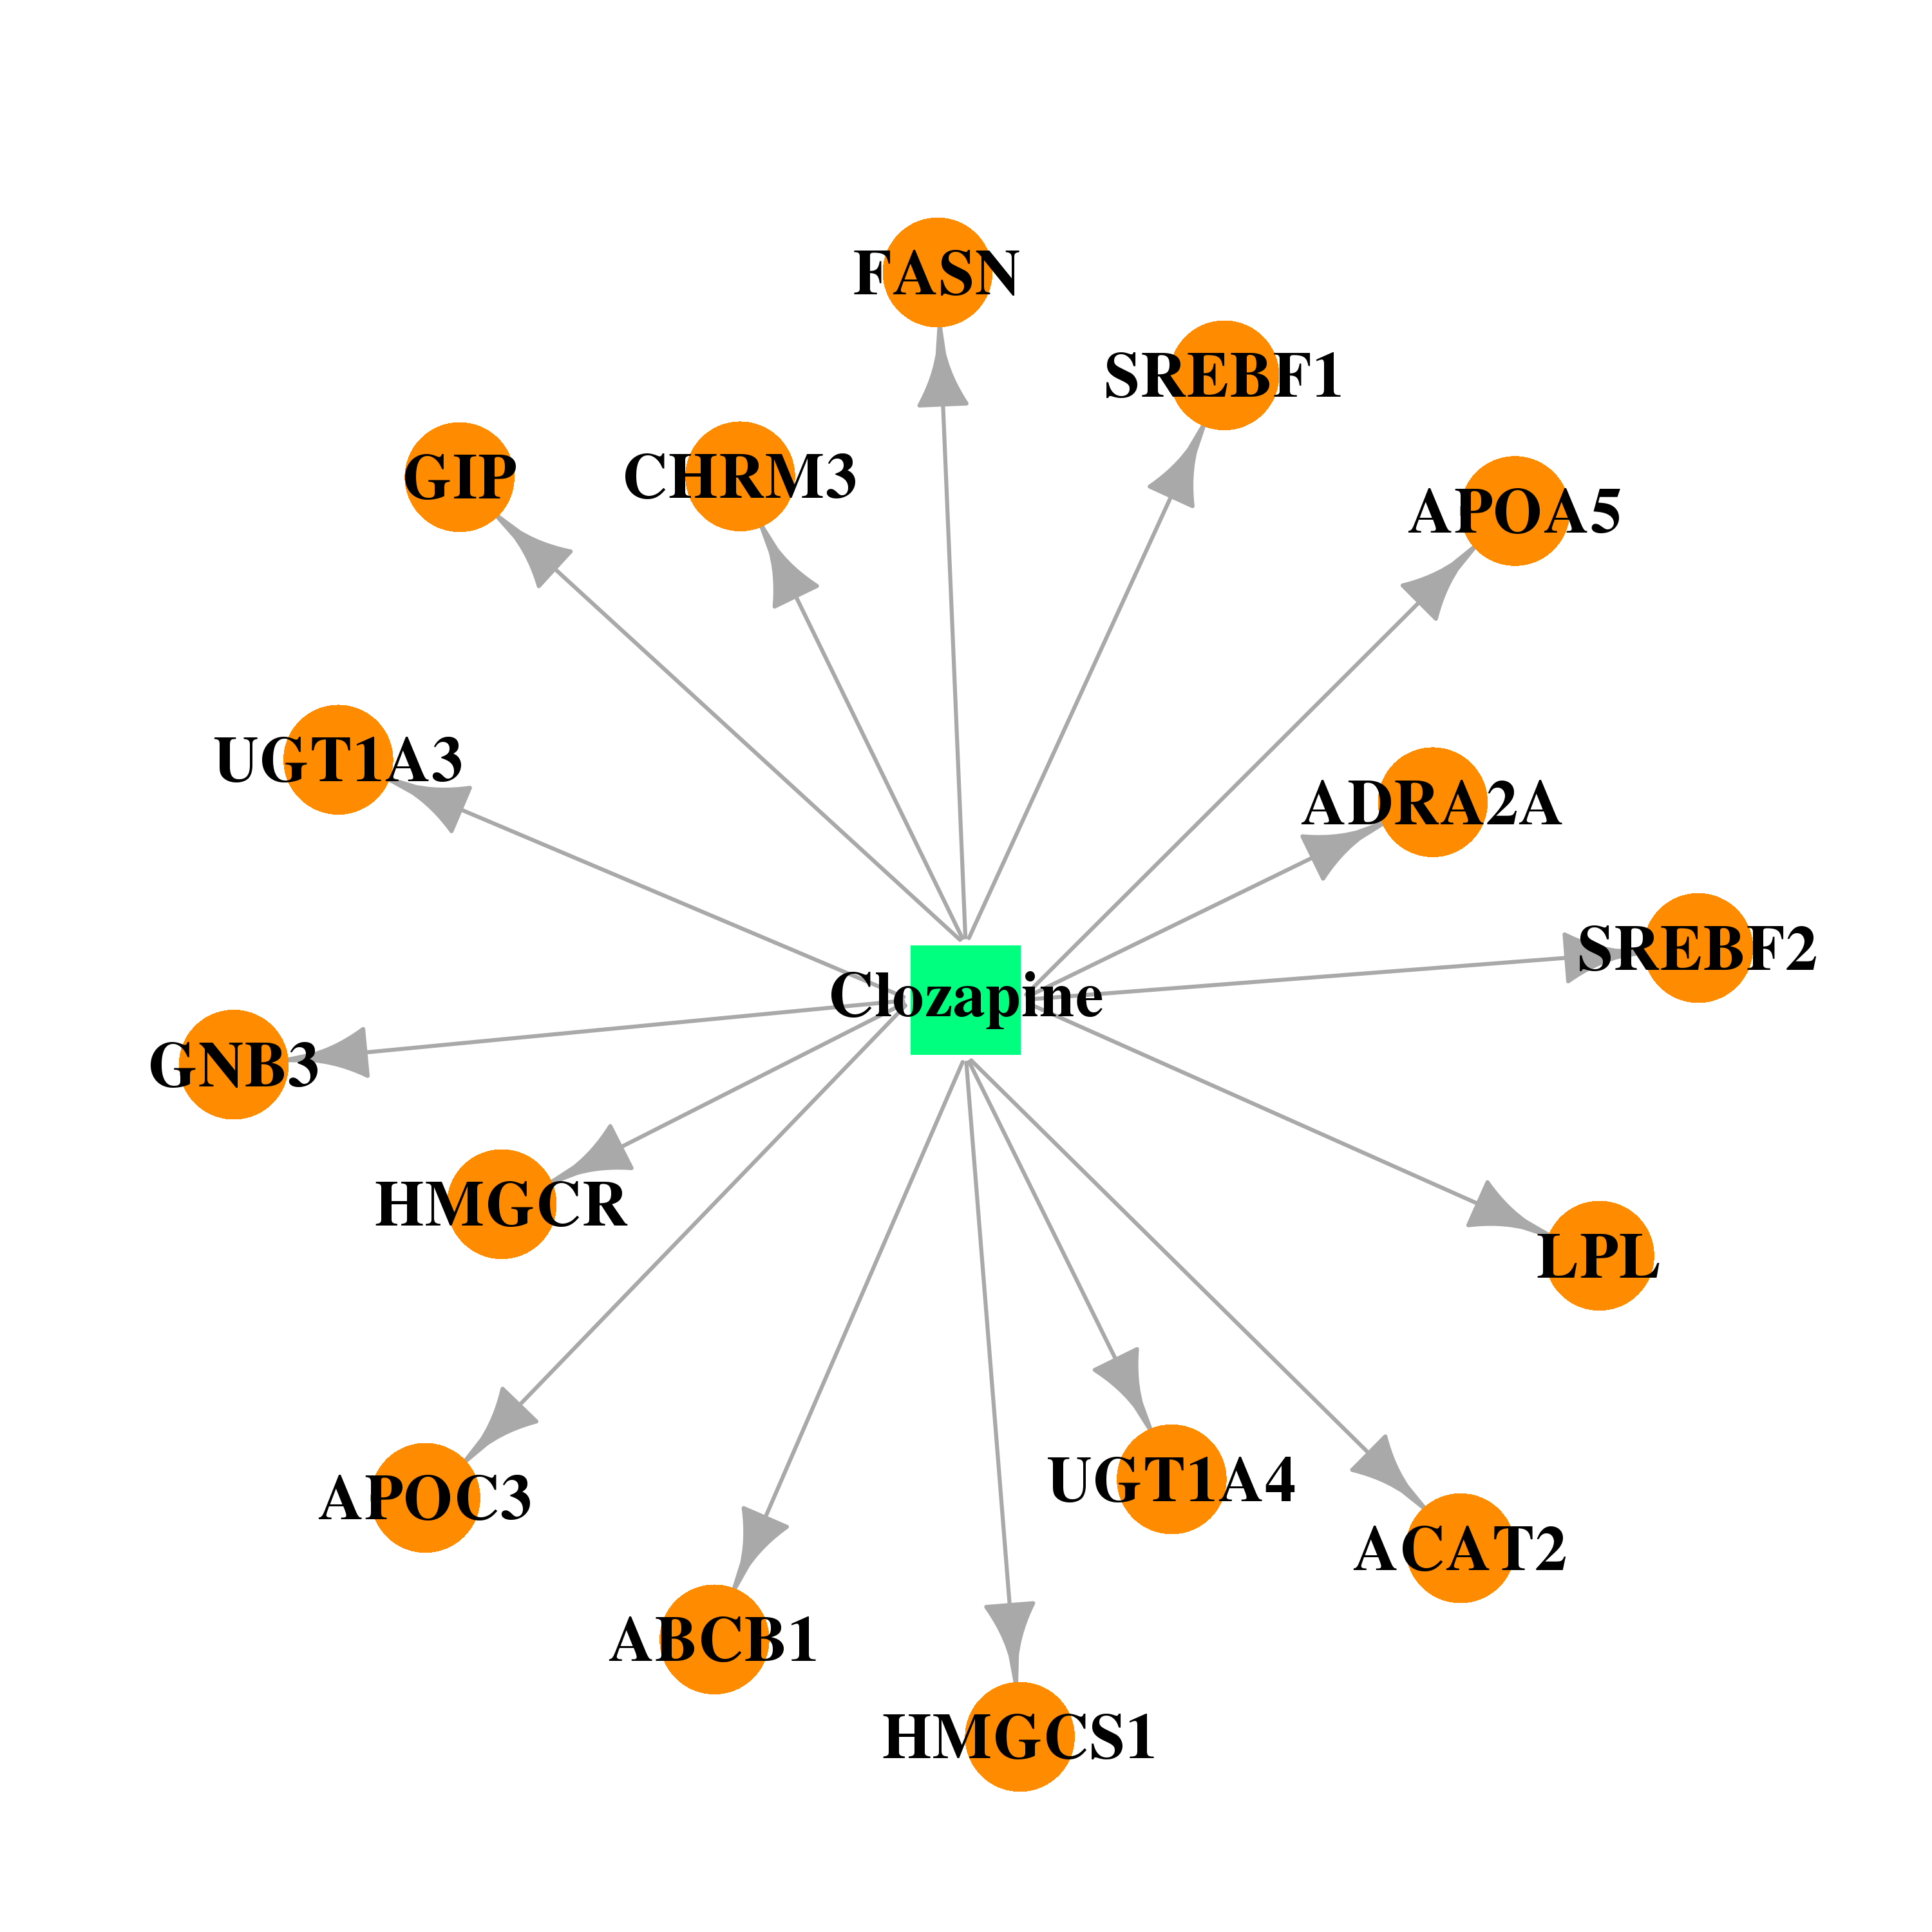 | 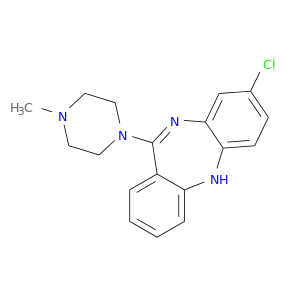 |
| DB00334 | apolipoprotein C-III | approved; investigational | Olanzapine | 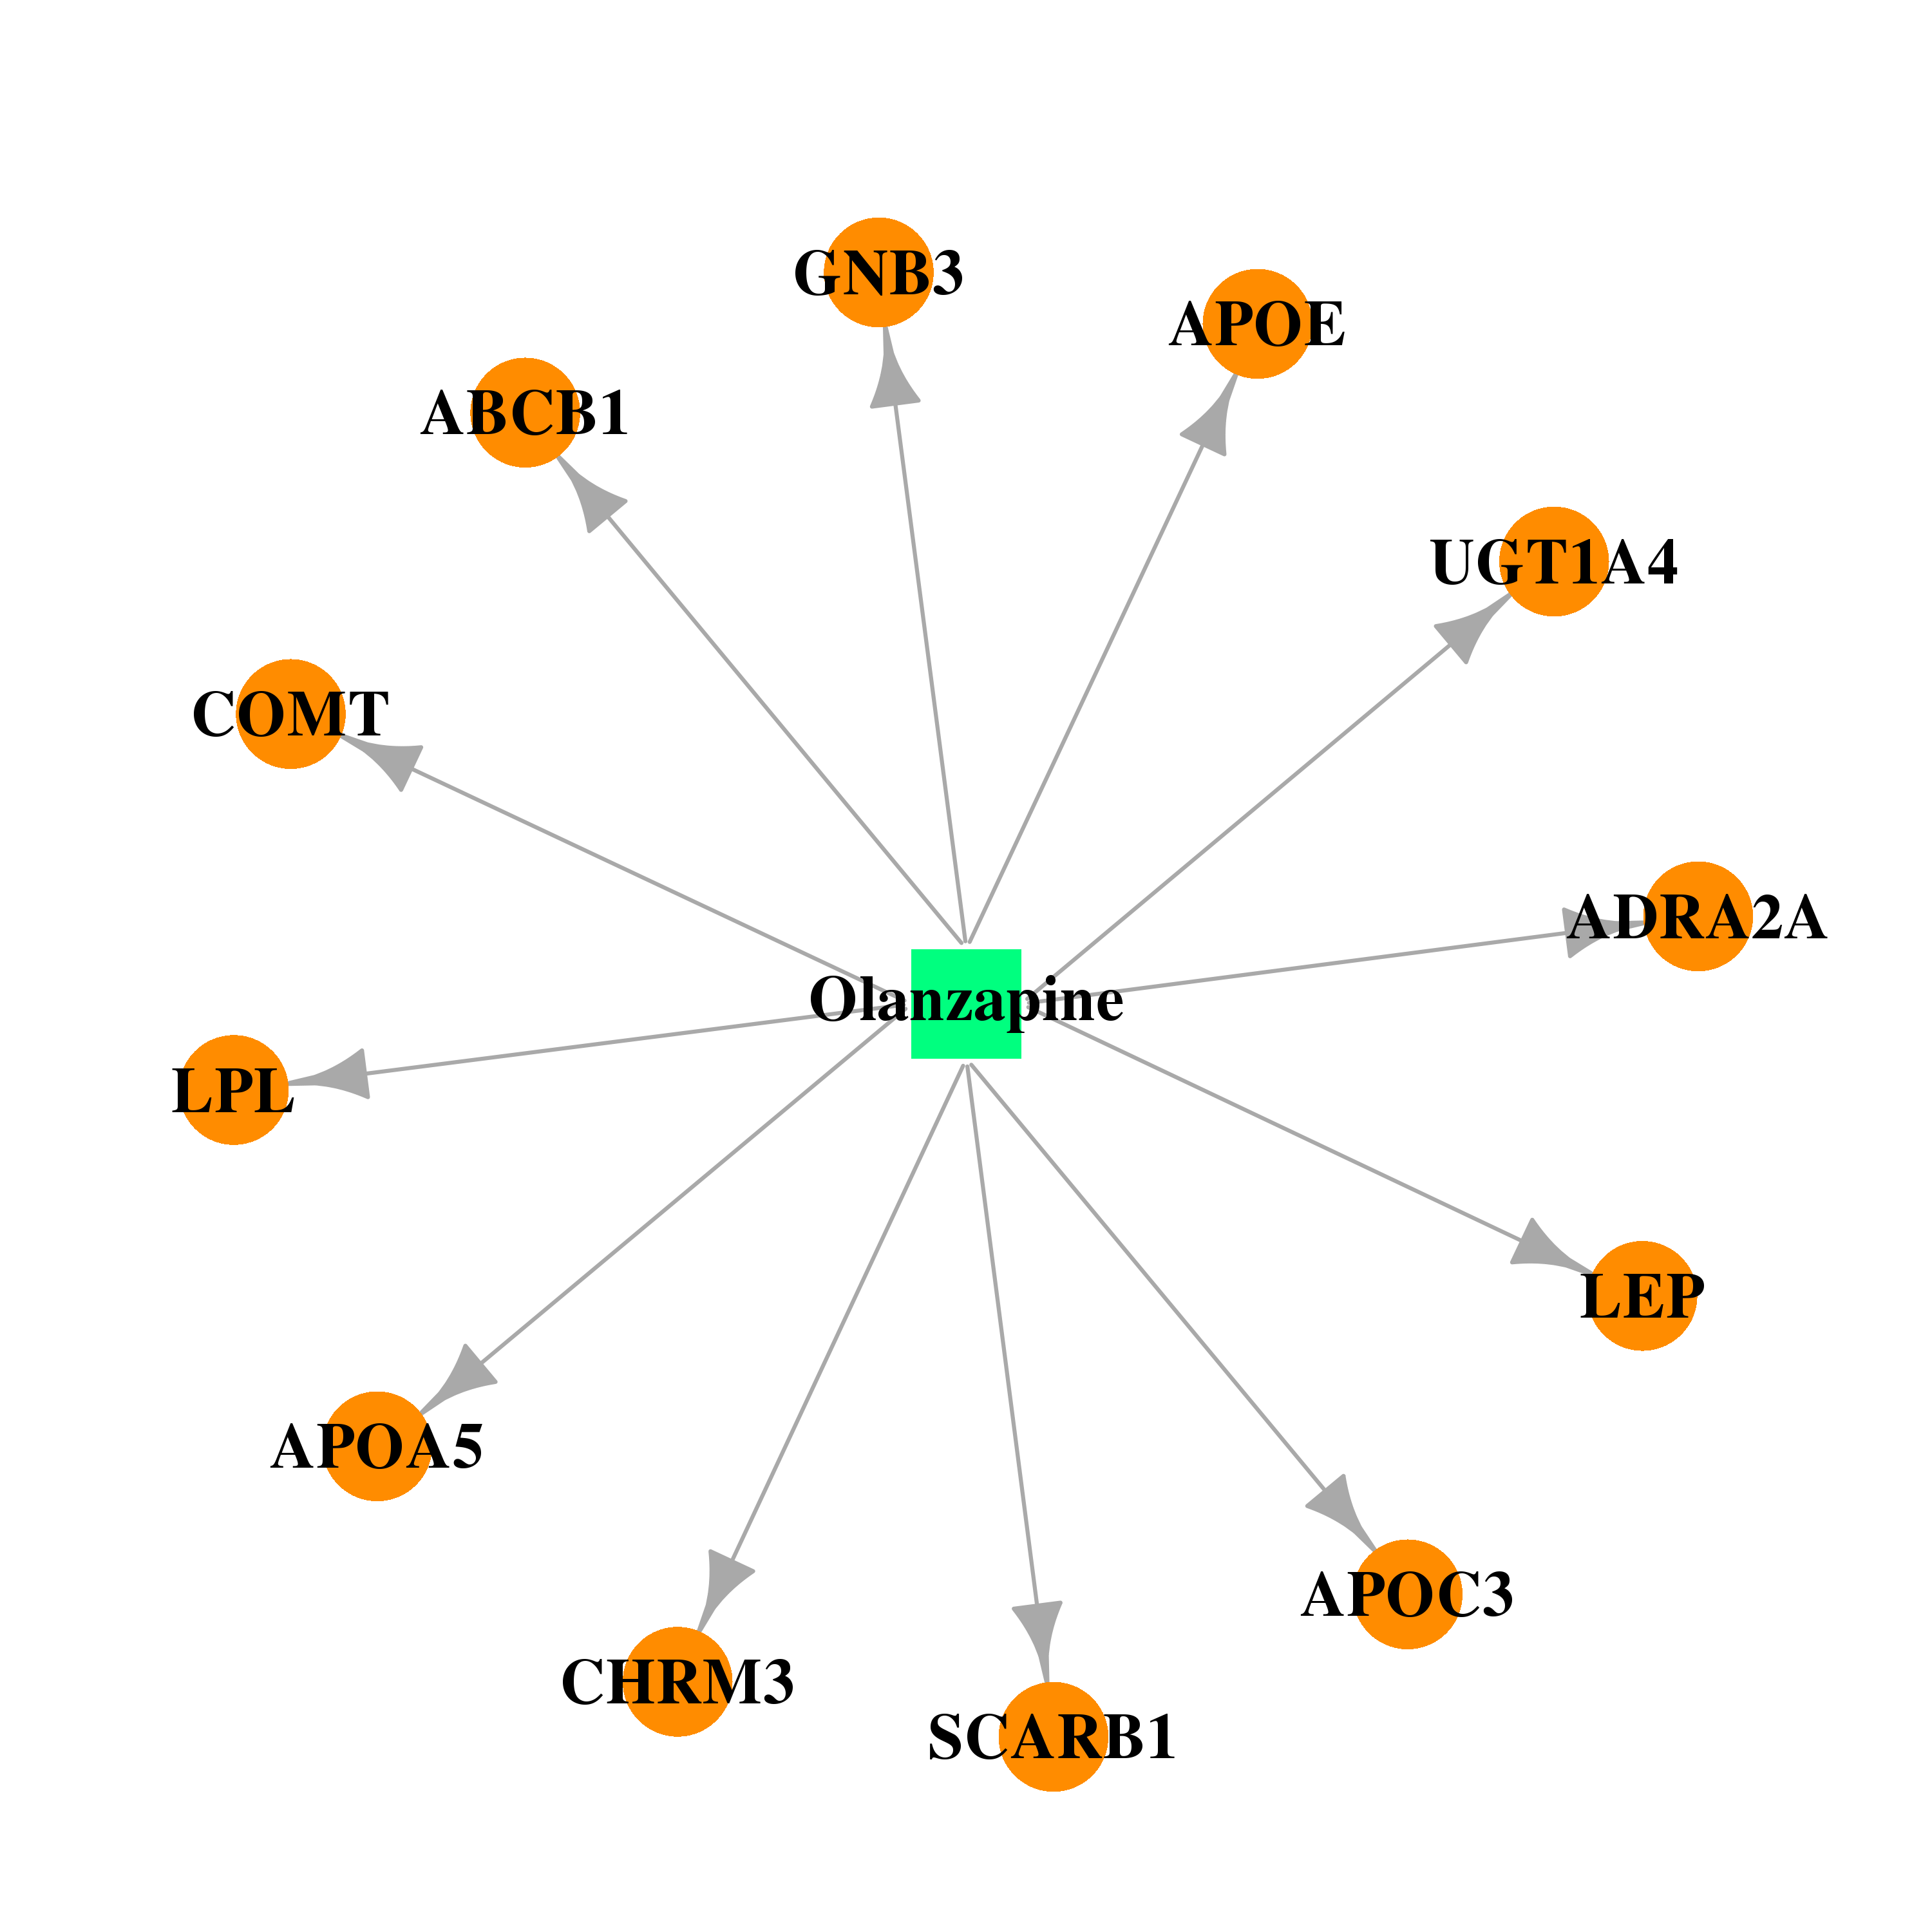 | 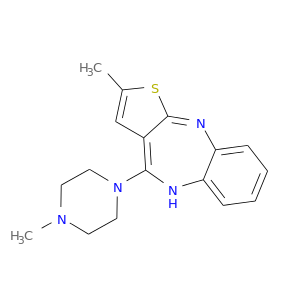 |
| DB00503 | apolipoprotein C-III | approved; investigational | Ritonavir | 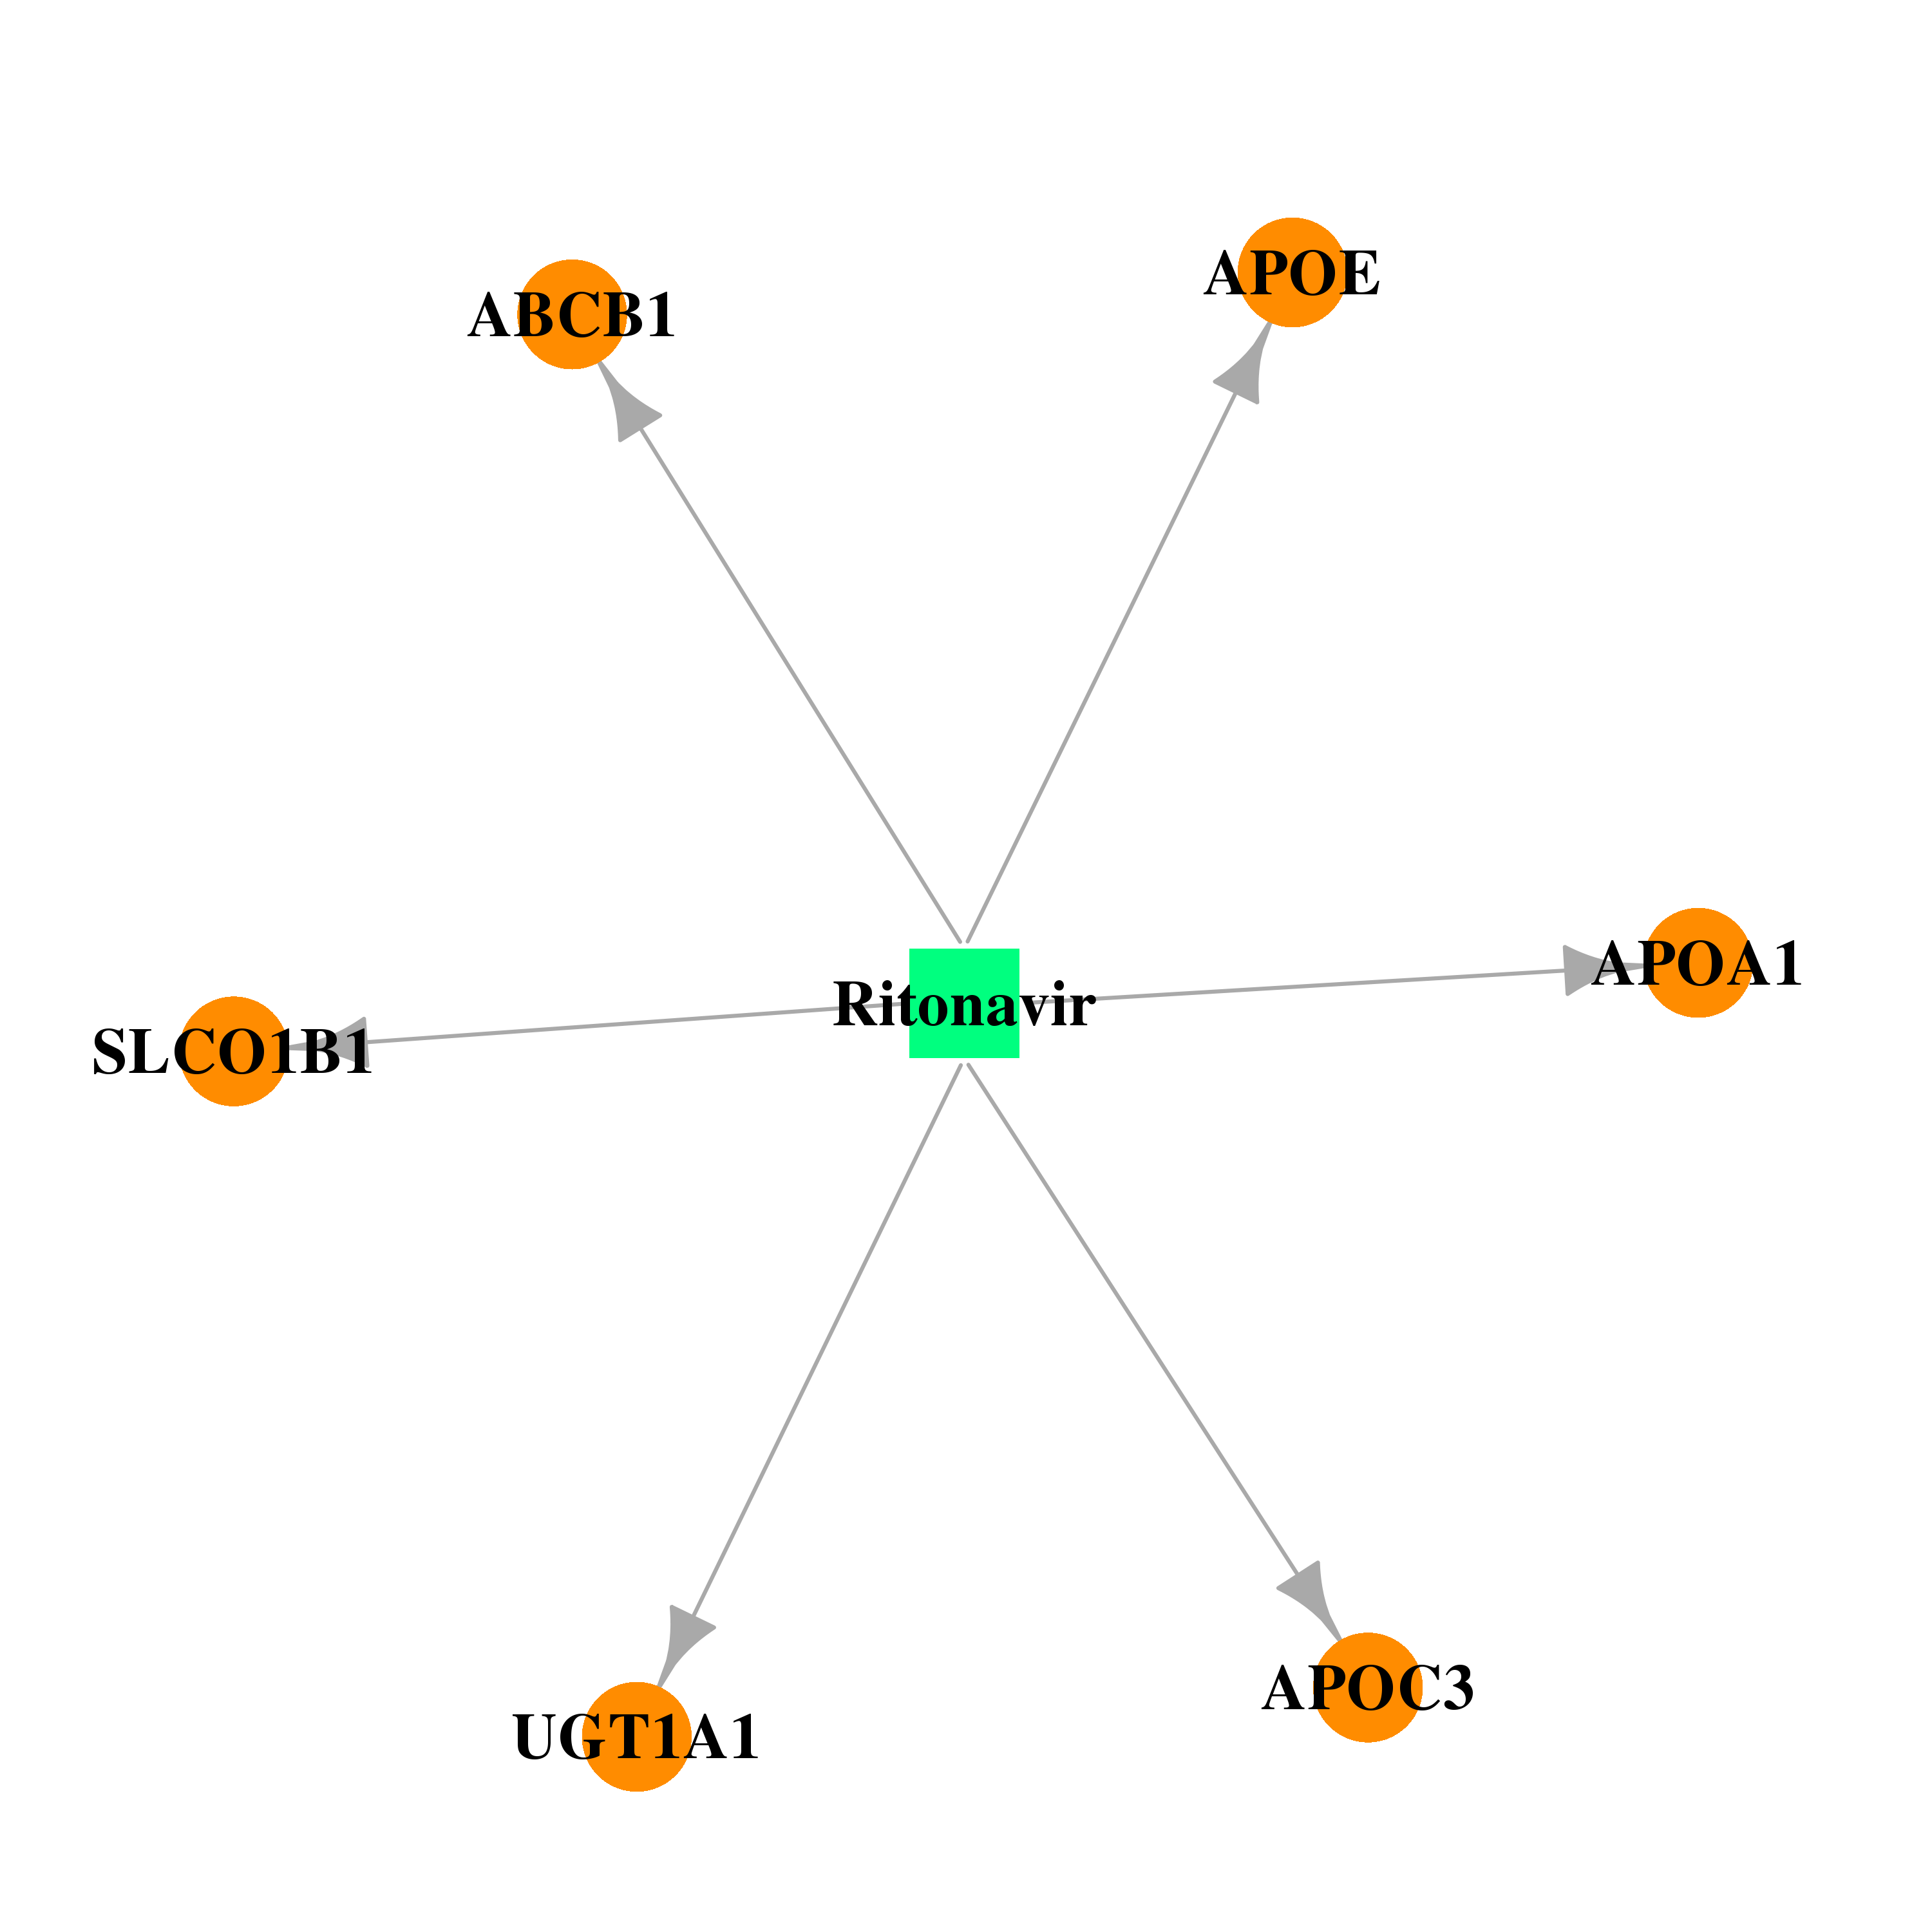 | 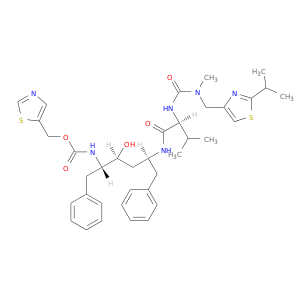 |
| Top |
| Cross referenced IDs for APOC3 |
| * We obtained these cross-references from Uniprot database. It covers 150 different DBs, 18 categories. http://www.uniprot.org/help/cross_references_section |
: Open all cross reference information
|
Copyright © 2016-Present - The Univsersity of Texas Health Science Center at Houston @ |