|
||||||||||||||||||||
| |
| Phenotypic Information (metabolism pathway, cancer, disease, phenome) |
| |
| |
| Gene-Gene Network Information: Co-Expression Network, Interacting Genes & KEGG |
| |
|


| Gene Summary for ARSH |
| Basic gene info. | Gene symbol | ARSH |
| Gene name | arylsulfatase family, member H | |
| Synonyms | sulfatase | |
| Cytomap | UCSC genome browser: Xp22.33 | |
| Genomic location | chrX :2924653-2951426 | |
| Type of gene | protein-coding | |
| RefGenes | NM_001011719.1, | |
| Ensembl id | ENSG00000205667 | |
| Description | ASHarylsulfatase H | |
| Modification date | 20141207 | |
| dbXrefs | MIM : 300586 | |
| HGNC : HGNC | ||
| Ensembl : ENSG00000205667 | ||
| HPRD : 16509 | ||
| Vega : OTTHUMG00000159612 | ||
| Protein | UniProt: go to UniProt's Cross Reference DB Table | |
| Expression | CleanEX: HS_ARSH | |
| BioGPS: 347527 | ||
| Gene Expression Atlas: ENSG00000205667 | ||
| The Human Protein Atlas: ENSG00000205667 | ||
| Pathway | NCI Pathway Interaction Database: ARSH | |
| KEGG: ARSH | ||
| REACTOME: ARSH | ||
| ConsensusPathDB | ||
| Pathway Commons: ARSH | ||
| Metabolism | MetaCyc: ARSH | |
| HUMANCyc: ARSH | ||
| Regulation | Ensembl's Regulation: ENSG00000205667 | |
| miRBase: chrX :2,924,653-2,951,426 | ||
| TargetScan: NM_001011719 | ||
| cisRED: ENSG00000205667 | ||
| Context | iHOP: ARSH | |
| cancer metabolism search in PubMed: ARSH | ||
| UCL Cancer Institute: ARSH | ||
| Assigned class in ccmGDB | C | |
| Top |
| Phenotypic Information for ARSH(metabolism pathway, cancer, disease, phenome) |
| Cancer | CGAP: ARSH |
| Familial Cancer Database: ARSH | |
| * This gene is included in those cancer gene databases. |
|
|
|
|
|
| . | ||||||||||||||
Oncogene 1 | Significant driver gene in | |||||||||||||||||||
| cf) number; DB name 1 Oncogene; http://nar.oxfordjournals.org/content/35/suppl_1/D721.long, 2 Tumor Suppressor gene; https://bioinfo.uth.edu/TSGene/, 3 Cancer Gene Census; http://www.nature.com/nrc/journal/v4/n3/abs/nrc1299.html, 4 CancerGenes; http://nar.oxfordjournals.org/content/35/suppl_1/D721.long, 5 Network of Cancer Gene; http://ncg.kcl.ac.uk/index.php, 1Therapeutic Vulnerabilities in Cancer; http://cbio.mskcc.org/cancergenomics/statius/ |
| REACTOME_GLYCOSPHINGOLIPID_METABOLISM REACTOME_PHOSPHOLIPID_METABOLISM REACTOME_METABOLISM_OF_PROTEINS REACTOME_SPHINGOLIPID_METABOLISM REACTOME_METABOLISM_OF_LIPIDS_AND_LIPOPROTEINS | |
| OMIM | |
| Orphanet | |
| Disease | KEGG Disease: ARSH |
| MedGen: ARSH (Human Medical Genetics with Condition) | |
| ClinVar: ARSH | |
| Phenotype | MGI: ARSH (International Mouse Phenotyping Consortium) |
| PhenomicDB: ARSH | |
| Mutations for ARSH |
| * Under tables are showing count per each tissue to give us broad intuition about tissue specific mutation patterns.You can go to the detailed page for each mutation database's web site. |
| There's no structural variation information in COSMIC data for this gene. |
| * From mRNA Sanger sequences, Chitars2.0 arranged chimeric transcripts. This table shows ARSH related fusion information. |
| ID | Head Gene | Tail Gene | Accession | Gene_a | qStart_a | qEnd_a | Chromosome_a | tStart_a | tEnd_a | Gene_a | qStart_a | qEnd_a | Chromosome_a | tStart_a | tEnd_a |
| Top |
| There's no copy number variation information in COSMIC data for this gene. |
| Top |
|
 |
| Top |
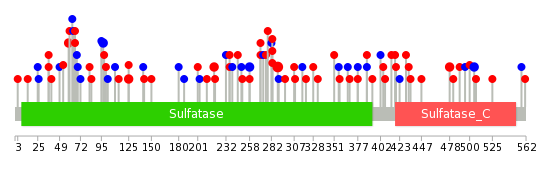
| Stat. for Non-Synonymous SNVs (# total SNVs=50) | (# total SNVs=20) |
 |  |
(# total SNVs=1) | (# total SNVs=0) |
 |
| Top |
| * When you move the cursor on each content, you can see more deailed mutation information on the Tooltip. Those are primary_site,primary_histology,mutation(aa),pubmedID. |
| GRCh37 position | Mutation(aa) | Unique sampleID count |
| chr23:2936675-2936675 | p.Y289D | 4 |
| chr23:2936584-2936584 | p.R258R | 2 |
| chr23:2933043-2933043 | p.R125W | 2 |
| chr23:2933326-2933326 | p.R219Q | 2 |
| chr23:2936618-2936618 | p.V270I | 2 |
| chr23:2951252-2951252 | p.S505S | 2 |
| chr23:2928153-2928153 | p.R59W | 2 |
| chr23:2931164-2931164 | p.T97T | 2 |
| chr23:2936657-2936657 | p.R283C | 2 |
| chr23:2951169-2951169 | p.D478N | 2 |
| Top |
|
 |
| Point Mutation/ Tissue ID | 1 | 2 | 3 | 4 | 5 | 6 | 7 | 8 | 9 | 10 | 11 | 12 | 13 | 14 | 15 | 16 | 17 | 18 | 19 | 20 |
| # sample | 3 | 4 | 2 | 1 | 12 | 4 | 11 | 2 | 10 | |||||||||||
| # mutation | 3 | 4 | 2 | 1 | 12 | 4 | 11 | 2 | 12 | |||||||||||
| nonsynonymous SNV | 1 | 2 | 1 | 7 | 4 | 3 | 2 | 10 | ||||||||||||
| synonymous SNV | 2 | 2 | 2 | 5 | 8 | 2 |
| cf) Tissue ID; Tissue type (1; BLCA[Bladder Urothelial Carcinoma], 2; BRCA[Breast invasive carcinoma], 3; CESC[Cervical squamous cell carcinoma and endocervical adenocarcinoma], 4; COAD[Colon adenocarcinoma], 5; GBM[Glioblastoma multiforme], 6; Glioma Low Grade, 7; HNSC[Head and Neck squamous cell carcinoma], 8; KICH[Kidney Chromophobe], 9; KIRC[Kidney renal clear cell carcinoma], 10; KIRP[Kidney renal papillary cell carcinoma], 11; LAML[Acute Myeloid Leukemia], 12; LUAD[Lung adenocarcinoma], 13; LUSC[Lung squamous cell carcinoma], 14; OV[Ovarian serous cystadenocarcinoma ], 15; PAAD[Pancreatic adenocarcinoma], 16; PRAD[Prostate adenocarcinoma], 17; SKCM[Skin Cutaneous Melanoma], 18:STAD[Stomach adenocarcinoma], 19:THCA[Thyroid carcinoma], 20:UCEC[Uterine Corpus Endometrial Carcinoma]) |
| Top |
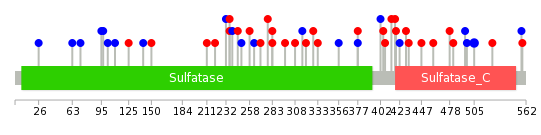
| * We represented just top 10 SNVs. When you move the cursor on each content, you can see more deailed mutation information on the Tooltip. Those are primary_site, primary_histology, mutation(aa), pubmedID. |
| Genomic Position | Mutation(aa) | Unique sampleID count |
| chrX:2951252 | p.S505S | 2 |
| chrX:2933378 | p.T97T | 1 |
| chrX:2951222 | p.V270I | 1 |
| chrX:2942084 | p.R414M | 1 |
| chrX:2931164 | p.L102L | 1 |
| chrX:2947329 | p.K278N | 1 |
| chrX:2933387 | p.S418Y | 1 |
| chrX:2951228 | p.T110T | 1 |
| chrX:2942108 | p.R283C | 1 |
| chrX:2931179 | p.D419N | 1 |
| * Copy number data were extracted from TCGA using R package TCGA-Assembler. The URLs of all public data files on TCGA DCC data server were gathered on Jan-05-2015. Function ProcessCNAData in TCGA-Assembler package was used to obtain gene-level copy number value which is calculated as the average copy number of the genomic region of a gene. |
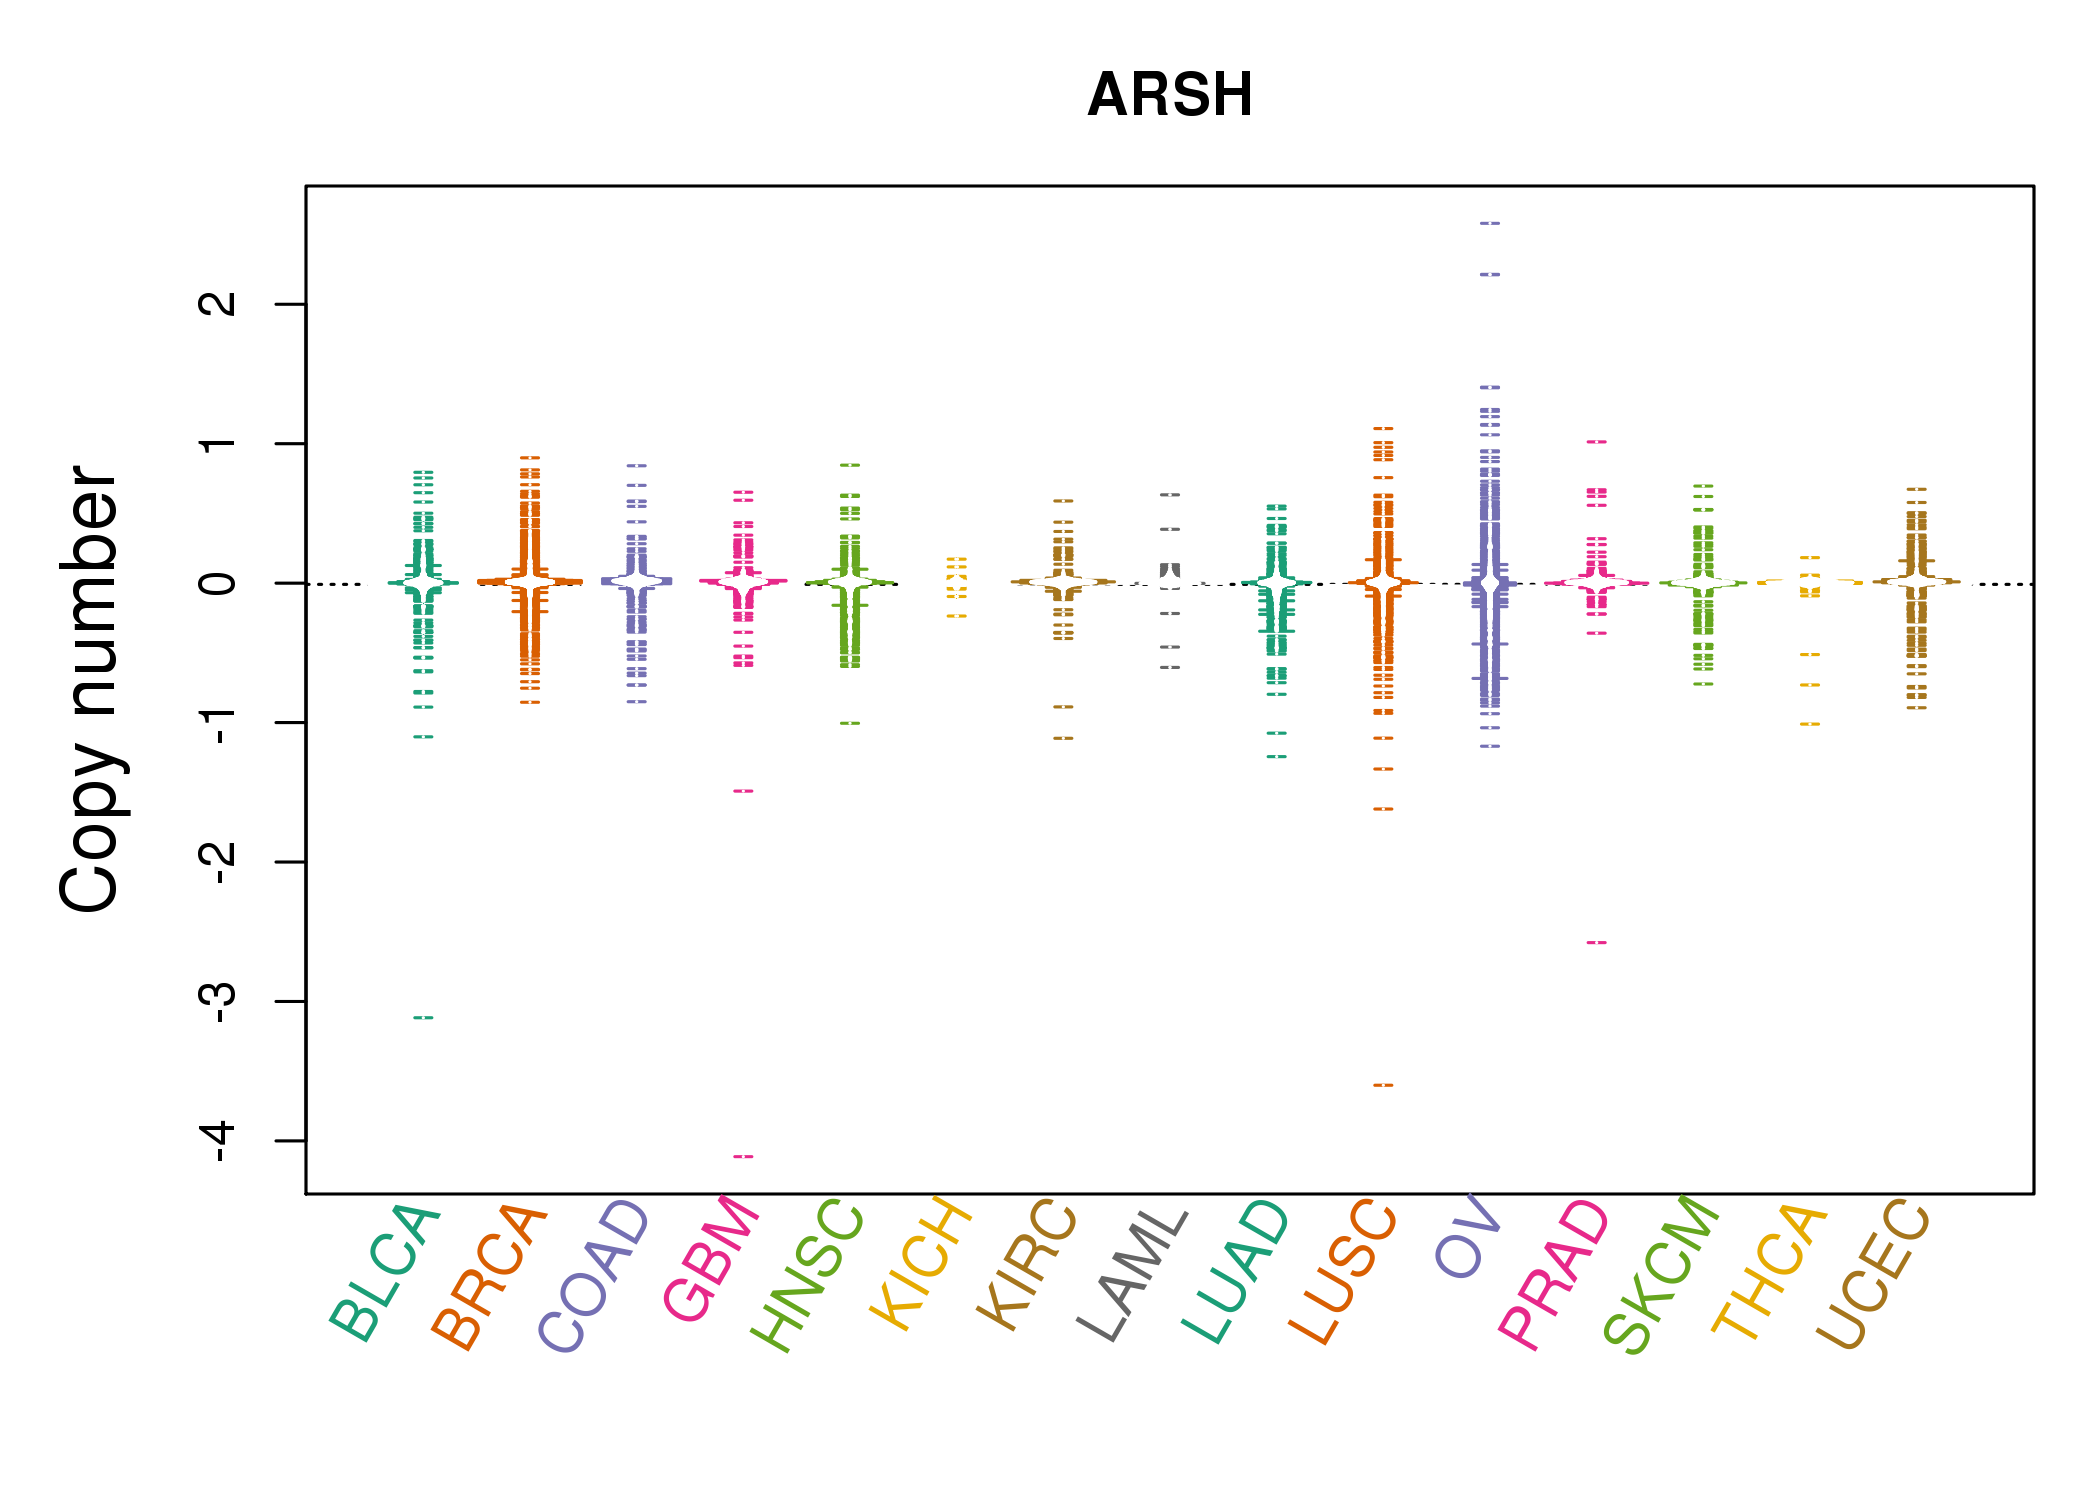 |
| cf) Tissue ID[Tissue type]: BLCA[Bladder Urothelial Carcinoma], BRCA[Breast invasive carcinoma], CESC[Cervical squamous cell carcinoma and endocervical adenocarcinoma], COAD[Colon adenocarcinoma], GBM[Glioblastoma multiforme], Glioma Low Grade, HNSC[Head and Neck squamous cell carcinoma], KICH[Kidney Chromophobe], KIRC[Kidney renal clear cell carcinoma], KIRP[Kidney renal papillary cell carcinoma], LAML[Acute Myeloid Leukemia], LUAD[Lung adenocarcinoma], LUSC[Lung squamous cell carcinoma], OV[Ovarian serous cystadenocarcinoma ], PAAD[Pancreatic adenocarcinoma], PRAD[Prostate adenocarcinoma], SKCM[Skin Cutaneous Melanoma], STAD[Stomach adenocarcinoma], THCA[Thyroid carcinoma], UCEC[Uterine Corpus Endometrial Carcinoma] |
| Top |
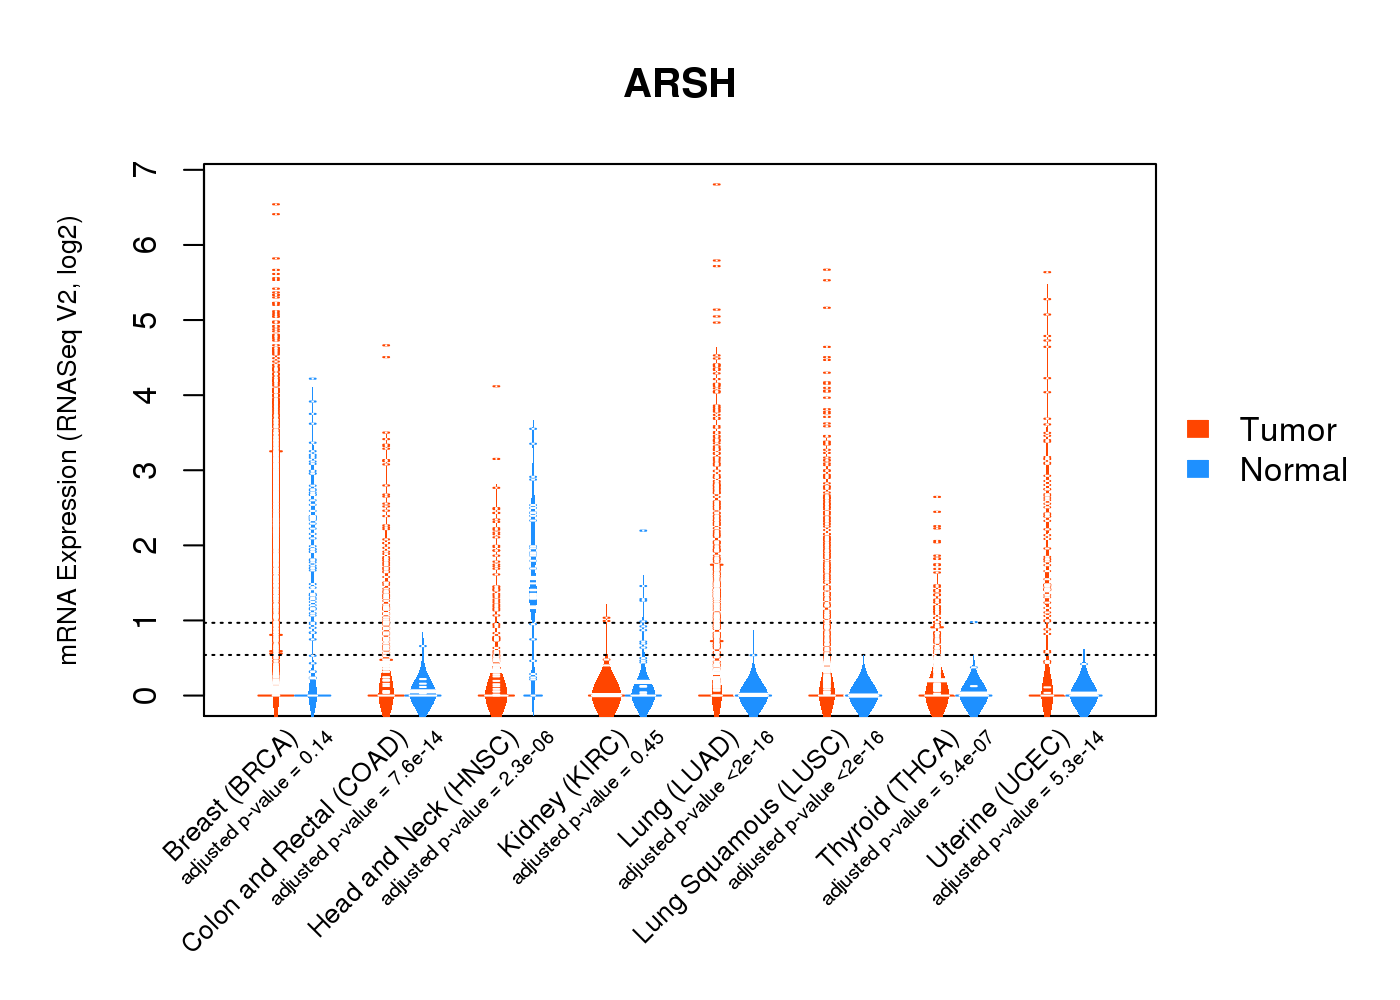
| Gene Expression for ARSH |
| * CCLE gene expression data were extracted from CCLE_Expression_Entrez_2012-10-18.res: Gene-centric RMA-normalized mRNA expression data. |
 |
| * Normalized gene expression data of RNASeqV2 was extracted from TCGA using R package TCGA-Assembler. The URLs of all public data files on TCGA DCC data server were gathered at Jan-05-2015. Only eight cancer types have enough normal control samples for differential expression analysis. (t test, adjusted p<0.05 (using Benjamini-Hochberg FDR)) |
 |
| Top |
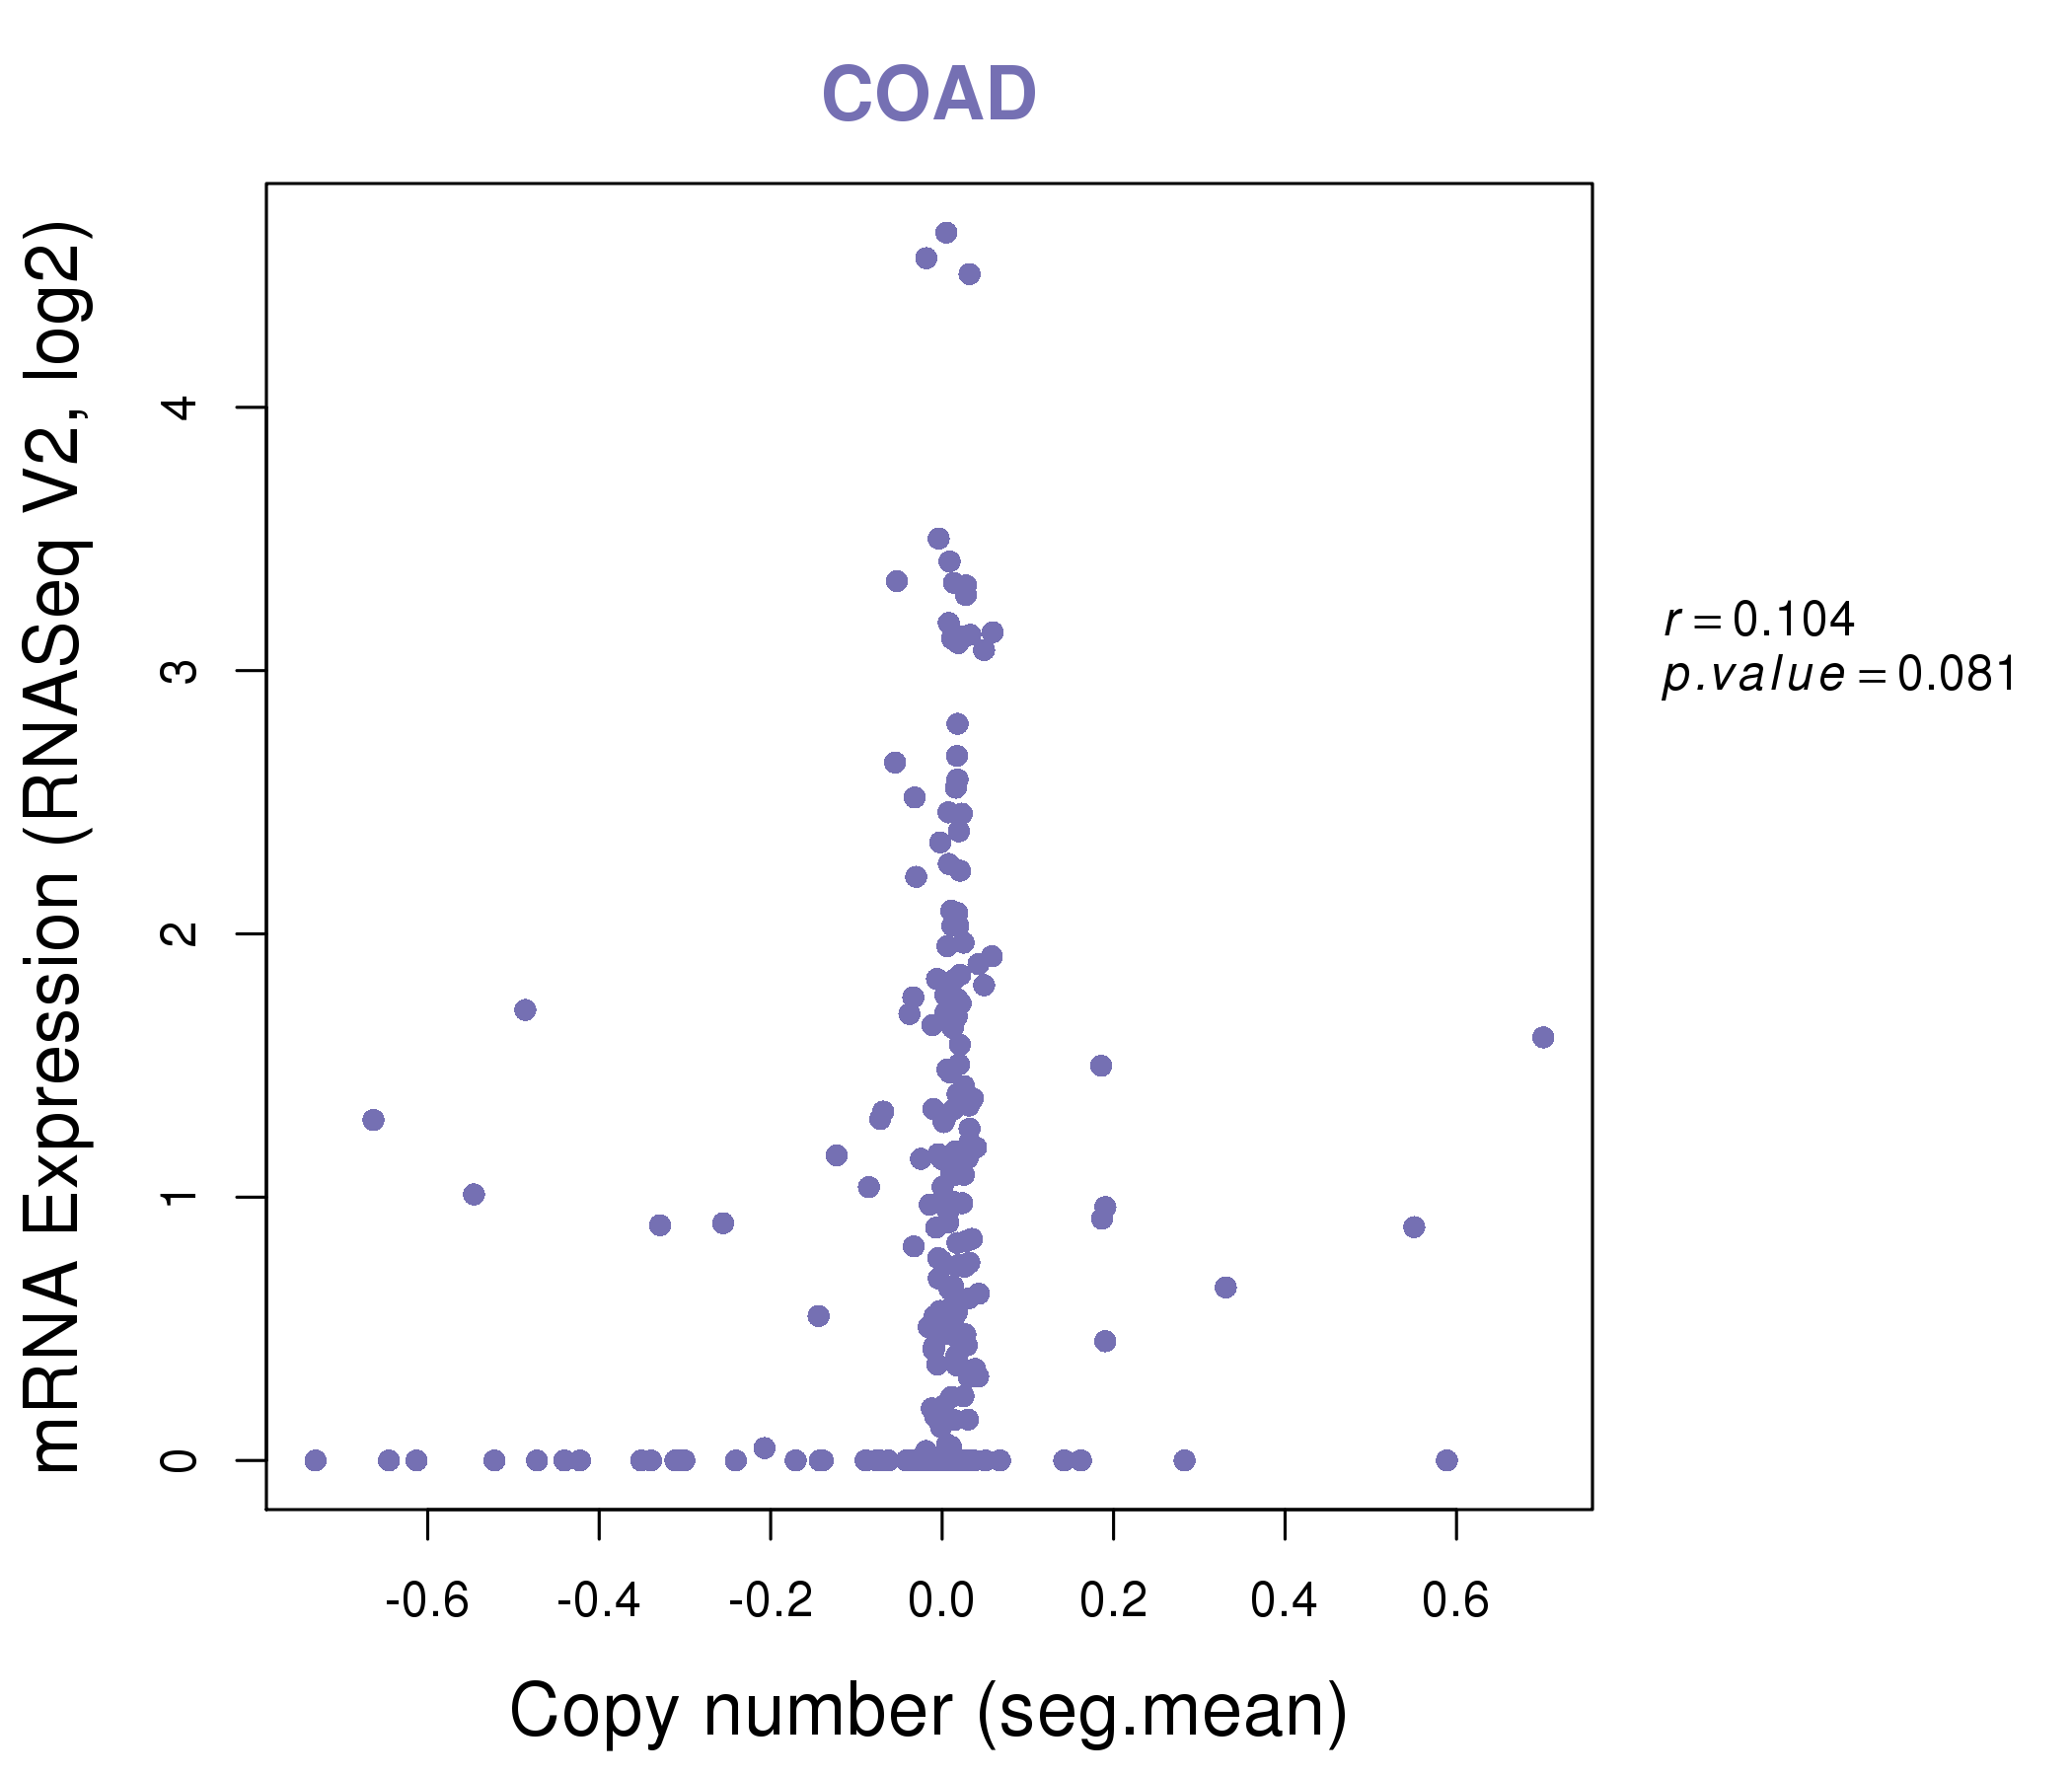
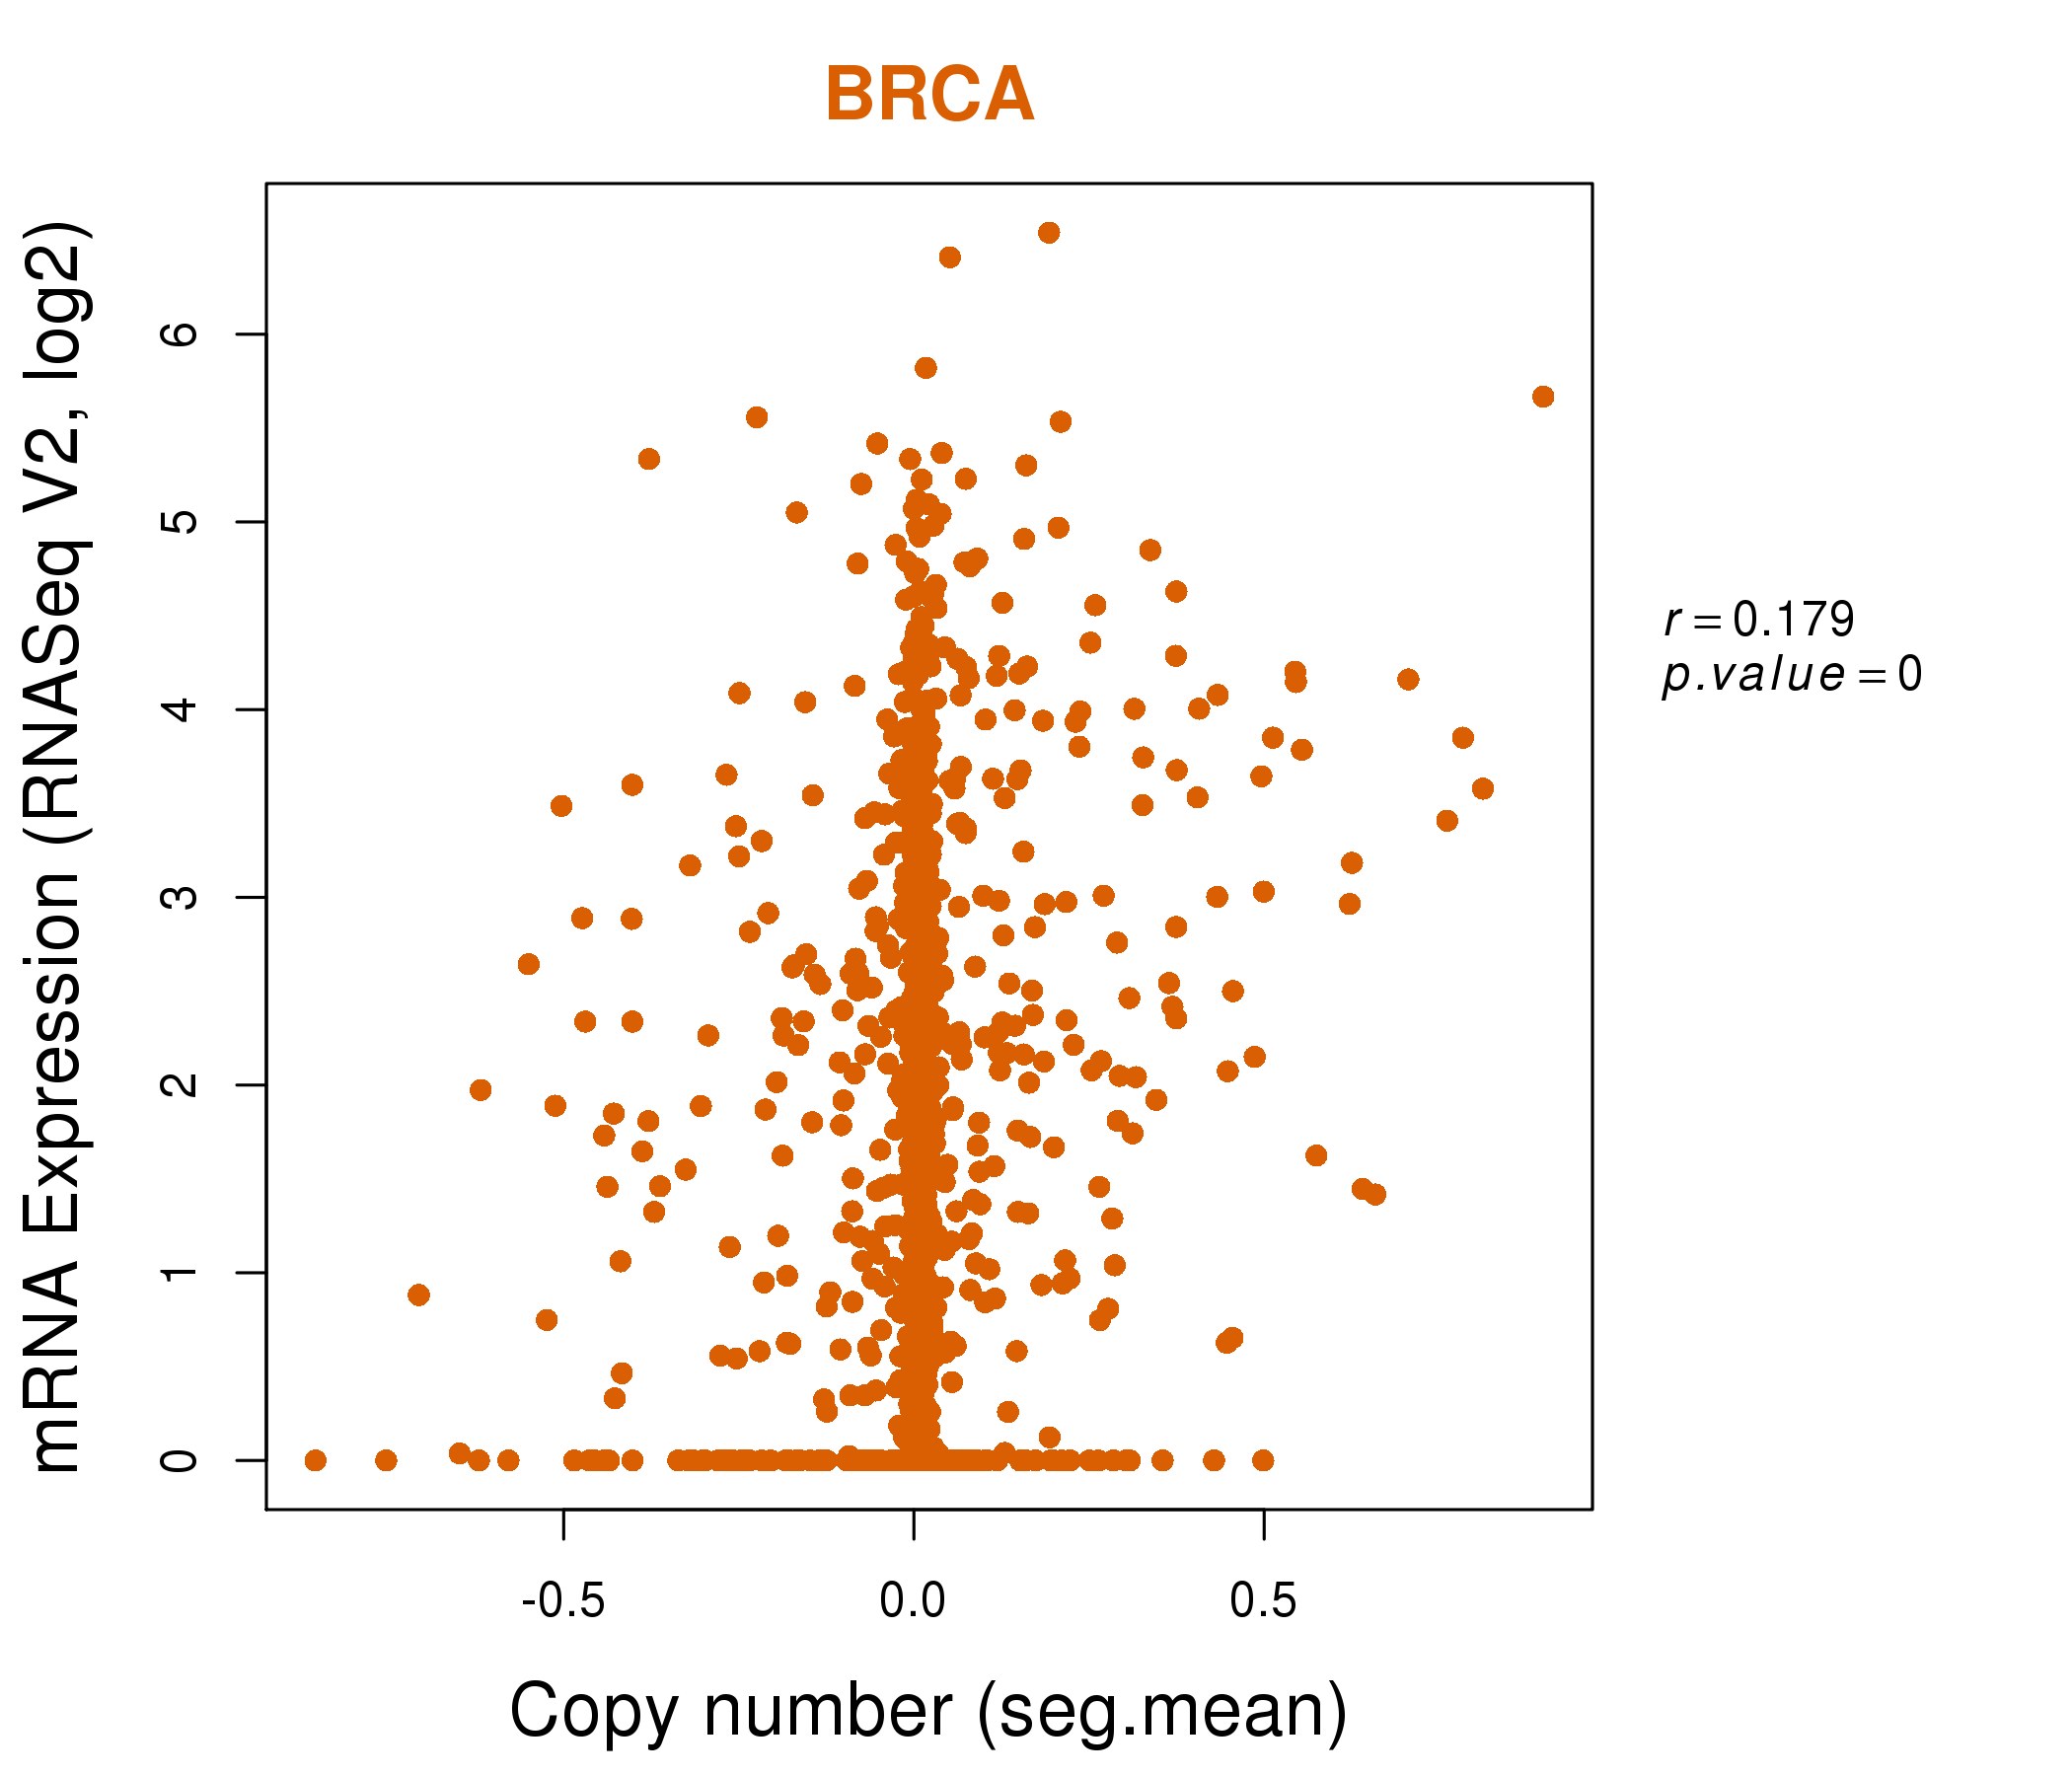
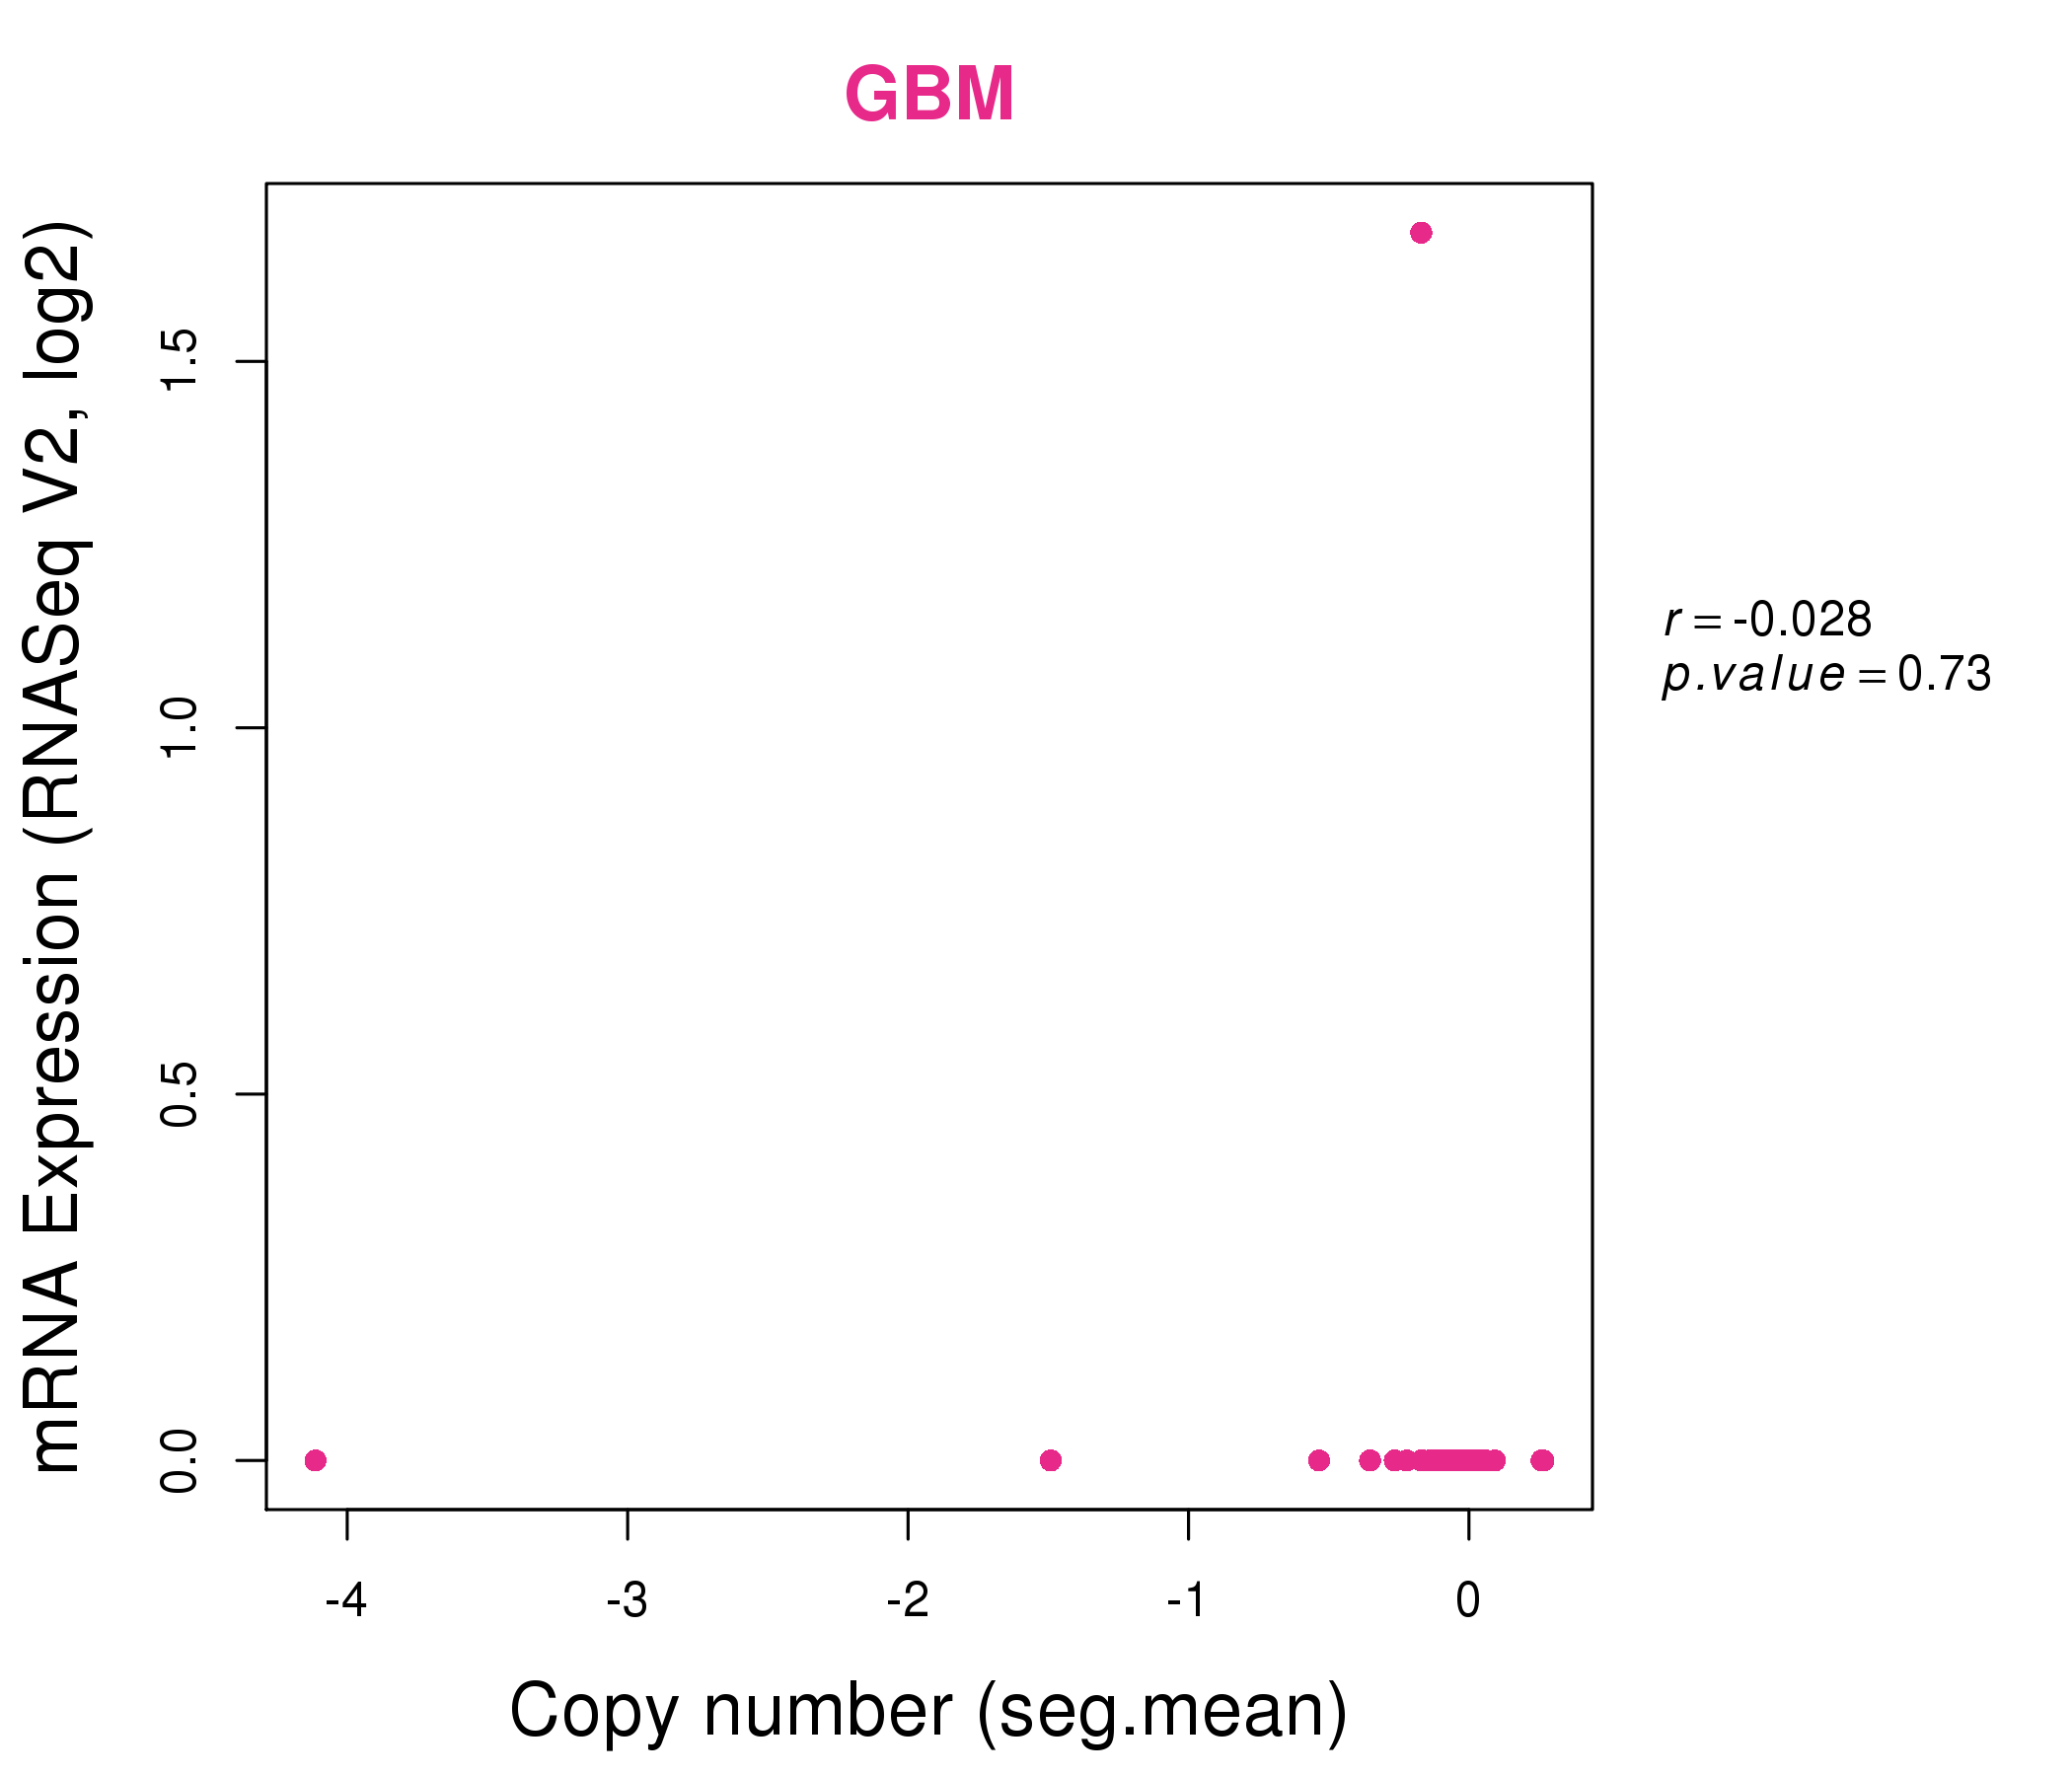
| * This plots show the correlation between CNV and gene expression. |
: Open all plots for all cancer types
 |
|
 |
|
| Top |
| Gene-Gene Network Information |
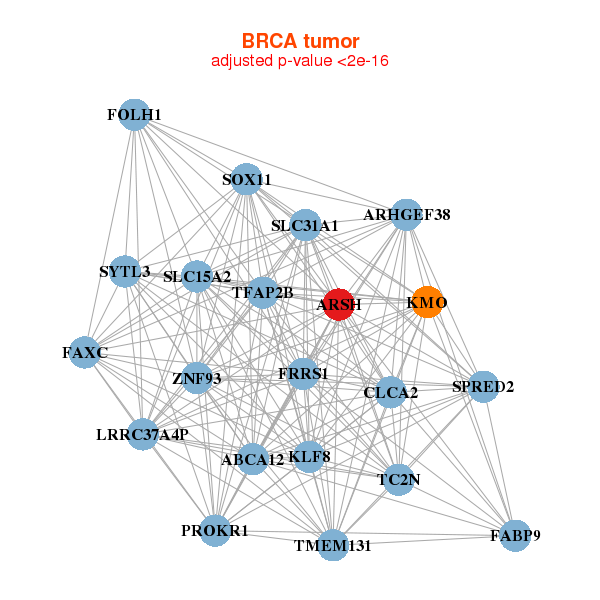
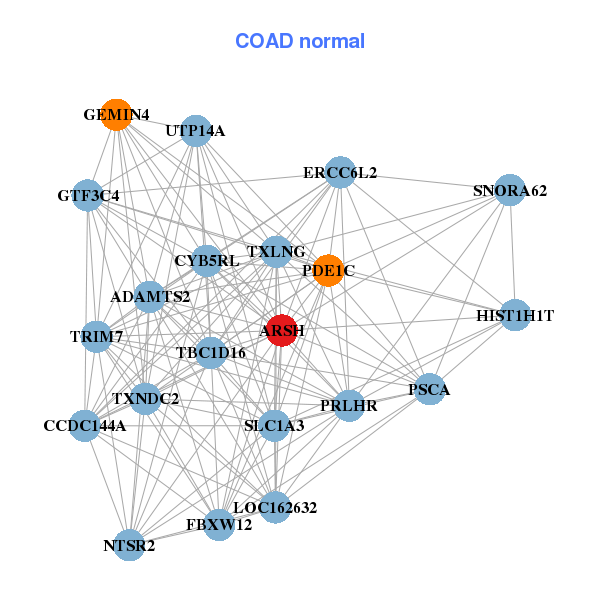
| * Co-Expression network figures were drawn using R package igraph. Only the top 20 genes with the highest correlations were shown. Red circle: input gene, orange circle: cell metabolism gene, sky circle: other gene |
: Open all plots for all cancer types
 |
|
| ABCA12,ARHGEF38,ARSH,FAXC,CLCA2,FABP9,FOLH1, FRRS1,KLF8,KMO,LRRC37A4P,PROKR1,SLC15A2,SLC31A1, SOX11,SPRED2,SYTL3,TC2N,TFAP2B,TMEM131,ZNF93 | AHCY,AP1M2,ARSH,ASTN2,BSPRY,C2orf15,EFNA4, IGSF3,KIAA1324,CAMSAP3,LPAR3,MAGEF1,MAPK13,MARCKSL1, NIPSNAP1,PIK3R2,PTK7,SEZ6L2,SLC12A8,SMPDL3B,SYT7 |
 |
|
| ACN9,ARSH,C6orf57,CAV3,CMC1,COX7A2,ETFA, FBXO4,HBD,LOC285629,LOC729176,LOC729467,MED31,MRPL54, NLRP11,NLRP9,PGK1,POC1B,RNF183,SCARNA14,SLC25A5 | ADAMTS2,ARSH,ERCC6L2,CCDC144A,CYB5RL,FBXW12,GEMIN4, GTF3C4,HIST1H1T,LOC162632,NTSR2,PDE1C,PRLHR,PSCA, SLC1A3,SNORA62,TBC1D16,TRIM7,TXLNG,TXNDC2,UTP14A |

| * Co-Expression network figures were drawn using R package igraph. Only the top 20 genes with the highest correlations were shown. Red circle: input gene, orange circle: cell metabolism gene, sky circle: other gene |
: Open all plots for all cancer types
| Top |
: Open all interacting genes' information including KEGG pathway for all interacting genes from DAVID
| Top |
| Pharmacological Information for ARSH |
| There's no related Drug. |
| Top |
| Cross referenced IDs for ARSH |
| * We obtained these cross-references from Uniprot database. It covers 150 different DBs, 18 categories. http://www.uniprot.org/help/cross_references_section |
: Open all cross reference information
|
Copyright © 2016-Present - The Univsersity of Texas Health Science Center at Houston @ |