|
|||||||||||||||||||||||||||||||||||||||||||||||||||||||||||||||||||||||||||||||||||||||||||||||||||||||||||||||||||||||||||||||||||||||||||||||||||||||||||||||||||||||||||||||||||||||||||||||||||||||||||||||||||||||||||||||||||||||||||||||||||||||||||||||||||||||||||||||||||||||||||||||||||||||||||||||||||||||||||||||||||||||||||||||||||
| |
| Phenotypic Information (metabolism pathway, cancer, disease, phenome) |
| |
| |
| Gene-Gene Network Information: Co-Expression Network, Interacting Genes & KEGG |
| |
|


| Gene Summary for ACADSB |
| Basic gene info. | Gene symbol | ACADSB |
| Gene name | acyl-CoA dehydrogenase, short/branched chain | |
| Synonyms | 2-MEBCAD|ACAD7|SBCAD | |
| Cytomap | UCSC genome browser: 10q26.13 | |
| Genomic location | chr10 :124768428-124817806 | |
| Type of gene | protein-coding | |
| RefGenes | NM_001609.3, | |
| Ensembl id | ENSG00000196177 | |
| Description | 2-methyl branched chain acyl-CoA dehydrogenase2-methylbutyryl-coenzyme A dehydrogenaseacyl-Coenzyme A dehydrogenase, short/branched chainshort/branched chain specific acyl-CoA dehydrogenase, mitochondrial | |
| Modification date | 20141207 | |
| dbXrefs | MIM : 600301 | |
| HGNC : HGNC | ||
| Ensembl : ENSG00000196177 | ||
| HPRD : 02626 | ||
| Vega : OTTHUMG00000019200 | ||
| Protein | UniProt: go to UniProt's Cross Reference DB Table | |
| Expression | CleanEX: HS_ACADSB | |
| BioGPS: 36 | ||
| Gene Expression Atlas: ENSG00000196177 | ||
| The Human Protein Atlas: ENSG00000196177 | ||
| Pathway | NCI Pathway Interaction Database: ACADSB | |
| KEGG: ACADSB | ||
| REACTOME: ACADSB | ||
| ConsensusPathDB | ||
| Pathway Commons: ACADSB | ||
| Metabolism | MetaCyc: ACADSB | |
| HUMANCyc: ACADSB | ||
| Regulation | Ensembl's Regulation: ENSG00000196177 | |
| miRBase: chr10 :124,768,428-124,817,806 | ||
| TargetScan: NM_001609 | ||
| cisRED: ENSG00000196177 | ||
| Context | iHOP: ACADSB | |
| cancer metabolism search in PubMed: ACADSB | ||
| UCL Cancer Institute: ACADSB | ||
| Assigned class in ccmGDB | C | |
| Top |
| Phenotypic Information for ACADSB(metabolism pathway, cancer, disease, phenome) |
| Cancer | CGAP: ACADSB |
| Familial Cancer Database: ACADSB | |
| * This gene is included in those cancer gene databases. |
|
|
|
|
|
| . | |||||||||||||||||||||||||||||||||||||||||||||||||||||||||||||||||||||||||||||||||||||||||||||||||||||||||||||||||||||||||||||||||||||||||||||||||||||||||||||||||||||||||||||||||||||||||||||||||||||||||||||||||||||||||||||||||||||||||||||||||||||||||||||||||||||||||||||||||||||||||||||||||||||||||||||||||||||||||||||||||||||||||||||
Oncogene 1 | Significant driver gene in | ||||||||||||||||||||||||||||||||||||||||||||||||||||||||||||||||||||||||||||||||||||||||||||||||||||||||||||||||||||||||||||||||||||||||||||||||||||||||||||||||||||||||||||||||||||||||||||||||||||||||||||||||||||||||||||||||||||||||||||||||||||||||||||||||||||||||||||||||||||||||||||||||||||||||||||||||||||||||||||||||||||||||||||||||||
| cf) number; DB name 1 Oncogene; http://nar.oxfordjournals.org/content/35/suppl_1/D721.long, 2 Tumor Suppressor gene; https://bioinfo.uth.edu/TSGene/, 3 Cancer Gene Census; http://www.nature.com/nrc/journal/v4/n3/abs/nrc1299.html, 4 CancerGenes; http://nar.oxfordjournals.org/content/35/suppl_1/D721.long, 5 Network of Cancer Gene; http://ncg.kcl.ac.uk/index.php, 1Therapeutic Vulnerabilities in Cancer; http://cbio.mskcc.org/cancergenomics/statius/ |
| KEGG_FATTY_ACID_METABOLISM REACTOME_METABOLISM_OF_AMINO_ACIDS_AND_DERIVATIVES | |
| OMIM | |
| Orphanet | |
| Disease | KEGG Disease: ACADSB |
| MedGen: ACADSB (Human Medical Genetics with Condition) | |
| ClinVar: ACADSB | |
| Phenotype | MGI: ACADSB (International Mouse Phenotyping Consortium) |
| PhenomicDB: ACADSB | |
| Mutations for ACADSB |
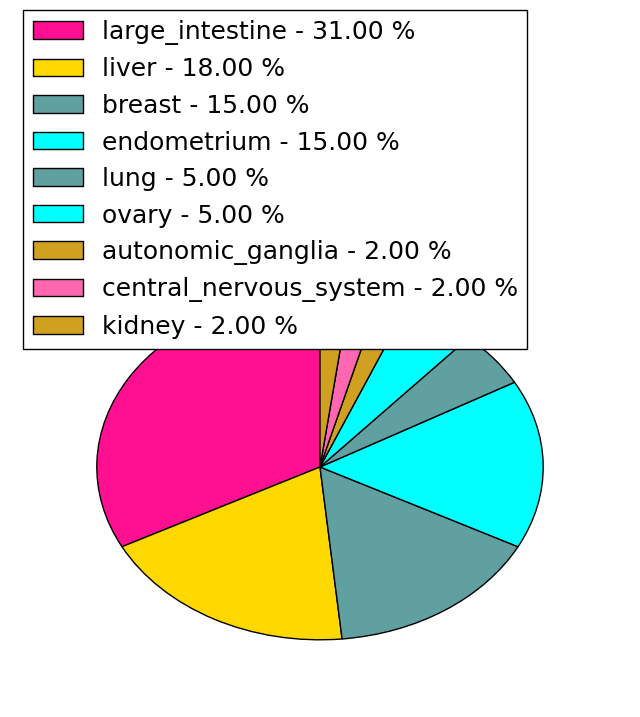
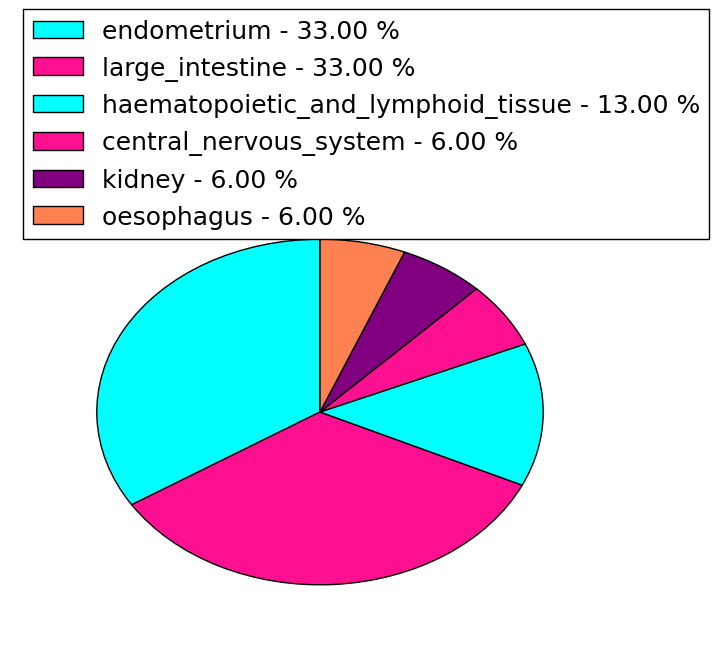
| * Under tables are showing count per each tissue to give us broad intuition about tissue specific mutation patterns.You can go to the detailed page for each mutation database's web site. |
| There's no structural variation information in COSMIC data for this gene. |
| * From mRNA Sanger sequences, Chitars2.0 arranged chimeric transcripts. This table shows ACADSB related fusion information. |
| ID | Head Gene | Tail Gene | Accession | Gene_a | qStart_a | qEnd_a | Chromosome_a | tStart_a | tEnd_a | Gene_a | qStart_a | qEnd_a | Chromosome_a | tStart_a | tEnd_a |
| BE567326 | CASP6 | 1 | 97 | 4 | 110610562 | 110610657 | ACADSB | 88 | 750 | 10 | 124813793 | 124814465 | |
| EB388356 | FAM127A | 7 | 204 | X | 134166998 | 134167195 | ACADSB | 200 | 842 | 10 | 124800157 | 124803001 | |
| Top |
| Mutation type/ Tissue ID | brca | cns | cerv | endome | haematopo | kidn | Lintest | liver | lung | ns | ovary | pancre | prost | skin | stoma | thyro | urina | |||
| Total # sample | 1 | 2 | 5 | 1 | ||||||||||||||||
| GAIN (# sample) | 1 | 1 | ||||||||||||||||||
| LOSS (# sample) | 1 | 1 | 5 |
| cf) Tissue ID; Tissue type (1; Breast, 2; Central_nervous_system, 3; Cervix, 4; Endometrium, 5; Haematopoietic_and_lymphoid_tissue, 6; Kidney, 7; Large_intestine, 8; Liver, 9; Lung, 10; NS, 11; Ovary, 12; Pancreas, 13; Prostate, 14; Skin, 15; Stomach, 16; Thyroid, 17; Urinary_tract) |
| Top |
|
 |
| Top |
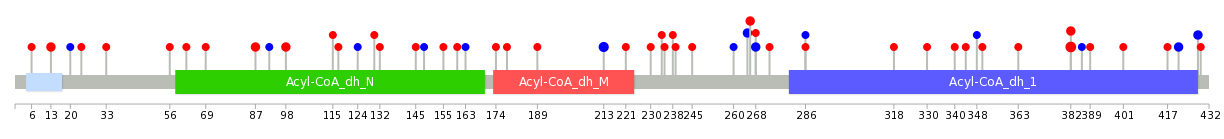
| Stat. for Non-Synonymous SNVs (# total SNVs=38) | (# total SNVs=15) |
 |  |
(# total SNVs=0) | (# total SNVs=0) |
| Top |
| * When you move the cursor on each content, you can see more deailed mutation information on the Tooltip. Those are primary_site,primary_histology,mutation(aa),pubmedID. |
| GRCh37 position | Mutation(aa) | Unique sampleID count |
| chr10:124812592-124812592 | p.T382A | 4 |
| chr10:124800853-124800853 | p.H213H | 3 |
| chr10:124802675-124802675 | p.F265F | 2 |
| chr10:124802676-124802676 | p.E266K | 2 |
| chr10:124813266-124813266 | p.I428I | 2 |
| chr10:124797320-124797320 | p.S87L | 2 |
| chr10:124802684-124802684 | p.V268V | 2 |
| chr10:124797354-124797354 | p.F98L | 2 |
| chr10:124812593-124812593 | p.T382M | 2 |
| chr10:124768583-124768583 | p.R13K | 2 |
| Top |
|
 |
| Point Mutation/ Tissue ID | 1 | 2 | 3 | 4 | 5 | 6 | 7 | 8 | 9 | 10 | 11 | 12 | 13 | 14 | 15 | 16 | 17 | 18 | 19 | 20 |
| # sample | 3 | 2 | 8 | 1 | 2 | 1 | 1 | 2 | 1 | 5 | 7 | 8 | ||||||||
| # mutation | 3 | 2 | 9 | 1 | 2 | 1 | 1 | 2 | 1 | 6 | 7 | 8 | ||||||||
| nonsynonymous SNV | 1 | 2 | 6 | 1 | 1 | 2 | 1 | 6 | 6 | 4 | ||||||||||
| synonymous SNV | 2 | 3 | 1 | 1 | 1 | 1 | 4 |
| cf) Tissue ID; Tissue type (1; BLCA[Bladder Urothelial Carcinoma], 2; BRCA[Breast invasive carcinoma], 3; CESC[Cervical squamous cell carcinoma and endocervical adenocarcinoma], 4; COAD[Colon adenocarcinoma], 5; GBM[Glioblastoma multiforme], 6; Glioma Low Grade, 7; HNSC[Head and Neck squamous cell carcinoma], 8; KICH[Kidney Chromophobe], 9; KIRC[Kidney renal clear cell carcinoma], 10; KIRP[Kidney renal papillary cell carcinoma], 11; LAML[Acute Myeloid Leukemia], 12; LUAD[Lung adenocarcinoma], 13; LUSC[Lung squamous cell carcinoma], 14; OV[Ovarian serous cystadenocarcinoma ], 15; PAAD[Pancreatic adenocarcinoma], 16; PRAD[Prostate adenocarcinoma], 17; SKCM[Skin Cutaneous Melanoma], 18:STAD[Stomach adenocarcinoma], 19:THCA[Thyroid carcinoma], 20:UCEC[Uterine Corpus Endometrial Carcinoma]) |
| Top |
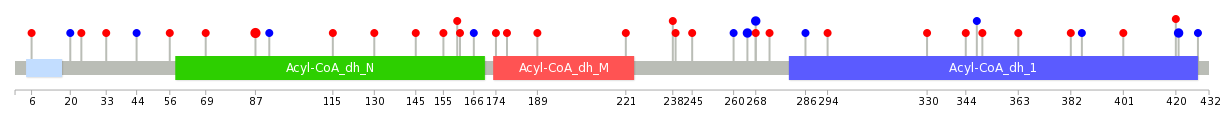
| * We represented just top 10 SNVs. When you move the cursor on each content, you can see more deailed mutation information on the Tooltip. Those are primary_site, primary_histology, mutation(aa), pubmedID. |
| Genomic Position | Mutation(aa) | Unique sampleID count |
| chr10:124797320 | p.S87L | 3 |
| chr10:124802684 | p.F265F | 2 |
| chr10:124802675 | p.V268V | 2 |
| chr10:124793996 | p.K69N | 1 |
| chr10:124812651 | p.H245Y | 1 |
| chr10:124800734 | p.Q420E | 1 |
| chr10:124803919 | p.T260T | 1 |
| chr10:124797267 | p.L421L | 1 |
| chr10:124813240 | p.L421L | 1 |
| chr10:124800748 | p.S92S | 1 |
| * Copy number data were extracted from TCGA using R package TCGA-Assembler. The URLs of all public data files on TCGA DCC data server were gathered on Jan-05-2015. Function ProcessCNAData in TCGA-Assembler package was used to obtain gene-level copy number value which is calculated as the average copy number of the genomic region of a gene. |
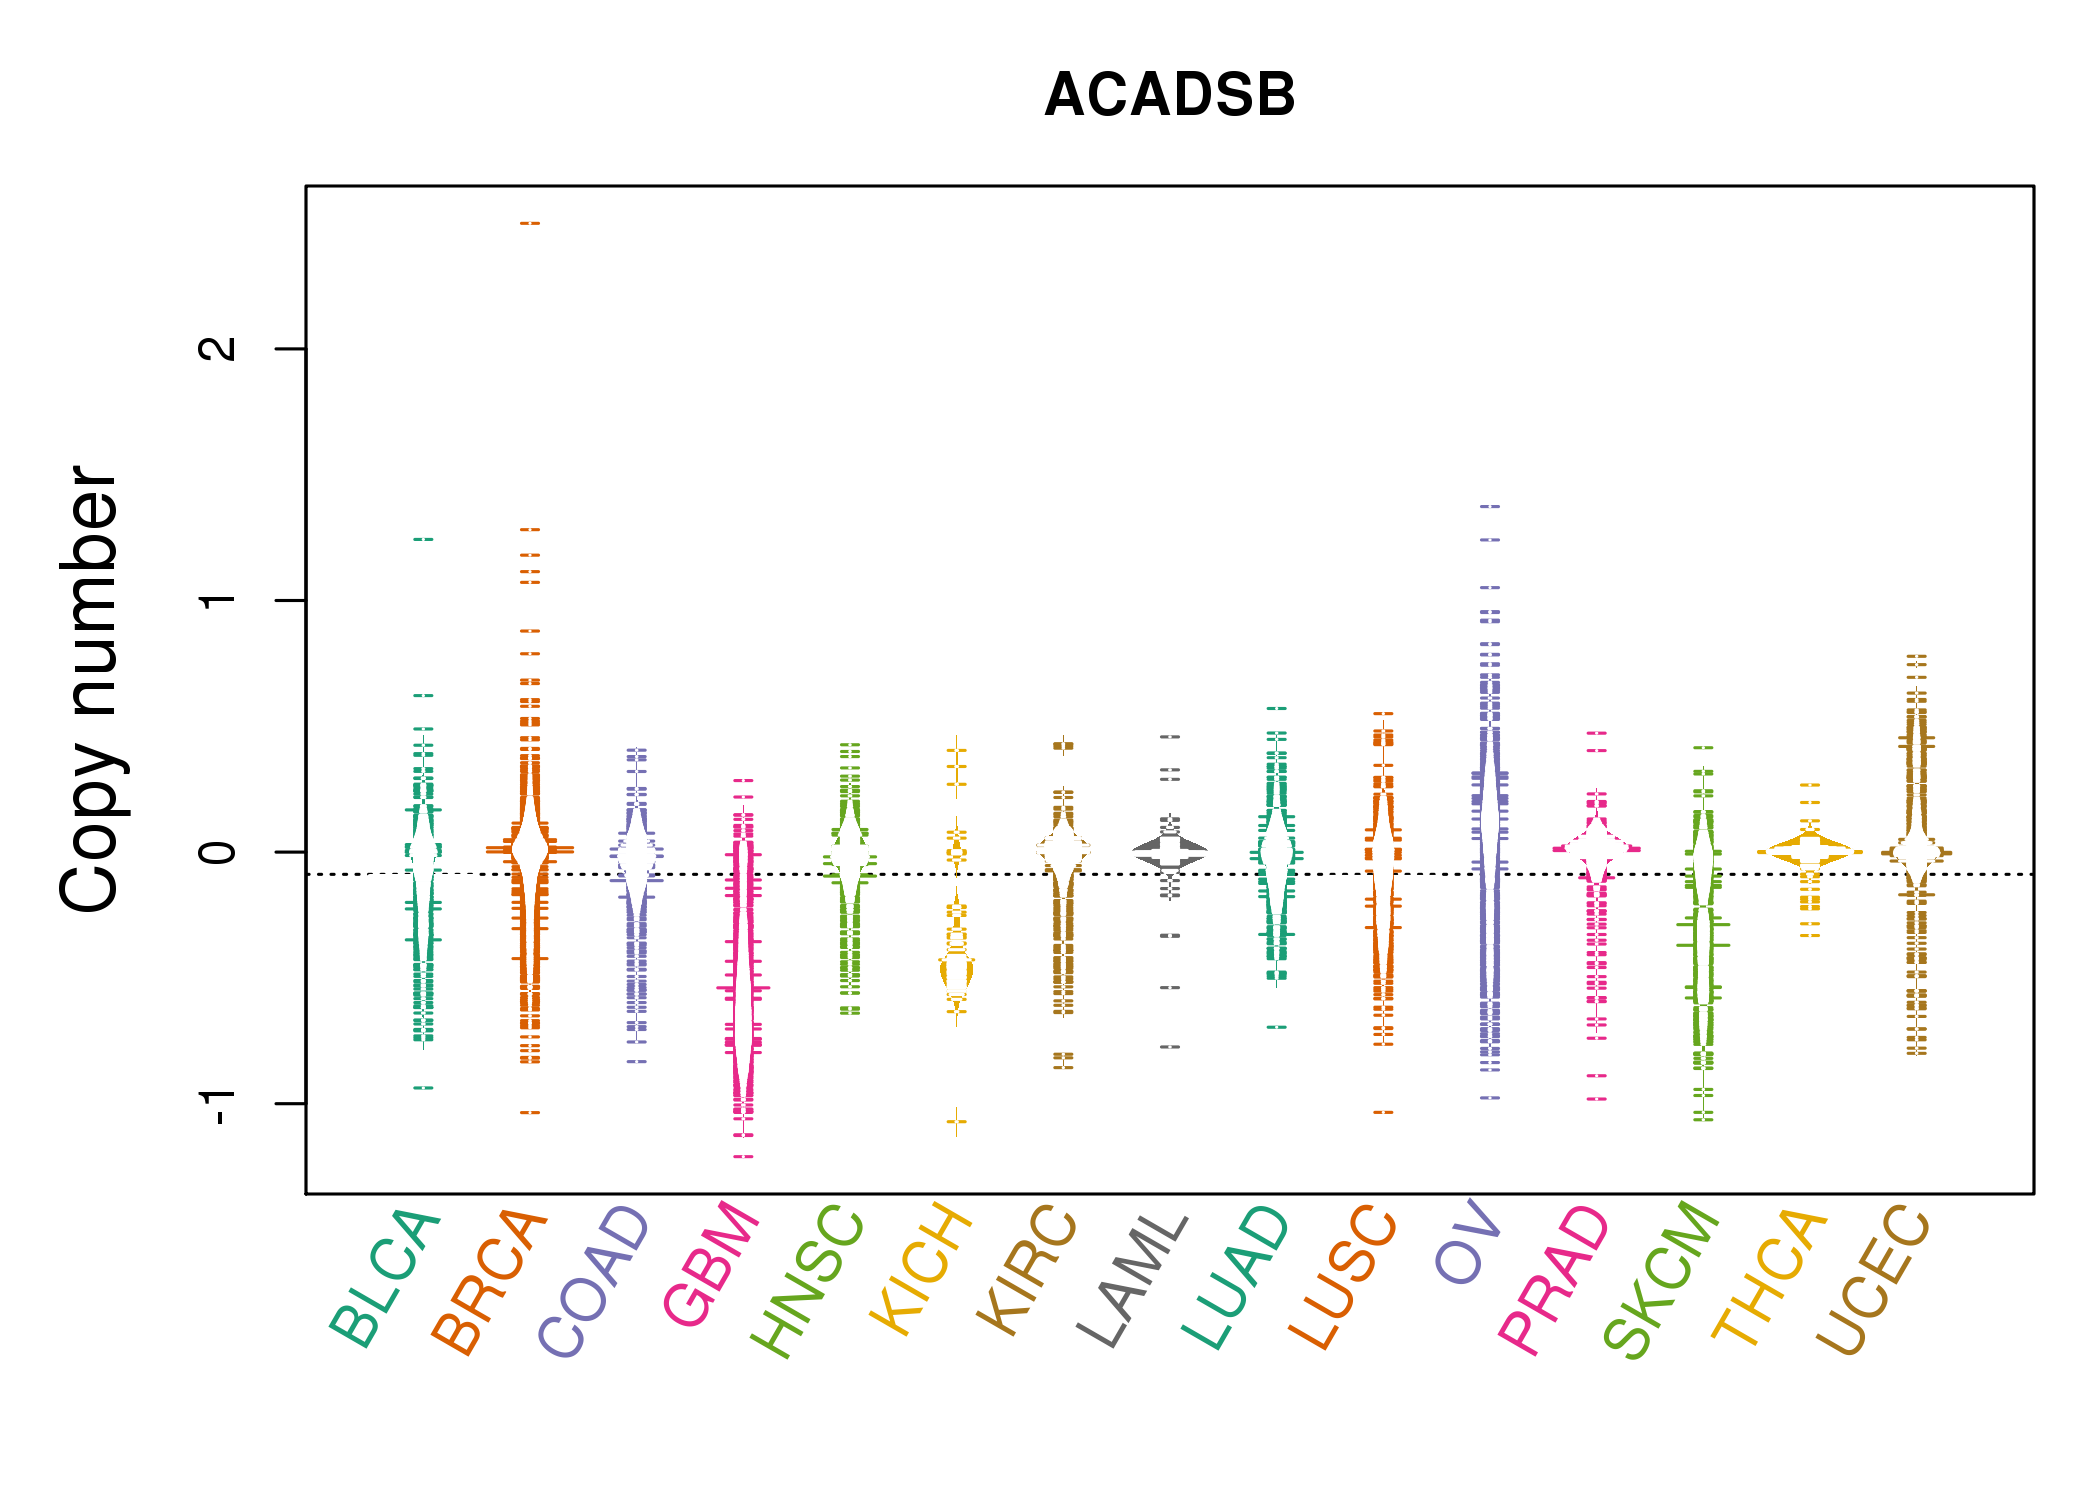 |
| cf) Tissue ID[Tissue type]: BLCA[Bladder Urothelial Carcinoma], BRCA[Breast invasive carcinoma], CESC[Cervical squamous cell carcinoma and endocervical adenocarcinoma], COAD[Colon adenocarcinoma], GBM[Glioblastoma multiforme], Glioma Low Grade, HNSC[Head and Neck squamous cell carcinoma], KICH[Kidney Chromophobe], KIRC[Kidney renal clear cell carcinoma], KIRP[Kidney renal papillary cell carcinoma], LAML[Acute Myeloid Leukemia], LUAD[Lung adenocarcinoma], LUSC[Lung squamous cell carcinoma], OV[Ovarian serous cystadenocarcinoma ], PAAD[Pancreatic adenocarcinoma], PRAD[Prostate adenocarcinoma], SKCM[Skin Cutaneous Melanoma], STAD[Stomach adenocarcinoma], THCA[Thyroid carcinoma], UCEC[Uterine Corpus Endometrial Carcinoma] |
| Top |
| Gene Expression for ACADSB |
| * CCLE gene expression data were extracted from CCLE_Expression_Entrez_2012-10-18.res: Gene-centric RMA-normalized mRNA expression data. |
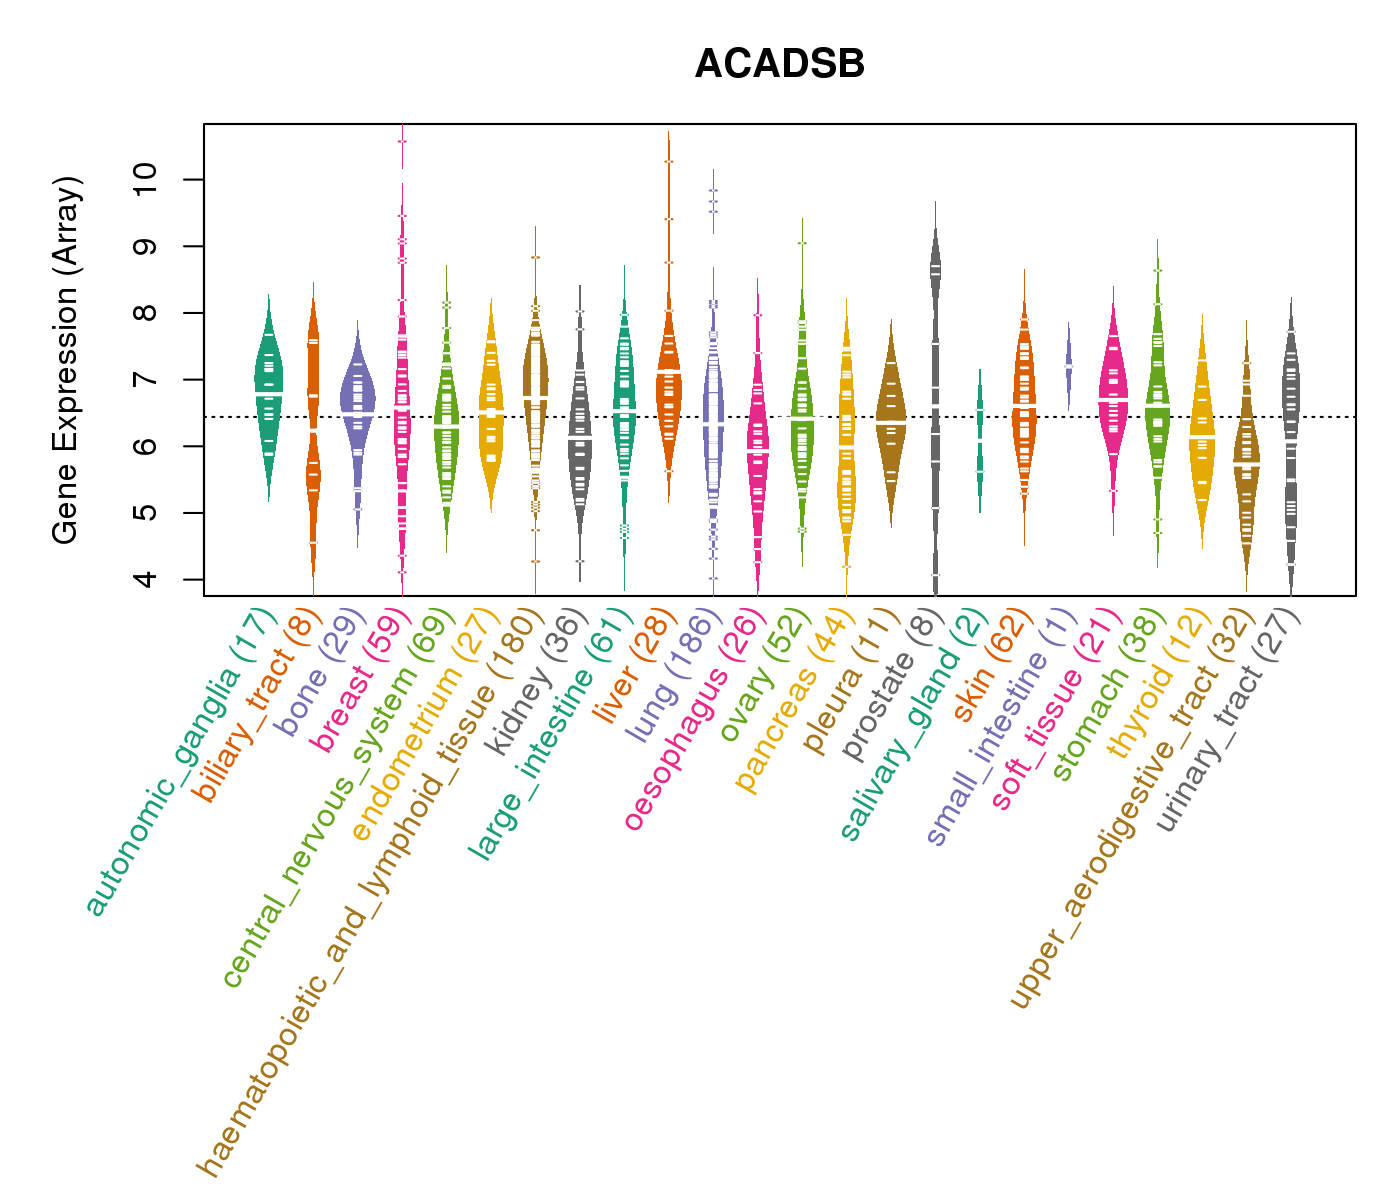 |
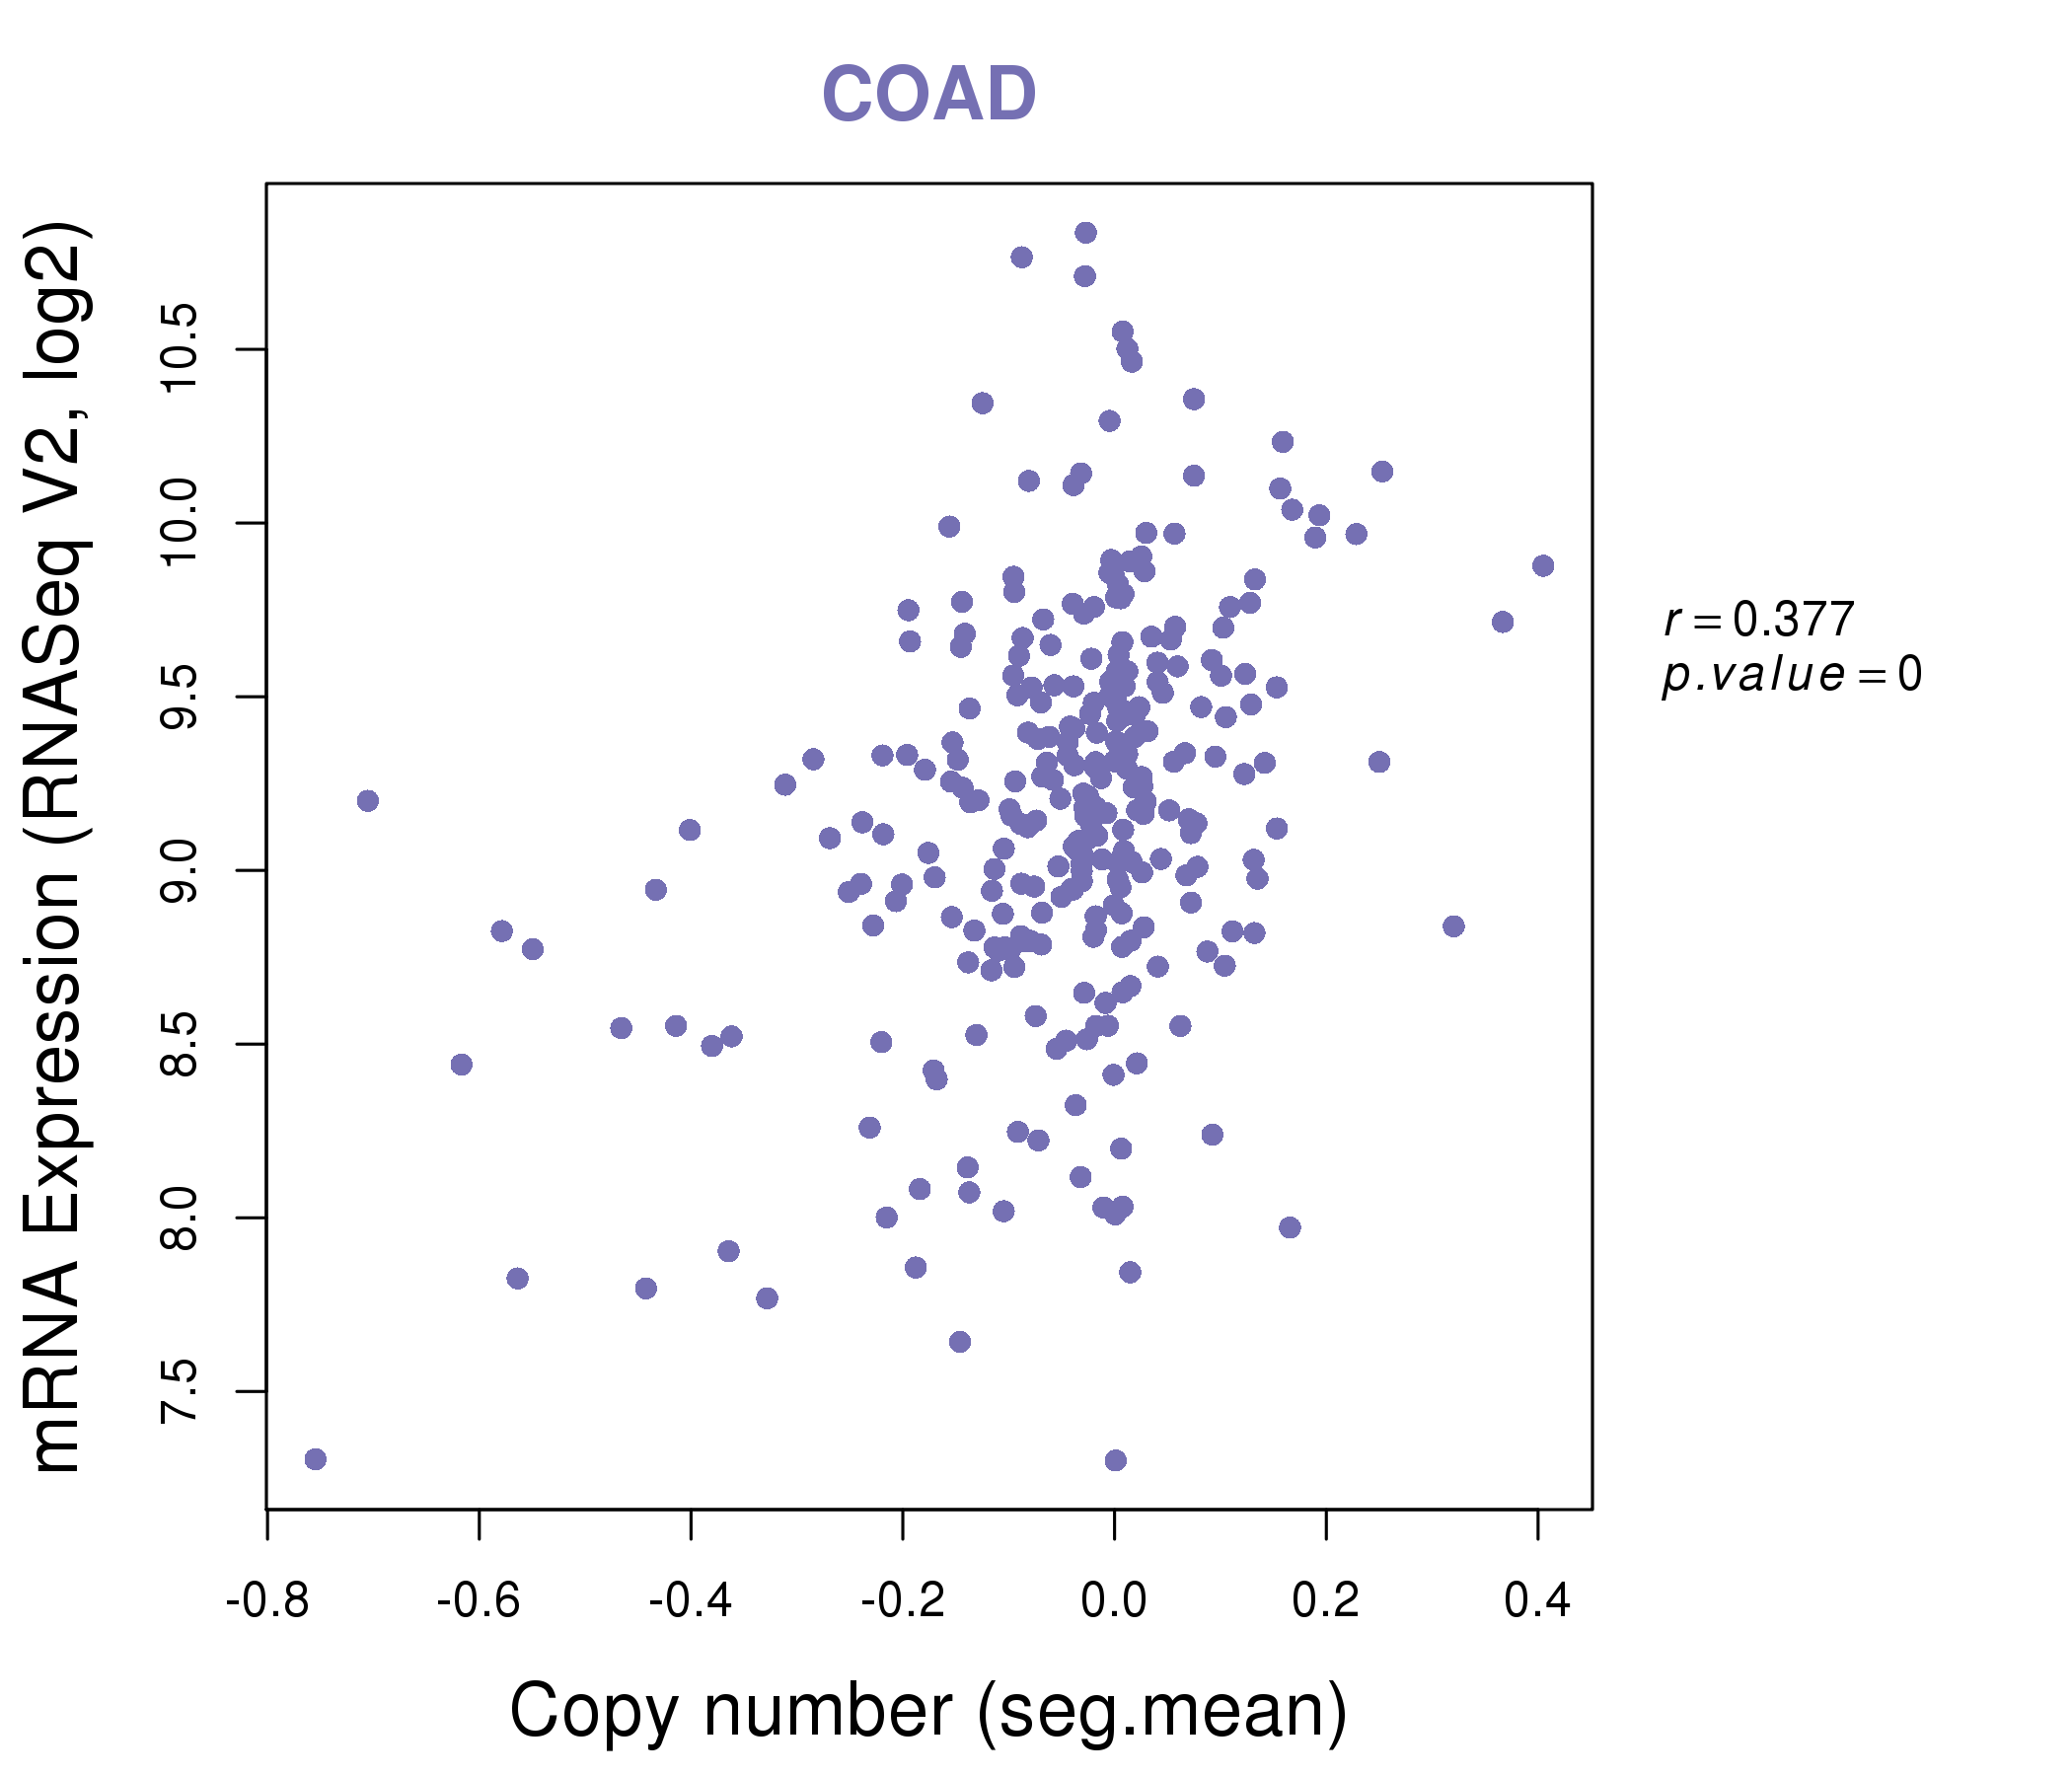
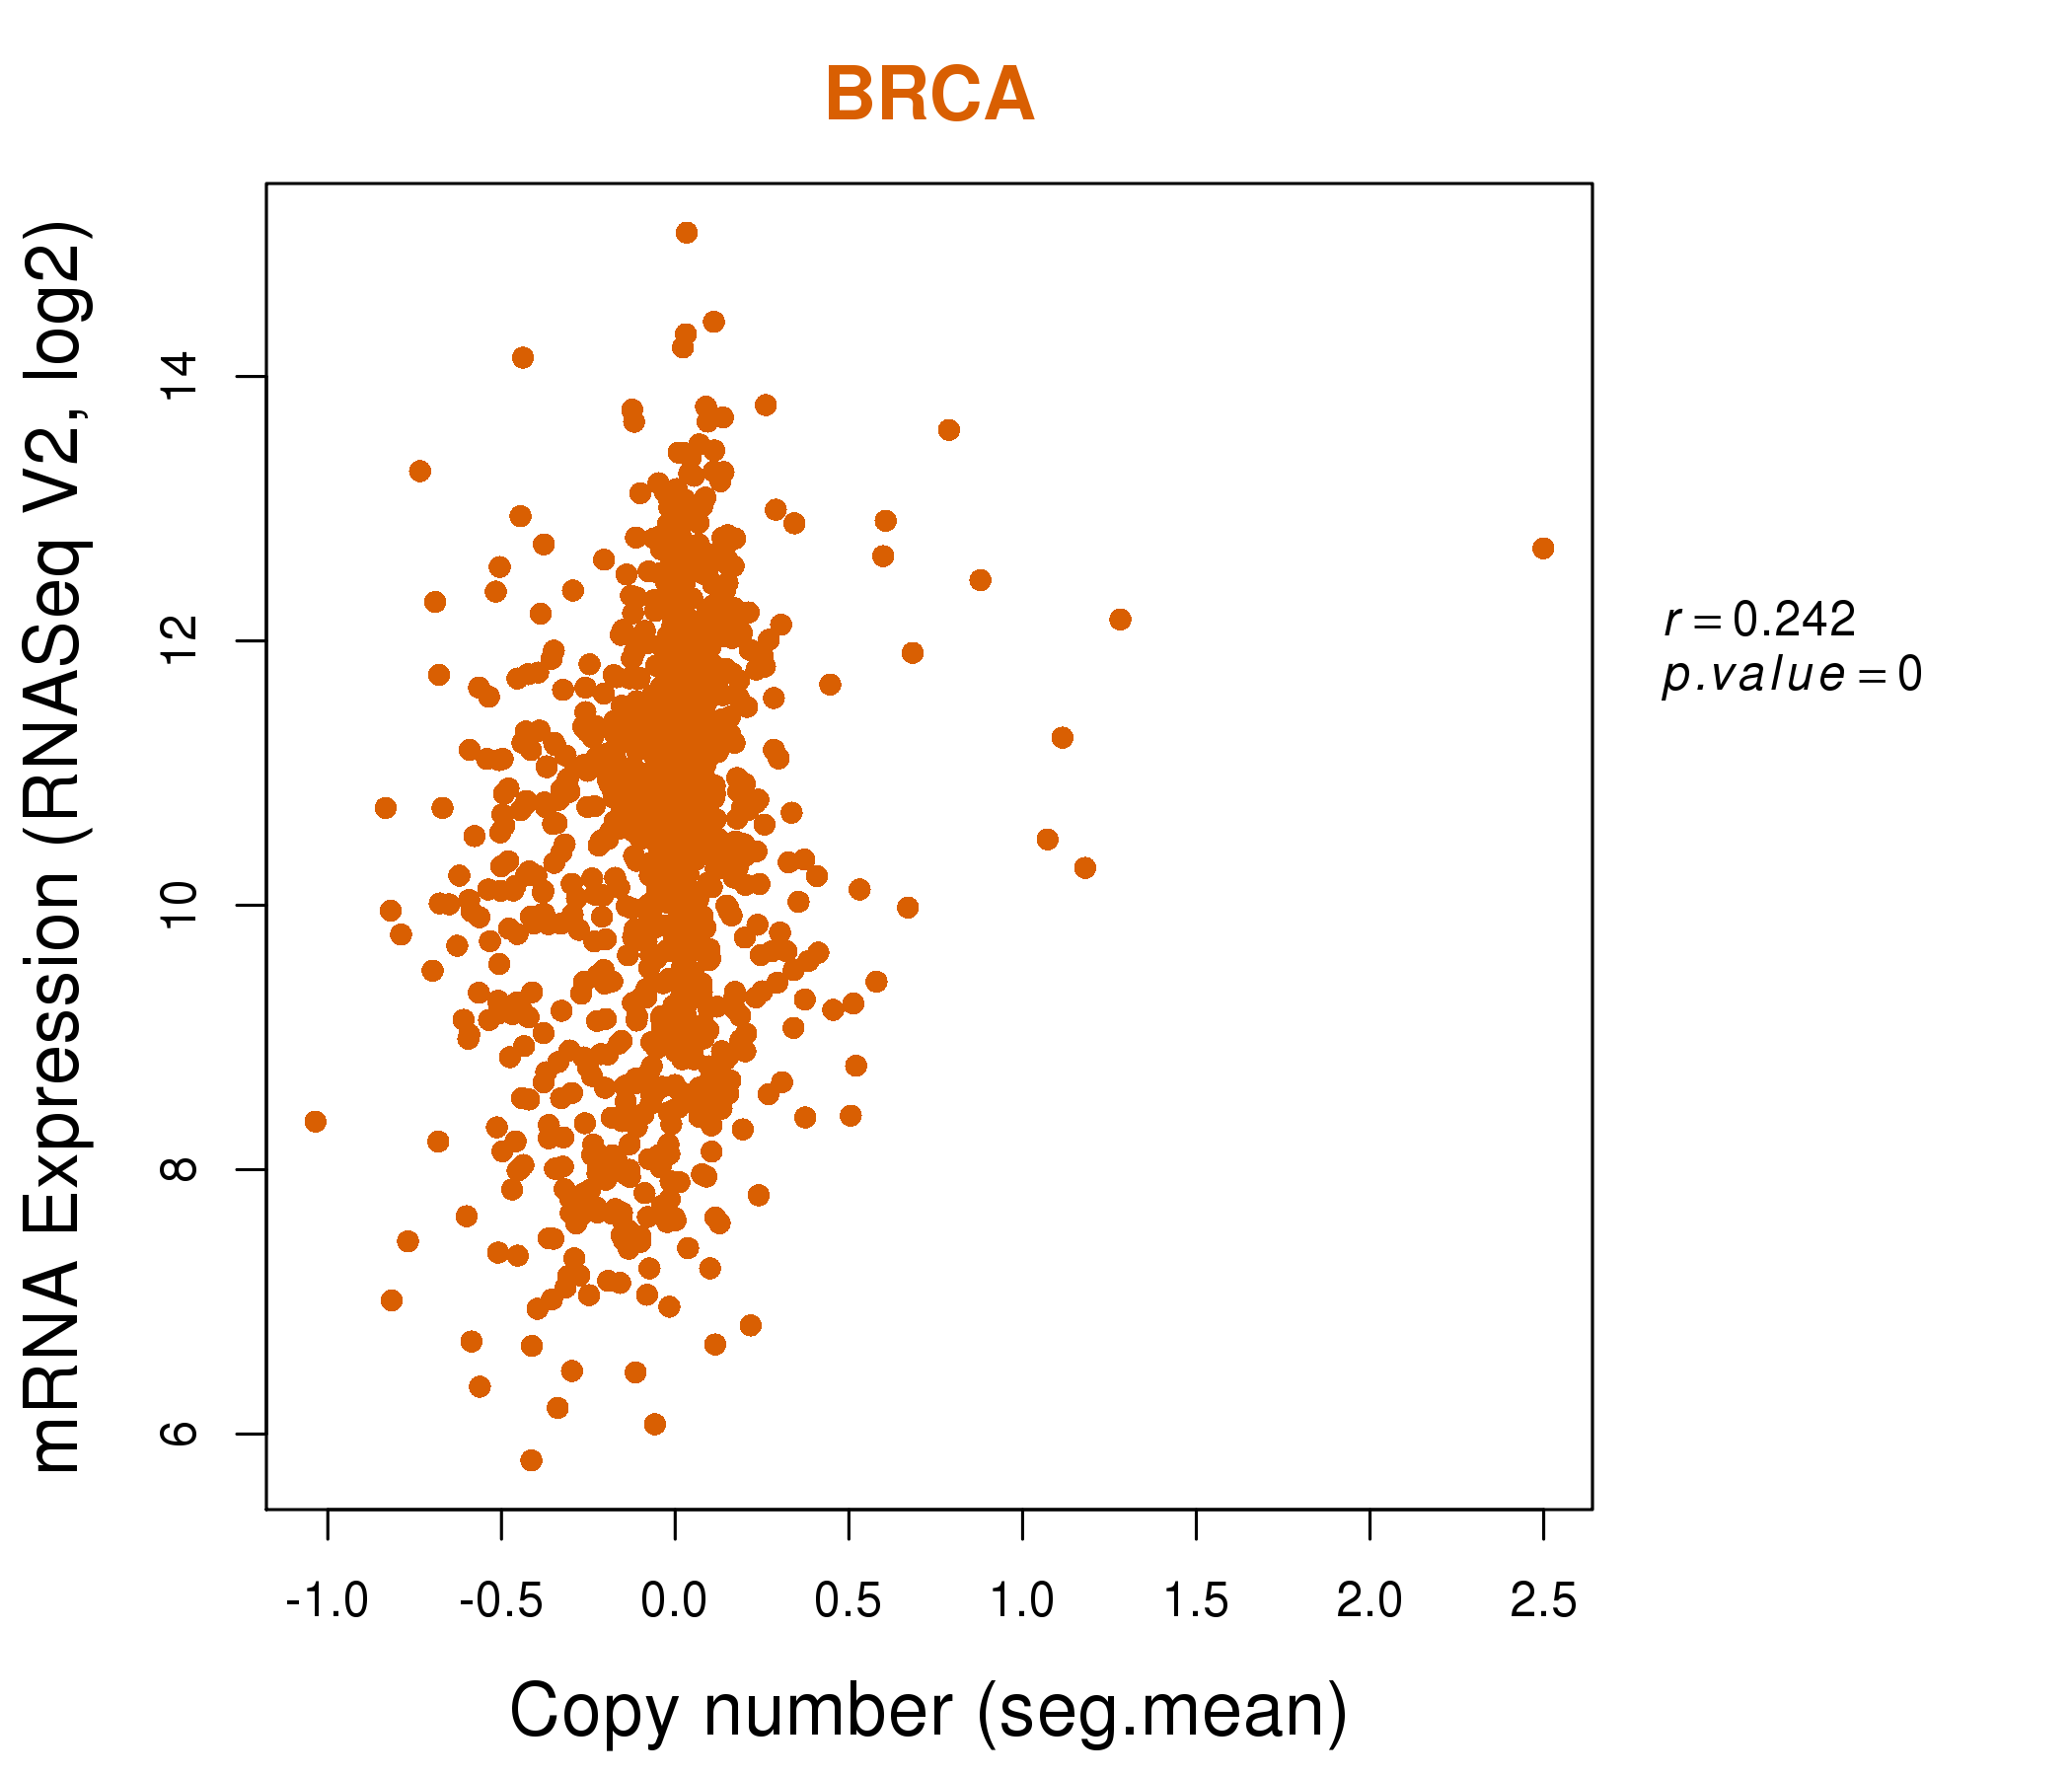
| * Normalized gene expression data of RNASeqV2 was extracted from TCGA using R package TCGA-Assembler. The URLs of all public data files on TCGA DCC data server were gathered at Jan-05-2015. Only eight cancer types have enough normal control samples for differential expression analysis. (t test, adjusted p<0.05 (using Benjamini-Hochberg FDR)) |
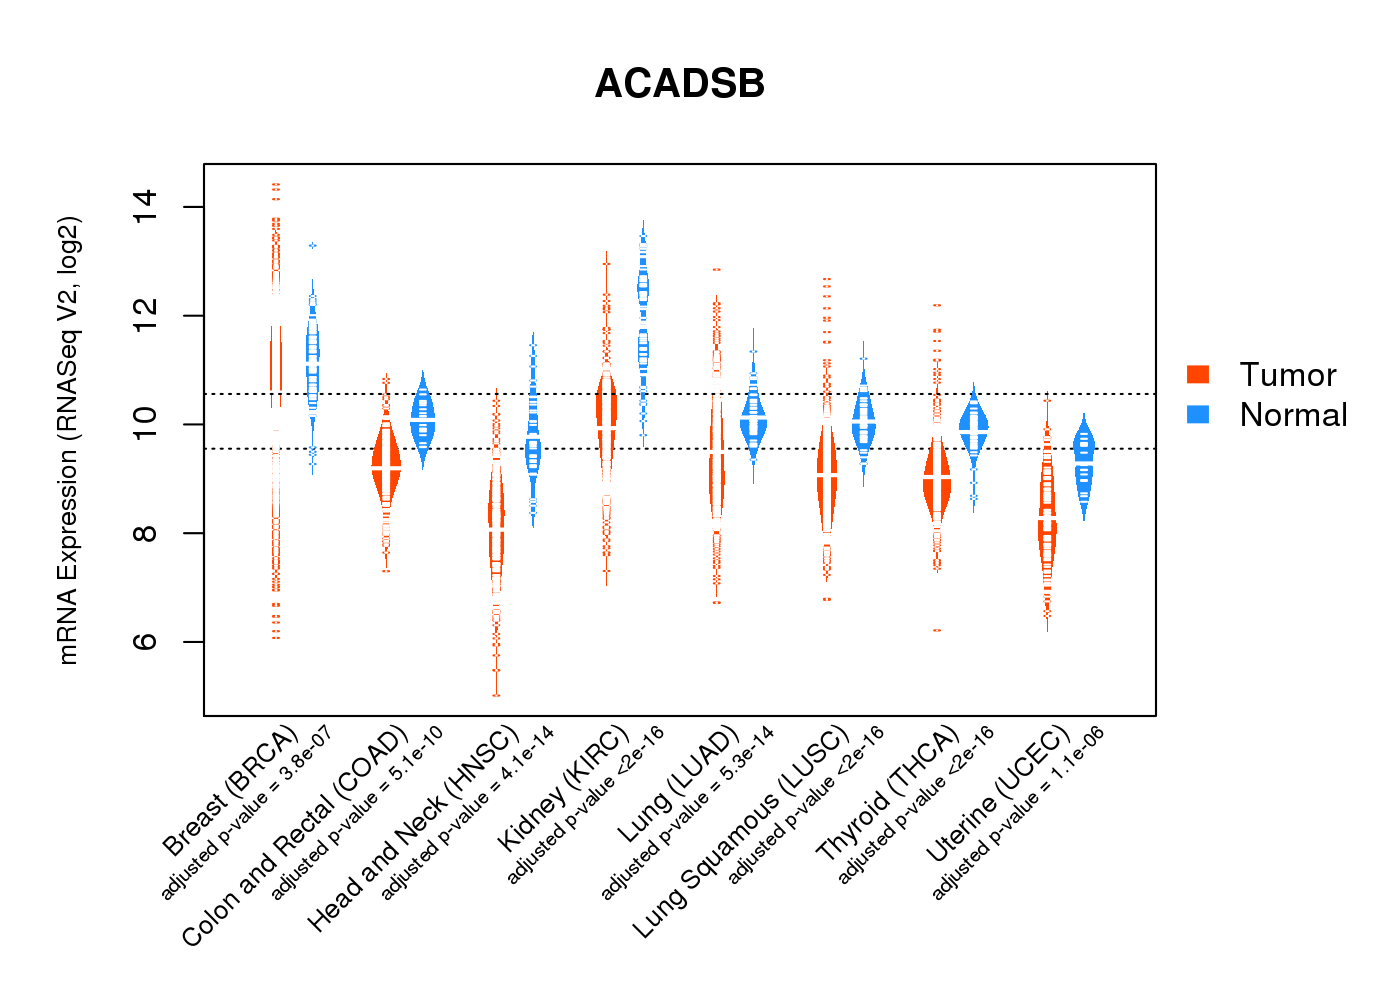 |
| Top |
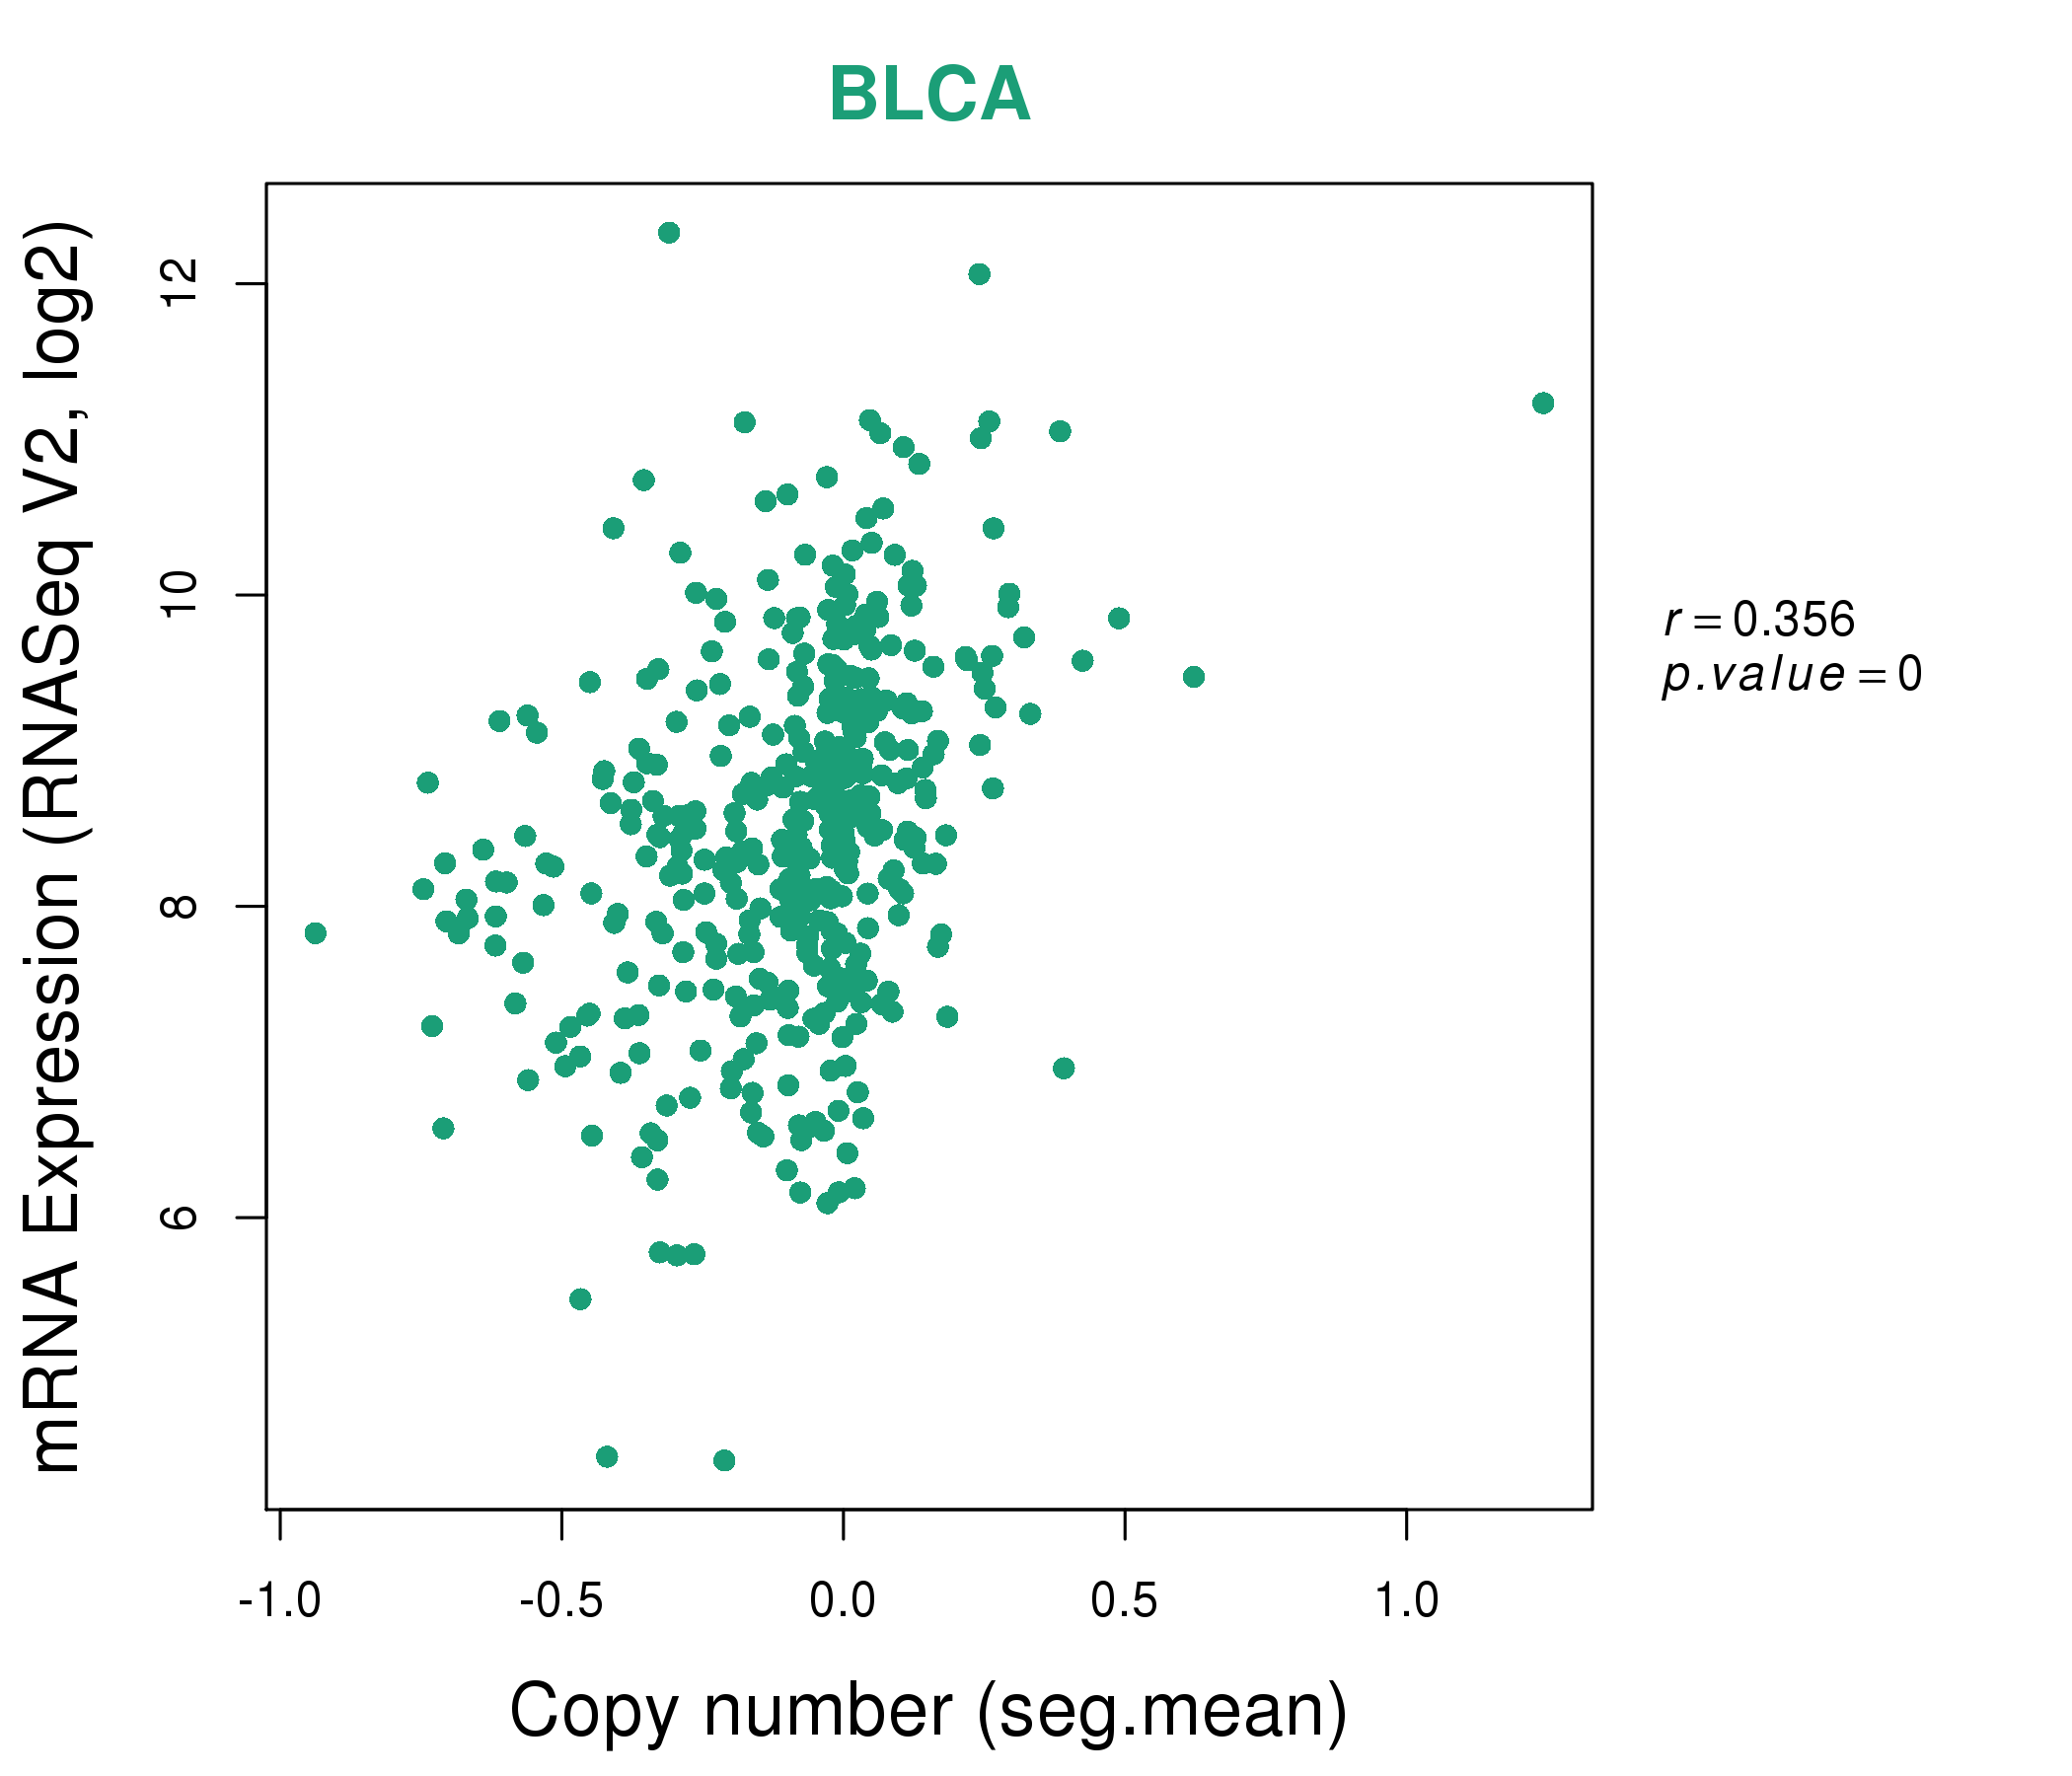
| * This plots show the correlation between CNV and gene expression. |
: Open all plots for all cancer types
 |
|
 |
|

| Top |
| Gene-Gene Network Information |
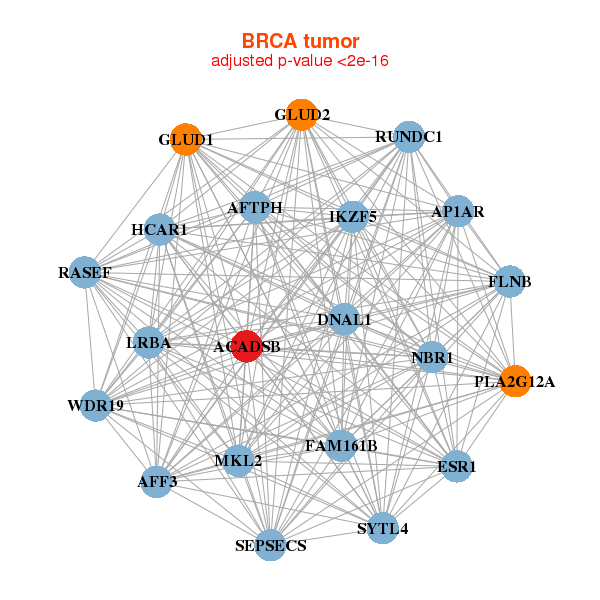
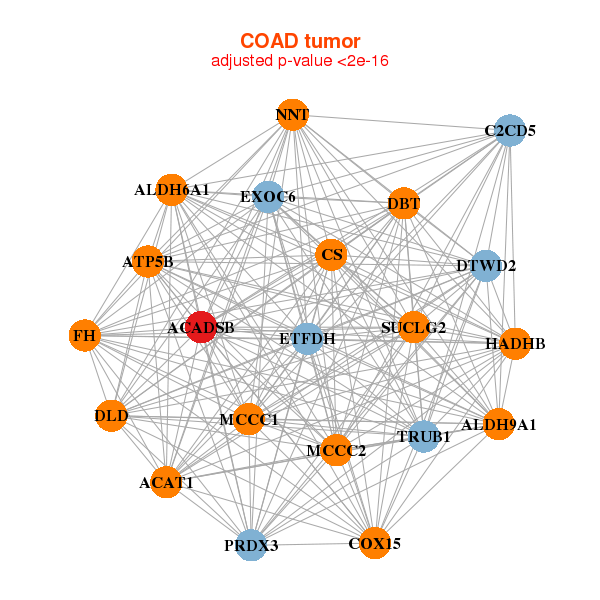
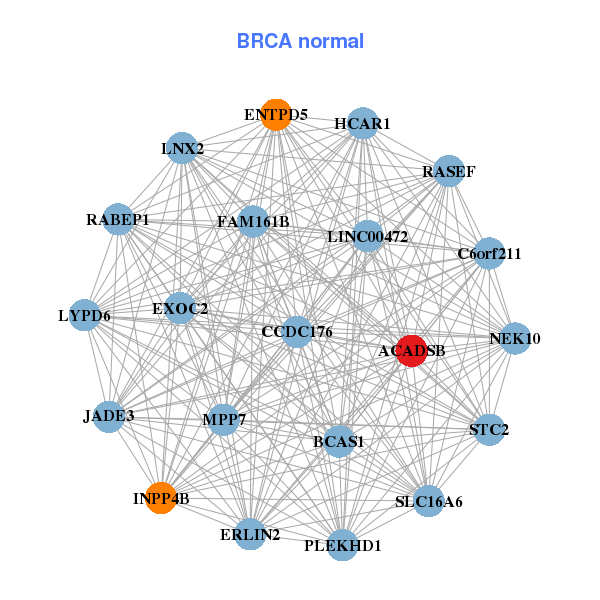
| * Co-Expression network figures were drawn using R package igraph. Only the top 20 genes with the highest correlations were shown. Red circle: input gene, orange circle: cell metabolism gene, sky circle: other gene |
: Open all plots for all cancer types
 |
| ||||
| ACADSB,AFF3,AFTPH,AP1AR,DNAL1,ESR1,FAM161B, FLNB,GLUD1,GLUD2,HCAR1,IKZF5,LRBA,MKL2, NBR1,PLA2G12A,RASEF,RUNDC1,SEPSECS,SYTL4,WDR19 | ACADSB,BCAS1,CCDC176,LINC00472,C6orf211,ENTPD5,ERLIN2, EXOC2,FAM161B,HCAR1,INPP4B,LNX2,LYPD6,MPP7, NEK10,JADE3,RABEP1,RASEF,SLC16A6,STC2,PLEKHD1 | ||||
 |
| ||||
| ACADSB,ACAT1,ALDH6A1,ALDH9A1,ATP5B,COX15,CS, DBT,DLD,DTWD2,ETFDH,EXOC6,FH,HADHB, C2CD5,MCCC1,MCCC2,NNT,PRDX3,SUCLG2,TRUB1 | ACADSB,CCNB1IP1,CRLS1,CRYM,DPY19L4,GGH,GSTO2, GPALPP1,MTFMT,NGLY1,PCTP,PPP1R1B,PVRL3,TDGF1, TMEM168,TTPA,ZNF138,ZNF195,ZNF28,ZNF480,ZNF69 |
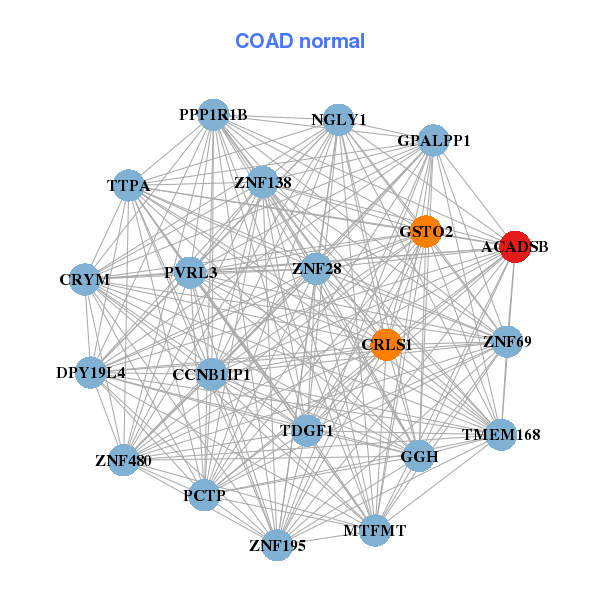
| * Co-Expression network figures were drawn using R package igraph. Only the top 20 genes with the highest correlations were shown. Red circle: input gene, orange circle: cell metabolism gene, sky circle: other gene |
: Open all plots for all cancer types
| Top |
: Open all interacting genes' information including KEGG pathway for all interacting genes from DAVID
| Top |
| Pharmacological Information for ACADSB |
| DB Category | DB Name | DB's ID and Url link |
| * Gene Centered Interaction Network. |
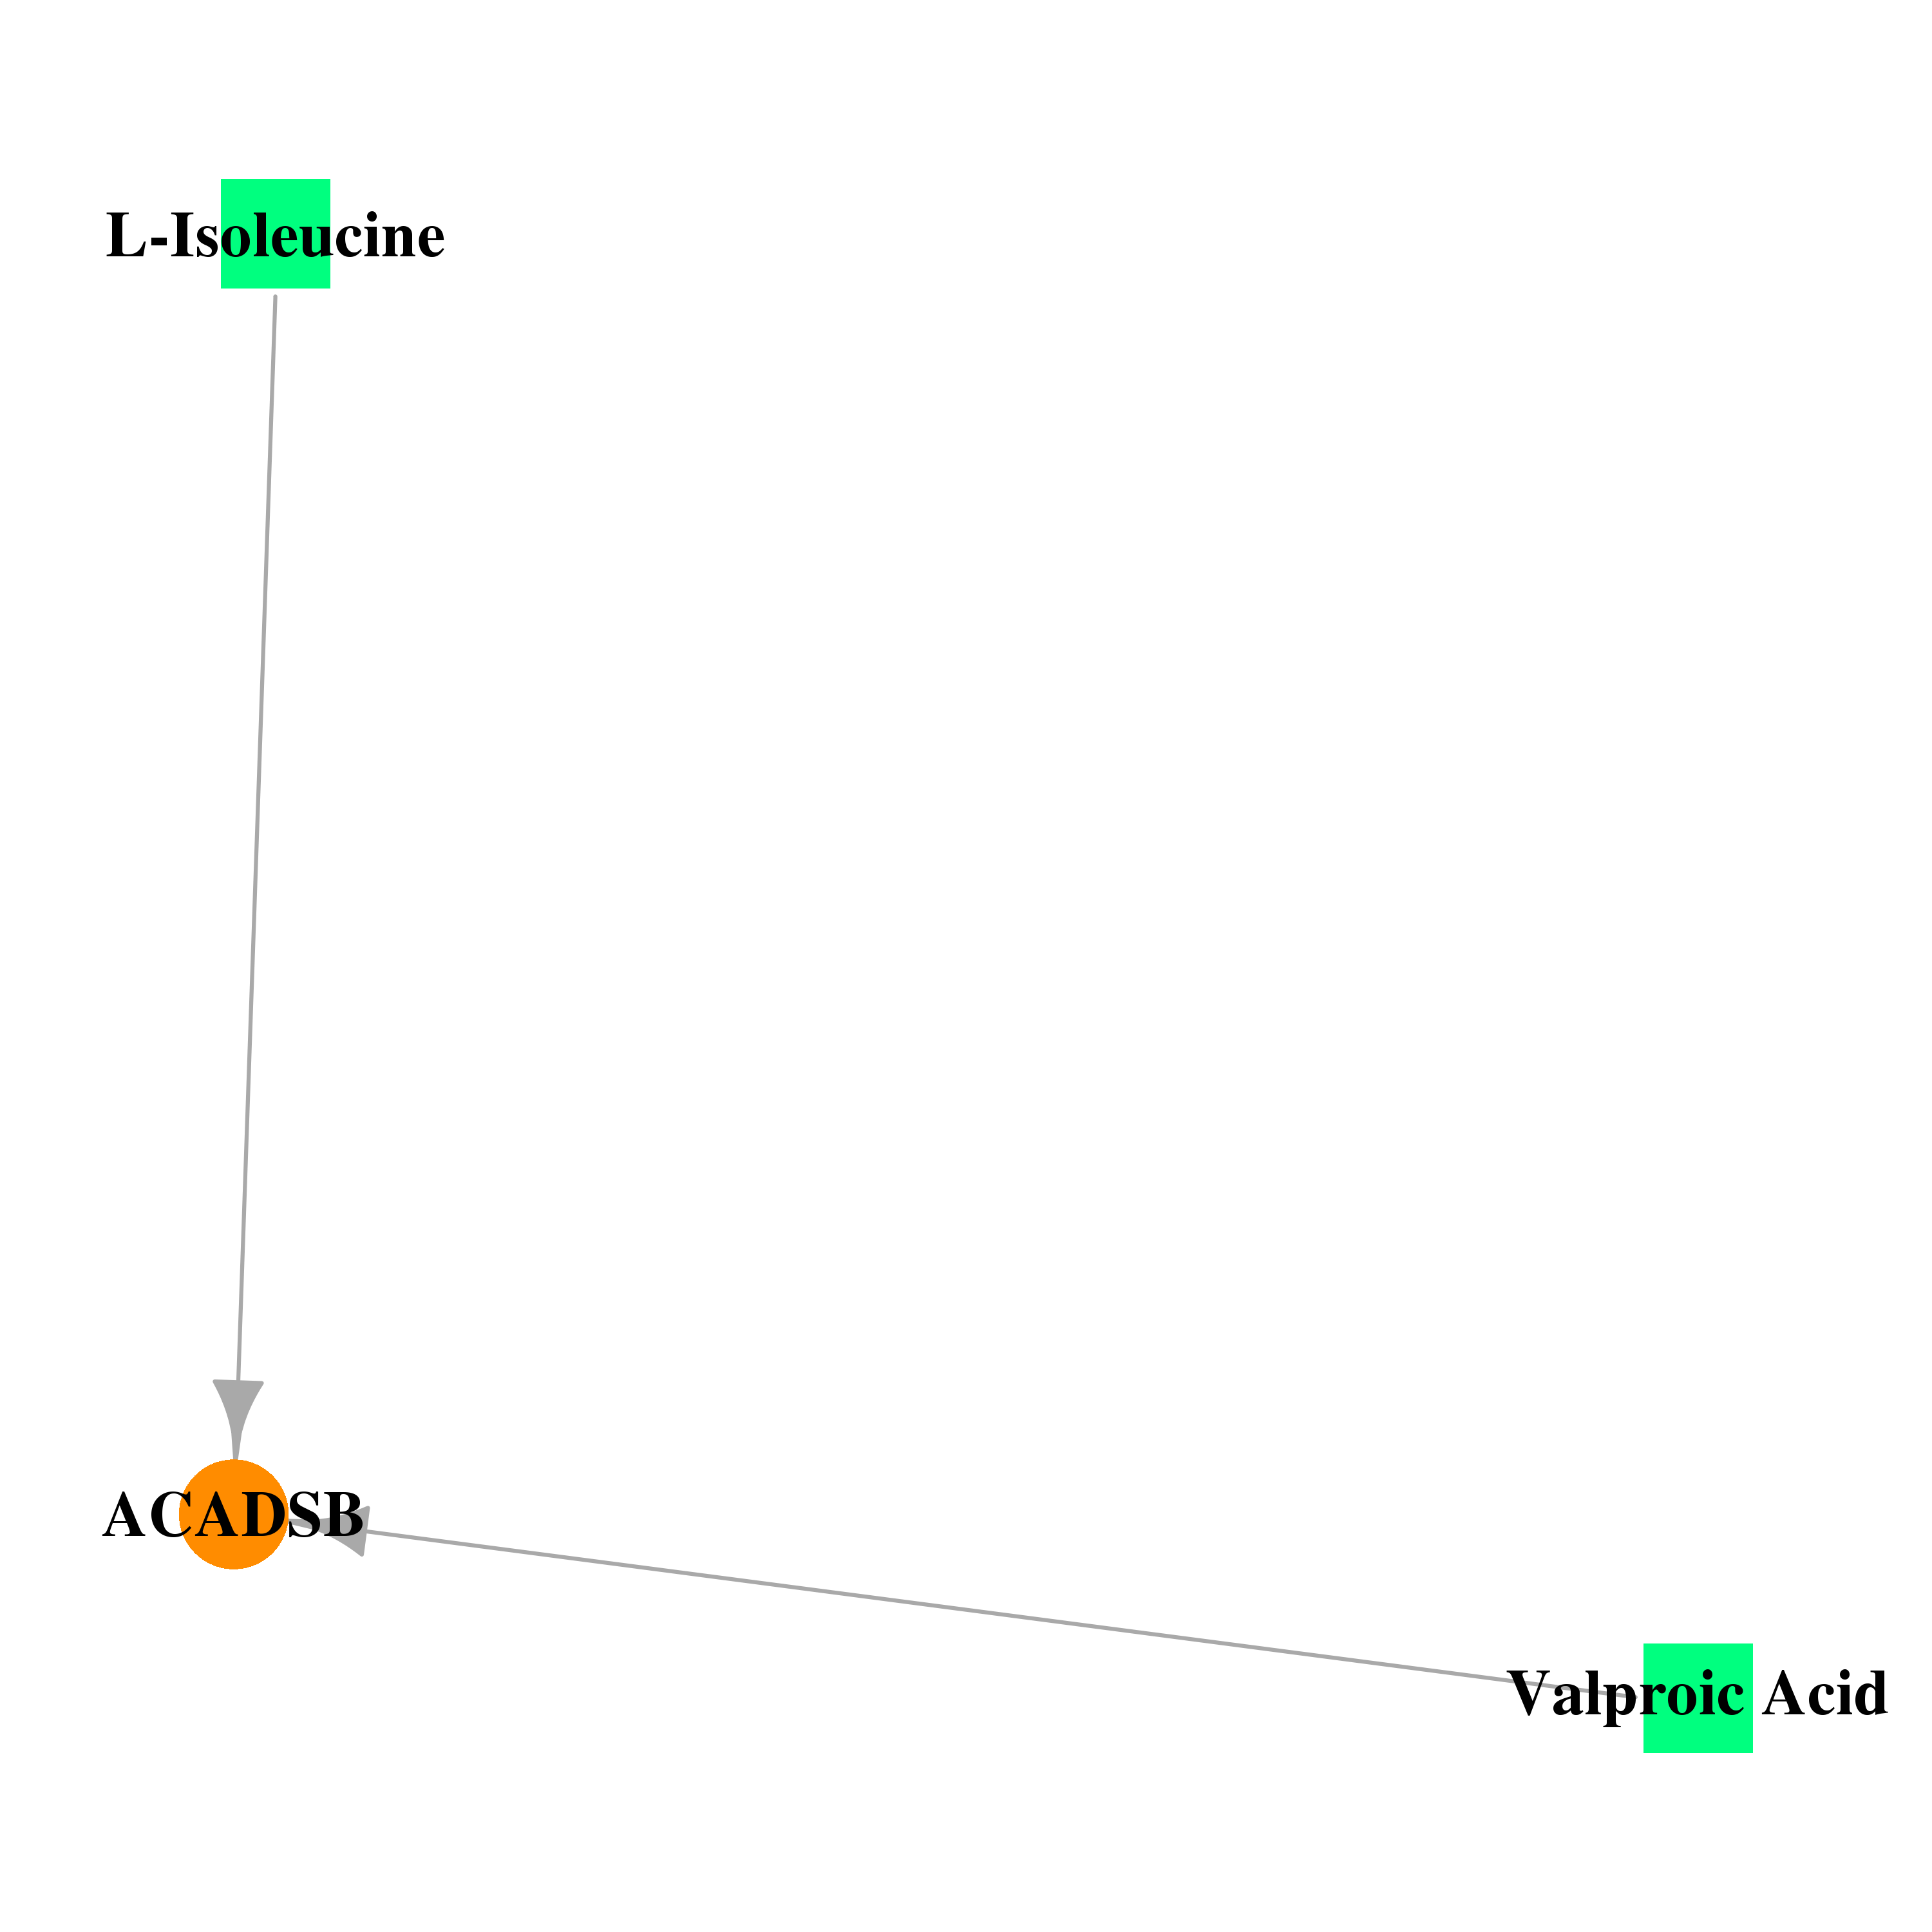 |
| * Drug Centered Interaction Network. |
| DrugBank ID | Target Name | Drug Groups | Generic Name | Drug Centered Network | Drug Structure |
| DB00167 | acyl-CoA dehydrogenase, short/branched chain | approved; nutraceutical | L-Isoleucine | 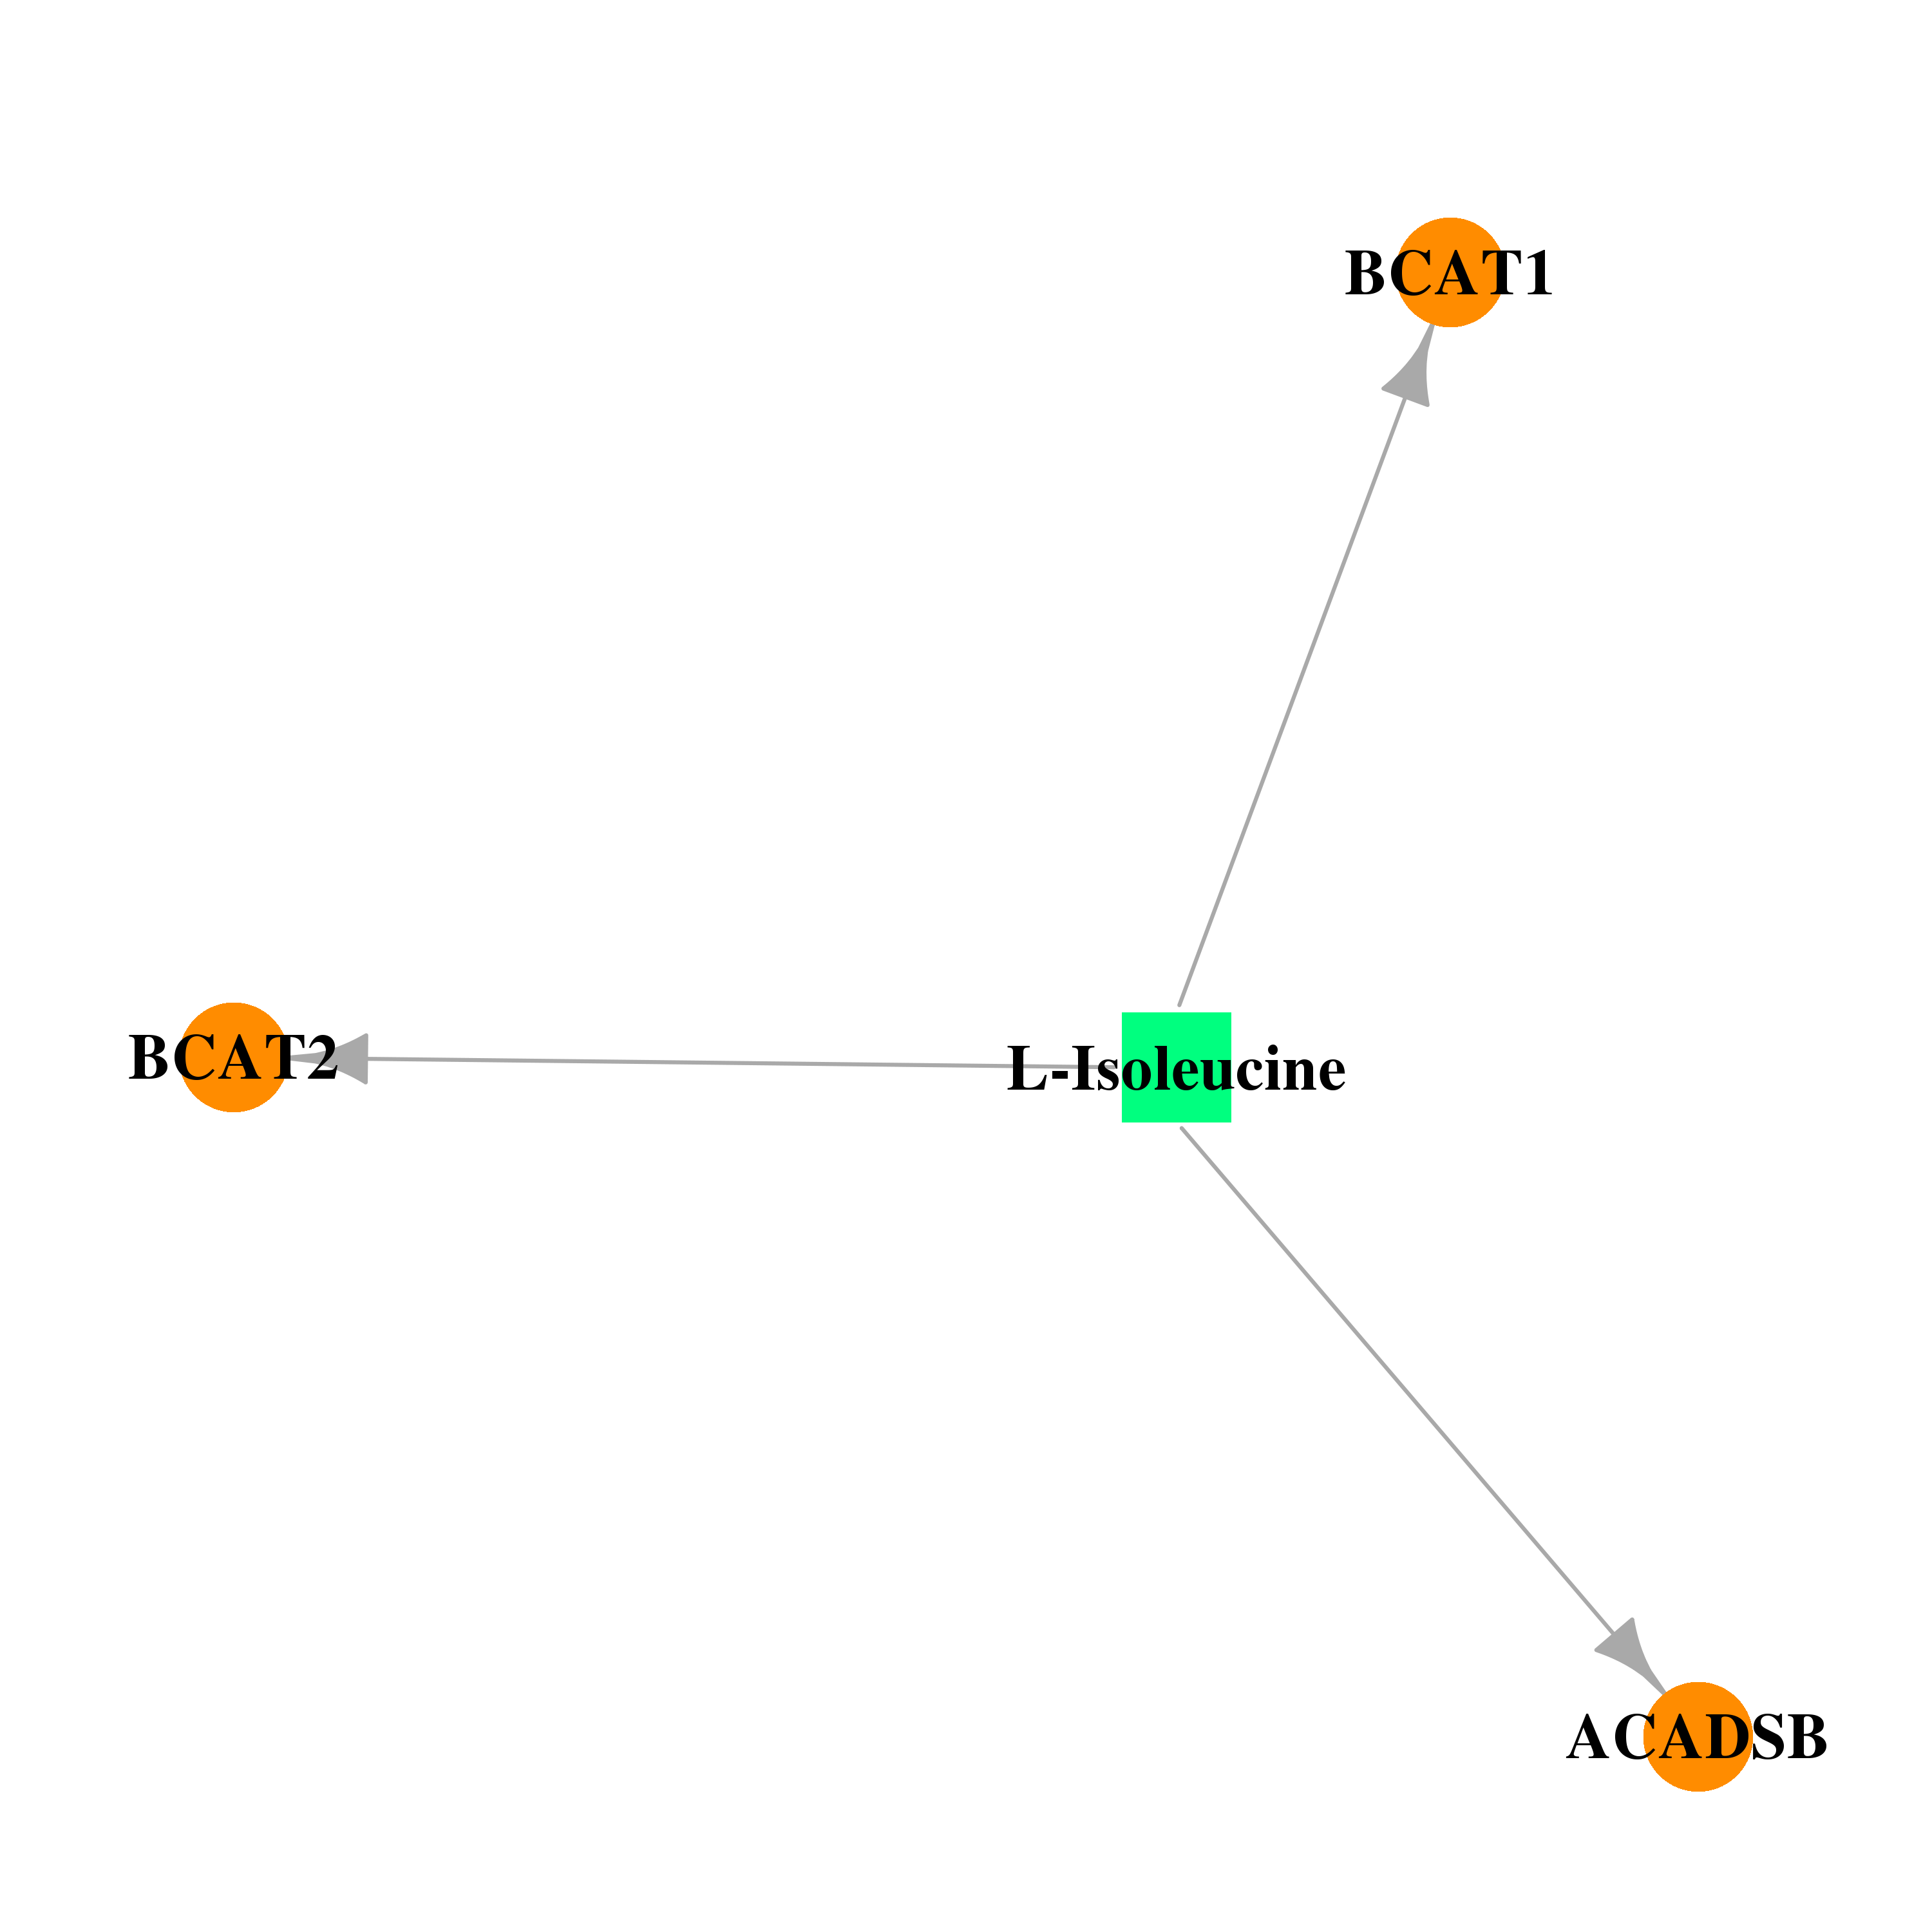 |  |
| DB00313 | acyl-CoA dehydrogenase, short/branched chain | approved; investigational | Valproic Acid | 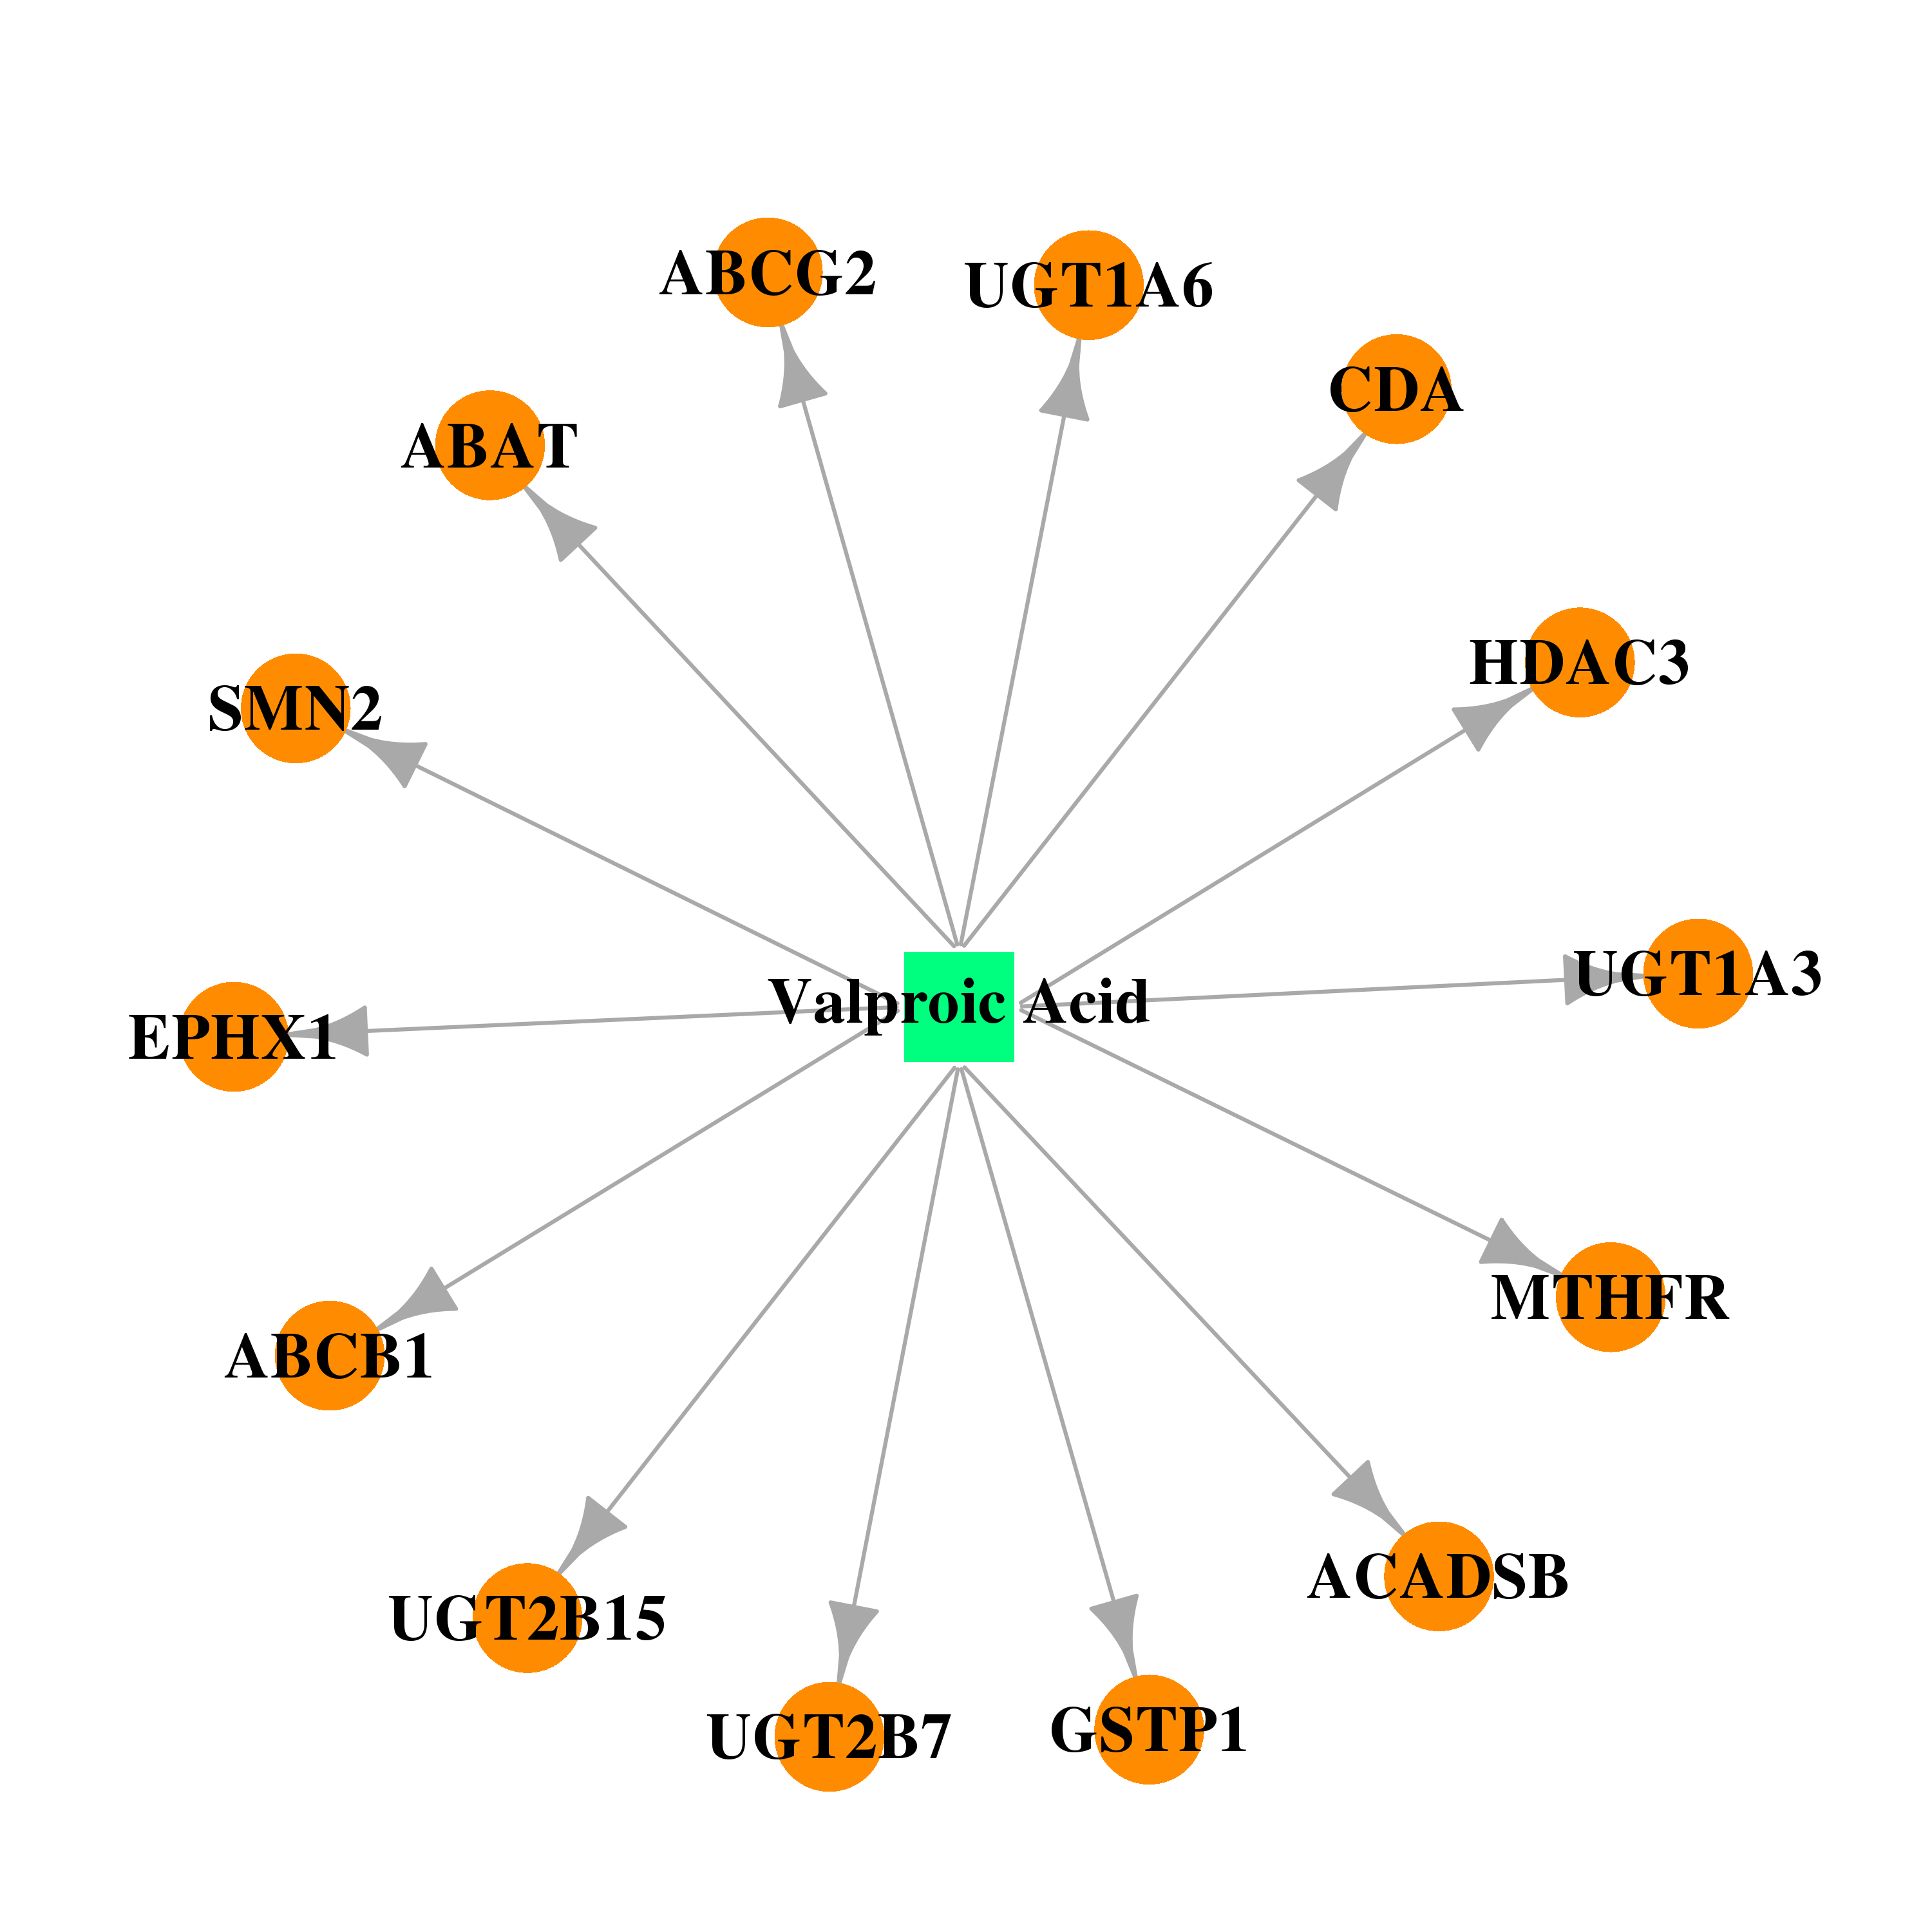 |  |
| Top |
| Cross referenced IDs for ACADSB |
| * We obtained these cross-references from Uniprot database. It covers 150 different DBs, 18 categories. http://www.uniprot.org/help/cross_references_section |
: Open all cross reference information
|
Copyright © 2016-Present - The Univsersity of Texas Health Science Center at Houston @ |