|
|||||||||||||||||||||||||||||||||||||||||||||||||||||||||||||||||||||||||||||||||||||||||||||||||||||||||||||||||||||||||||||||||||||||||||||||||||||||||||||||||||||||||||||||||||||||||||||||||||||||||||||||||||||||||||||||||||||||||||||||||||||||||||||||||||||||||||||||||||||||||||||||||||||||||||||||||||||||||||||||||||||||||||||
| |
| Phenotypic Information (metabolism pathway, cancer, disease, phenome) |
| |
| |
| Gene-Gene Network Information: Co-Expression Network, Interacting Genes & KEGG |
| |
|


| Gene Summary for IMPA2 |
| Basic gene info. | Gene symbol | IMPA2 |
| Gene name | inositol(myo)-1(or 4)-monophosphatase 2 | |
| Synonyms | - | |
| Cytomap | UCSC genome browser: 18p11.2 | |
| Genomic location | chr18 :11981426-12030885 | |
| Type of gene | protein-coding | |
| RefGenes | NM_014214.2, | |
| Ensembl id | ENSG00000141401 | |
| Description | IMP 2IMPase 2inosine monophosphatase 2inositol monophosphatase 2inositol monophosphatase 2 variant 1inositol monophosphatase 2 variant 2myo-inositol monophosphatase A2 | |
| Modification date | 20141207 | |
| dbXrefs | MIM : 605922 | |
| HGNC : HGNC | ||
| Ensembl : ENSG00000141401 | ||
| HPRD : 09329 | ||
| Vega : OTTHUMG00000131693 | ||
| Protein | UniProt: go to UniProt's Cross Reference DB Table | |
| Expression | CleanEX: HS_IMPA2 | |
| BioGPS: 3613 | ||
| Gene Expression Atlas: ENSG00000141401 | ||
| The Human Protein Atlas: ENSG00000141401 | ||
| Pathway | NCI Pathway Interaction Database: IMPA2 | |
| KEGG: IMPA2 | ||
| REACTOME: IMPA2 | ||
| ConsensusPathDB | ||
| Pathway Commons: IMPA2 | ||
| Metabolism | MetaCyc: IMPA2 | |
| HUMANCyc: IMPA2 | ||
| Regulation | Ensembl's Regulation: ENSG00000141401 | |
| miRBase: chr18 :11,981,426-12,030,885 | ||
| TargetScan: NM_014214 | ||
| cisRED: ENSG00000141401 | ||
| Context | iHOP: IMPA2 | |
| cancer metabolism search in PubMed: IMPA2 | ||
| UCL Cancer Institute: IMPA2 | ||
| Assigned class in ccmGDB | C | |
| Top |
| Phenotypic Information for IMPA2(metabolism pathway, cancer, disease, phenome) |
| Cancer | CGAP: IMPA2 |
| Familial Cancer Database: IMPA2 | |
| * This gene is included in those cancer gene databases. |
|
|
|
|
|
|
| |||||||||||||||||||||||||||||||||||||||||||||||||||||||||||||||||||||||||||||||||||||||||||||||||||||||||||||||||||||||||||||||||||||||||||||||||||||||||||||||||||||||||||||||||||||||||||||||||||||||||||||||||||||||||||||||||||||||||||||||||||||||||||||||||||||||||||||||||||||||||||||||||||||||||||||||||||||||||||||||||||||||
Oncogene 1 | Significant driver gene in | ||||||||||||||||||||||||||||||||||||||||||||||||||||||||||||||||||||||||||||||||||||||||||||||||||||||||||||||||||||||||||||||||||||||||||||||||||||||||||||||||||||||||||||||||||||||||||||||||||||||||||||||||||||||||||||||||||||||||||||||||||||||||||||||||||||||||||||||||||||||||||||||||||||||||||||||||||||||||||||||||||||||||||||
| cf) number; DB name 1 Oncogene; http://nar.oxfordjournals.org/content/35/suppl_1/D721.long, 2 Tumor Suppressor gene; https://bioinfo.uth.edu/TSGene/, 3 Cancer Gene Census; http://www.nature.com/nrc/journal/v4/n3/abs/nrc1299.html, 4 CancerGenes; http://nar.oxfordjournals.org/content/35/suppl_1/D721.long, 5 Network of Cancer Gene; http://ncg.kcl.ac.uk/index.php, 1Therapeutic Vulnerabilities in Cancer; http://cbio.mskcc.org/cancergenomics/statius/ |
| KEGG_INOSITOL_PHOSPHATE_METABOLISM | |
| OMIM | |
| Orphanet | |
| Disease | KEGG Disease: IMPA2 |
| MedGen: IMPA2 (Human Medical Genetics with Condition) | |
| ClinVar: IMPA2 | |
| Phenotype | MGI: IMPA2 (International Mouse Phenotyping Consortium) |
| PhenomicDB: IMPA2 | |
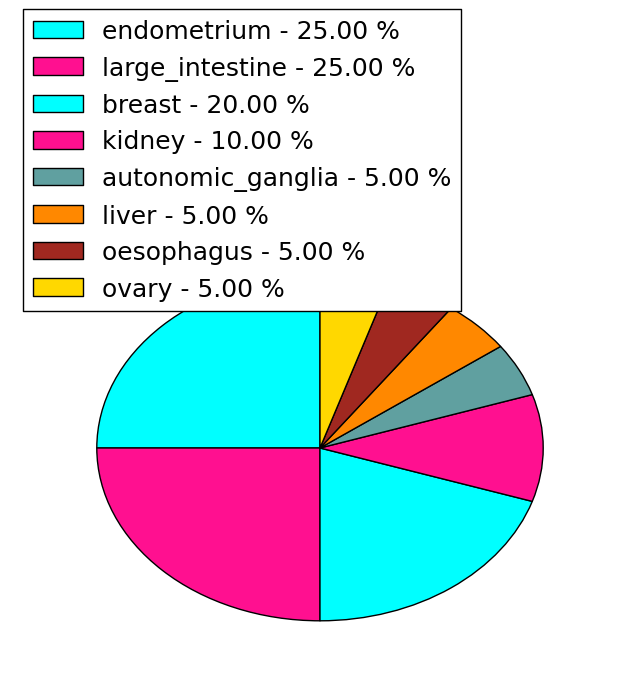
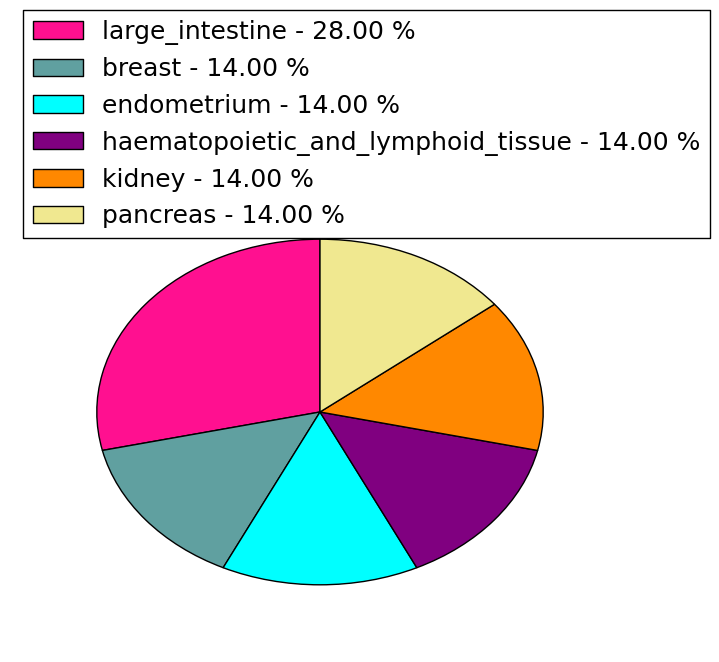
| Mutations for IMPA2 |
| * Under tables are showing count per each tissue to give us broad intuition about tissue specific mutation patterns.You can go to the detailed page for each mutation database's web site. |
| - Statistics for Tissue and Mutation type | Top |
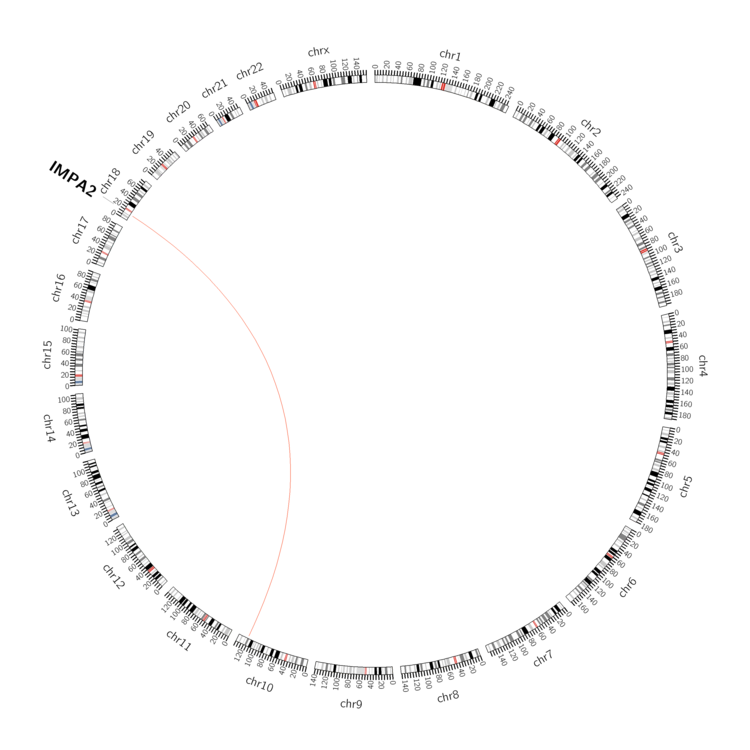 |
| - For Inter-chromosomal Variations |
| There's no inter-chromosomal structural variation. |
| - For Intra-chromosomal Variations |
| There's no intra-chromosomal structural variation. |
| Sample | Symbol_a | Chr_a | Start_a | End_a | Symbol_b | Chr_b | Start_b | End_b |
| ovary | IMPA2 | chr18 | 12024803 | 12024823 | chr10 | 118180922 | 118180942 |
| cf) Tissue number; Tissue name (1;Breast, 2;Central_nervous_system, 3;Haematopoietic_and_lymphoid_tissue, 4;Large_intestine, 5;Liver, 6;Lung, 7;Ovary, 8;Pancreas, 9;Prostate, 10;Skin, 11;Soft_tissue, 12;Upper_aerodigestive_tract) |
| * From mRNA Sanger sequences, Chitars2.0 arranged chimeric transcripts. This table shows IMPA2 related fusion information. |
| ID | Head Gene | Tail Gene | Accession | Gene_a | qStart_a | qEnd_a | Chromosome_a | tStart_a | tEnd_a | Gene_a | qStart_a | qEnd_a | Chromosome_a | tStart_a | tEnd_a |
| AA593969 | LILRB4 | 19 | 111 | 19 | 55179589 | 55179681 | IMPA2 | 107 | 411 | 18 | 12028110 | 12030454 | |
| BP429539 | NUCB2 | 5 | 182 | 11 | 17298314 | 17304451 | IMPA2 | 178 | 422 | 18 | 12028045 | 12028979 | |
| Top |
| Mutation type/ Tissue ID | brca | cns | cerv | endome | haematopo | kidn | Lintest | liver | lung | ns | ovary | pancre | prost | skin | stoma | thyro | urina | |||
| Total # sample | 1 | 1 | 1 | 3 | 1 | |||||||||||||||
| GAIN (# sample) | 1 | 3 | 1 | |||||||||||||||||
| LOSS (# sample) | 1 | 1 |
| cf) Tissue ID; Tissue type (1; Breast, 2; Central_nervous_system, 3; Cervix, 4; Endometrium, 5; Haematopoietic_and_lymphoid_tissue, 6; Kidney, 7; Large_intestine, 8; Liver, 9; Lung, 10; NS, 11; Ovary, 12; Pancreas, 13; Prostate, 14; Skin, 15; Stomach, 16; Thyroid, 17; Urinary_tract) |
| Top |
|
 |
| Top |
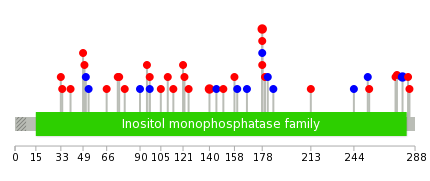
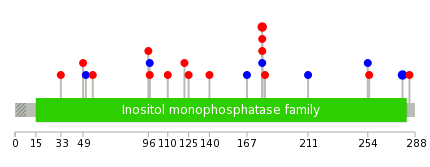
| Stat. for Non-Synonymous SNVs (# total SNVs=20) | (# total SNVs=7) |
 |  |
(# total SNVs=0) | (# total SNVs=1) |
 |
| Top |
| * When you move the cursor on each content, you can see more deailed mutation information on the Tooltip. Those are primary_site,primary_histology,mutation(aa),pubmedID. |
| GRCh37 position | Mutation(aa) | Unique sampleID count |
| chr18:12028083-12028083 | p.R178C | 2 |
| chr18:12028084-12028084 | p.R178H | 2 |
| chr18:12030427-12030427 | p.T279T | 2 |
| chr18:12014301-12014301 | p.R140Q | 2 |
| chr18:12014330-12014330 | p.A150T | 1 |
| chr18:11999075-11999075 | p.E40V | 1 |
| chr18:12028930-12028930 | p.W230* | 1 |
| chr18:12009941-12009941 | p.T97M | 1 |
| chr18:12014354-12014354 | p.R158W | 1 |
| chr18:11999101-11999101 | p.S49A | 1 |
| Top |
|
 |
| Point Mutation/ Tissue ID | 1 | 2 | 3 | 4 | 5 | 6 | 7 | 8 | 9 | 10 | 11 | 12 | 13 | 14 | 15 | 16 | 17 | 18 | 19 | 20 |
| # sample | 1 | 4 | 2 | 3 | 1 | 1 | 4 | 2 | 5 | |||||||||||
| # mutation | 1 | 4 | 2 | 3 | 1 | 1 | 4 | 2 | 6 | |||||||||||
| nonsynonymous SNV | 1 | 3 | 1 | 2 | 1 | 1 | 1 | 1 | 5 | |||||||||||
| synonymous SNV | 1 | 1 | 1 | 3 | 1 | 1 |
| cf) Tissue ID; Tissue type (1; BLCA[Bladder Urothelial Carcinoma], 2; BRCA[Breast invasive carcinoma], 3; CESC[Cervical squamous cell carcinoma and endocervical adenocarcinoma], 4; COAD[Colon adenocarcinoma], 5; GBM[Glioblastoma multiforme], 6; Glioma Low Grade, 7; HNSC[Head and Neck squamous cell carcinoma], 8; KICH[Kidney Chromophobe], 9; KIRC[Kidney renal clear cell carcinoma], 10; KIRP[Kidney renal papillary cell carcinoma], 11; LAML[Acute Myeloid Leukemia], 12; LUAD[Lung adenocarcinoma], 13; LUSC[Lung squamous cell carcinoma], 14; OV[Ovarian serous cystadenocarcinoma ], 15; PAAD[Pancreatic adenocarcinoma], 16; PRAD[Prostate adenocarcinoma], 17; SKCM[Skin Cutaneous Melanoma], 18:STAD[Stomach adenocarcinoma], 19:THCA[Thyroid carcinoma], 20:UCEC[Uterine Corpus Endometrial Carcinoma]) |
| Top |
| * We represented just top 10 SNVs. When you move the cursor on each content, you can see more deailed mutation information on the Tooltip. Those are primary_site, primary_histology, mutation(aa), pubmedID. |
| Genomic Position | Mutation(aa) | Unique sampleID count |
| chr18:12030427 | p.R178C | 2 |
| chr18:12028083 | p.R178H | 2 |
| chr18:12028084 | p.T279T | 2 |
| chr18:12009941 | p.T97T | 1 |
| chr18:12028874 | p.V110L | 1 |
| chr18:12009942 | p.F122S | 1 |
| chr18:12030352 | p.R125Q | 1 |
| chr18:12009979 | p.R140Q | 1 |
| chr18:12030353 | p.K167K | 1 |
| chr18:12012198 | p.R178R | 1 |
| * Copy number data were extracted from TCGA using R package TCGA-Assembler. The URLs of all public data files on TCGA DCC data server were gathered on Jan-05-2015. Function ProcessCNAData in TCGA-Assembler package was used to obtain gene-level copy number value which is calculated as the average copy number of the genomic region of a gene. |
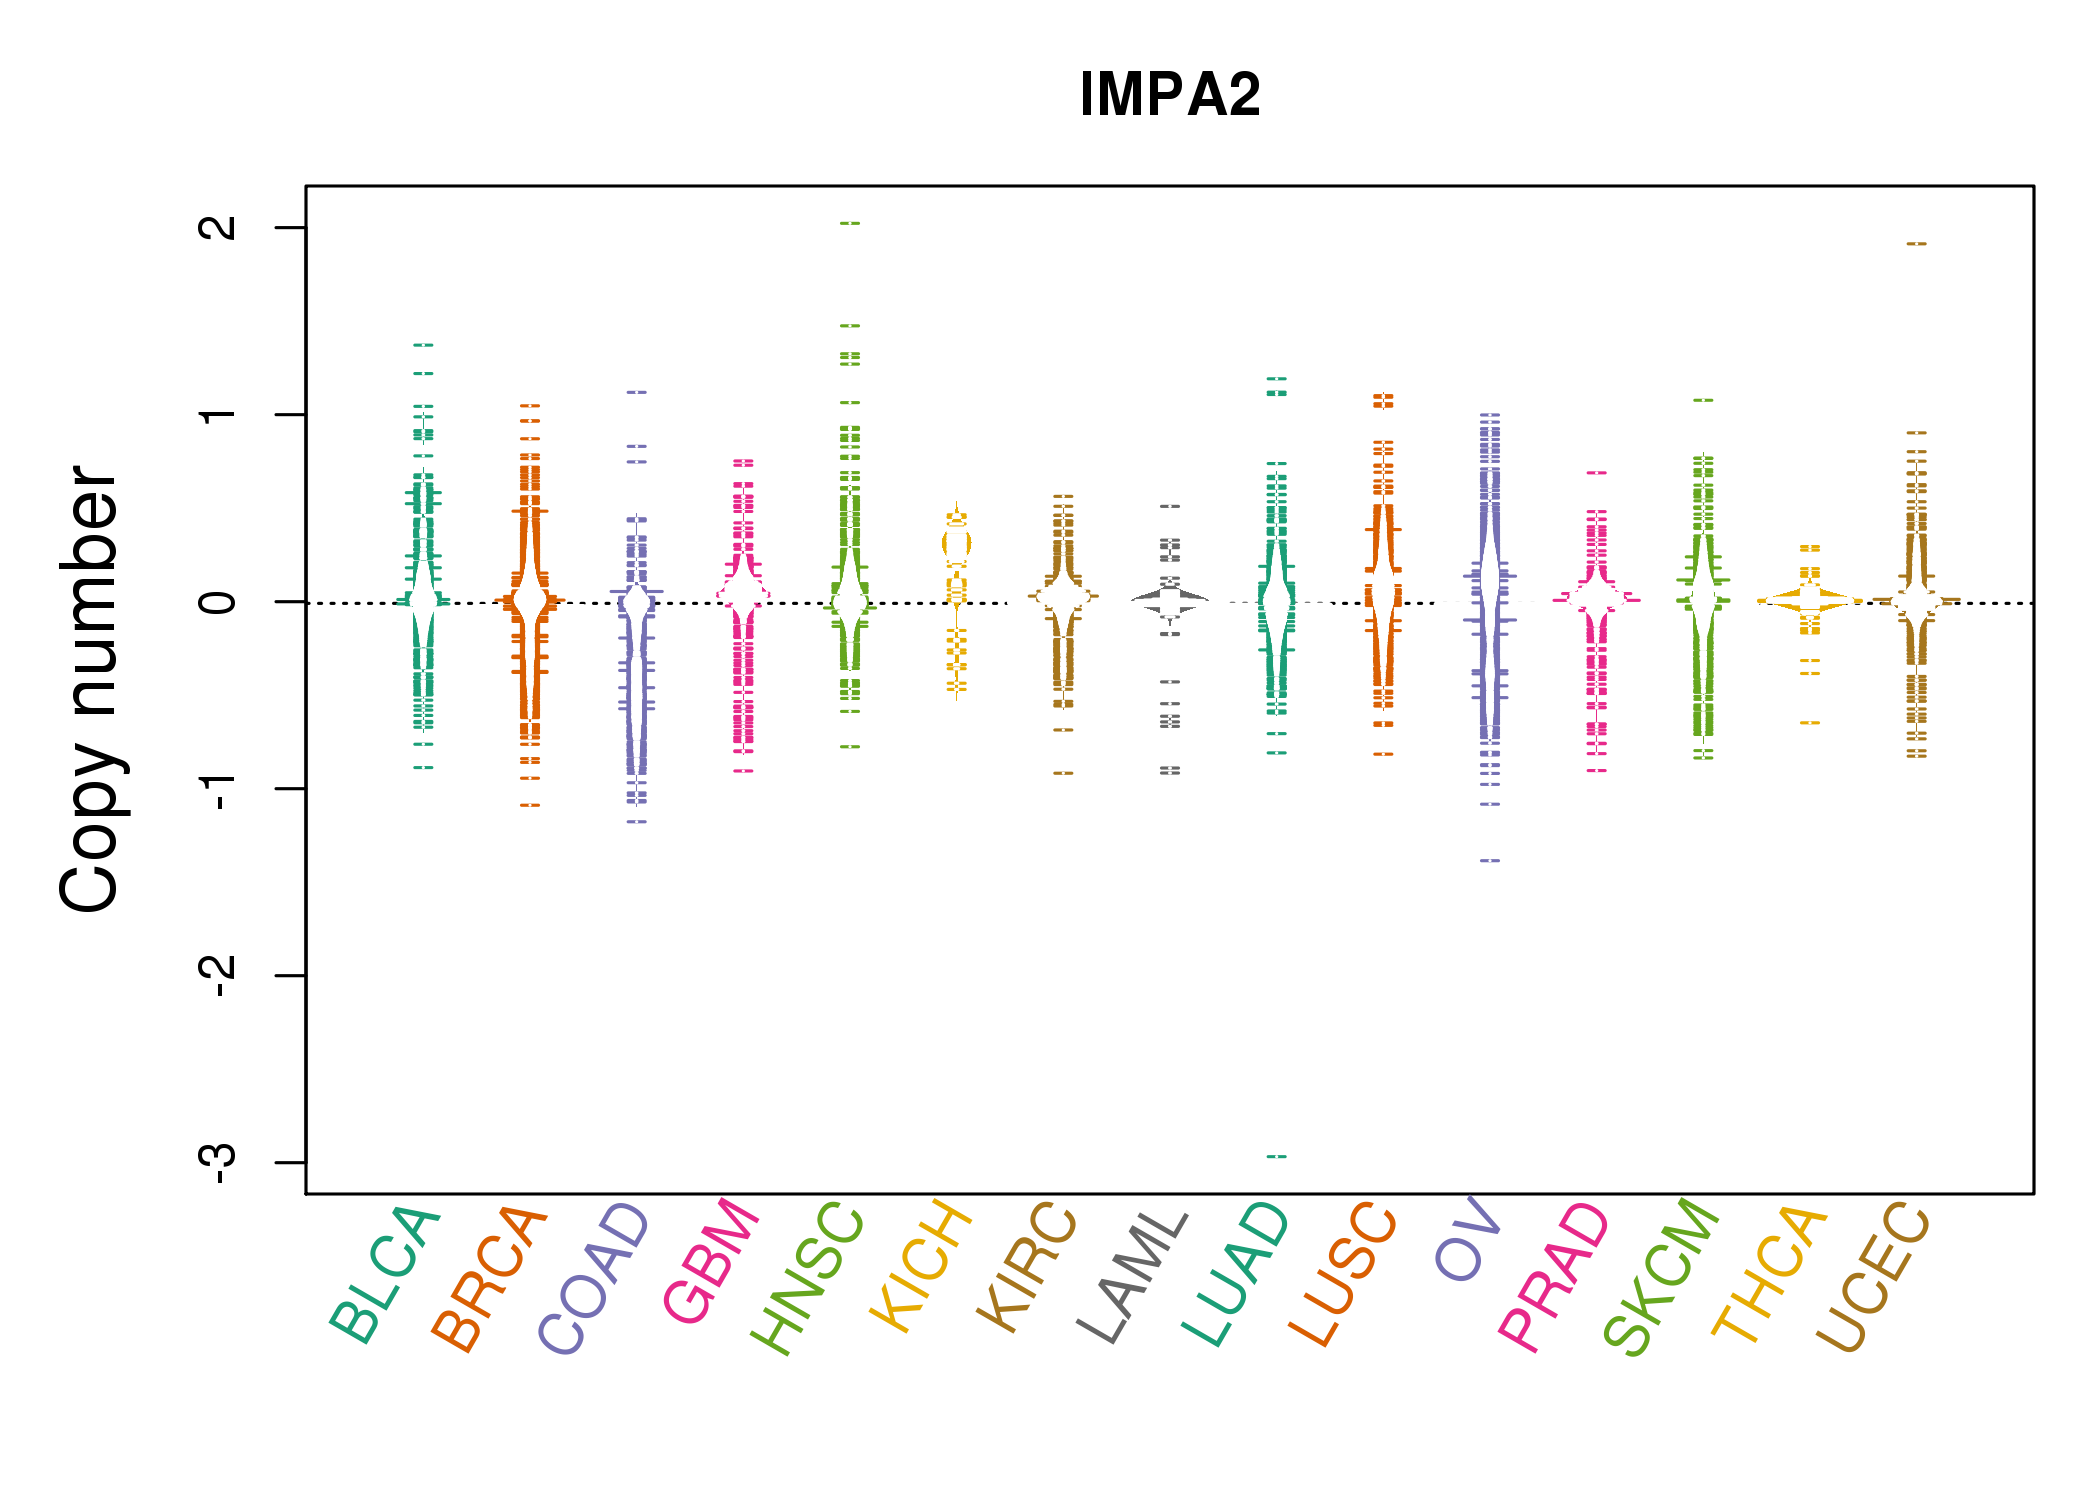 |
| cf) Tissue ID[Tissue type]: BLCA[Bladder Urothelial Carcinoma], BRCA[Breast invasive carcinoma], CESC[Cervical squamous cell carcinoma and endocervical adenocarcinoma], COAD[Colon adenocarcinoma], GBM[Glioblastoma multiforme], Glioma Low Grade, HNSC[Head and Neck squamous cell carcinoma], KICH[Kidney Chromophobe], KIRC[Kidney renal clear cell carcinoma], KIRP[Kidney renal papillary cell carcinoma], LAML[Acute Myeloid Leukemia], LUAD[Lung adenocarcinoma], LUSC[Lung squamous cell carcinoma], OV[Ovarian serous cystadenocarcinoma ], PAAD[Pancreatic adenocarcinoma], PRAD[Prostate adenocarcinoma], SKCM[Skin Cutaneous Melanoma], STAD[Stomach adenocarcinoma], THCA[Thyroid carcinoma], UCEC[Uterine Corpus Endometrial Carcinoma] |
| Top |
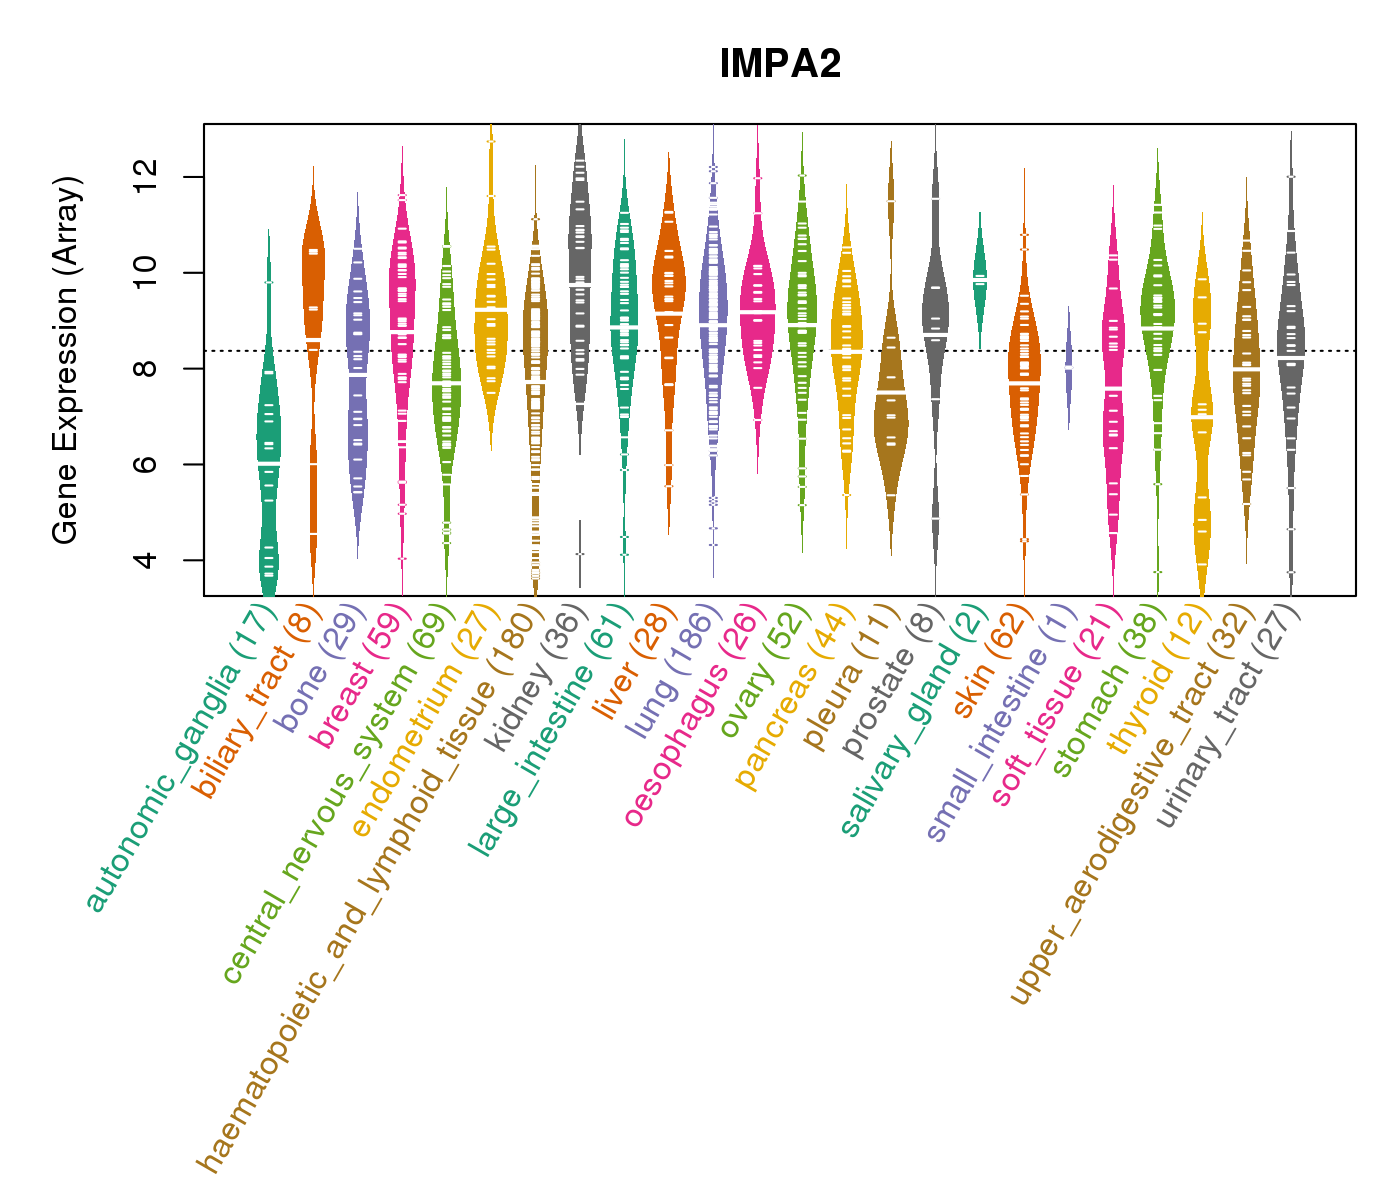
| Gene Expression for IMPA2 |
| * CCLE gene expression data were extracted from CCLE_Expression_Entrez_2012-10-18.res: Gene-centric RMA-normalized mRNA expression data. |
 |
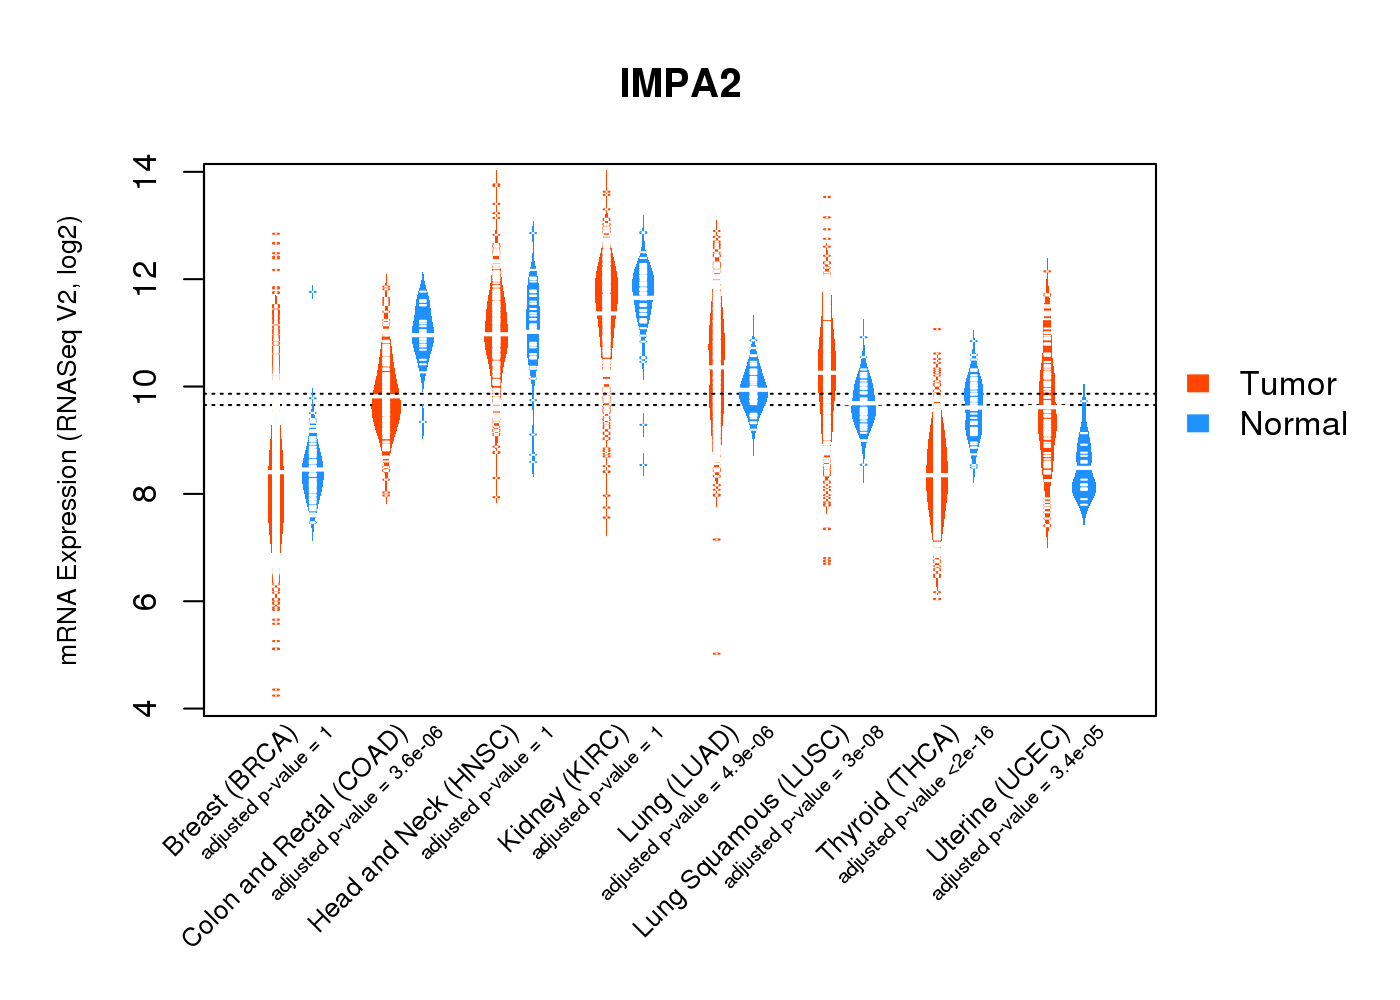
| * Normalized gene expression data of RNASeqV2 was extracted from TCGA using R package TCGA-Assembler. The URLs of all public data files on TCGA DCC data server were gathered at Jan-05-2015. Only eight cancer types have enough normal control samples for differential expression analysis. (t test, adjusted p<0.05 (using Benjamini-Hochberg FDR)) |
 |
| Top |
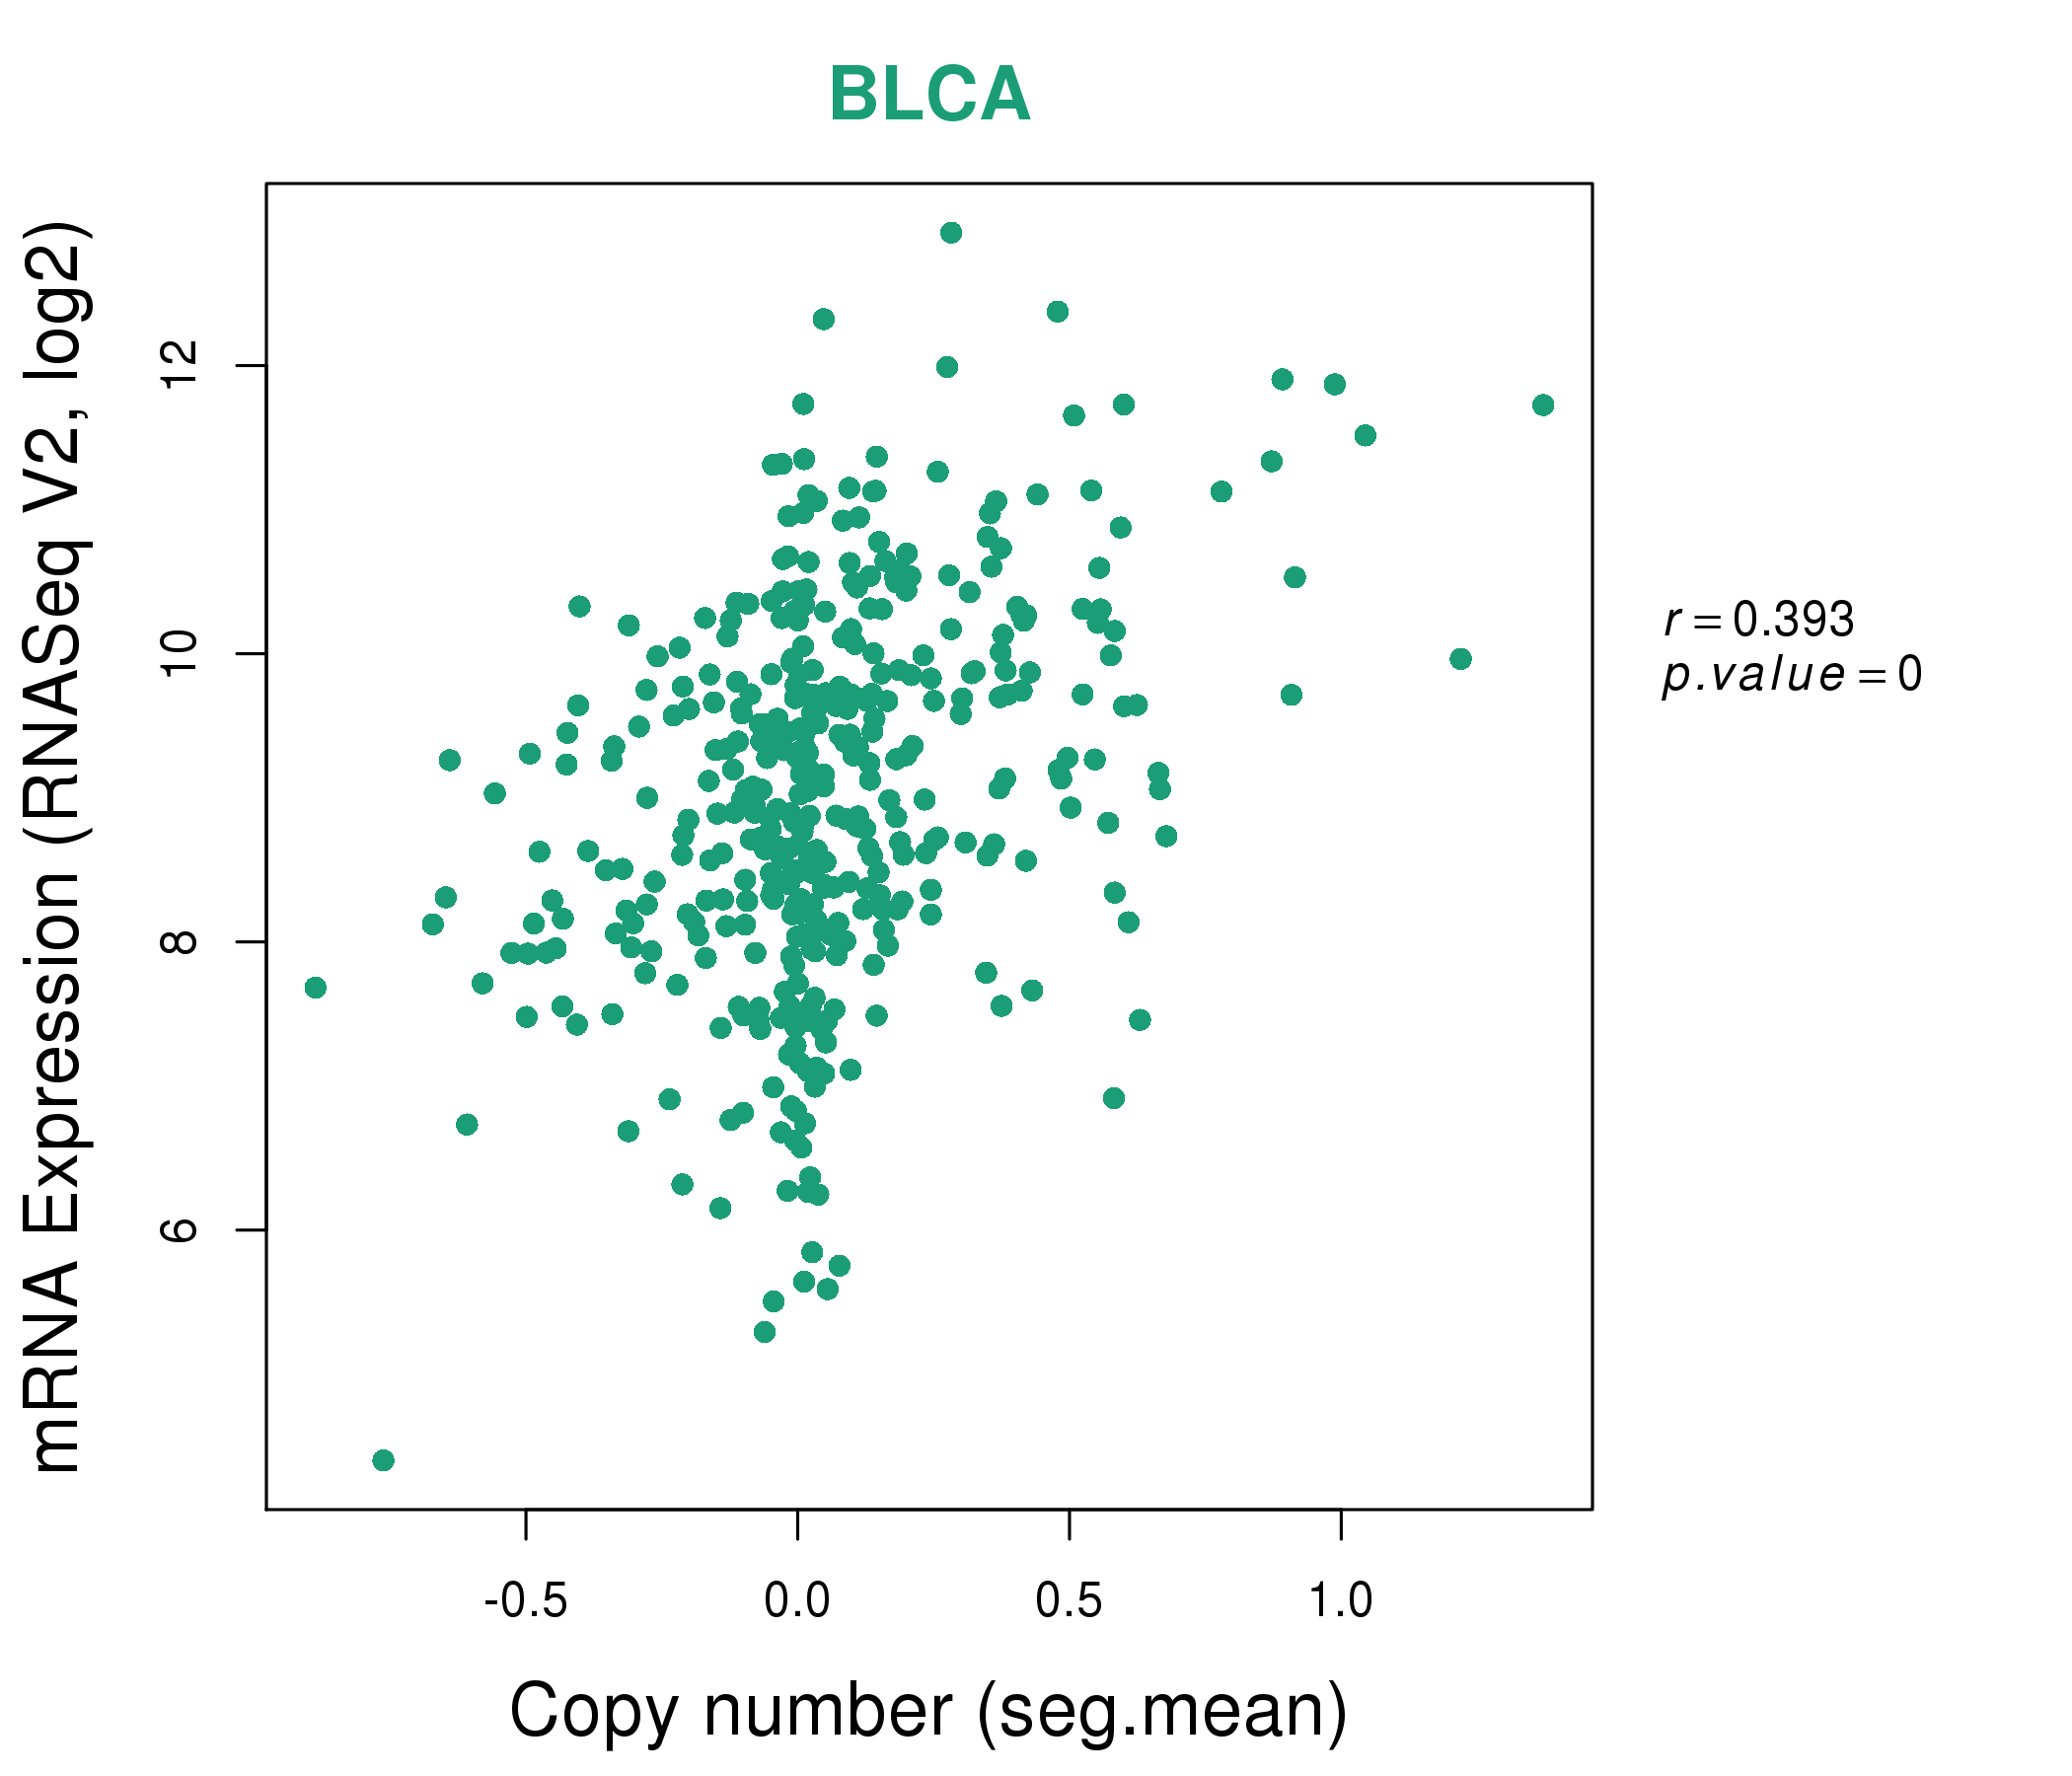
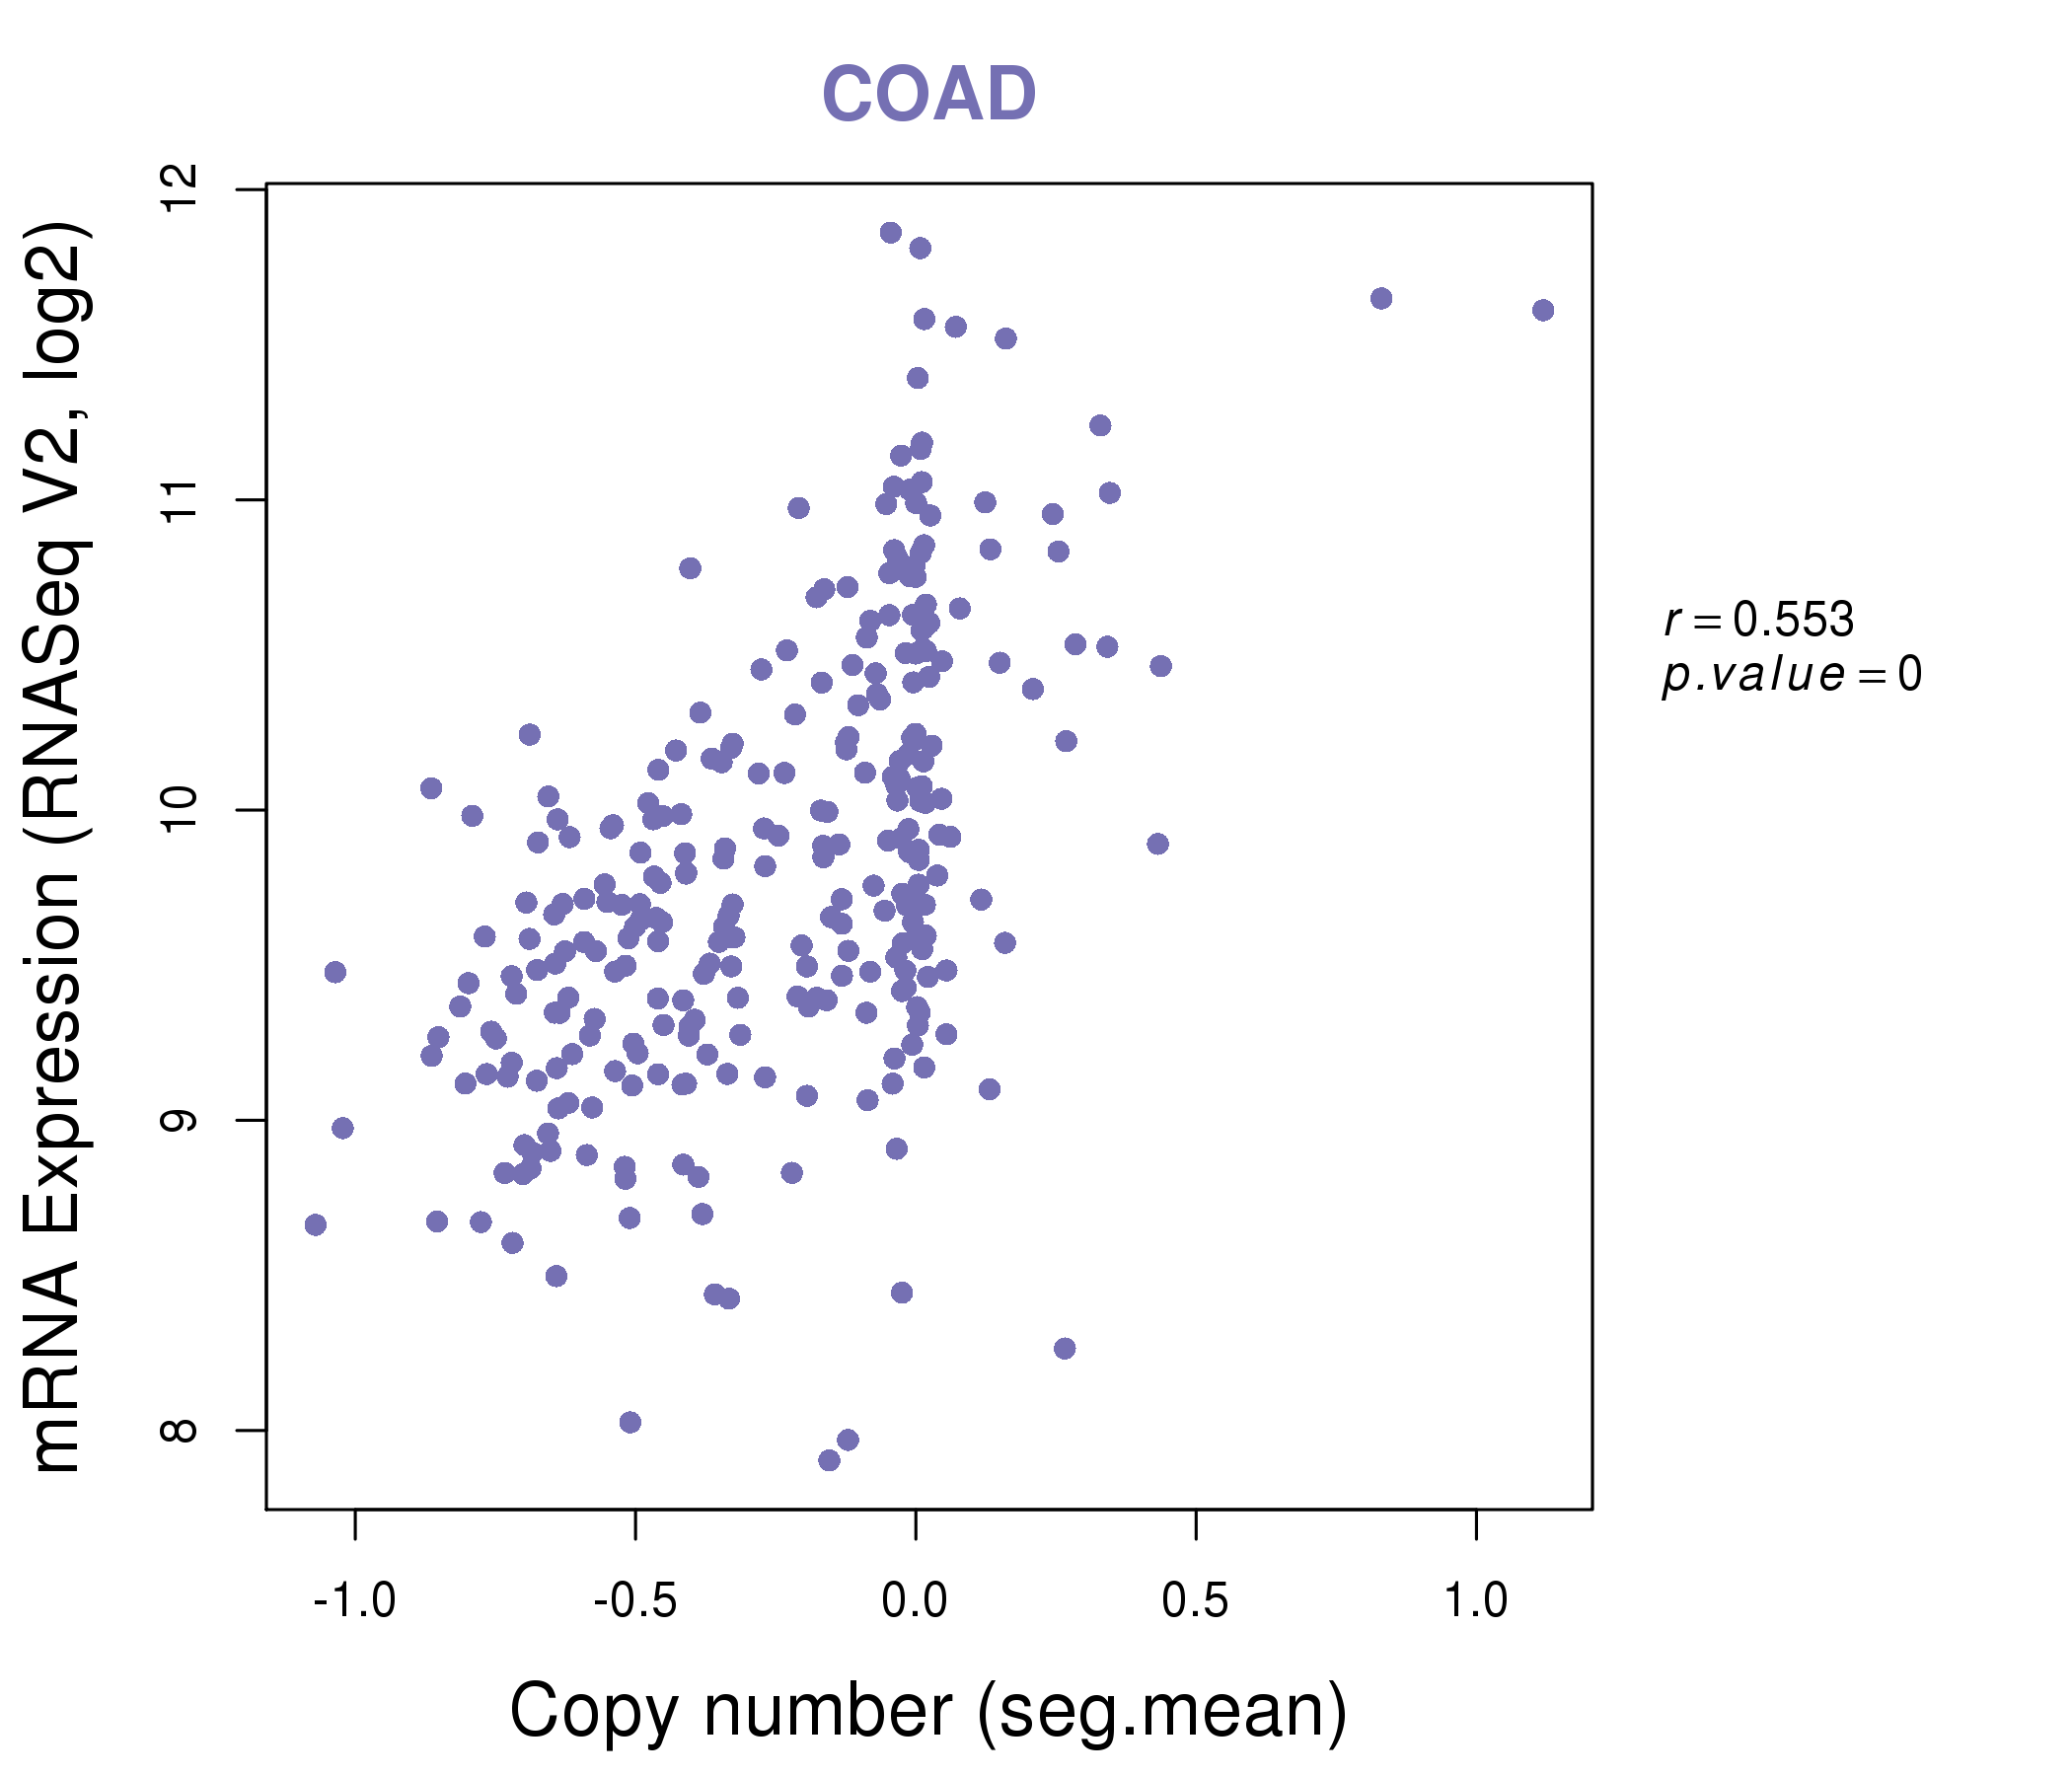
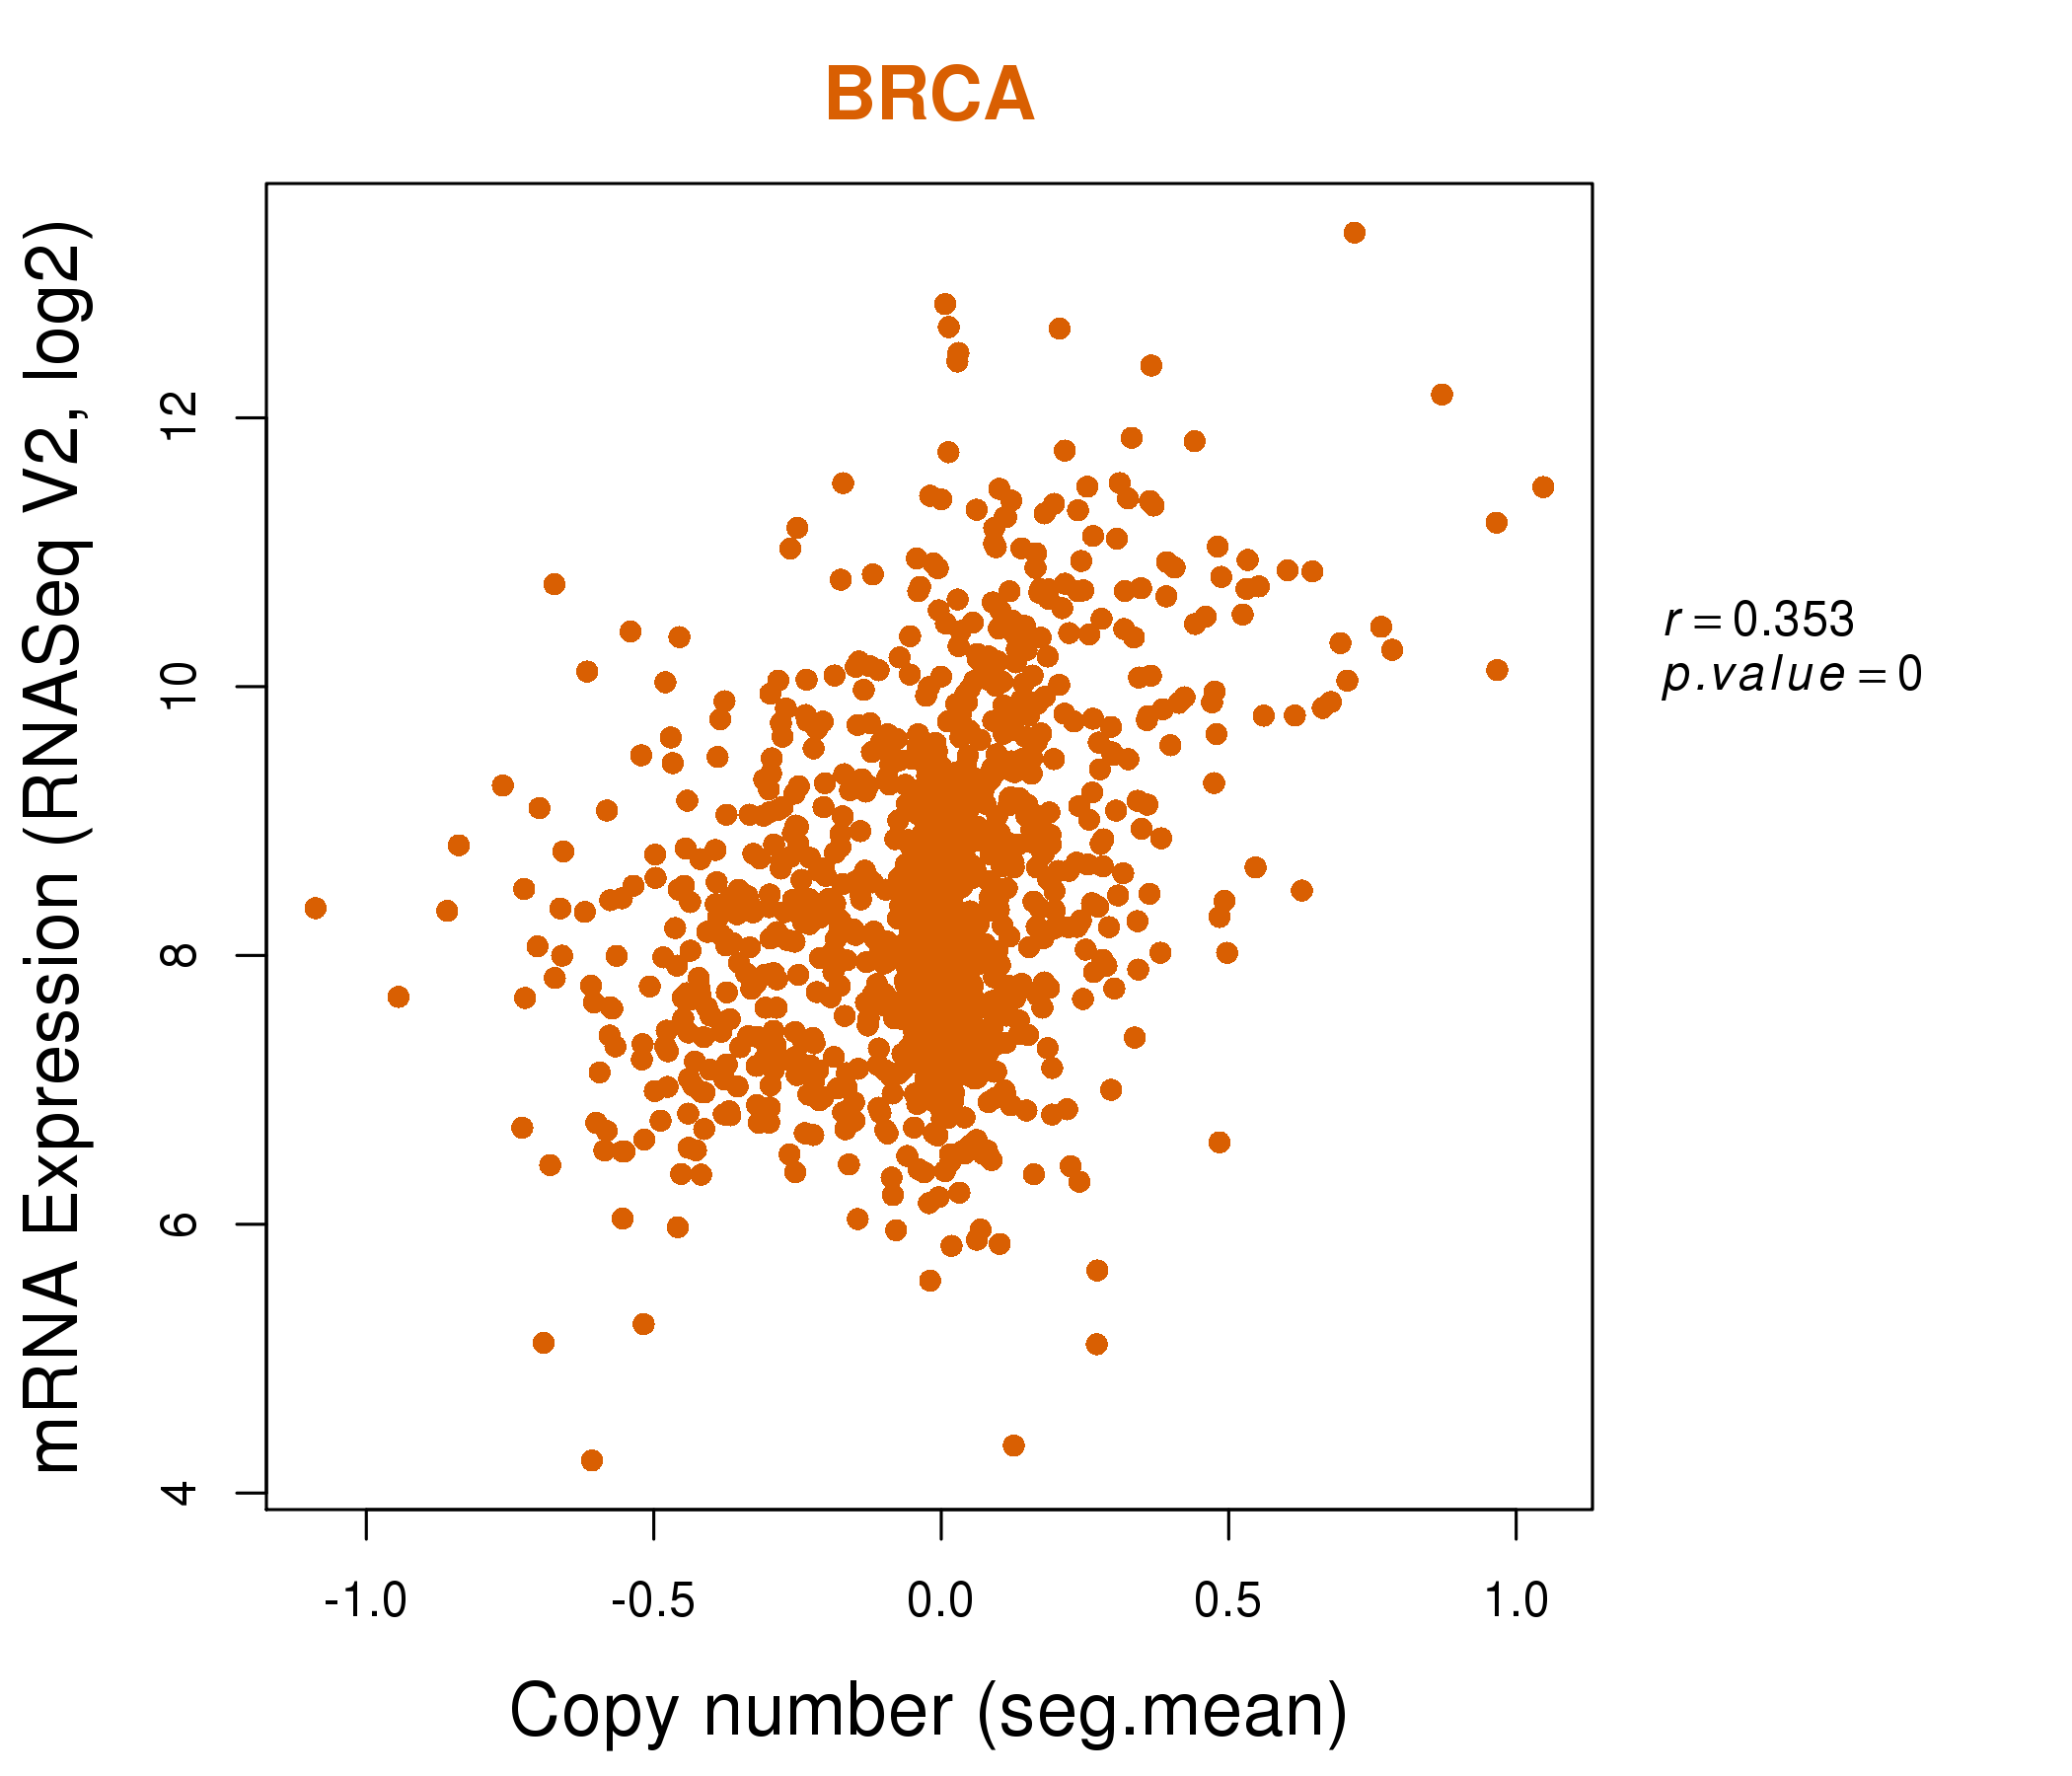
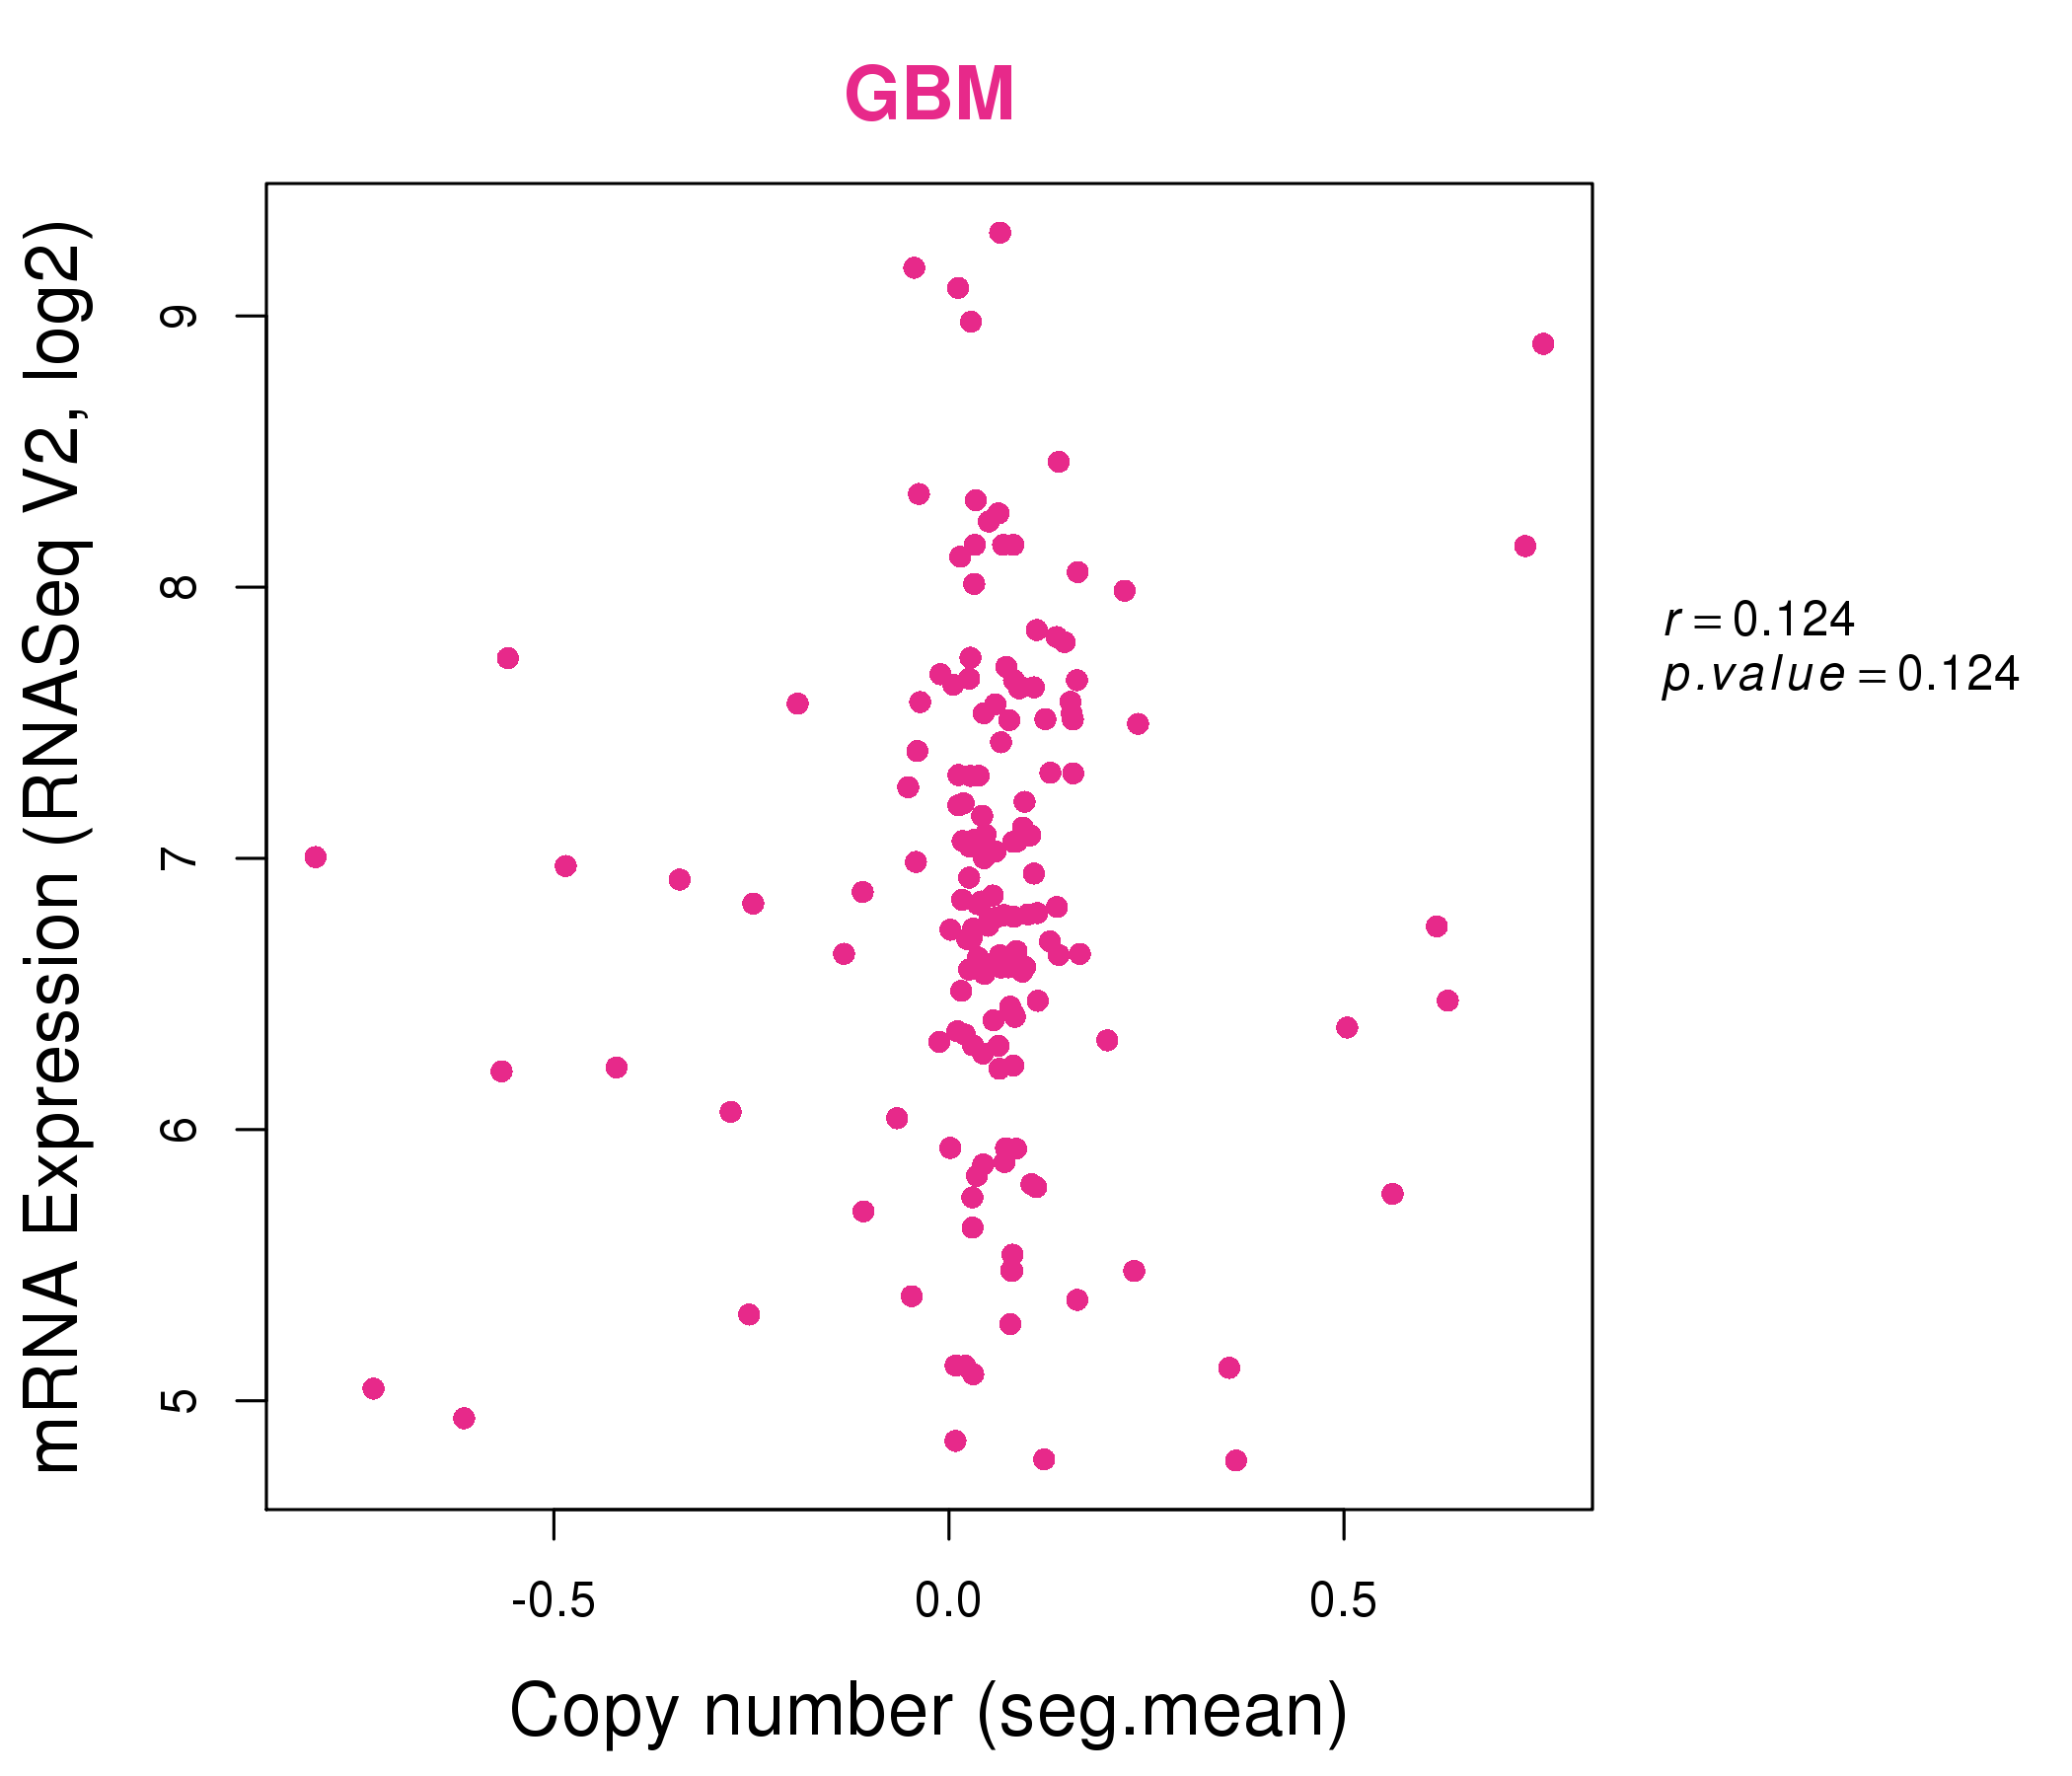
| * This plots show the correlation between CNV and gene expression. |
: Open all plots for all cancer types
 |
|
 |
|
| Top |
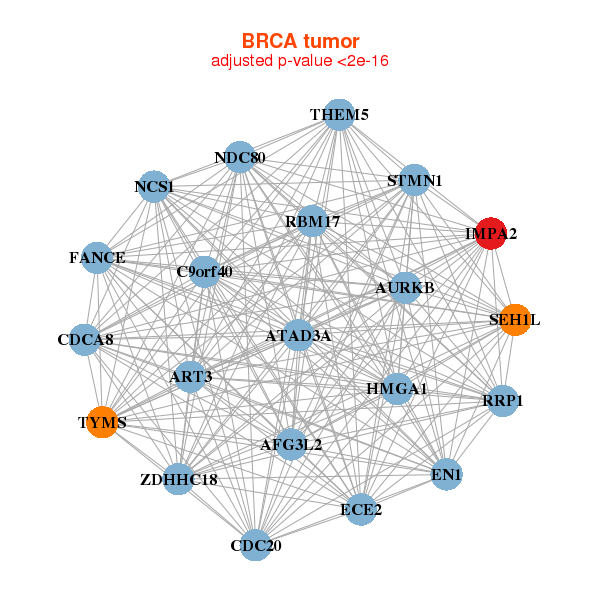
| Gene-Gene Network Information |
| * Co-Expression network figures were drawn using R package igraph. Only the top 20 genes with the highest correlations were shown. Red circle: input gene, orange circle: cell metabolism gene, sky circle: other gene |
: Open all plots for all cancer types
 |
| ||||
| AFG3L2,ART3,ATAD3A,AURKB,C9orf40,CDC20,CDCA8, ECE2,EN1,FANCE,HMGA1,IMPA2,NCS1,NDC80, RBM17,RRP1,SEH1L,STMN1,THEM5,TYMS,ZDHHC18 | AK1,AKR1B1,ALDOA,BIN1,COX7A1,YBX3,CUTC, IL17D,IMPA2,KCNJ12,LINC00116,PAQR9,PINK1,PPAPDC3, RAD23A,SCN1B,SHISA4,SIRT2,TPI1,UBAC1,VDAC3 | ||||
 |
| ||||
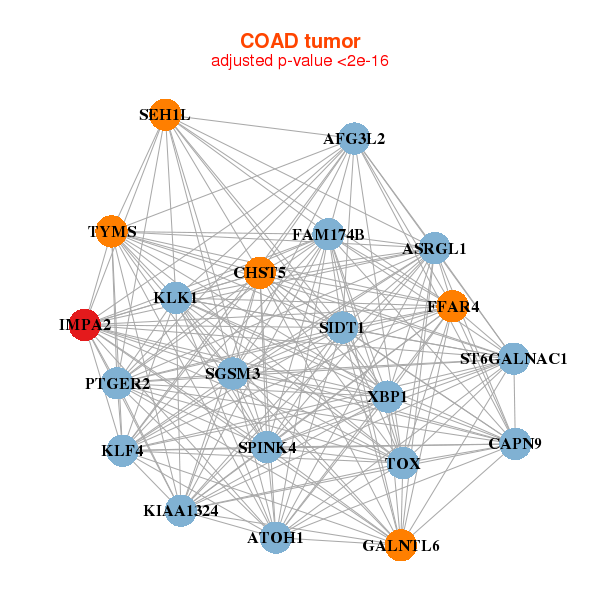
| AFG3L2,ASRGL1,ATOH1,CAPN9,CHST5,FAM174B,GALNTL6, FFAR4,IMPA2,KIAA1324,KLF4,KLK1,PTGER2,SEH1L, SGSM3,SIDT1,SPINK4,ST6GALNAC1,TOX,TYMS,XBP1 | ADCK2,APH1A,CANT1,CDX1,COG2,ERGIC3,FXYD3, IMPA2,LRRC31,LRRC57,MAN1B1,PCTP,PLBD1,PPP1R1B, PXMP2,QARS,RAB25,SMAGP,SMPDL3B,TEX264,TRAPPC6A |

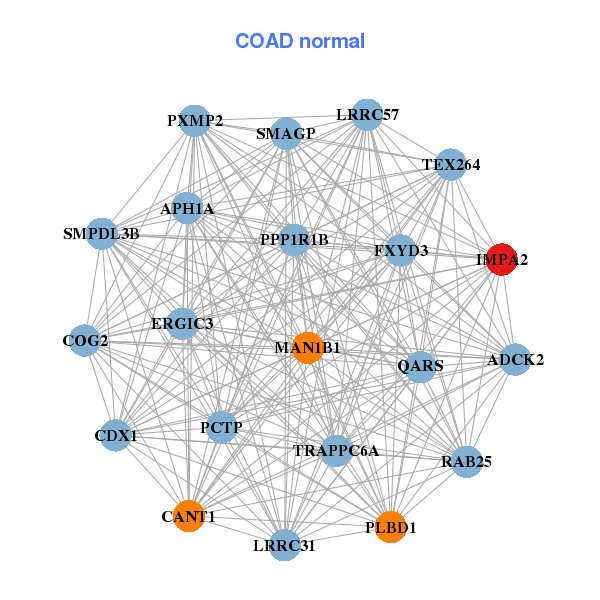
| * Co-Expression network figures were drawn using R package igraph. Only the top 20 genes with the highest correlations were shown. Red circle: input gene, orange circle: cell metabolism gene, sky circle: other gene |
: Open all plots for all cancer types
| Top |
: Open all interacting genes' information including KEGG pathway for all interacting genes from DAVID
| Top |
| Pharmacological Information for IMPA2 |
| DB Category | DB Name | DB's ID and Url link |
| * Gene Centered Interaction Network. |
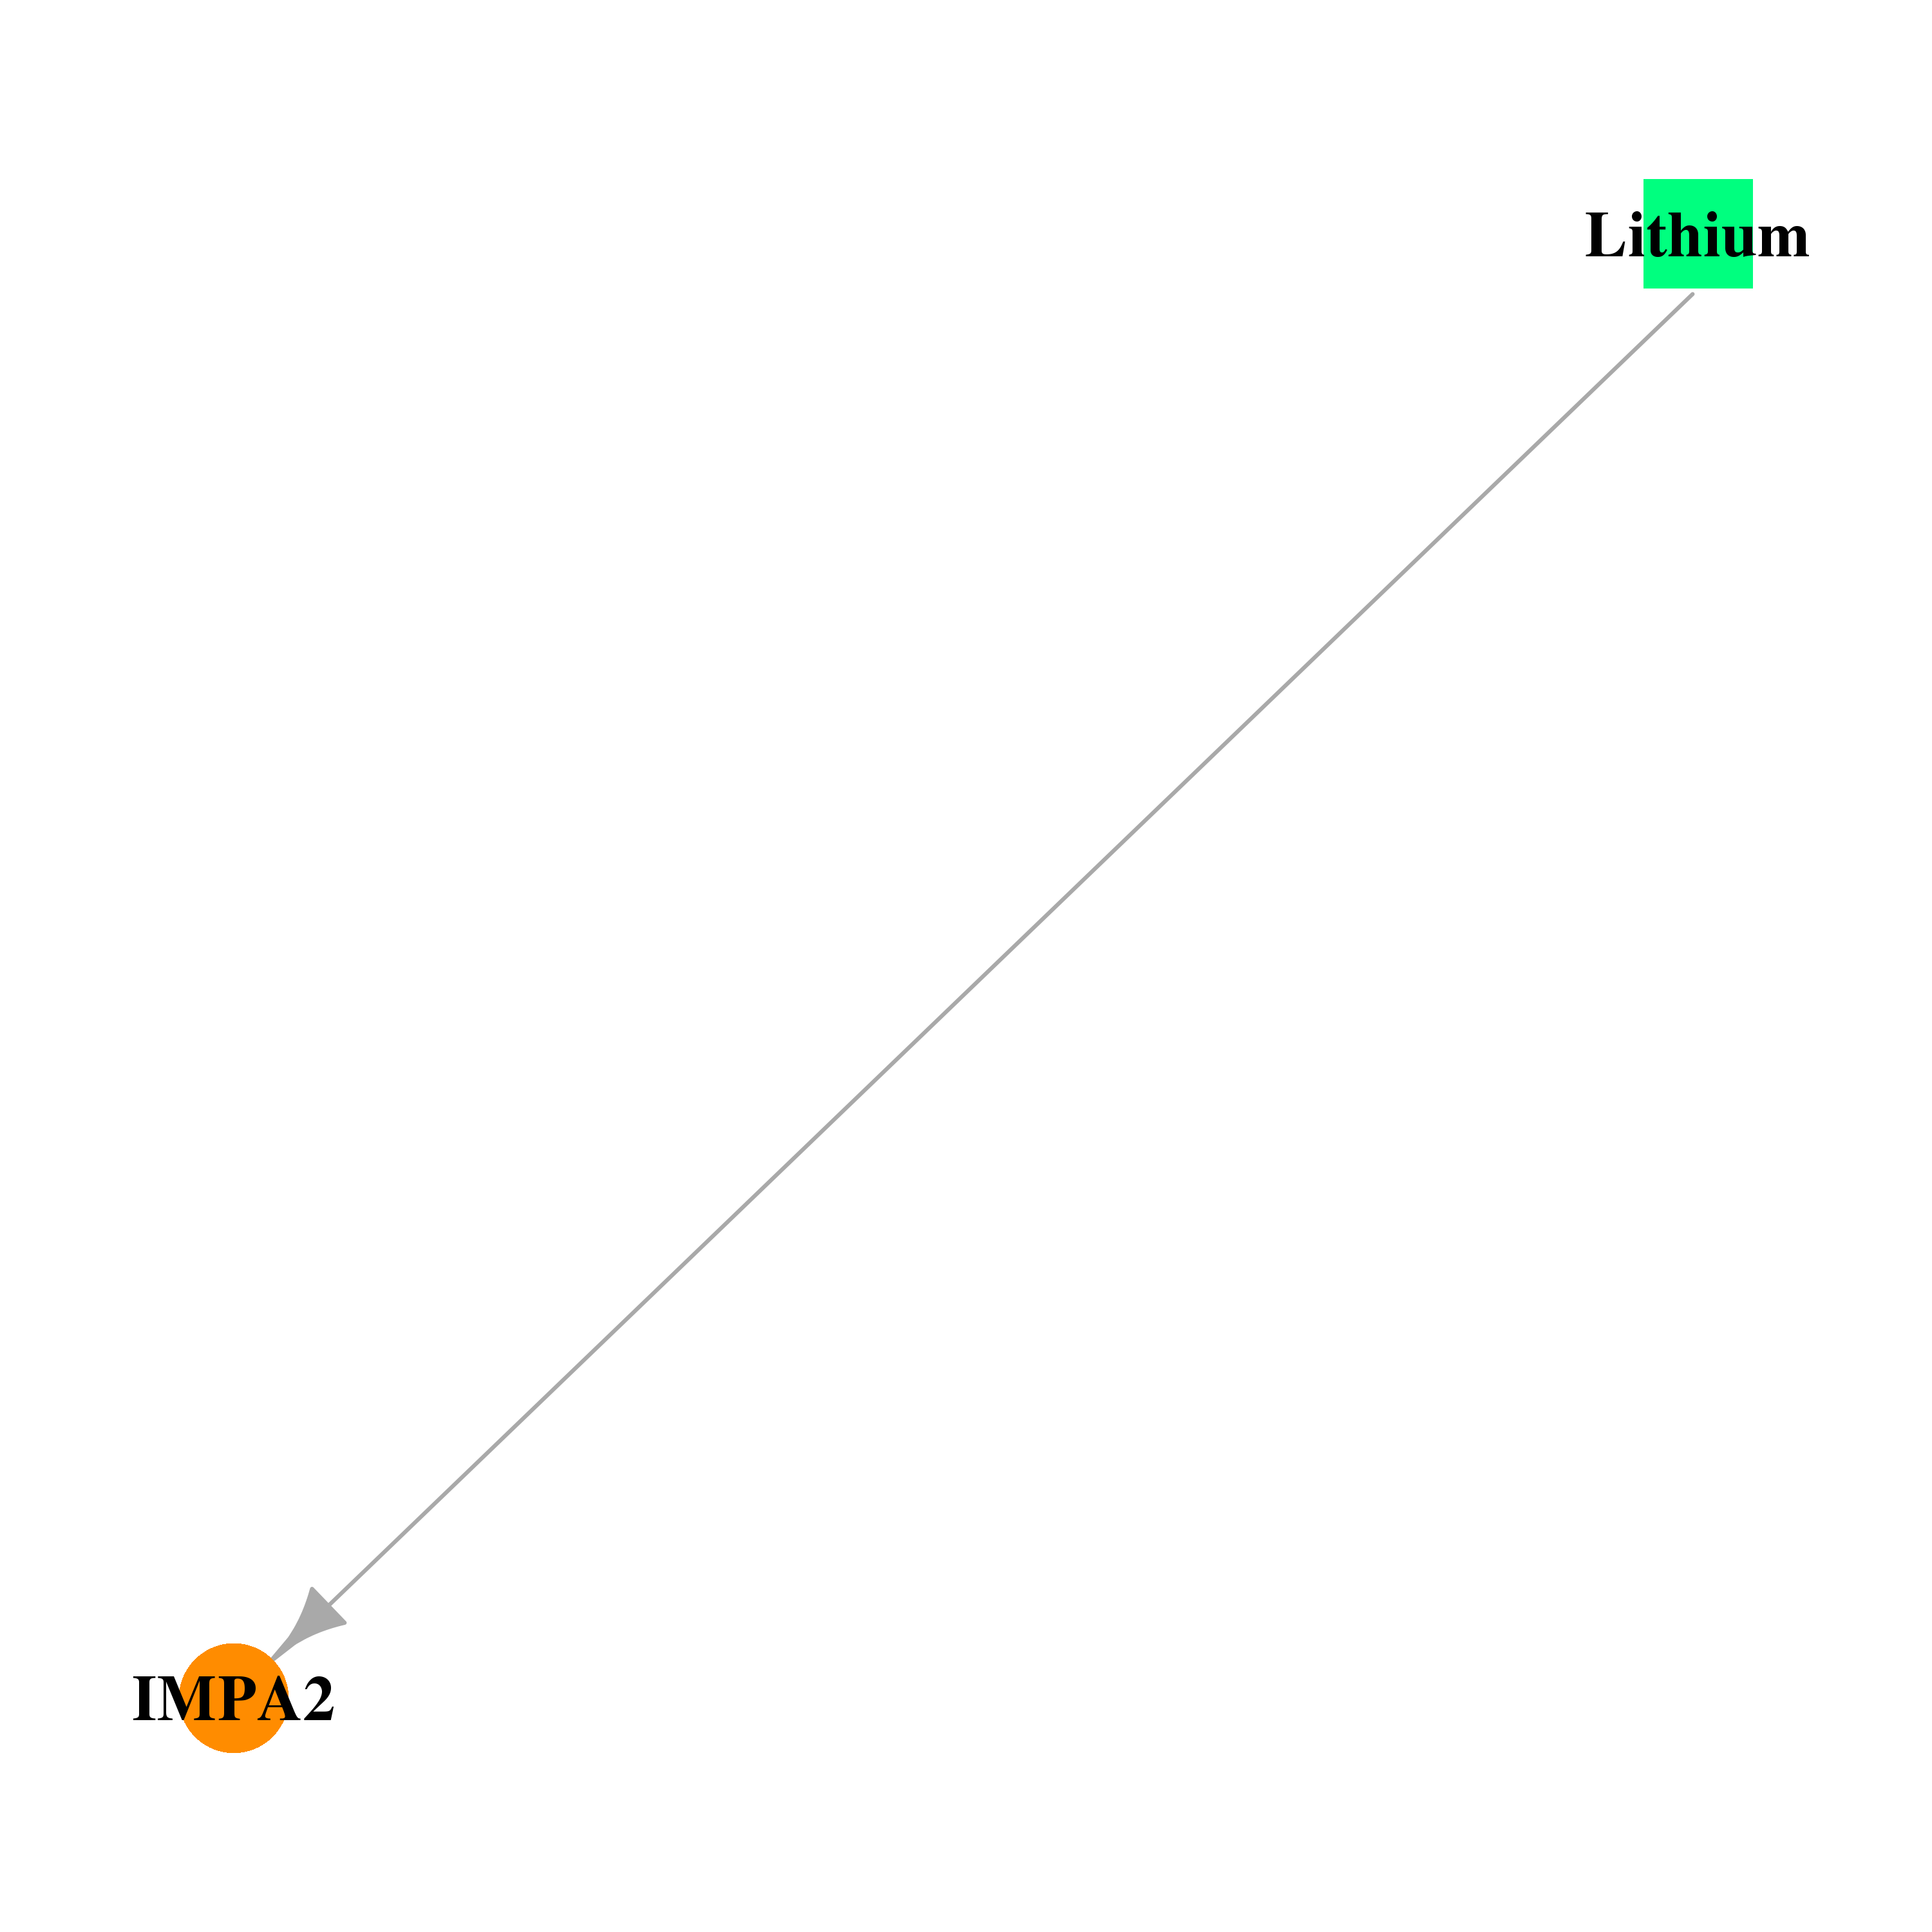 |
| * Drug Centered Interaction Network. |
| DrugBank ID | Target Name | Drug Groups | Generic Name | Drug Centered Network | Drug Structure |
| DB01356 | inositol(myo)-1(or 4)-monophosphatase 2 | approved | Lithium | 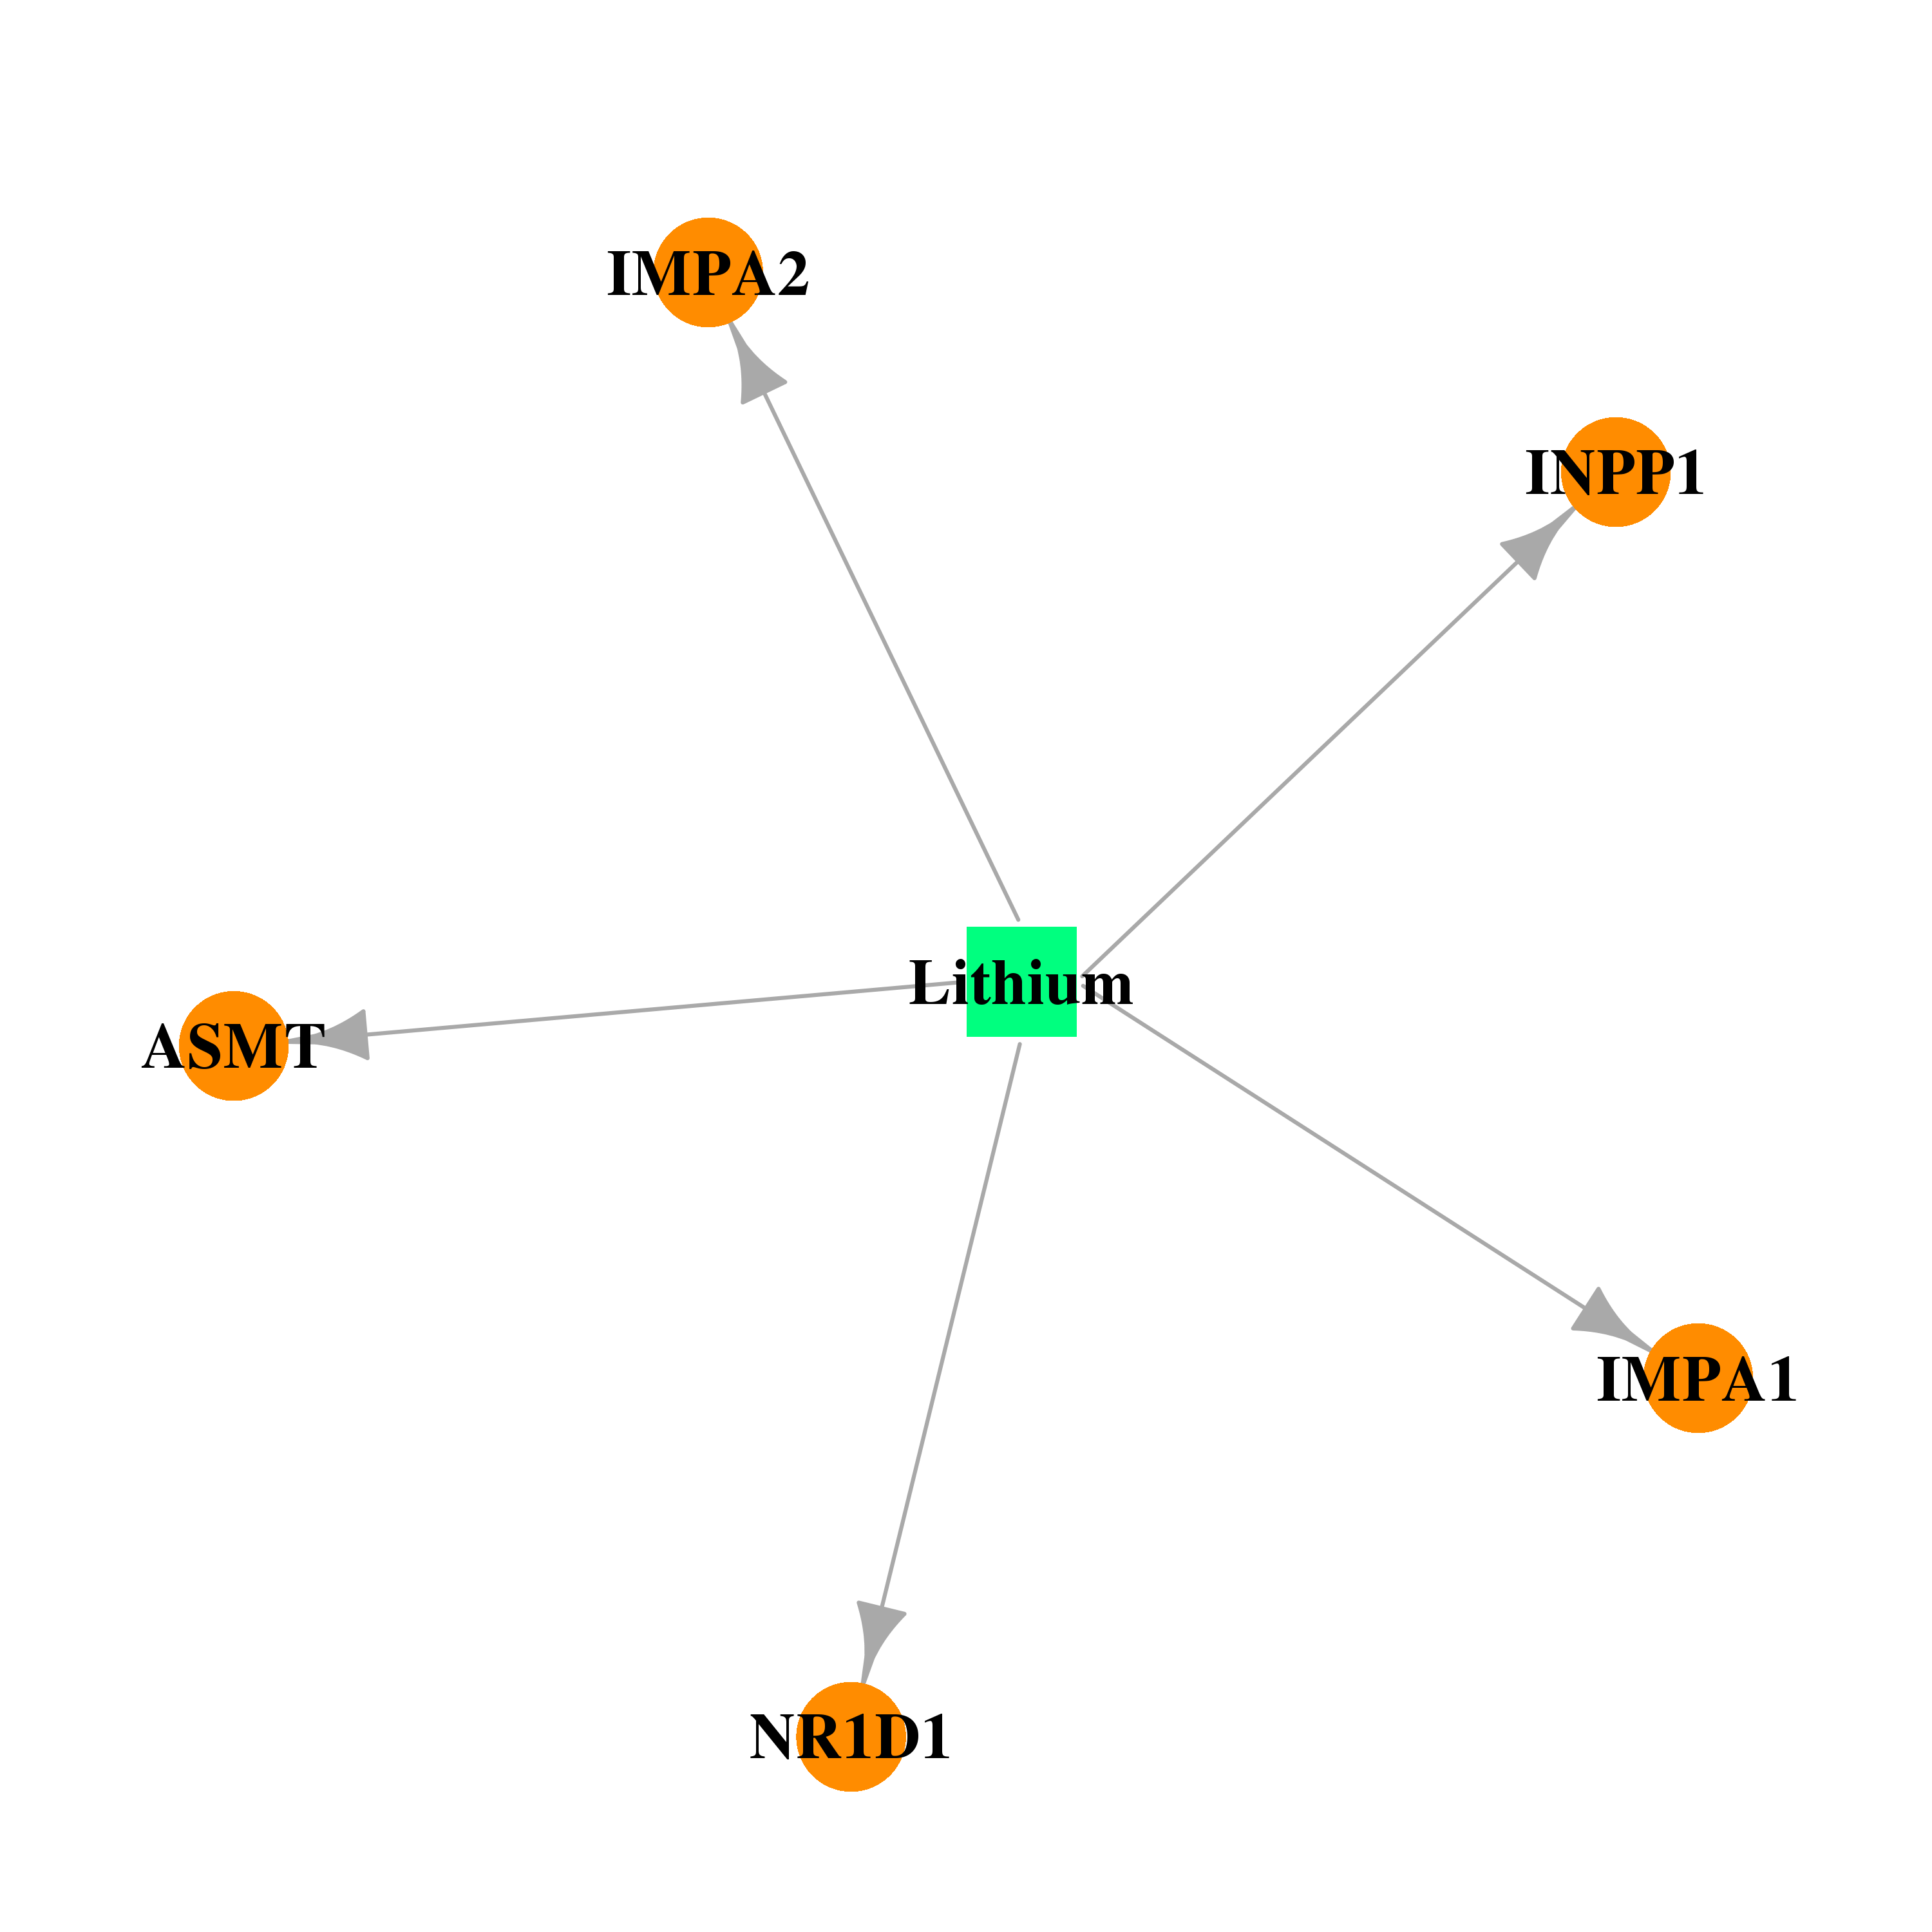 |  |
| Top |
| Cross referenced IDs for IMPA2 |
| * We obtained these cross-references from Uniprot database. It covers 150 different DBs, 18 categories. http://www.uniprot.org/help/cross_references_section |
: Open all cross reference information
|
Copyright © 2016-Present - The Univsersity of Texas Health Science Center at Houston @ |