|
|||||||||||||||||||||||||||||||||||||||||||||||||||||||||||||||||||||||||||||||||||||||||||||||||||||||||||||||||||||||||||||||||||||||||||||||||||||||||||||||||||||||||||||||||||||||||||||||||||||||||||||||||||||||||||||||||||||||||||||||||||||||||||||||||||||||||||||||||||||||||||||||||||||||||||||||||||||||||||||||||||||||||||||||||||||||||||||||||||||||||||
| |
| Phenotypic Information (metabolism pathway, cancer, disease, phenome) |
| |
| |
| Gene-Gene Network Information: Co-Expression Network, Interacting Genes & KEGG |
| |
|


| Gene Summary for IMPDH1 |
| Top |
| Phenotypic Information for IMPDH1(metabolism pathway, cancer, disease, phenome) |
| Cancer | CGAP: IMPDH1 |
| Familial Cancer Database: IMPDH1 | |
| * This gene is included in those cancer gene databases. |
|
|
|
|
|
|
| |||||||||||||||||||||||||||||||||||||||||||||||||||||||||||||||||||||||||||||||||||||||||||||||||||||||||||||||||||||||||||||||||||||||||||||||||||||||||||||||||||||||||||||||||||||||||||||||||||||||||||||||||||||||||||||||||||||||||||||||||||||||||||||||||||||||||||||||||||||||||||||||||||||||||||||||||||||||||||||||||||||||||||||||||||||||||||||||||||||
Oncogene 1 | Significant driver gene in | ||||||||||||||||||||||||||||||||||||||||||||||||||||||||||||||||||||||||||||||||||||||||||||||||||||||||||||||||||||||||||||||||||||||||||||||||||||||||||||||||||||||||||||||||||||||||||||||||||||||||||||||||||||||||||||||||||||||||||||||||||||||||||||||||||||||||||||||||||||||||||||||||||||||||||||||||||||||||||||||||||||||||||||||||||||||||||||||||||||||||||
| cf) number; DB name 1 Oncogene; http://nar.oxfordjournals.org/content/35/suppl_1/D721.long, 2 Tumor Suppressor gene; https://bioinfo.uth.edu/TSGene/, 3 Cancer Gene Census; http://www.nature.com/nrc/journal/v4/n3/abs/nrc1299.html, 4 CancerGenes; http://nar.oxfordjournals.org/content/35/suppl_1/D721.long, 5 Network of Cancer Gene; http://ncg.kcl.ac.uk/index.php, 1Therapeutic Vulnerabilities in Cancer; http://cbio.mskcc.org/cancergenomics/statius/ |
| KEGG_PURINE_METABOLISM KEGG_DRUG_METABOLISM_OTHER_ENZYMES REACTOME_METABOLISM_OF_NUCLEOTIDES REACTOME_PURINE_METABOLISM | |
| OMIM | |
| Orphanet | |
| Disease | KEGG Disease: IMPDH1 |
| MedGen: IMPDH1 (Human Medical Genetics with Condition) | |
| ClinVar: IMPDH1 | |
| Phenotype | MGI: IMPDH1 (International Mouse Phenotyping Consortium) |
| PhenomicDB: IMPDH1 | |
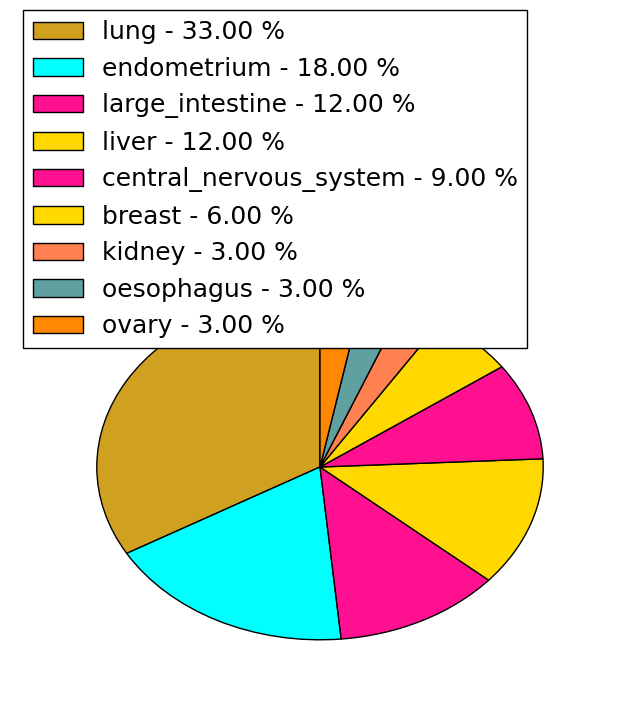
| Mutations for IMPDH1 |
| * Under tables are showing count per each tissue to give us broad intuition about tissue specific mutation patterns.You can go to the detailed page for each mutation database's web site. |
| There's no structural variation information in COSMIC data for this gene. |
| * From mRNA Sanger sequences, Chitars2.0 arranged chimeric transcripts. This table shows IMPDH1 related fusion information. |
| ID | Head Gene | Tail Gene | Accession | Gene_a | qStart_a | qEnd_a | Chromosome_a | tStart_a | tEnd_a | Gene_a | qStart_a | qEnd_a | Chromosome_a | tStart_a | tEnd_a |
| BG954732 | CDV3 | 6 | 281 | 3 | 133306634 | 133306914 | IMPDH1 | 272 | 366 | 7 | 128043784 | 128045890 | |
| Top |
| Mutation type/ Tissue ID | brca | cns | cerv | endome | haematopo | kidn | Lintest | liver | lung | ns | ovary | pancre | prost | skin | stoma | thyro | urina | |||
| Total # sample | 1 | |||||||||||||||||||
| GAIN (# sample) | 1 | |||||||||||||||||||
| LOSS (# sample) |
| cf) Tissue ID; Tissue type (1; Breast, 2; Central_nervous_system, 3; Cervix, 4; Endometrium, 5; Haematopoietic_and_lymphoid_tissue, 6; Kidney, 7; Large_intestine, 8; Liver, 9; Lung, 10; NS, 11; Ovary, 12; Pancreas, 13; Prostate, 14; Skin, 15; Stomach, 16; Thyroid, 17; Urinary_tract) |
| Top |
|
 |
| Top |
| Stat. for Non-Synonymous SNVs (# total SNVs=33) | (# total SNVs=10) |
 |  |
(# total SNVs=0) | (# total SNVs=0) |
| Top |
| * When you move the cursor on each content, you can see more deailed mutation information on the Tooltip. Those are primary_site,primary_histology,mutation(aa),pubmedID. |
| GRCh37 position | Mutation(aa) | Unique sampleID count |
| chr7:128035304-128035304 | p.G429V | 2 |
| chr7:128038490-128038490 | p.A351V | 2 |
| chr7:128040946-128040946 | p.? | 2 |
| chr7:128037021-128037021 | p.Q377R | 2 |
| chr7:128037057-128037057 | p.S365* | 2 |
| chr7:128035227-128035227 | p.V455L | 1 |
| chr7:128040441-128040441 | p.T244T | 1 |
| chr7:128038480-128038480 | p.D354D | 1 |
| chr7:128049407-128049407 | p.? | 1 |
| chr7:128034618-128034618 | p.S529L | 1 |
| Top |
|
 |
| Point Mutation/ Tissue ID | 1 | 2 | 3 | 4 | 5 | 6 | 7 | 8 | 9 | 10 | 11 | 12 | 13 | 14 | 15 | 16 | 17 | 18 | 19 | 20 |
| # sample | 2 | 3 | 2 | 2 | 1 | 9 | 3 | 2 | 7 | 7 | 8 | |||||||||
| # mutation | 2 | 3 | 2 | 3 | 1 | 10 | 4 | 2 | 7 | 7 | 8 | |||||||||
| nonsynonymous SNV | 2 | 3 | 2 | 3 | 1 | 8 | 3 | 1 | 2 | 5 | 6 | |||||||||
| synonymous SNV | 2 | 1 | 1 | 5 | 2 | 2 |
| cf) Tissue ID; Tissue type (1; BLCA[Bladder Urothelial Carcinoma], 2; BRCA[Breast invasive carcinoma], 3; CESC[Cervical squamous cell carcinoma and endocervical adenocarcinoma], 4; COAD[Colon adenocarcinoma], 5; GBM[Glioblastoma multiforme], 6; Glioma Low Grade, 7; HNSC[Head and Neck squamous cell carcinoma], 8; KICH[Kidney Chromophobe], 9; KIRC[Kidney renal clear cell carcinoma], 10; KIRP[Kidney renal papillary cell carcinoma], 11; LAML[Acute Myeloid Leukemia], 12; LUAD[Lung adenocarcinoma], 13; LUSC[Lung squamous cell carcinoma], 14; OV[Ovarian serous cystadenocarcinoma ], 15; PAAD[Pancreatic adenocarcinoma], 16; PRAD[Prostate adenocarcinoma], 17; SKCM[Skin Cutaneous Melanoma], 18:STAD[Stomach adenocarcinoma], 19:THCA[Thyroid carcinoma], 20:UCEC[Uterine Corpus Endometrial Carcinoma]) |
| Top |
| * We represented just top 10 SNVs. When you move the cursor on each content, you can see more deailed mutation information on the Tooltip. Those are primary_site, primary_histology, mutation(aa), pubmedID. |
| Genomic Position | Mutation(aa) | Unique sampleID count |
| chr7:128034398 | p.G461A,IMPDH1 | 2 |
| chr7:128037057 | p.E396Q,IMPDH1 | 1 |
| chr7:128049523 | p.D207V,IMPDH1 | 1 |
| chr7:128038624 | p.R111W,IMPDH1 | 1 |
| chr7:128034966 | p.M395I,IMPDH1 | 1 |
| chr7:128040468 | p.N205N,IMPDH1 | 1 |
| chr7:128037064 | p.A81T,IMPDH1 | 1 |
| chr7:128038635 | p.K384N,IMPDH1 | 1 |
| chr7:128034977 | p.A198D,IMPDH1 | 1 |
| chr7:128040512 | p.D77Y,IMPDH1 | 1 |
| * Copy number data were extracted from TCGA using R package TCGA-Assembler. The URLs of all public data files on TCGA DCC data server were gathered on Jan-05-2015. Function ProcessCNAData in TCGA-Assembler package was used to obtain gene-level copy number value which is calculated as the average copy number of the genomic region of a gene. |
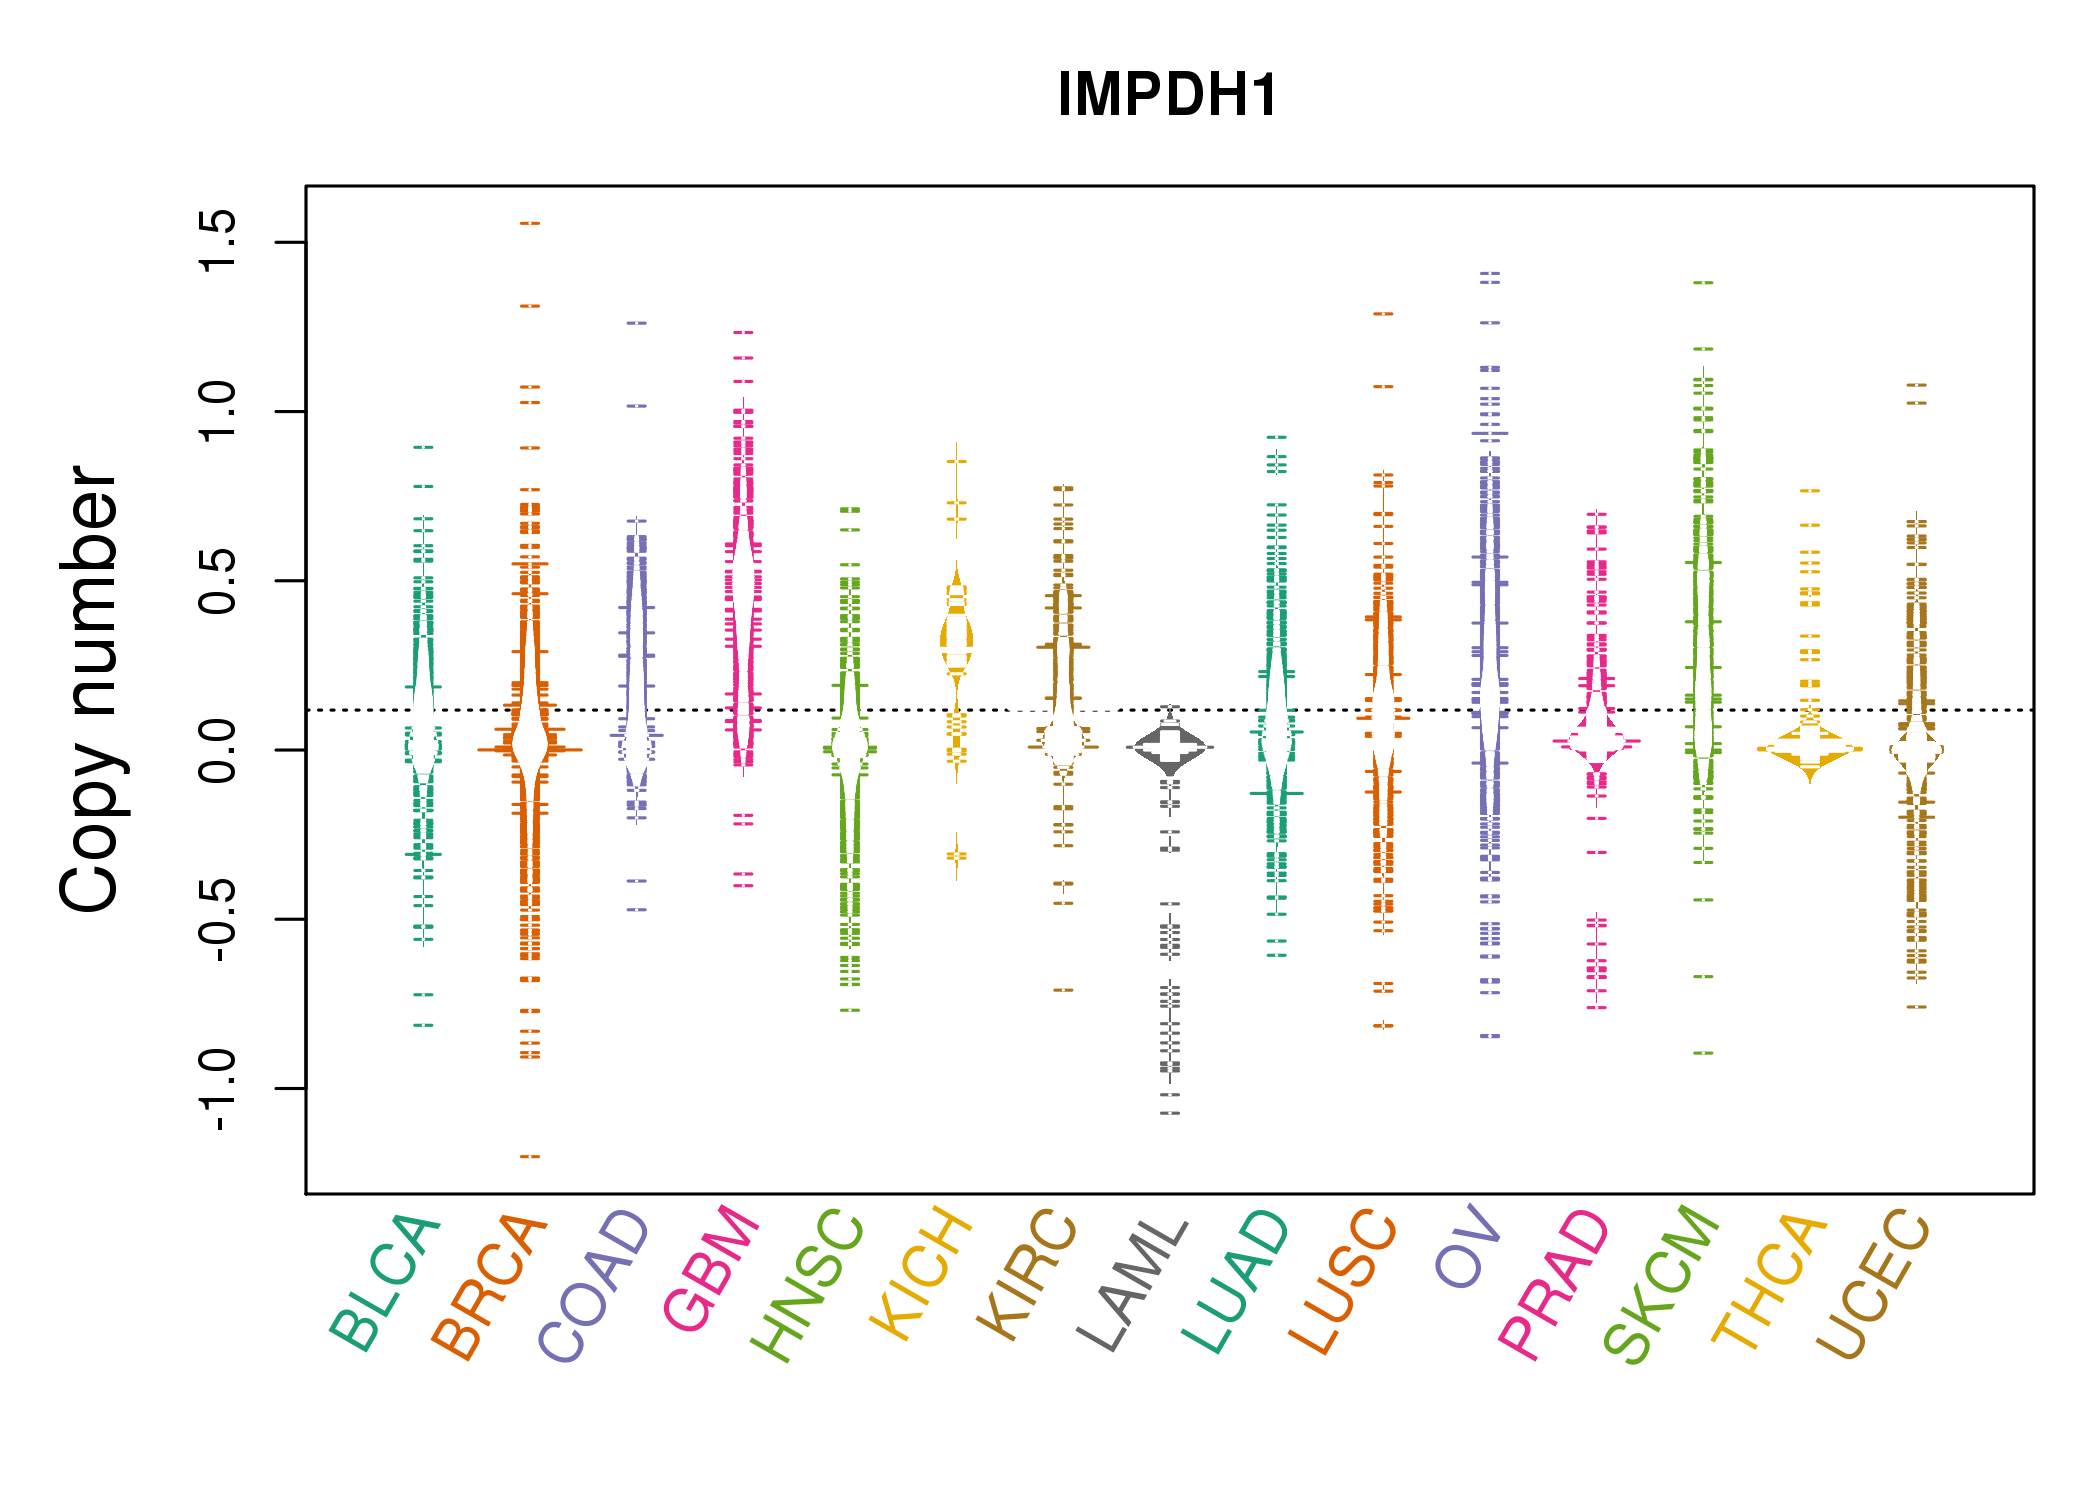 |
| cf) Tissue ID[Tissue type]: BLCA[Bladder Urothelial Carcinoma], BRCA[Breast invasive carcinoma], CESC[Cervical squamous cell carcinoma and endocervical adenocarcinoma], COAD[Colon adenocarcinoma], GBM[Glioblastoma multiforme], Glioma Low Grade, HNSC[Head and Neck squamous cell carcinoma], KICH[Kidney Chromophobe], KIRC[Kidney renal clear cell carcinoma], KIRP[Kidney renal papillary cell carcinoma], LAML[Acute Myeloid Leukemia], LUAD[Lung adenocarcinoma], LUSC[Lung squamous cell carcinoma], OV[Ovarian serous cystadenocarcinoma ], PAAD[Pancreatic adenocarcinoma], PRAD[Prostate adenocarcinoma], SKCM[Skin Cutaneous Melanoma], STAD[Stomach adenocarcinoma], THCA[Thyroid carcinoma], UCEC[Uterine Corpus Endometrial Carcinoma] |
| Top |
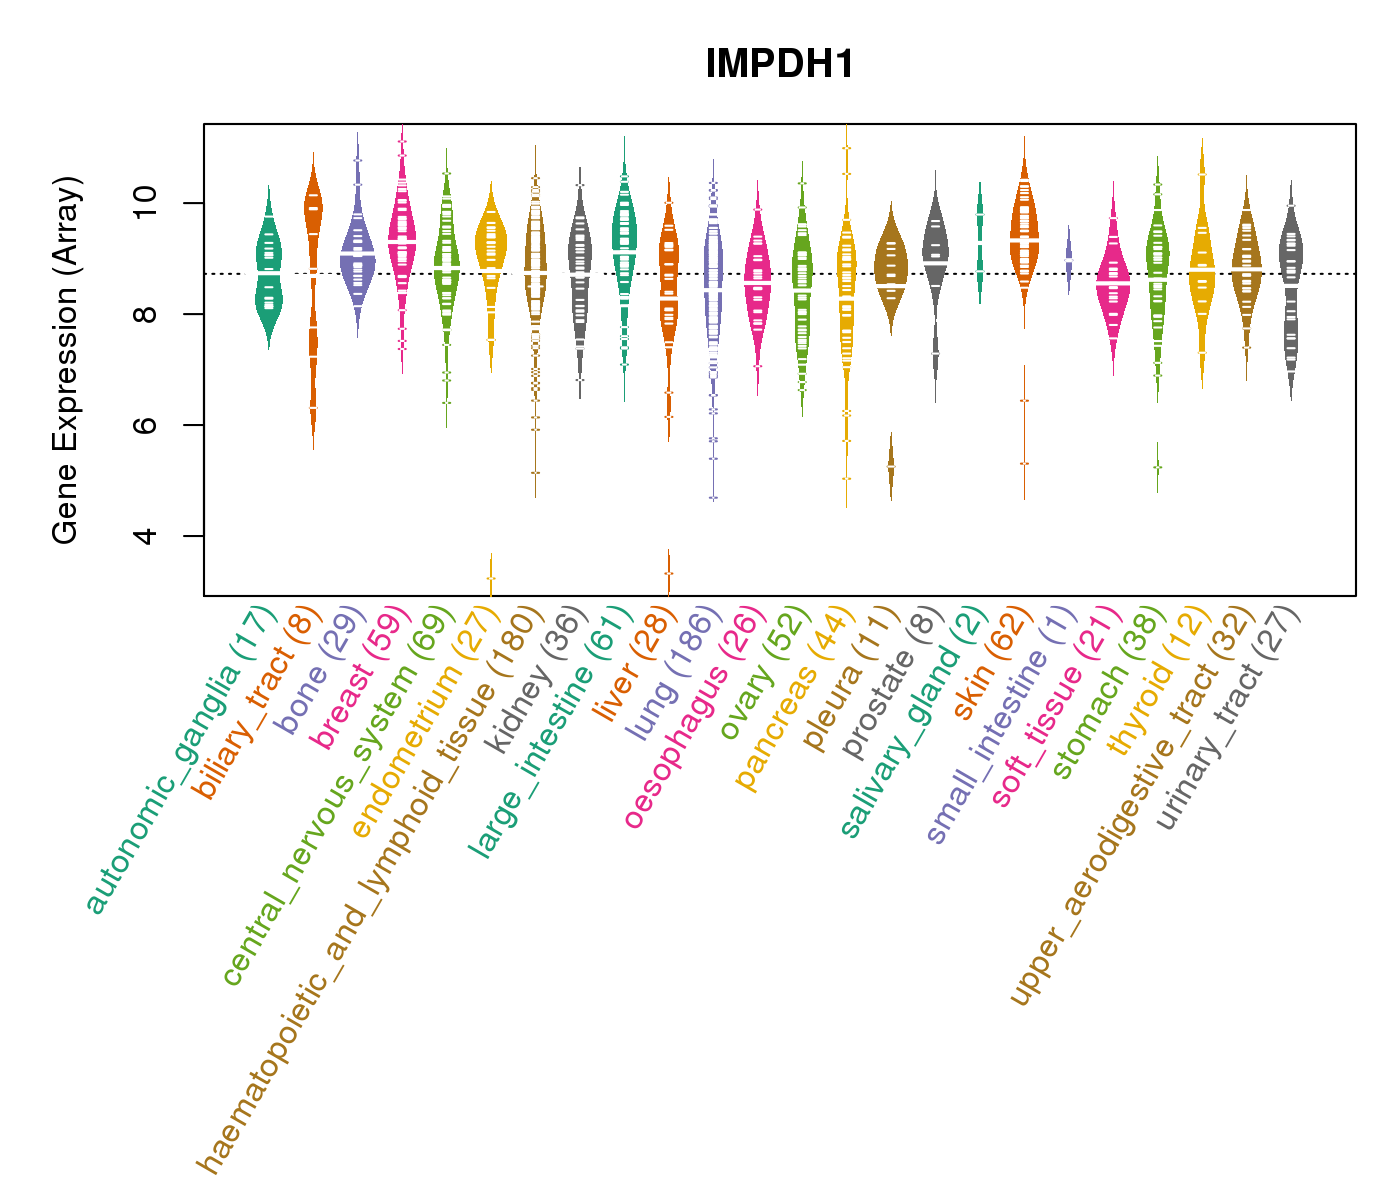
| Gene Expression for IMPDH1 |
| * CCLE gene expression data were extracted from CCLE_Expression_Entrez_2012-10-18.res: Gene-centric RMA-normalized mRNA expression data. |
 |
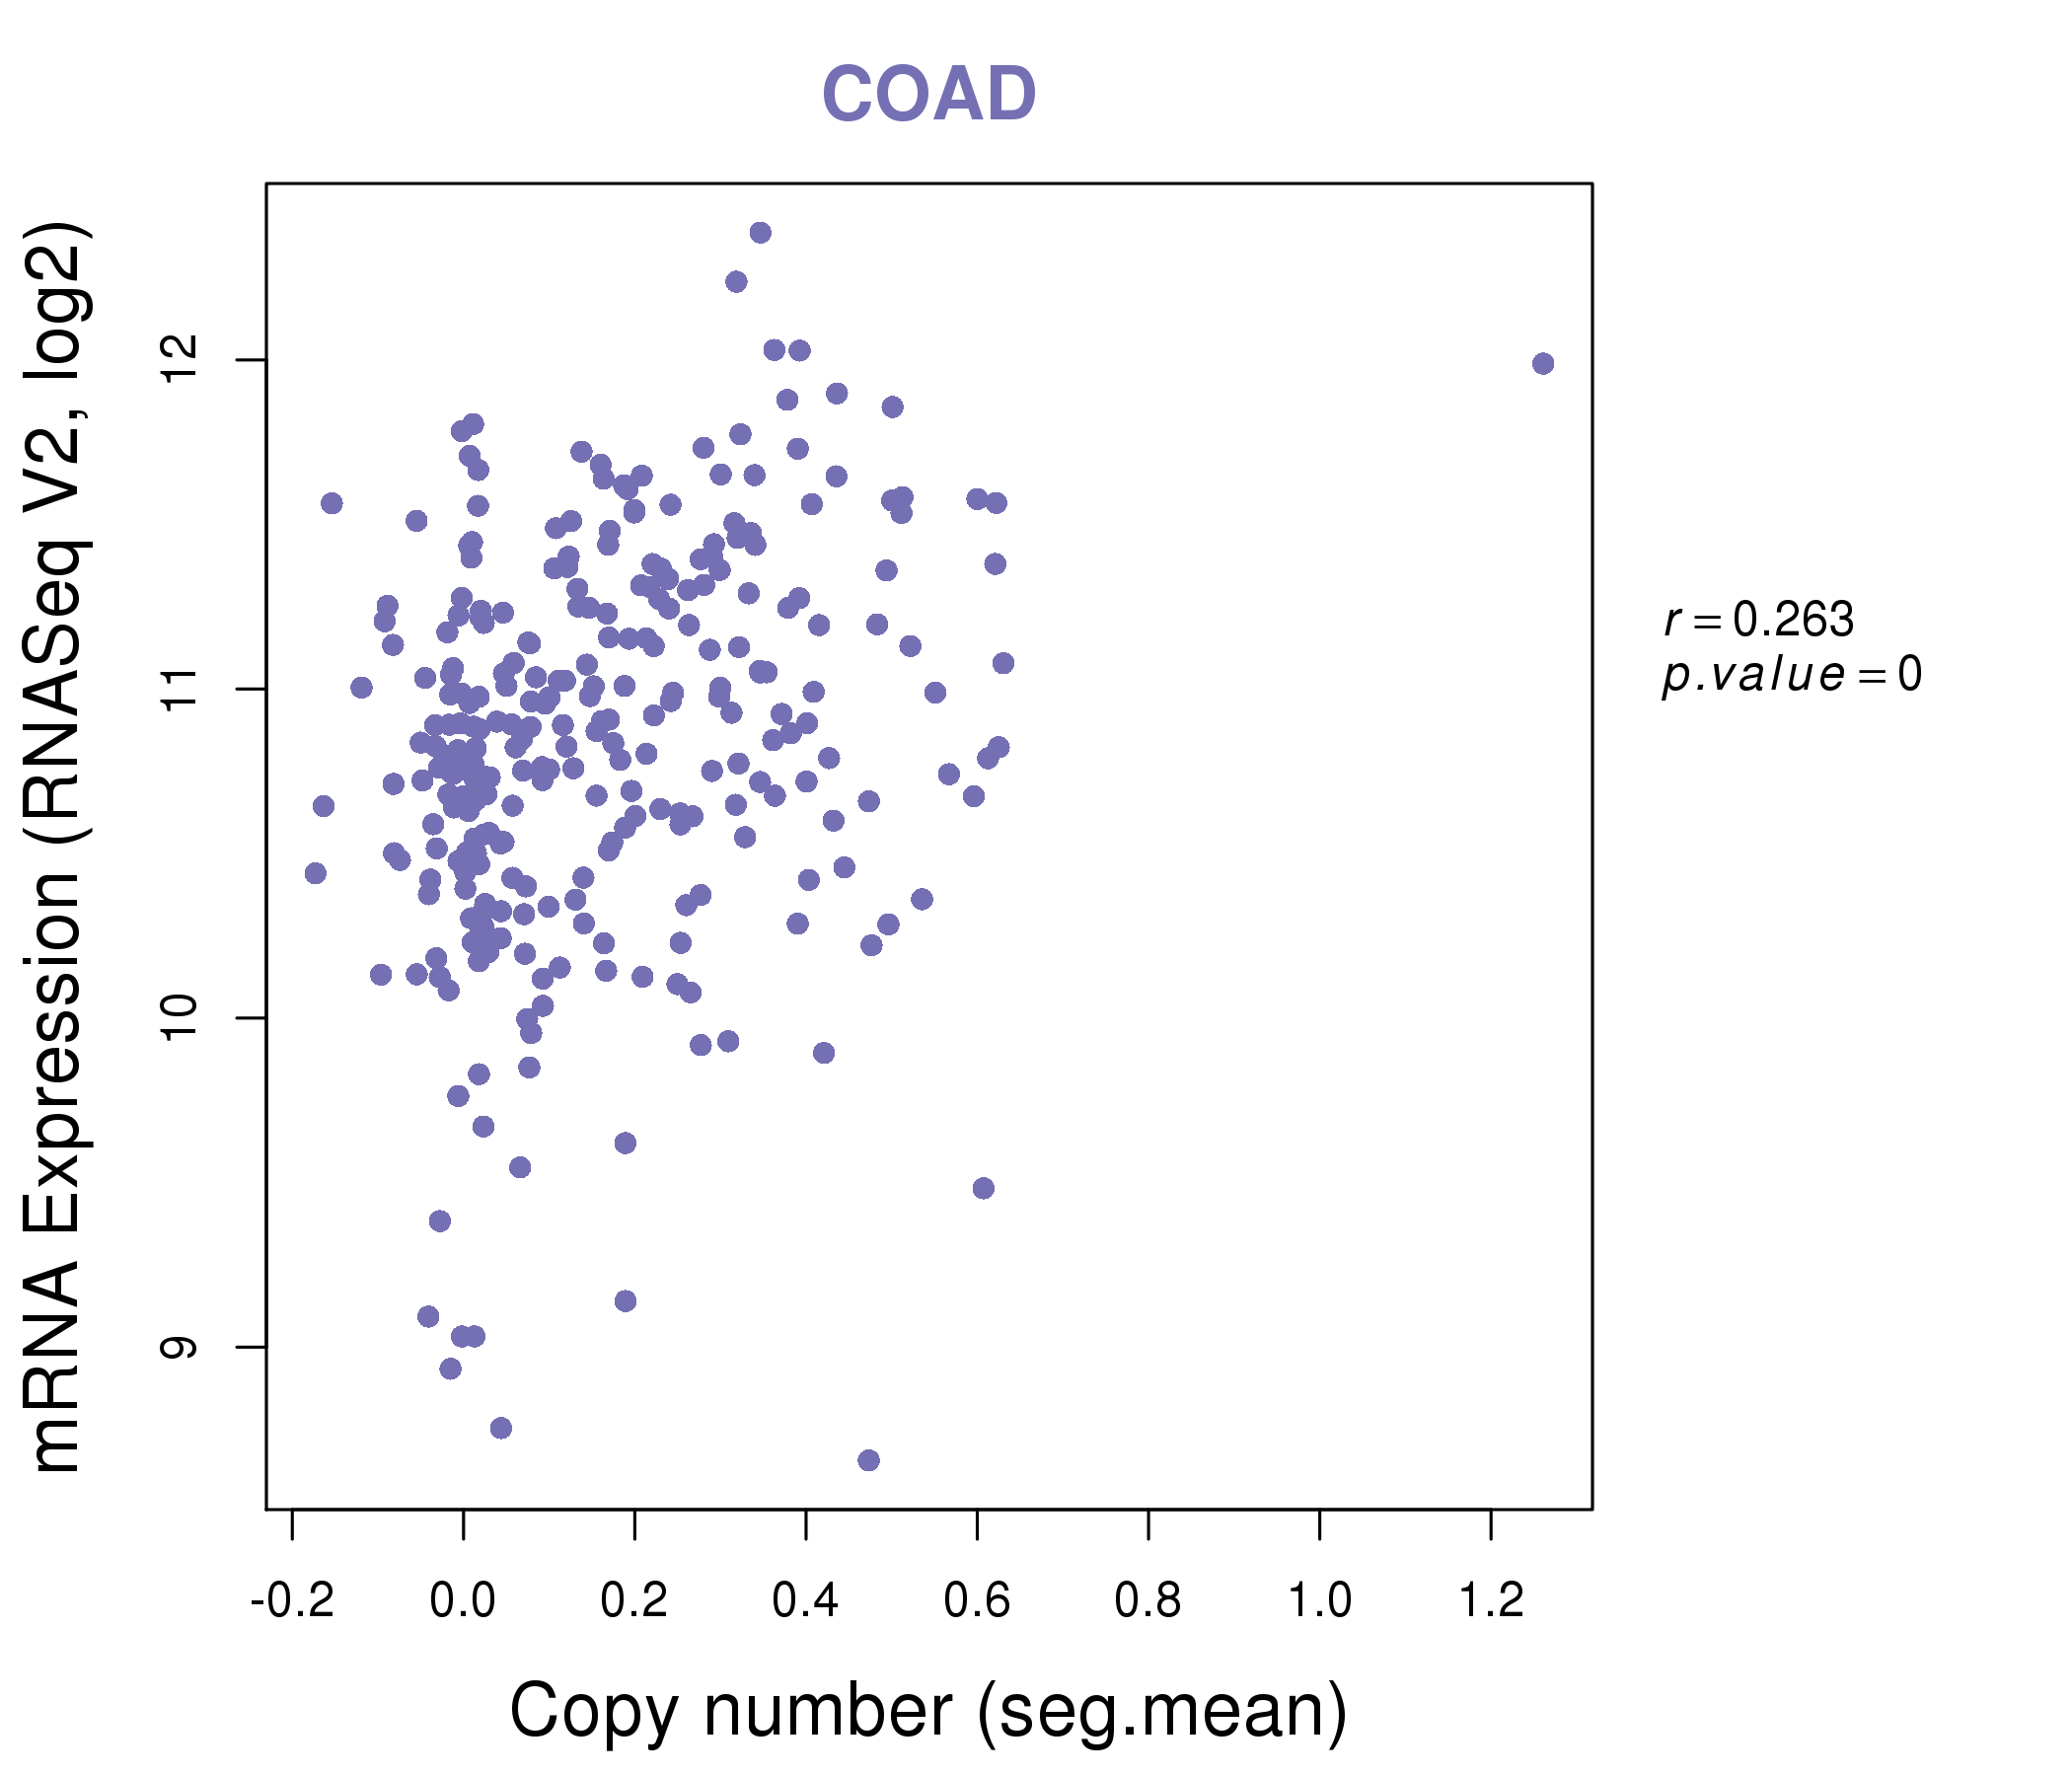
| * Normalized gene expression data of RNASeqV2 was extracted from TCGA using R package TCGA-Assembler. The URLs of all public data files on TCGA DCC data server were gathered at Jan-05-2015. Only eight cancer types have enough normal control samples for differential expression analysis. (t test, adjusted p<0.05 (using Benjamini-Hochberg FDR)) |
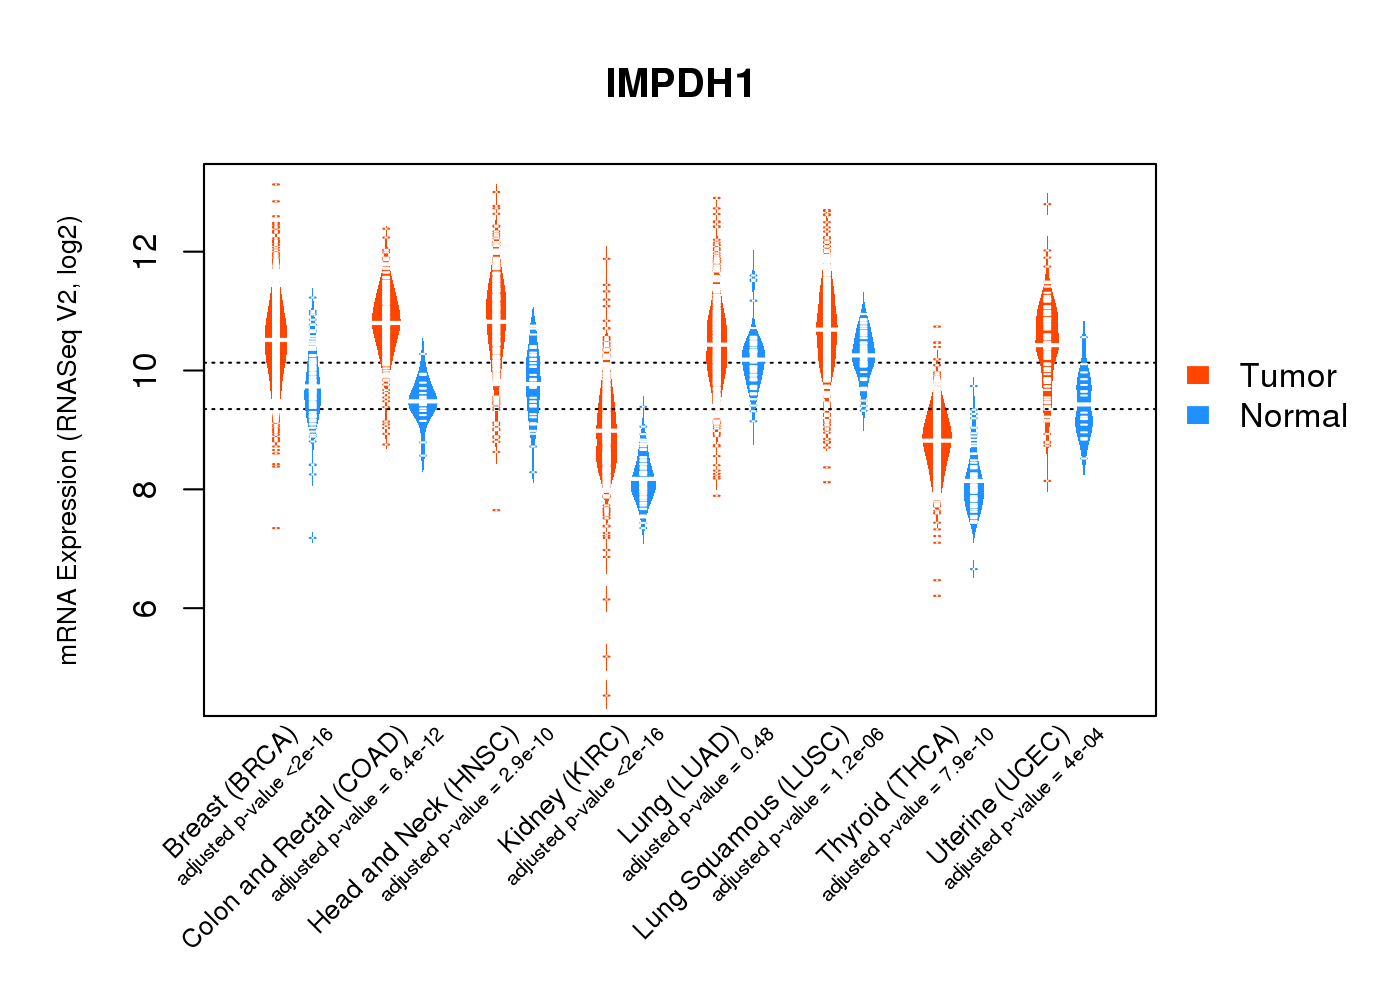 |
| Top |
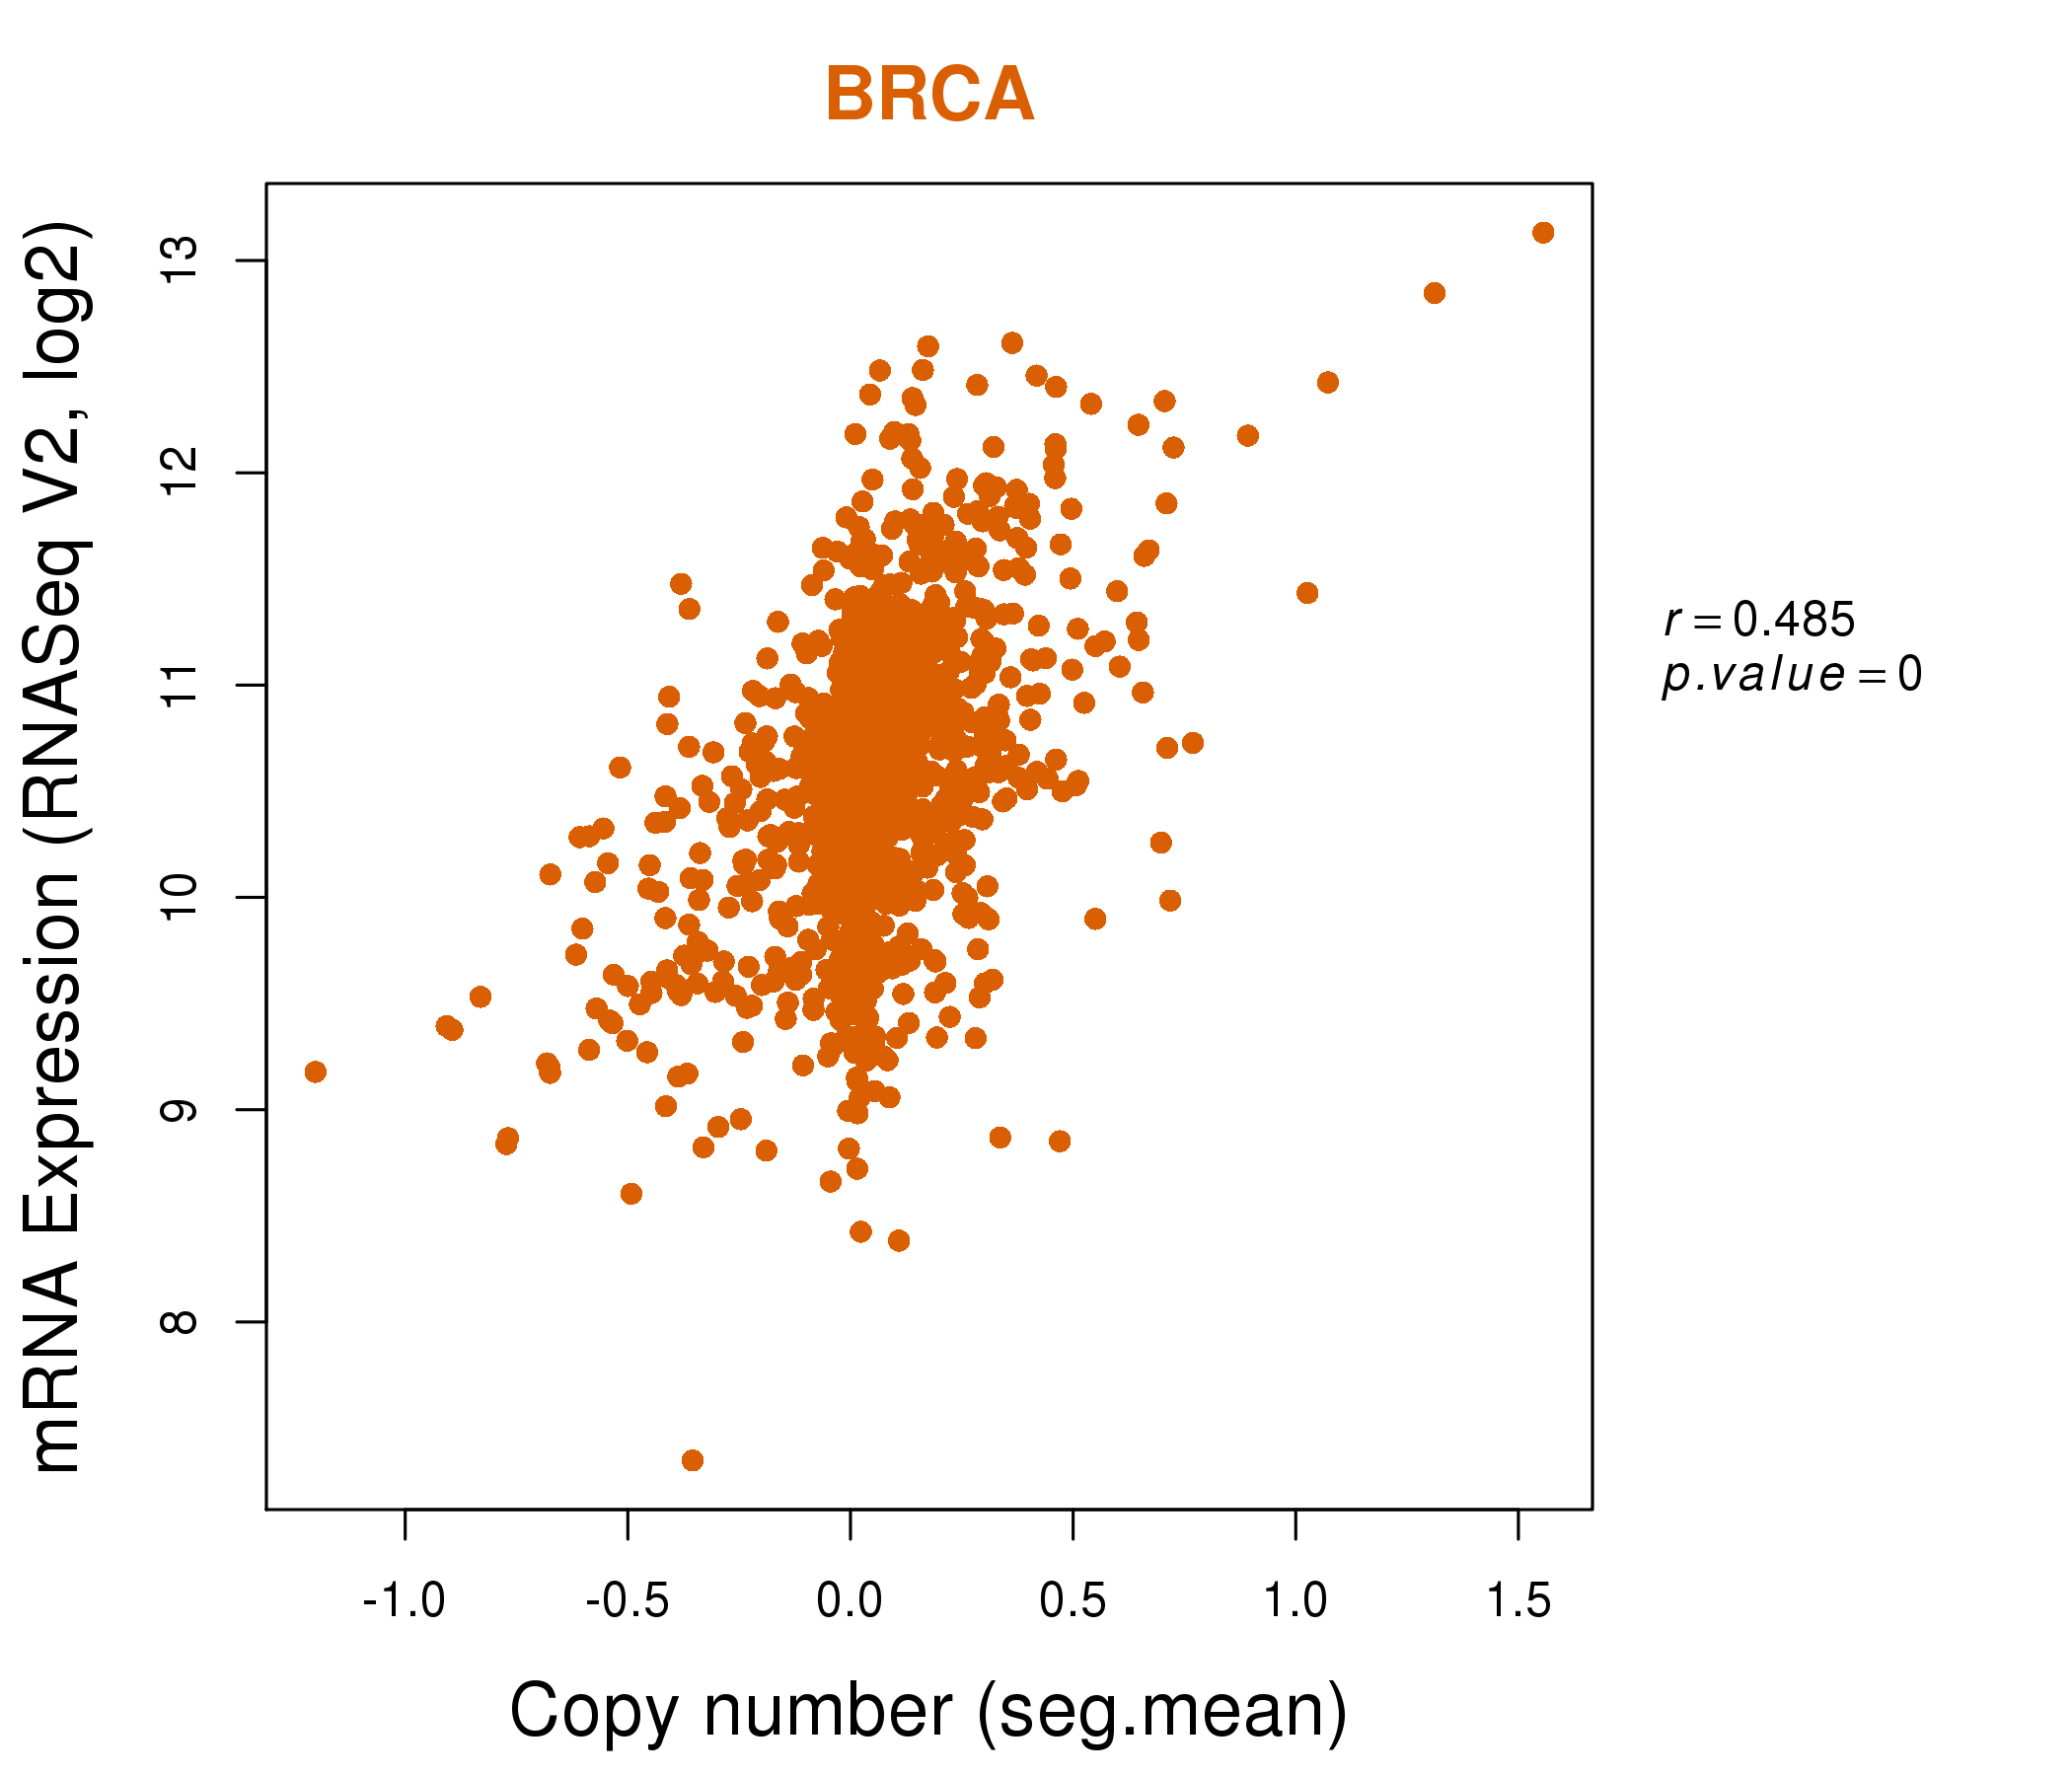
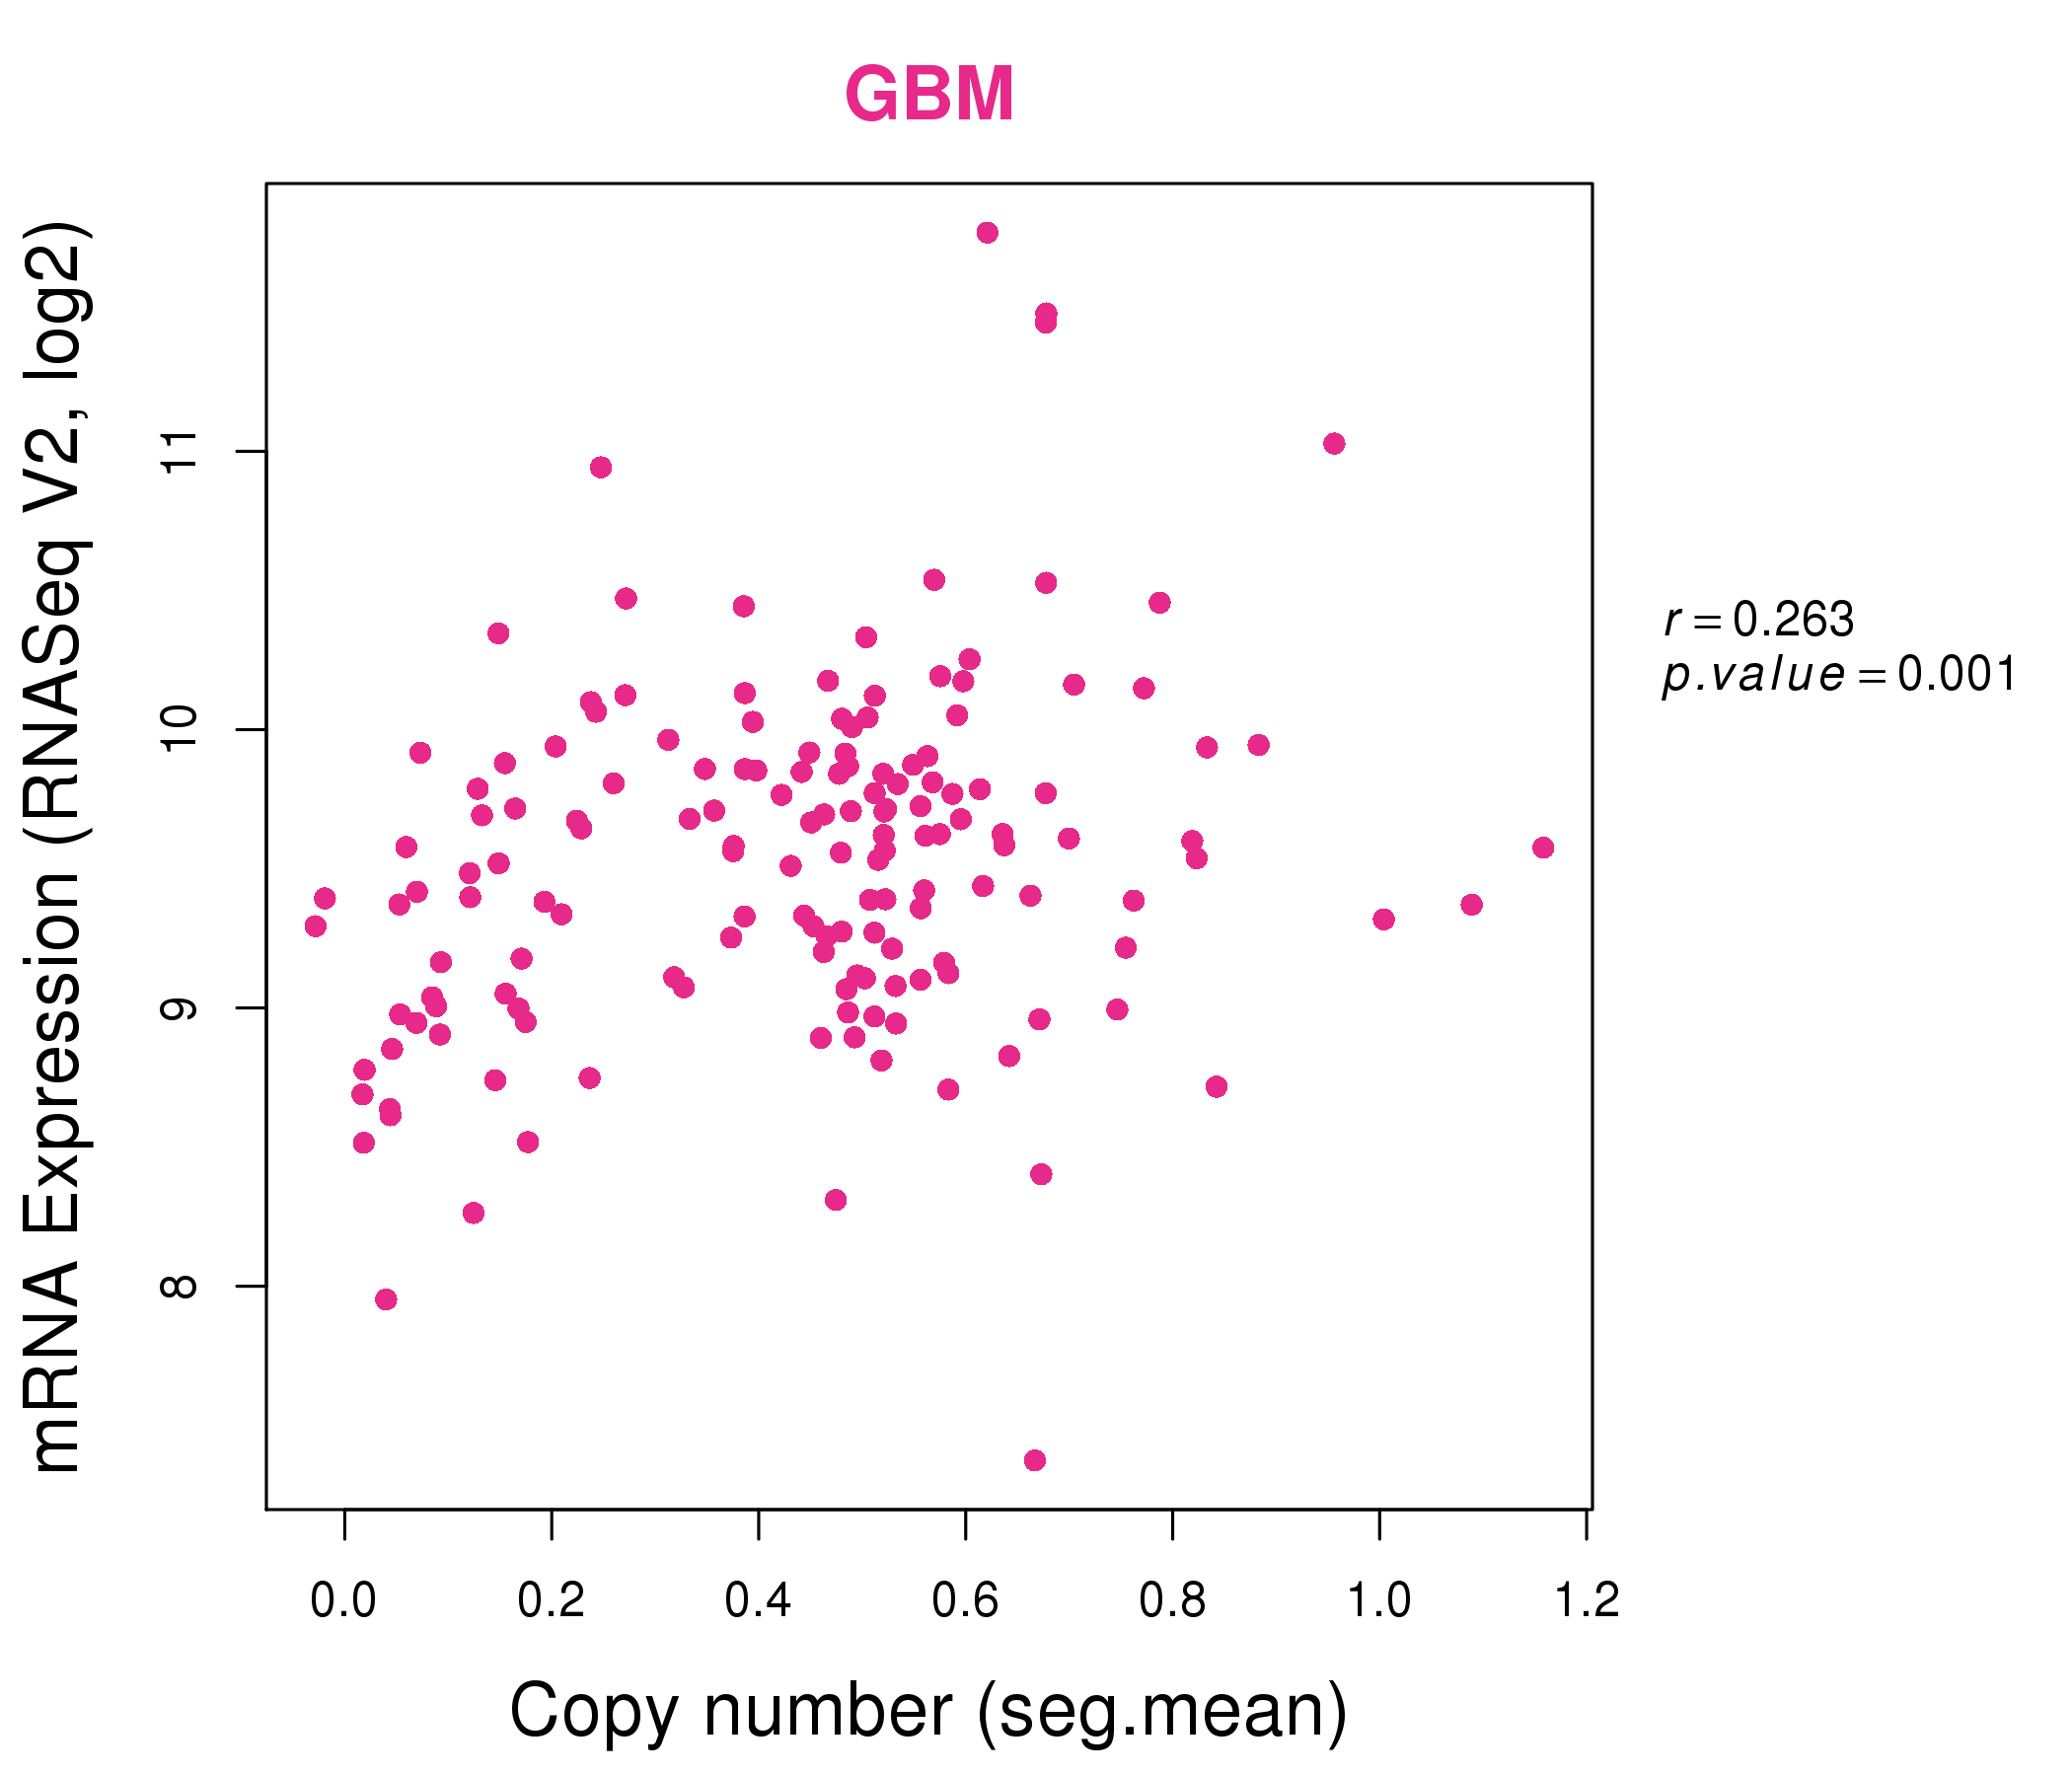
| * This plots show the correlation between CNV and gene expression. |
: Open all plots for all cancer types
 |
|
 |
|
| Top |
| Gene-Gene Network Information |
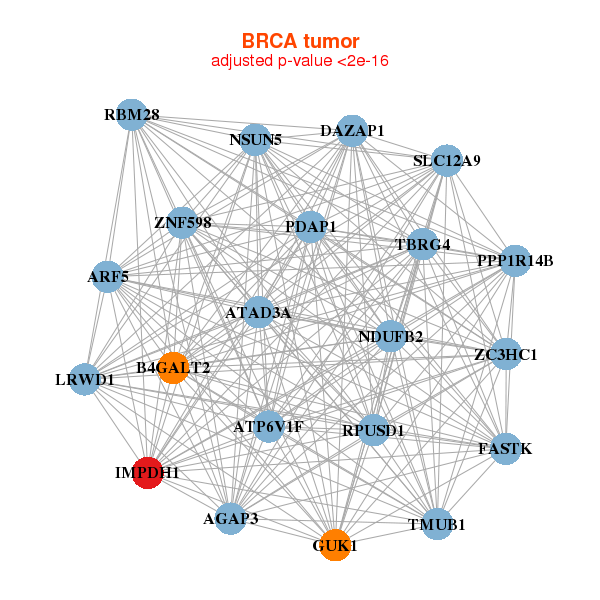
| * Co-Expression network figures were drawn using R package igraph. Only the top 20 genes with the highest correlations were shown. Red circle: input gene, orange circle: cell metabolism gene, sky circle: other gene |
: Open all plots for all cancer types
 |
| ||||
| AGAP3,ARF5,ATAD3A,ATP6V1F,B4GALT2,DAZAP1,FASTK, GUK1,IMPDH1,LRWD1,NDUFB2,NSUN5,PDAP1,PPP1R14B, RBM28,RPUSD1,SLC12A9,TBRG4,TMUB1,ZC3HC1,ZNF598 | AP1M1,BCAP31,TANGO2,CD81,DOK1,FURIN,GPX4, IMPDH1,INF2,LGALS1,LZTR1,MGAT1,NADK,PALM, PHLDA3,PLXND1,POR,PRR5,RNPEPL1,RRAS,TPD52L2 | ||||
 |
| ||||
| ABCF2,ADCK1,ANKRD13B,BRAT1,C7orf50,CPSF4,EIF3B, FTSJ2,HEATR2,HYAL3,IMPDH1,MGC72080,NSUN5,PDAP1, POLD2,PUS1,RBM28,RRP9,SAC3D1,SLC19A1,WBSCR16 | B3GNT9,CBX2,CD276,COPS7B,DUSP7,EPOR,HDAC7, IMPDH1,LEPRE1,AGAP2-AS1,MAP3K12,MAP3K6,NR2F1,NUP62, PHF19,SCN1B,SLC43A1,SLC43A3,SRPX2,TIMP1,UBFD1 |


| * Co-Expression network figures were drawn using R package igraph. Only the top 20 genes with the highest correlations were shown. Red circle: input gene, orange circle: cell metabolism gene, sky circle: other gene |
: Open all plots for all cancer types
| Top |
: Open all interacting genes' information including KEGG pathway for all interacting genes from DAVID
| Top |
| Pharmacological Information for IMPDH1 |
| DB Category | DB Name | DB's ID and Url link |
| * Gene Centered Interaction Network. |
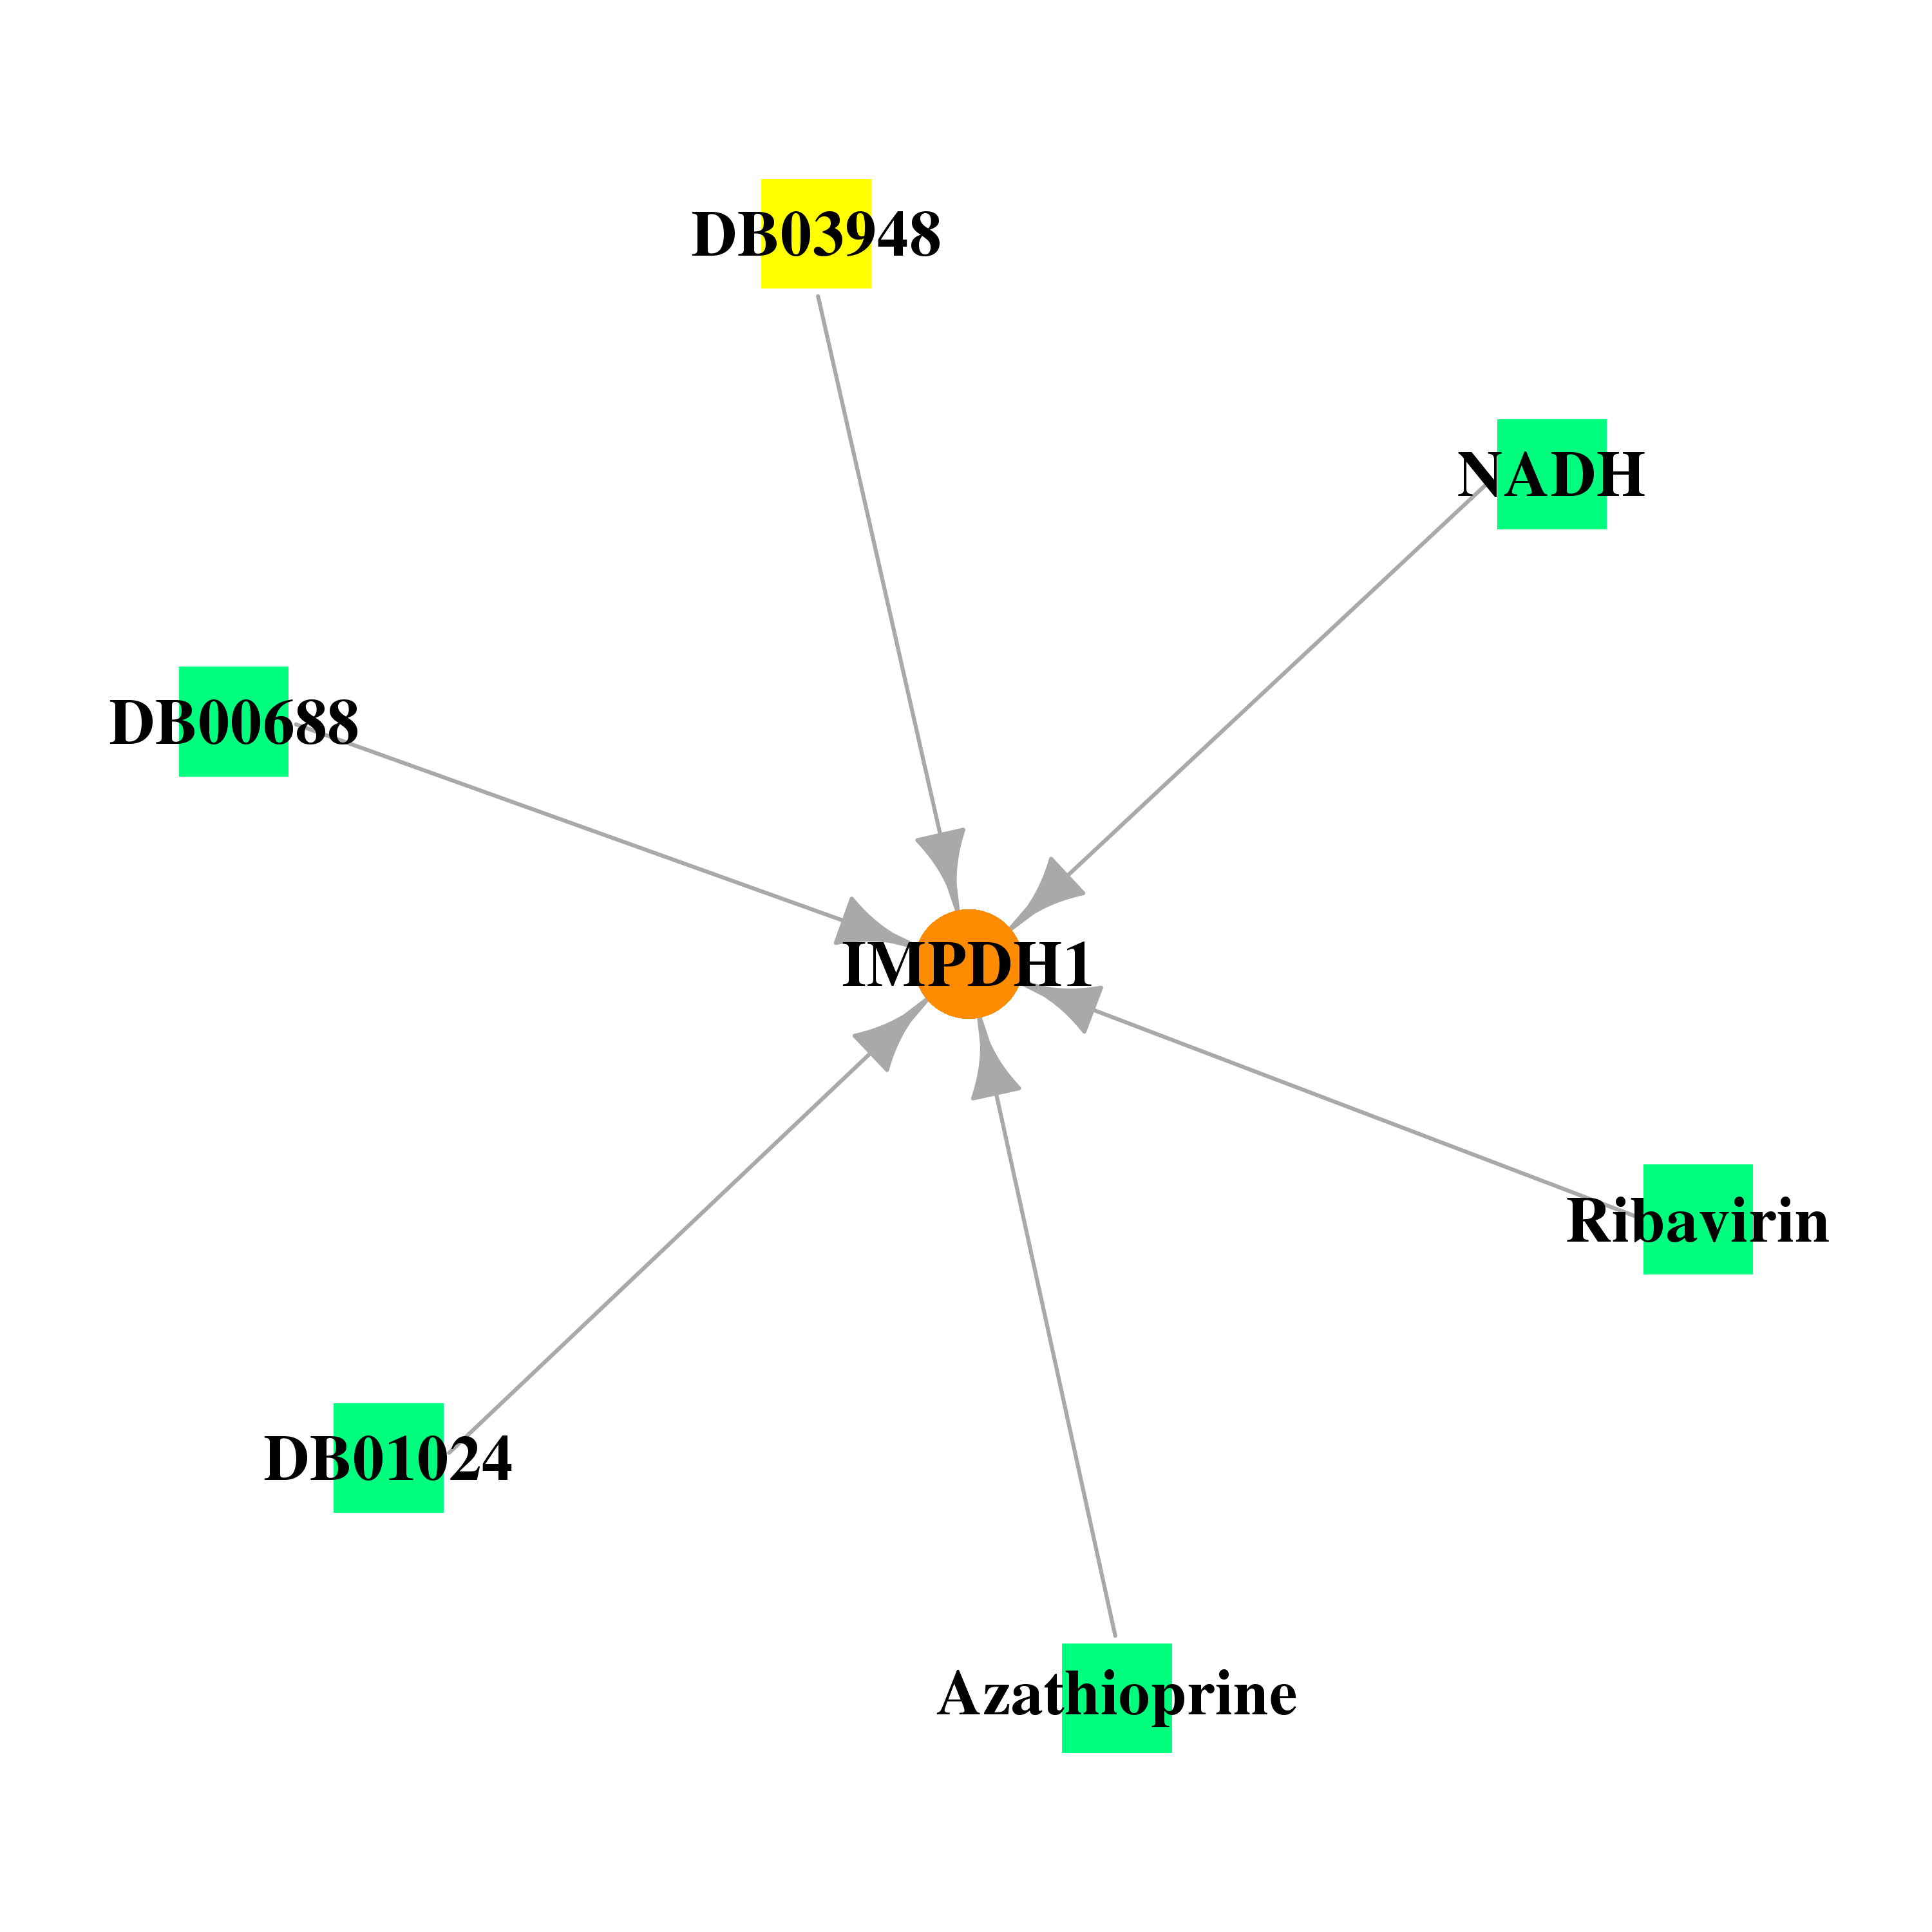 |
| * Drug Centered Interaction Network. |
| DrugBank ID | Target Name | Drug Groups | Generic Name | Drug Centered Network | Drug Structure |
| DB00157 | IMP (inosine 5'-monophosphate) dehydrogenase 1 | approved; nutraceutical | NADH |  |  |
| DB00688 | IMP (inosine 5'-monophosphate) dehydrogenase 1 | approved; investigational | Mycophenolate mofetil | 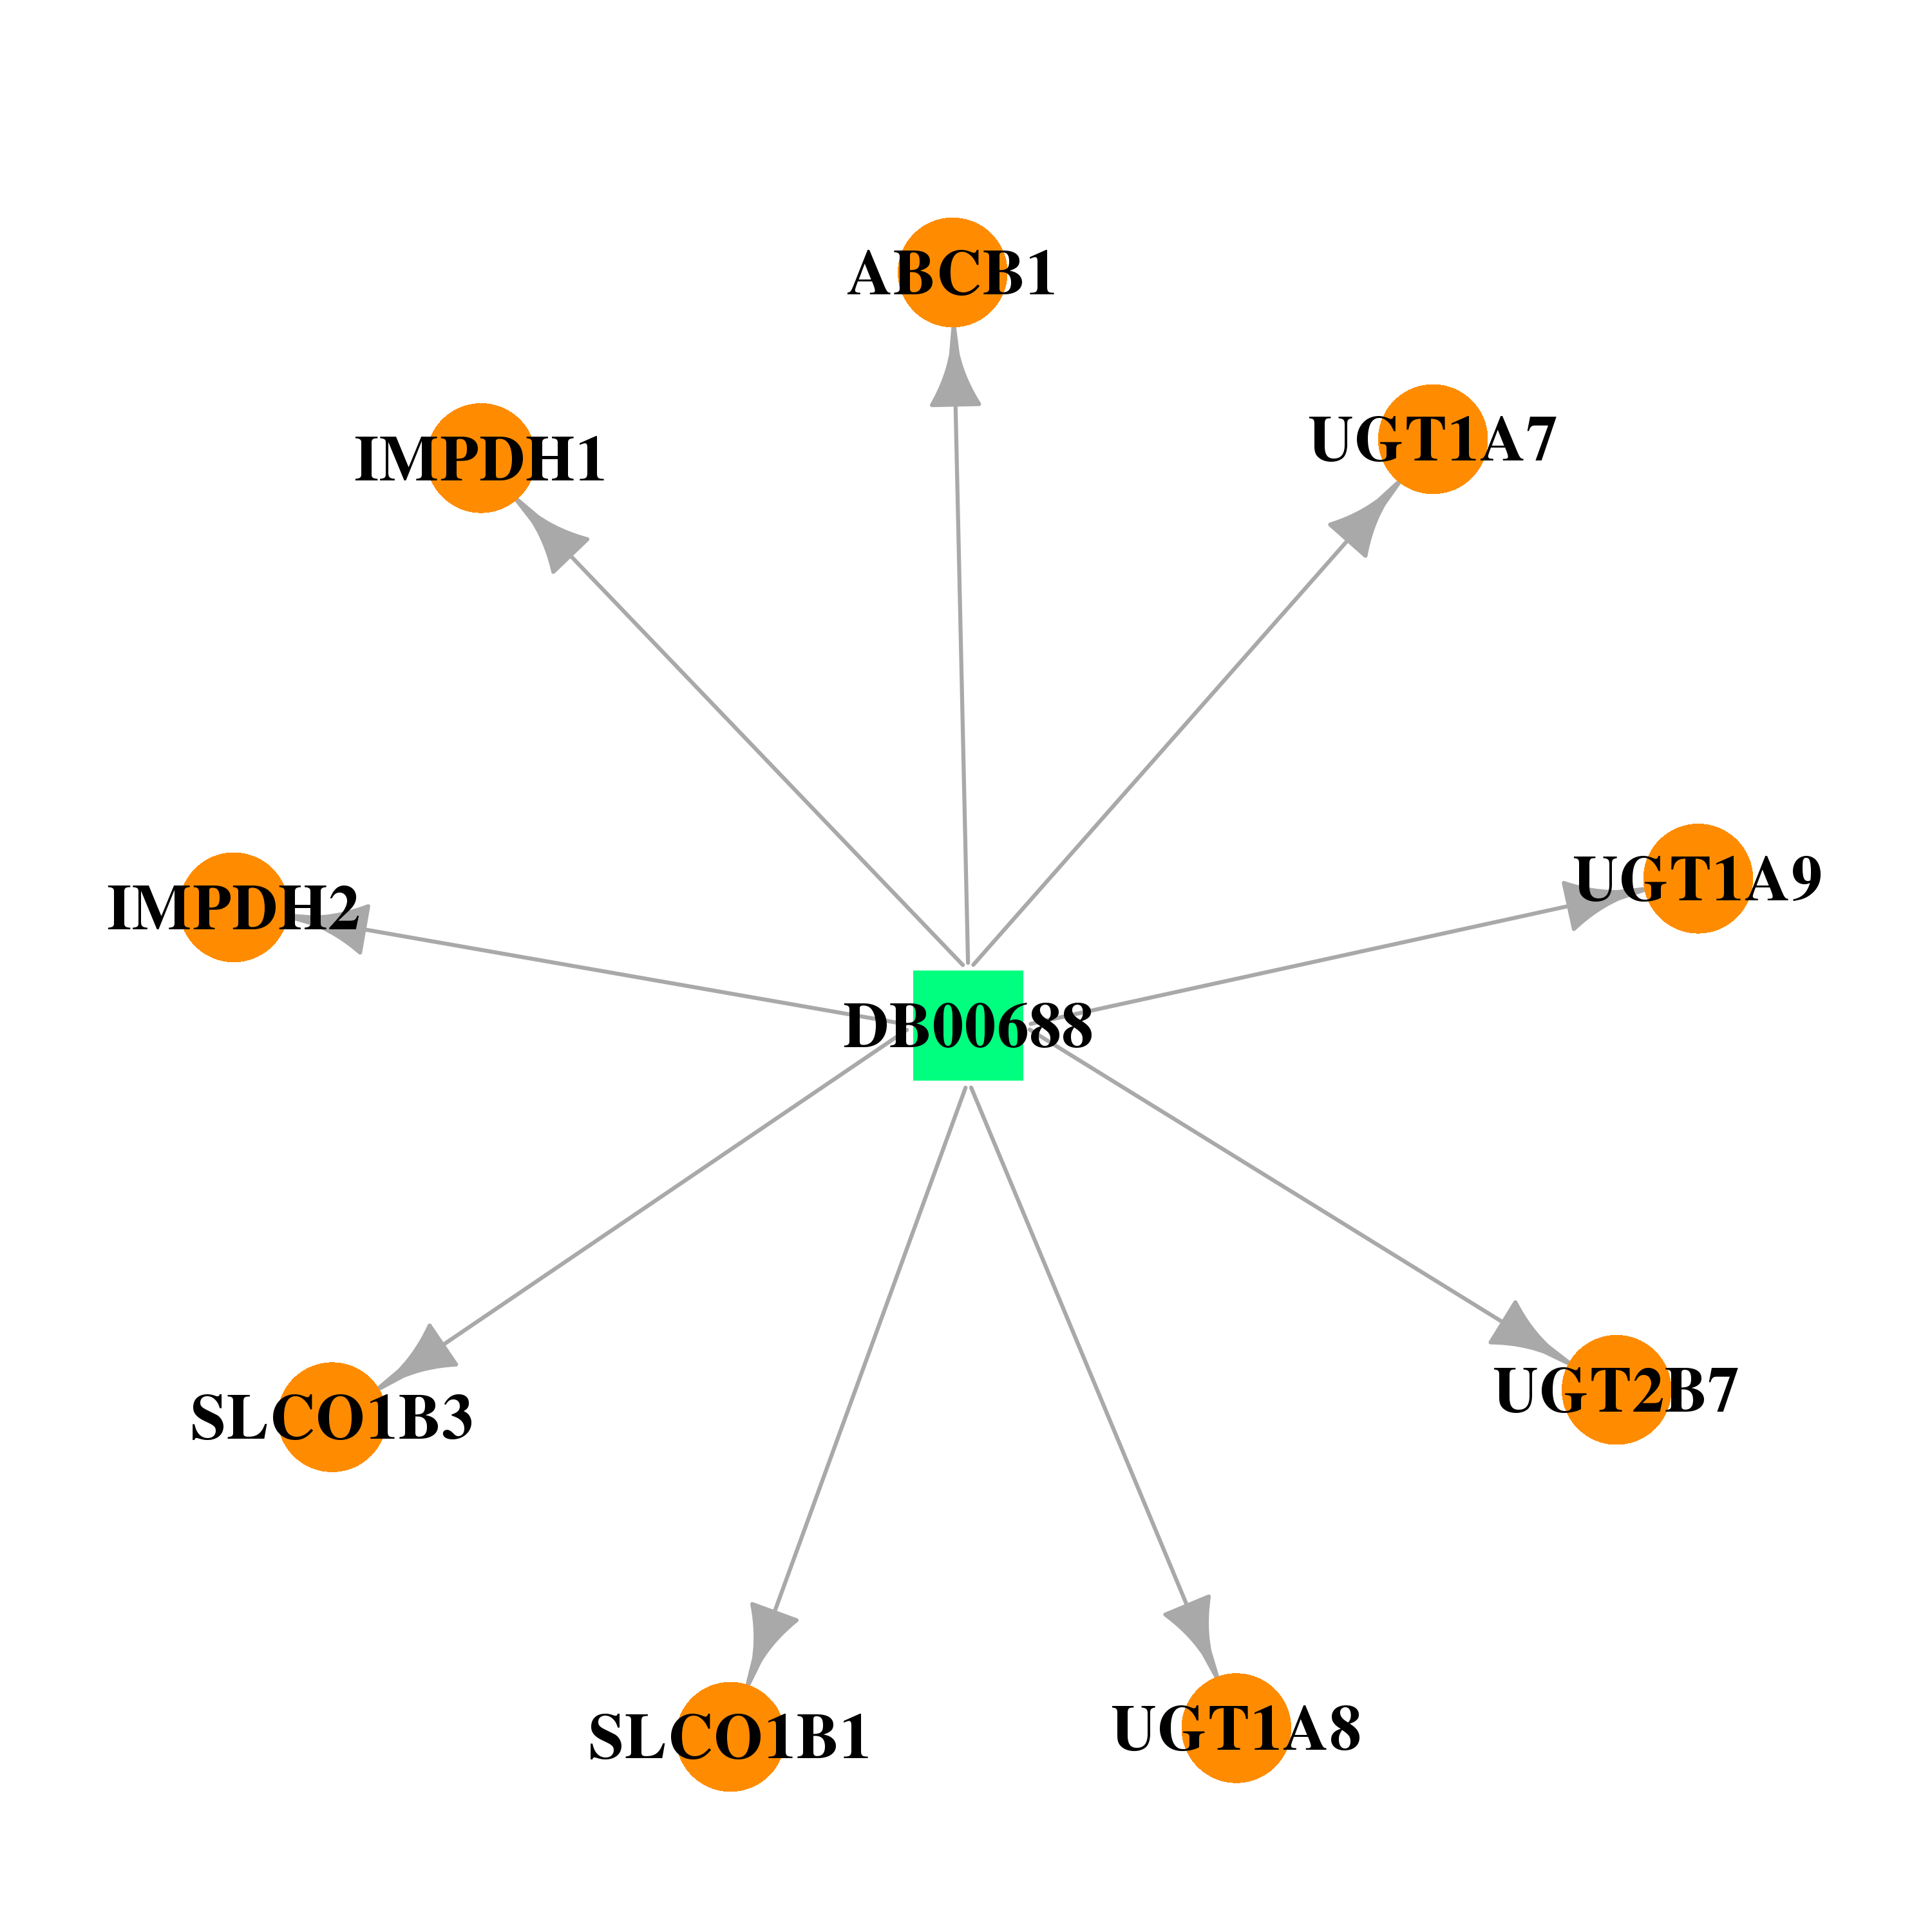 | 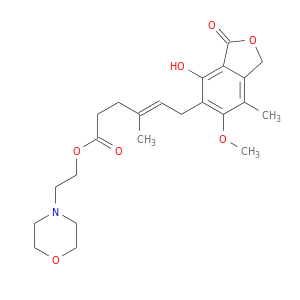 |
| DB00811 | IMP (inosine 5'-monophosphate) dehydrogenase 1 | approved | Ribavirin | 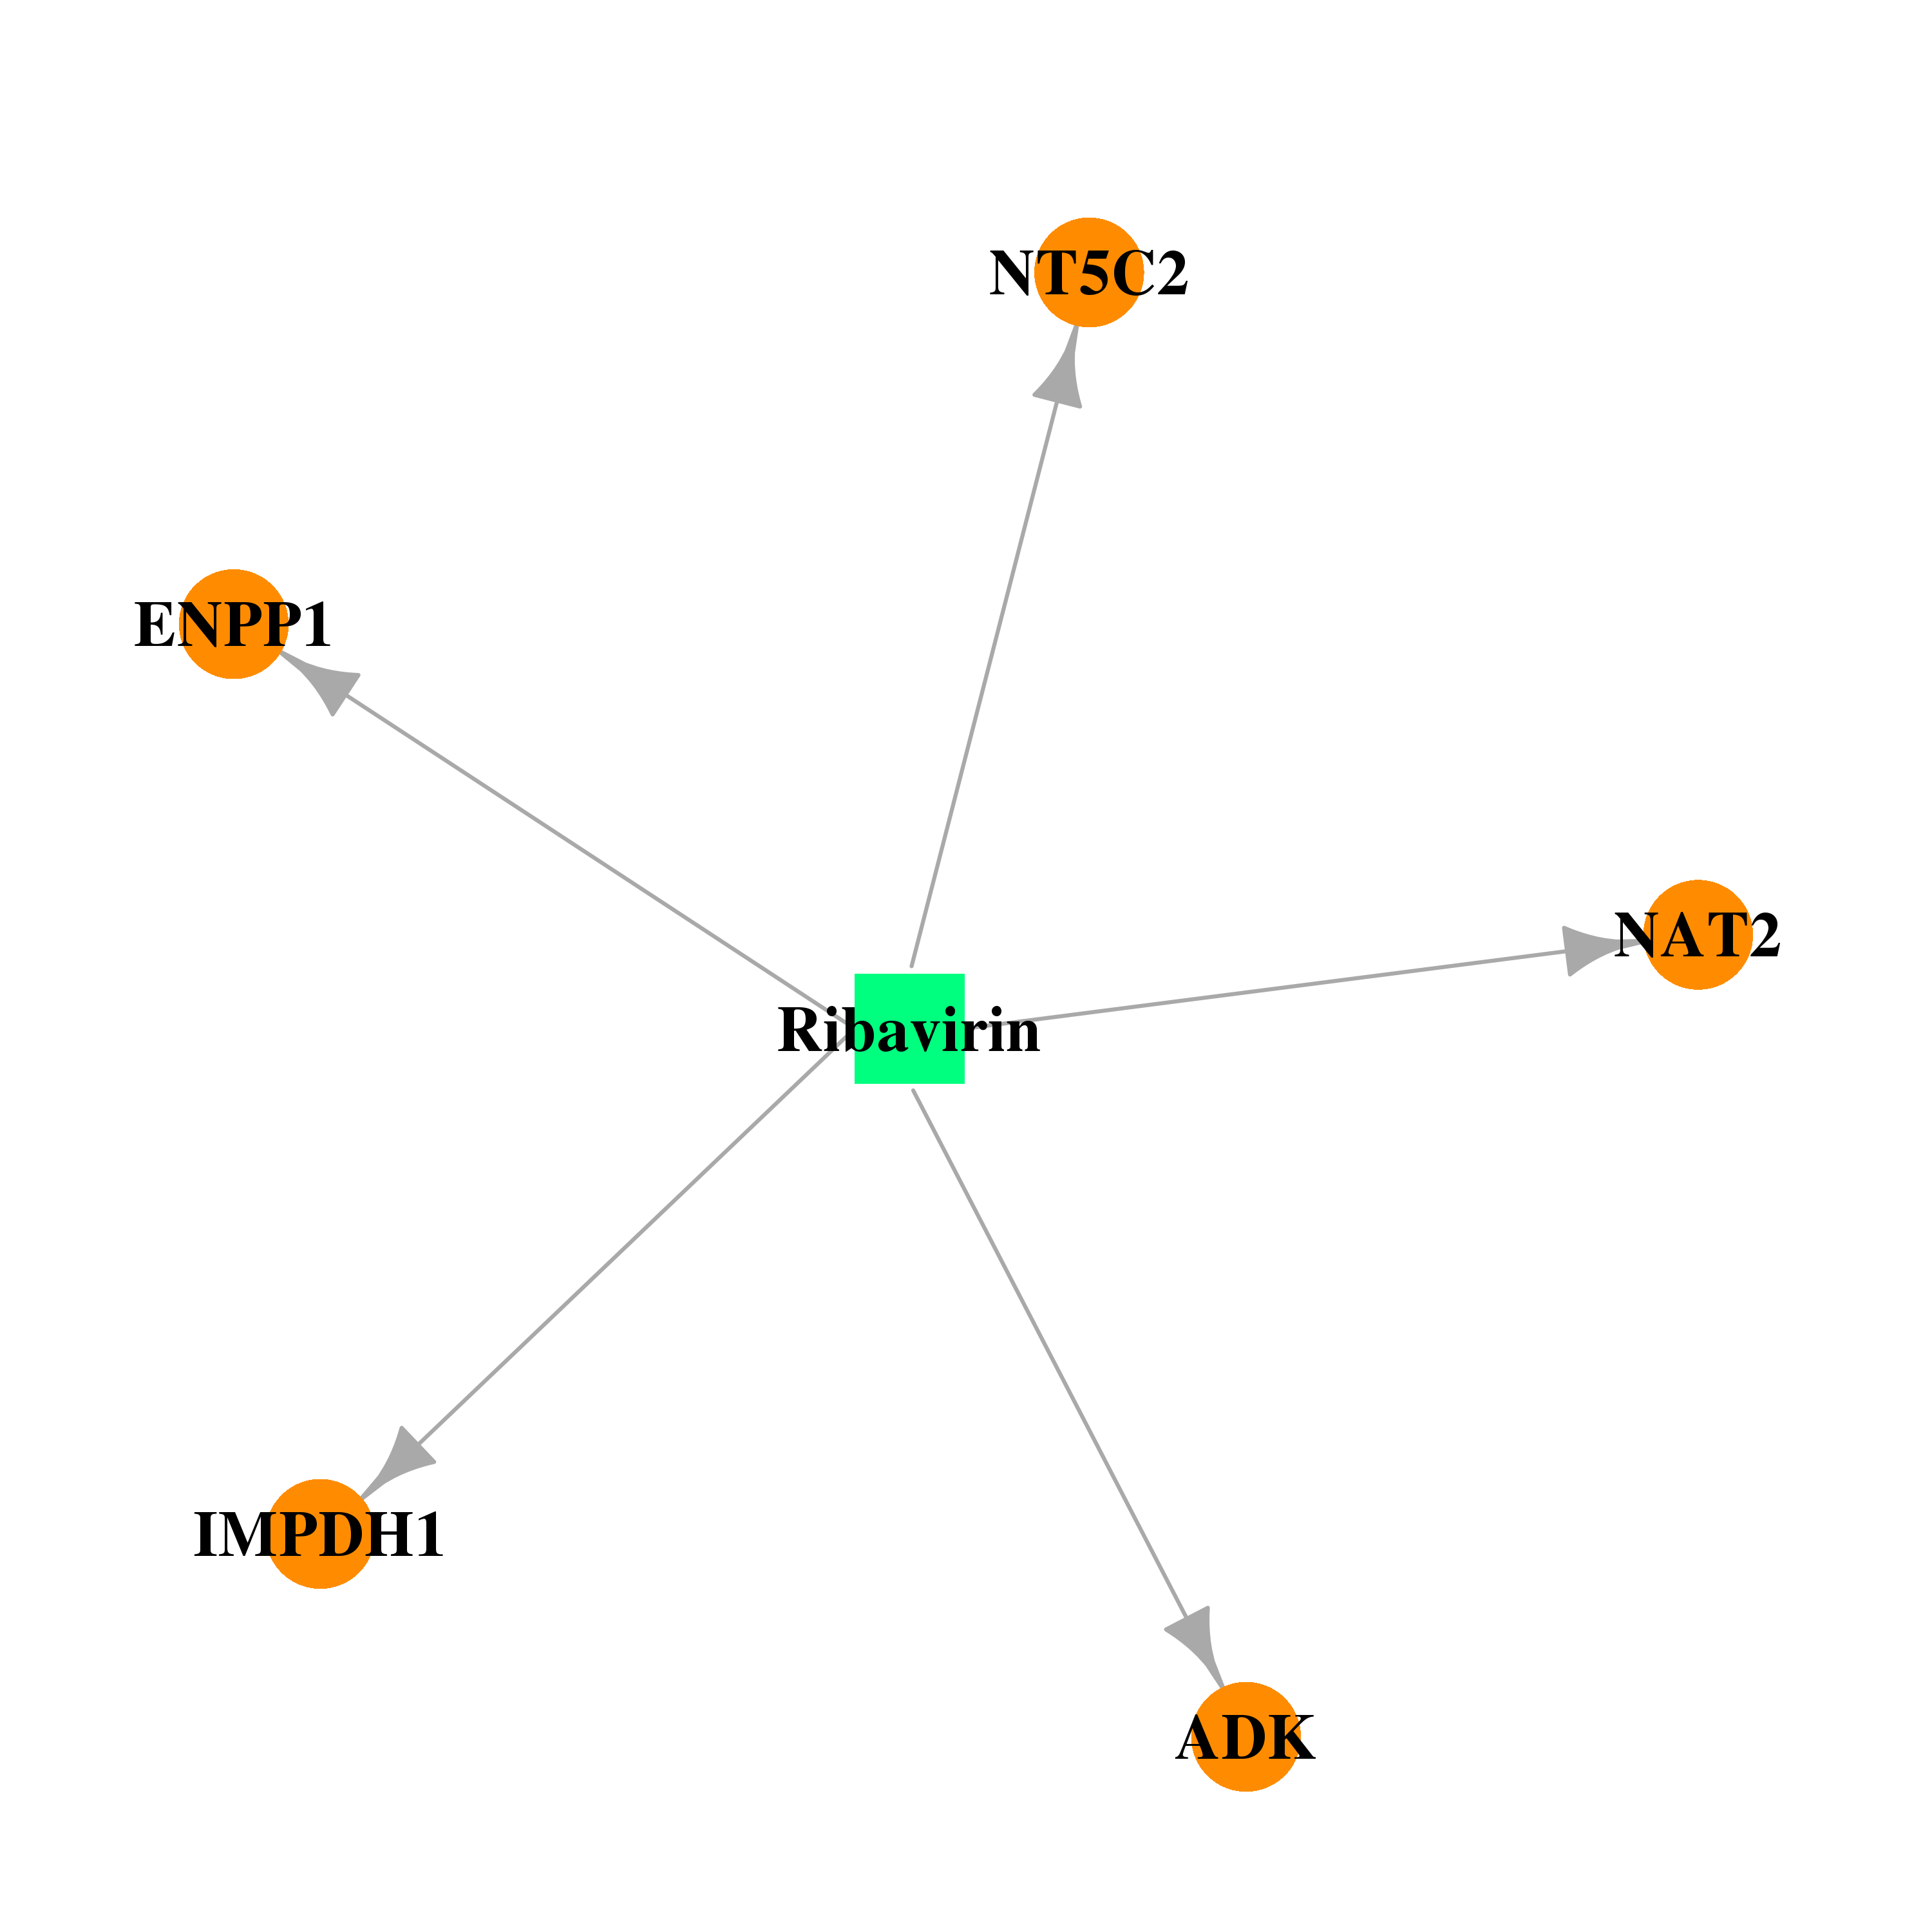 | 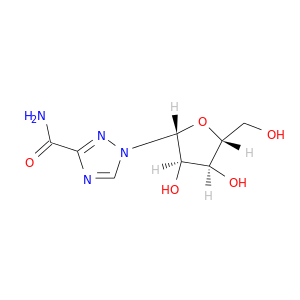 |
| DB01024 | IMP (inosine 5'-monophosphate) dehydrogenase 1 | approved | Mycophenolic acid |  |  |
| DB03948 | IMP (inosine 5'-monophosphate) dehydrogenase 1 | experimental | 6-Chloropurine Riboside, 5'-Monophosphate | 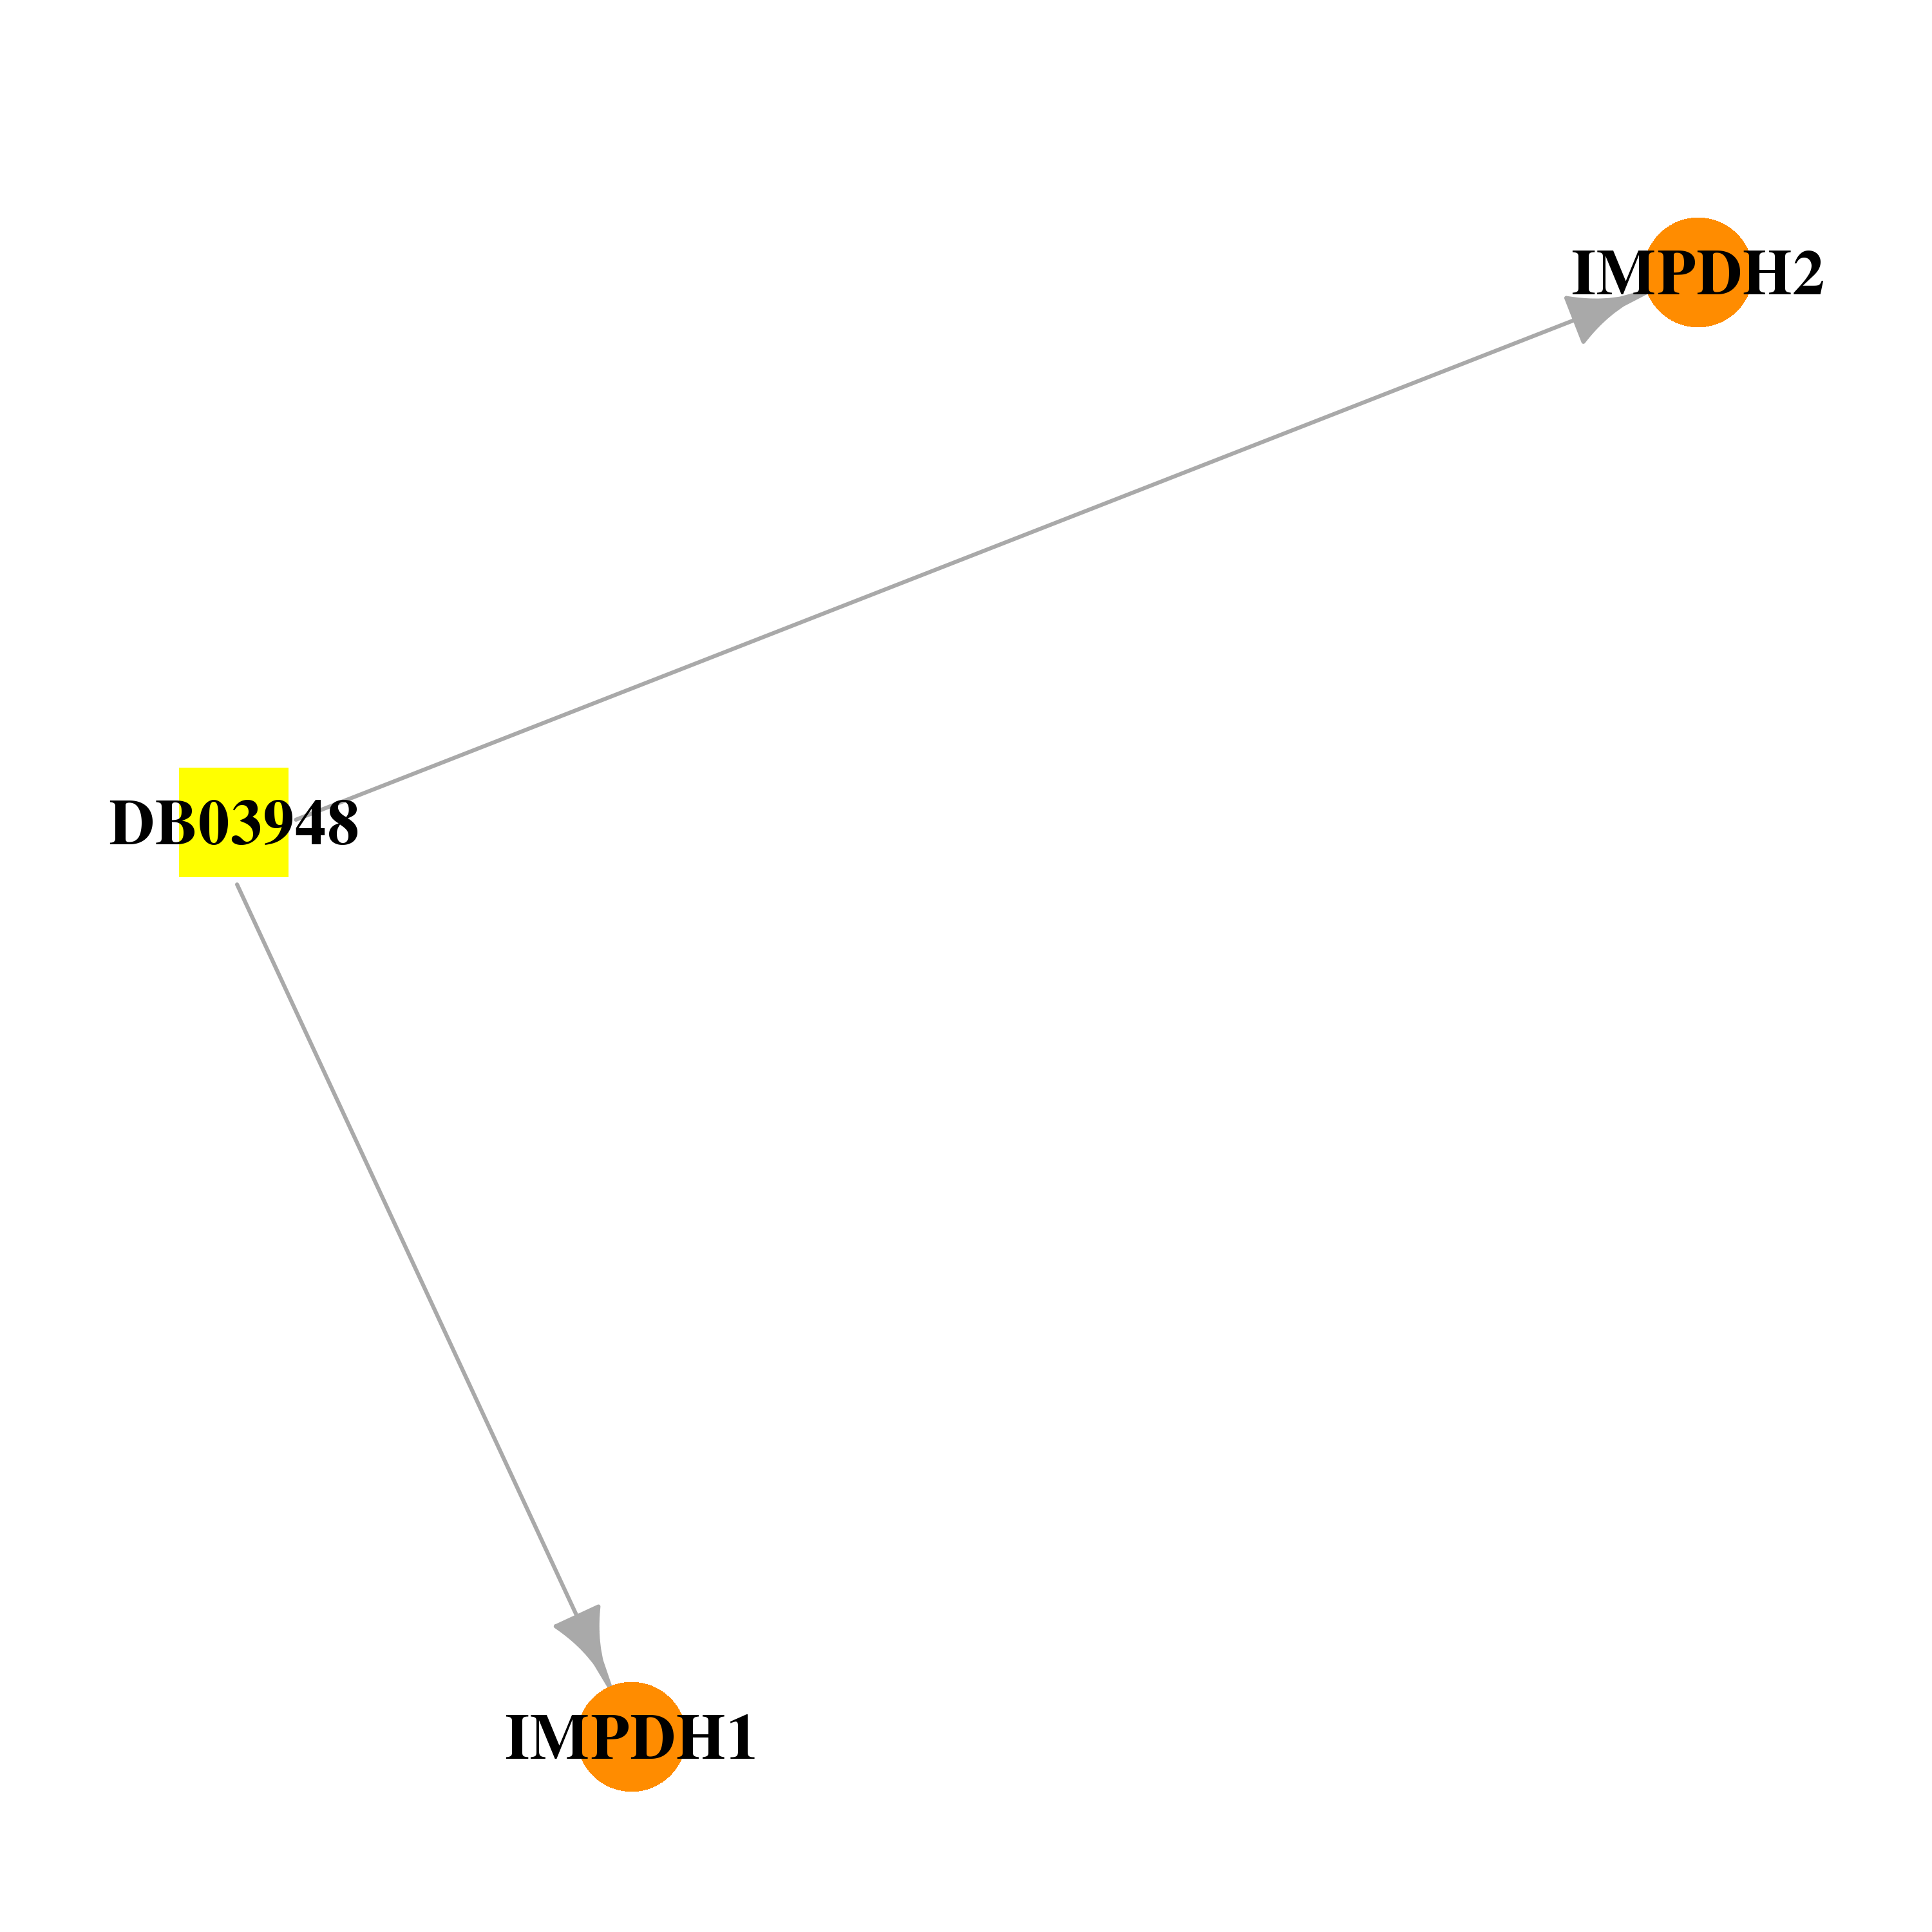 | 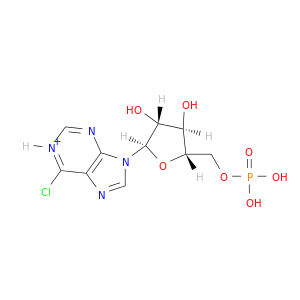 |
| DB00993 | IMP (inosine 5'-monophosphate) dehydrogenase 1 | approved | Azathioprine |  |  |
| Top |
| Cross referenced IDs for IMPDH1 |
| * We obtained these cross-references from Uniprot database. It covers 150 different DBs, 18 categories. http://www.uniprot.org/help/cross_references_section |
: Open all cross reference information
|
Copyright © 2016-Present - The Univsersity of Texas Health Science Center at Houston @ |