|
||||||||||||||||||||||||||||||||||||||||||||||||||||||||||||||||||||||||||||||||||||||||||||||||||||||||||||||||||||||||||||||||||||||||||||||||||||||||||||||||||||||||||||||||||||||||||||||||||||||||||||||||||||||||||||||||||||||||||||||||||||||||||||||||||||||||||||||||||||||||||||||||||||||||||||||||||||||||||
| |
| Phenotypic Information (metabolism pathway, cancer, disease, phenome) |
| |
| |
| Gene-Gene Network Information: Co-Expression Network, Interacting Genes & KEGG |
| |
|


| Gene Summary for INHBA |
| Basic gene info. | Gene symbol | INHBA |
| Gene name | inhibin, beta A | |
| Synonyms | EDF|FRP | |
| Cytomap | UCSC genome browser: 7p15-p13 | |
| Genomic location | chr7 :41728600-41742706 | |
| Type of gene | protein-coding | |
| RefGenes | NM_002192.2, | |
| Ensembl id | ENSG00000122641 | |
| Description | FSH-releasing proteinInhibin, beta-1activin beta-A chainerythroid differentiation factorerythroid differentiation proteinfollicle-stimulating hormone-releasing proteininhibin beta A chaininhibin, beta A (activin A, activin AB alpha polypeptide) | |
| Modification date | 20141222 | |
| dbXrefs | MIM : 147290 | |
| HGNC : HGNC | ||
| HPRD : 00929 | ||
| Protein | UniProt: P08476 go to UniProt's Cross Reference DB Table | |
| Expression | CleanEX: HS_INHBA | |
| BioGPS: 3624 | ||
| Gene Expression Atlas: ENSG00000122641 | ||
| The Human Protein Atlas: ENSG00000122641 | ||
| Pathway | NCI Pathway Interaction Database: INHBA | |
| KEGG: INHBA | ||
| REACTOME: INHBA | ||
| ConsensusPathDB | ||
| Pathway Commons: INHBA | ||
| Metabolism | MetaCyc: INHBA | |
| HUMANCyc: INHBA | ||
| Regulation | Ensembl's Regulation: ENSG00000122641 | |
| miRBase: chr7 :41,728,600-41,742,706 | ||
| TargetScan: NM_002192 | ||
| cisRED: ENSG00000122641 | ||
| Context | iHOP: INHBA | |
| cancer metabolism search in PubMed: INHBA | ||
| UCL Cancer Institute: INHBA | ||
| Assigned class in ccmGDB | B - This gene belongs to cancer gene. | |
| Top |
| Phenotypic Information for INHBA(metabolism pathway, cancer, disease, phenome) |
| Cancer | CGAP: INHBA |
| Familial Cancer Database: INHBA | |
| * This gene is included in those cancer gene databases. |
|
|
|
|
|
|
| ||||||||||||||||||||||||||||||||||||||||||||||||||||||||||||||||||||||||||||||||||||||||||||||||||||||||||||||||||||||||||||||||||||||||||||||||||||||||||||||||||||||||||||||||||||||||||||||||||||||||||||||||||||||||||||||||||||||||||||||||||||||||||||||||||||||||||||||||||||||||||||||||||||||||||||||||||||
Oncogene 1 | Significant driver gene in | |||||||||||||||||||||||||||||||||||||||||||||||||||||||||||||||||||||||||||||||||||||||||||||||||||||||||||||||||||||||||||||||||||||||||||||||||||||||||||||||||||||||||||||||||||||||||||||||||||||||||||||||||||||||||||||||||||||||||||||||||||||||||||||||||||||||||||||||||||||||||||||||||||||||||||||||||||||||||
| cf) number; DB name 1 Oncogene; http://nar.oxfordjournals.org/content/35/suppl_1/D721.long, 2 Tumor Suppressor gene; https://bioinfo.uth.edu/TSGene/, 3 Cancer Gene Census; http://www.nature.com/nrc/journal/v4/n3/abs/nrc1299.html, 4 CancerGenes; http://nar.oxfordjournals.org/content/35/suppl_1/D721.long, 5 Network of Cancer Gene; http://ncg.kcl.ac.uk/index.php, 1Therapeutic Vulnerabilities in Cancer; http://cbio.mskcc.org/cancergenomics/statius/ |
| REACTOME_METABOLISM_OF_AMINO_ACIDS_AND_DERIVATIVES | |
| OMIM | 147290; gene. |
| Orphanet | 213504; Adenocarcinoma of ovary. |
| Disease | KEGG Disease: INHBA |
| MedGen: INHBA (Human Medical Genetics with Condition) | |
| ClinVar: INHBA | |
| Phenotype | MGI: INHBA (International Mouse Phenotyping Consortium) |
| PhenomicDB: INHBA | |
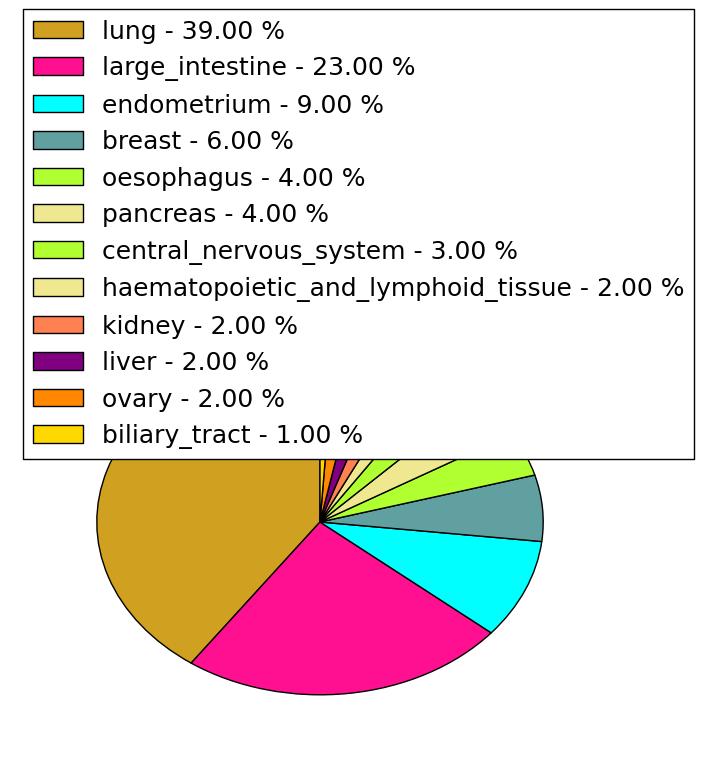
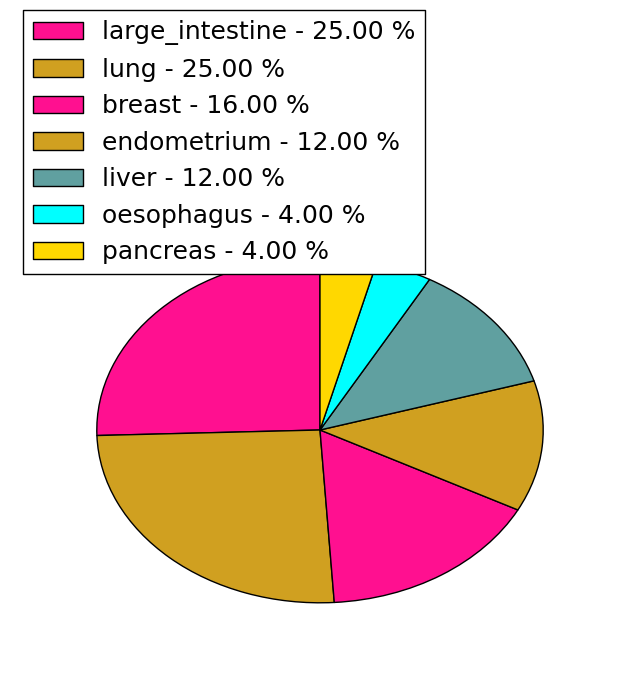
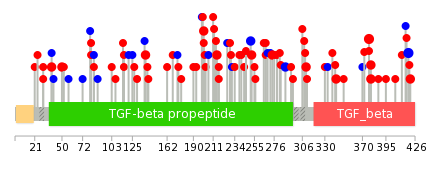
| Mutations for INHBA |
| * Under tables are showing count per each tissue to give us broad intuition about tissue specific mutation patterns.You can go to the detailed page for each mutation database's web site. |
| - Statistics for Tissue and Mutation type | Top |
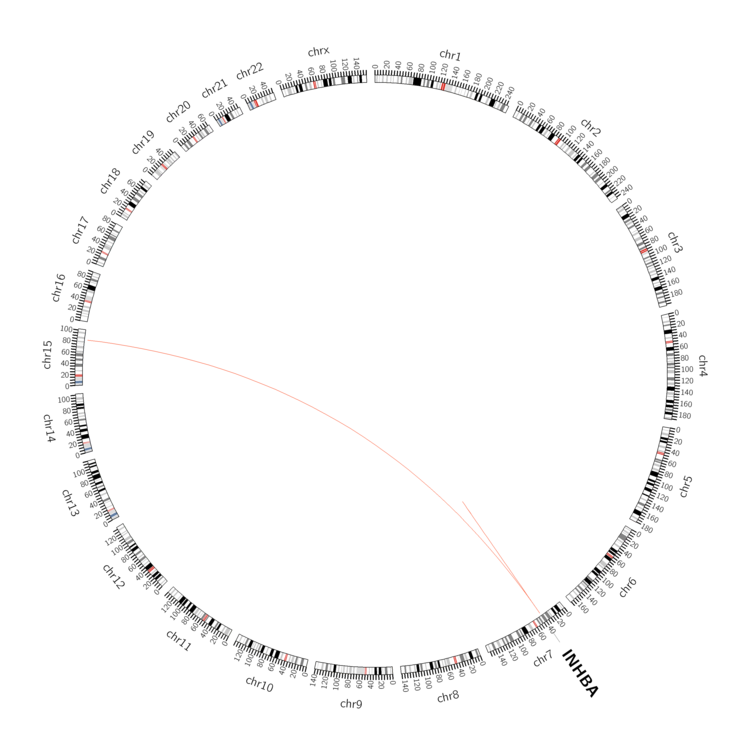 |
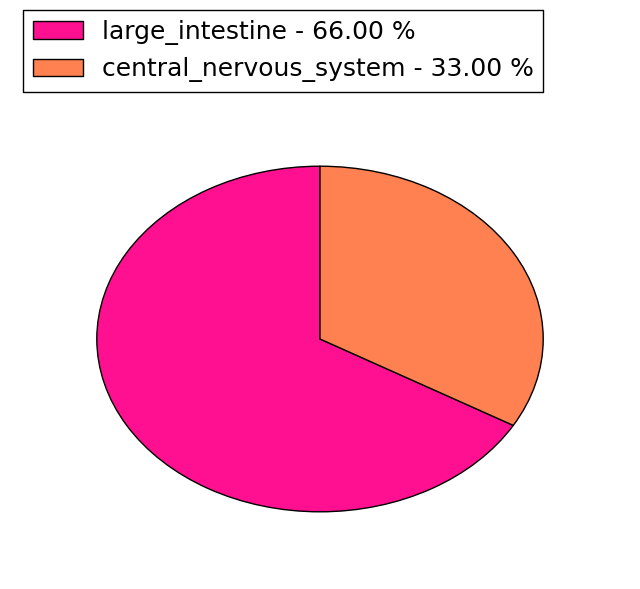
| - For Inter-chromosomal Variations |
| * Inter-chromosomal variantions includes 'interchromosomal amplicon to amplicon', 'interchromosomal amplicon to non-amplified dna', 'interchromosomal insertion', 'Interchromosomal unknown type'. |
 |
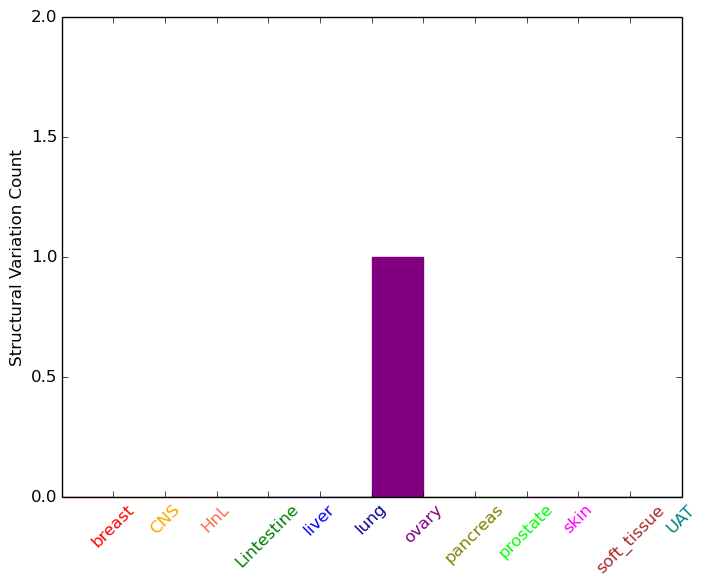
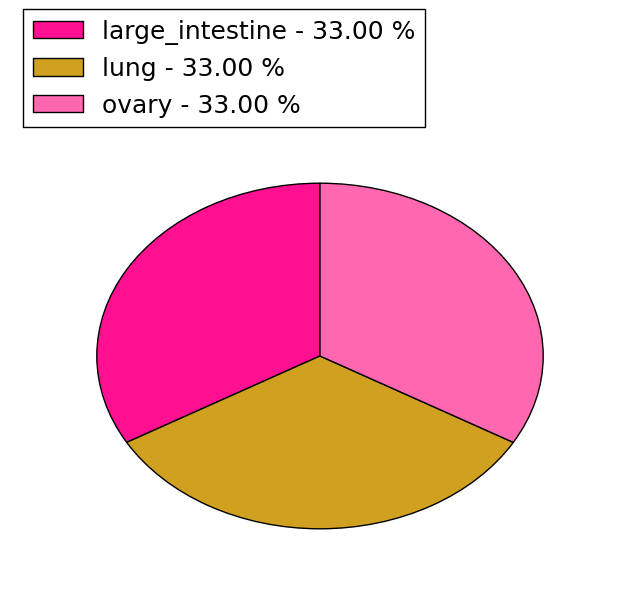
| - For Intra-chromosomal Variations |
| * Intra-chromosomal variantions includes 'intrachromosomal amplicon to amplicon', 'intrachromosomal amplicon to non-amplified dna', 'intrachromosomal deletion', 'intrachromosomal fold-back inversion', 'intrachromosomal inversion', 'intrachromosomal tandem duplication', 'Intrachromosomal unknown type', 'intrachromosomal with inverted orientation', 'intrachromosomal with non-inverted orientation'. |
 |
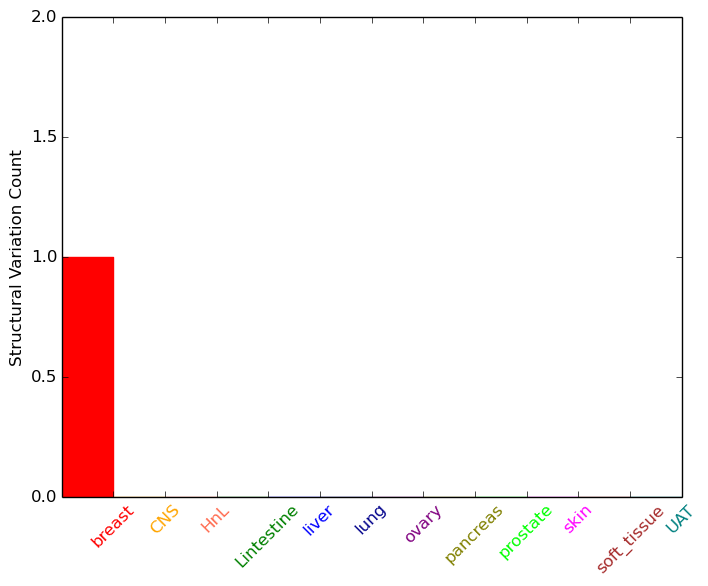
| Sample | Symbol_a | Chr_a | Start_a | End_a | Symbol_b | Chr_b | Start_b | End_b |
| breast | INHBA | chr7 | 41735899 | 41735899 | chr15 | 84072371 | 84072371 | |
| ovary | INHBA | chr7 | 41740856 | 41740876 | INHBA | chr7 | 41736244 | 41736264 |
| cf) Tissue number; Tissue name (1;Breast, 2;Central_nervous_system, 3;Haematopoietic_and_lymphoid_tissue, 4;Large_intestine, 5;Liver, 6;Lung, 7;Ovary, 8;Pancreas, 9;Prostate, 10;Skin, 11;Soft_tissue, 12;Upper_aerodigestive_tract) |
| * From mRNA Sanger sequences, Chitars2.0 arranged chimeric transcripts. This table shows INHBA related fusion information. |
| ID | Head Gene | Tail Gene | Accession | Gene_a | qStart_a | qEnd_a | Chromosome_a | tStart_a | tEnd_a | Gene_a | qStart_a | qEnd_a | Chromosome_a | tStart_a | tEnd_a |
| Top |
| Mutation type/ Tissue ID | brca | cns | cerv | endome | haematopo | kidn | Lintest | liver | lung | ns | ovary | pancre | prost | skin | stoma | thyro | urina | |||
| Total # sample | 1 | |||||||||||||||||||
| GAIN (# sample) | 1 | |||||||||||||||||||
| LOSS (# sample) |
| cf) Tissue ID; Tissue type (1; Breast, 2; Central_nervous_system, 3; Cervix, 4; Endometrium, 5; Haematopoietic_and_lymphoid_tissue, 6; Kidney, 7; Large_intestine, 8; Liver, 9; Lung, 10; NS, 11; Ovary, 12; Pancreas, 13; Prostate, 14; Skin, 15; Stomach, 16; Thyroid, 17; Urinary_tract) |
| Top |
|
 |
| Top |
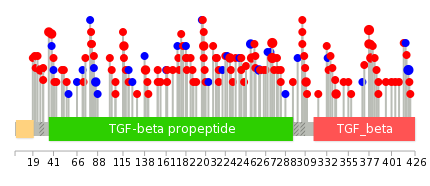
| Stat. for Non-Synonymous SNVs (# total SNVs=96) | (# total SNVs=24) |
 |  |
(# total SNVs=3) | (# total SNVs=3) |
 |  |
| Top |
| * When you move the cursor on each content, you can see more deailed mutation information on the Tooltip. Those are primary_site,primary_histology,mutation(aa),pubmedID. |
| GRCh37 position | Mutation(aa) | Unique sampleID count |
| chr7:41729399-41729399 | p.R377H | 3 |
| chr7:41729272-41729272 | p.I419I | 3 |
| chr7:41739626-41739626 | p.L116P | 3 |
| chr7:41729708-41729708 | p.G274V | 3 |
| chr7:41729709-41729709 | p.G274R | 3 |
| chr7:41730112-41730112 | p.E139D | 2 |
| chr7:41729843-41729843 | p.R229Q | 2 |
| chr7:41729400-41729400 | p.R377C | 2 |
| chr7:41739857-41739857 | p.A39V | 2 |
| chr7:41729775-41729775 | p.A252T | 2 |
| Top |
|
 |
| Point Mutation/ Tissue ID | 1 | 2 | 3 | 4 | 5 | 6 | 7 | 8 | 9 | 10 | 11 | 12 | 13 | 14 | 15 | 16 | 17 | 18 | 19 | 20 |
| # sample | 2 | 5 | 22 | 3 | 1 | 2 | 26 | 6 | 2 | 2 | 19 | 12 | 2 | 8 | ||||||
| # mutation | 2 | 5 | 20 | 3 | 1 | 2 | 26 | 6 | 2 | 2 | 22 | 11 | 2 | 9 | ||||||
| nonsynonymous SNV | 2 | 16 | 2 | 1 | 2 | 21 | 5 | 2 | 2 | 17 | 9 | 2 | 7 | |||||||
| synonymous SNV | 2 | 3 | 4 | 1 | 5 | 1 | 5 | 2 | 2 |
| cf) Tissue ID; Tissue type (1; BLCA[Bladder Urothelial Carcinoma], 2; BRCA[Breast invasive carcinoma], 3; CESC[Cervical squamous cell carcinoma and endocervical adenocarcinoma], 4; COAD[Colon adenocarcinoma], 5; GBM[Glioblastoma multiforme], 6; Glioma Low Grade, 7; HNSC[Head and Neck squamous cell carcinoma], 8; KICH[Kidney Chromophobe], 9; KIRC[Kidney renal clear cell carcinoma], 10; KIRP[Kidney renal papillary cell carcinoma], 11; LAML[Acute Myeloid Leukemia], 12; LUAD[Lung adenocarcinoma], 13; LUSC[Lung squamous cell carcinoma], 14; OV[Ovarian serous cystadenocarcinoma ], 15; PAAD[Pancreatic adenocarcinoma], 16; PRAD[Prostate adenocarcinoma], 17; SKCM[Skin Cutaneous Melanoma], 18:STAD[Stomach adenocarcinoma], 19:THCA[Thyroid carcinoma], 20:UCEC[Uterine Corpus Endometrial Carcinoma]) |
| Top |
| * We represented just top 10 SNVs. When you move the cursor on each content, you can see more deailed mutation information on the Tooltip. Those are primary_site, primary_histology, mutation(aa), pubmedID. |
| Genomic Position | Mutation(aa) | Unique sampleID count |
| chr7:41729272 | p.I419I | 3 |
| chr7:41729399 | p.R377H | 3 |
| chr7:41739626 | p.E421K | 2 |
| chr7:41729504 | p.P342L | 2 |
| chr7:41739824 | p.G274V | 2 |
| chr7:41729665 | p.T217I | 2 |
| chr7:41729928 | p.K215E | 2 |
| chr7:41739857 | p.A81E | 2 |
| chr7:41730112 | p.R310W | 2 |
| chr7:41729393 | p.A252T | 2 |
| * Copy number data were extracted from TCGA using R package TCGA-Assembler. The URLs of all public data files on TCGA DCC data server were gathered on Jan-05-2015. Function ProcessCNAData in TCGA-Assembler package was used to obtain gene-level copy number value which is calculated as the average copy number of the genomic region of a gene. |
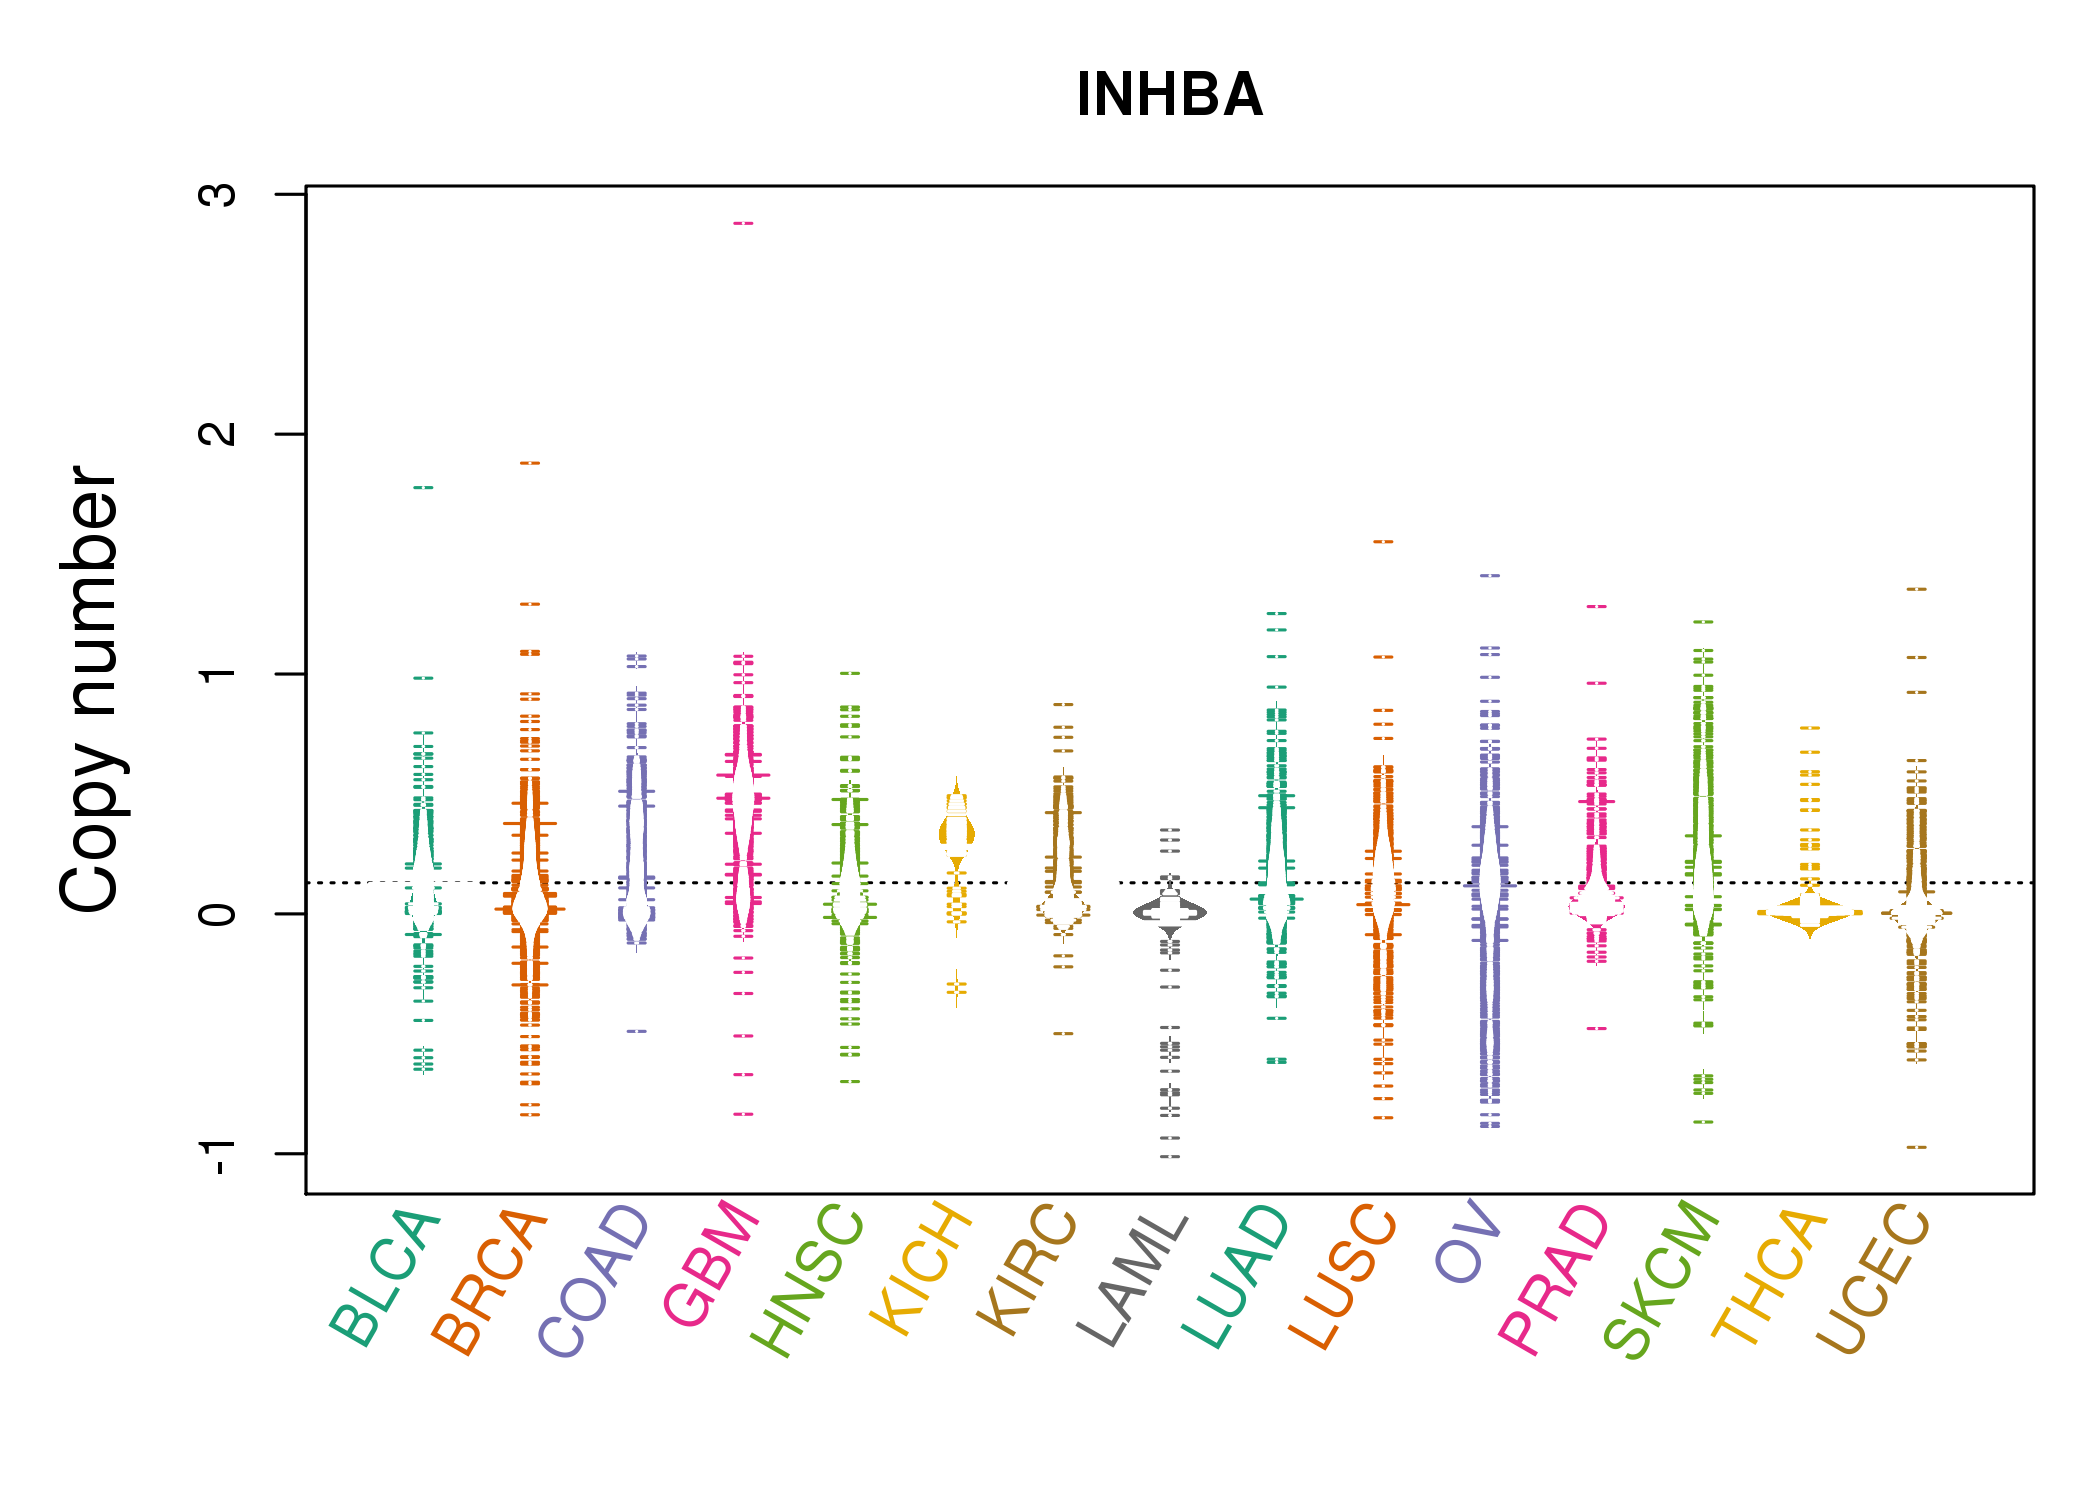 |
| cf) Tissue ID[Tissue type]: BLCA[Bladder Urothelial Carcinoma], BRCA[Breast invasive carcinoma], CESC[Cervical squamous cell carcinoma and endocervical adenocarcinoma], COAD[Colon adenocarcinoma], GBM[Glioblastoma multiforme], Glioma Low Grade, HNSC[Head and Neck squamous cell carcinoma], KICH[Kidney Chromophobe], KIRC[Kidney renal clear cell carcinoma], KIRP[Kidney renal papillary cell carcinoma], LAML[Acute Myeloid Leukemia], LUAD[Lung adenocarcinoma], LUSC[Lung squamous cell carcinoma], OV[Ovarian serous cystadenocarcinoma ], PAAD[Pancreatic adenocarcinoma], PRAD[Prostate adenocarcinoma], SKCM[Skin Cutaneous Melanoma], STAD[Stomach adenocarcinoma], THCA[Thyroid carcinoma], UCEC[Uterine Corpus Endometrial Carcinoma] |
| Top |
| Gene Expression for INHBA |
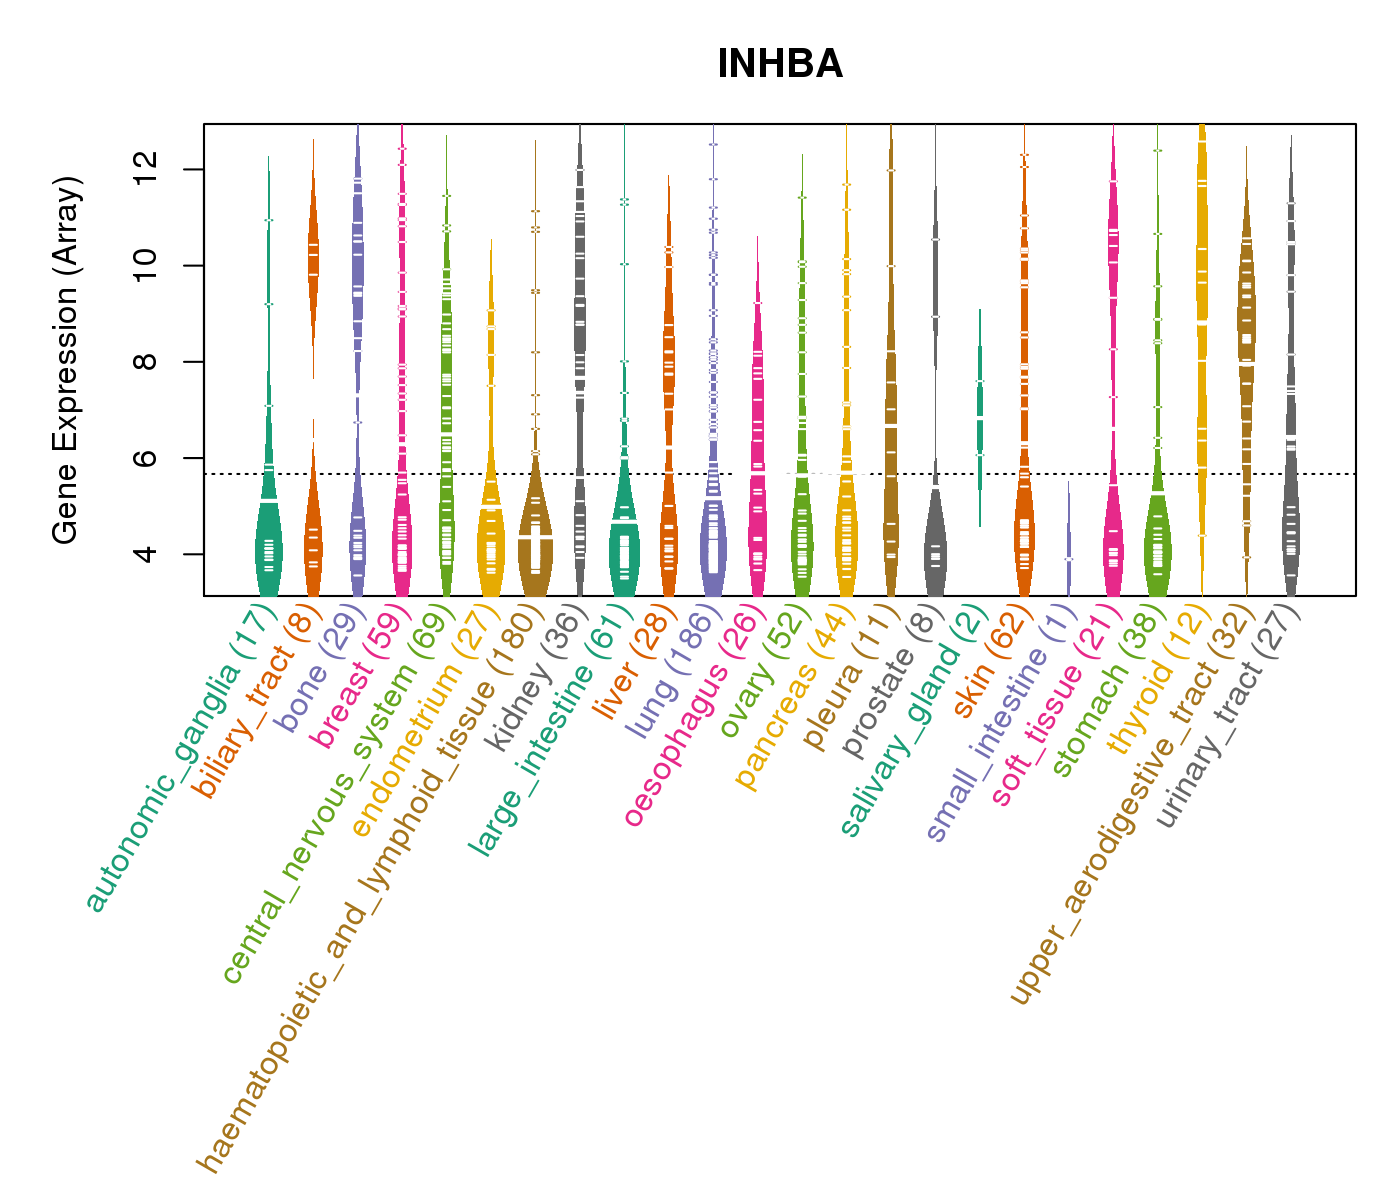
| * CCLE gene expression data were extracted from CCLE_Expression_Entrez_2012-10-18.res: Gene-centric RMA-normalized mRNA expression data. |
 |
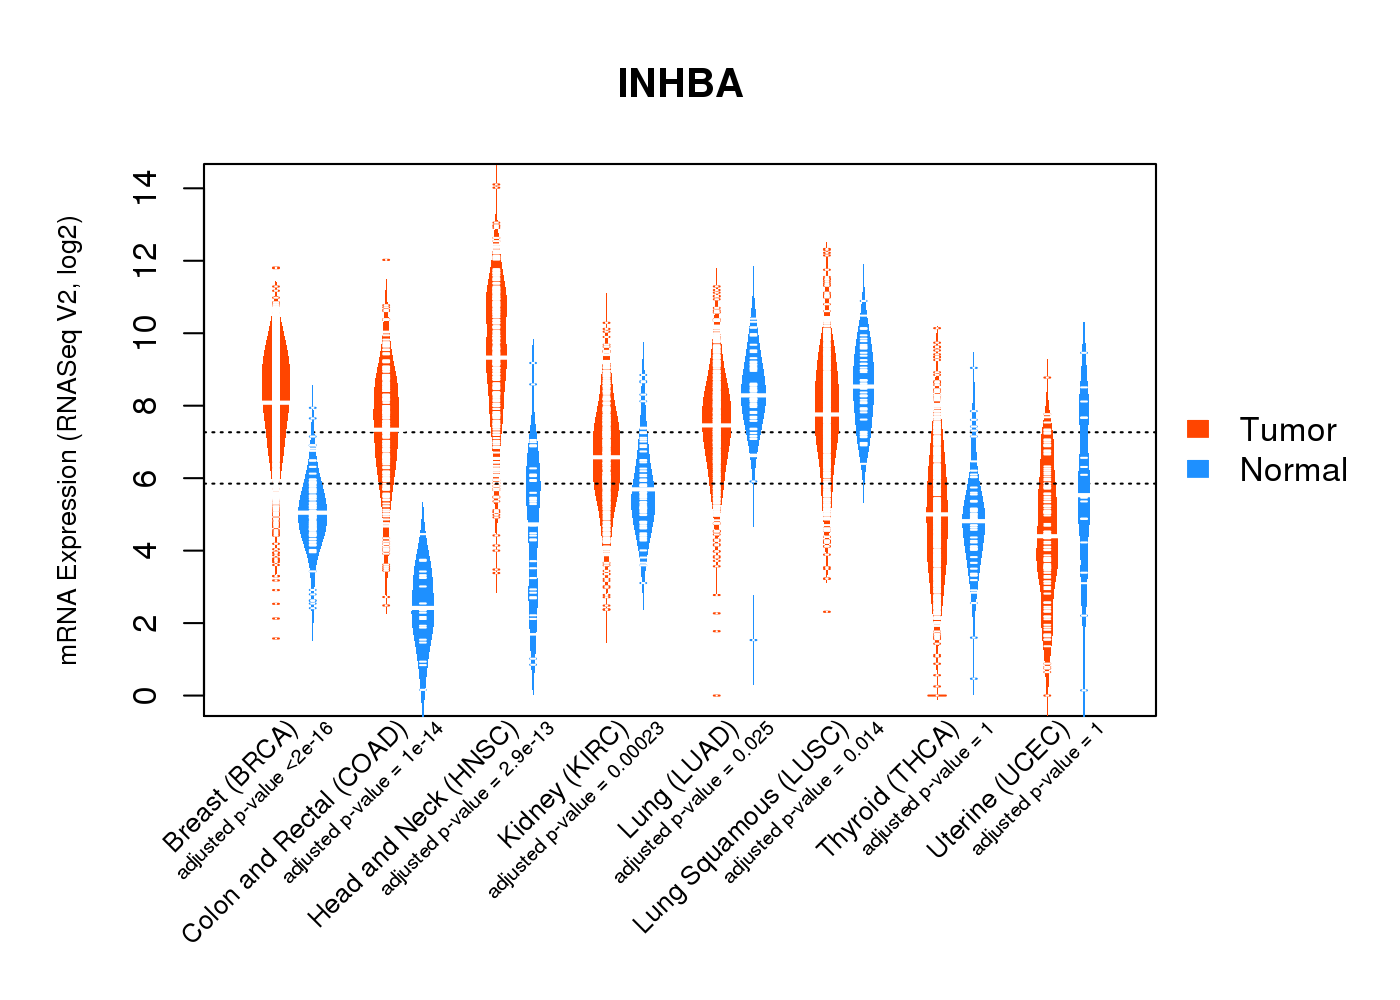
| * Normalized gene expression data of RNASeqV2 was extracted from TCGA using R package TCGA-Assembler. The URLs of all public data files on TCGA DCC data server were gathered at Jan-05-2015. Only eight cancer types have enough normal control samples for differential expression analysis. (t test, adjusted p<0.05 (using Benjamini-Hochberg FDR)) |
 |
| Top |
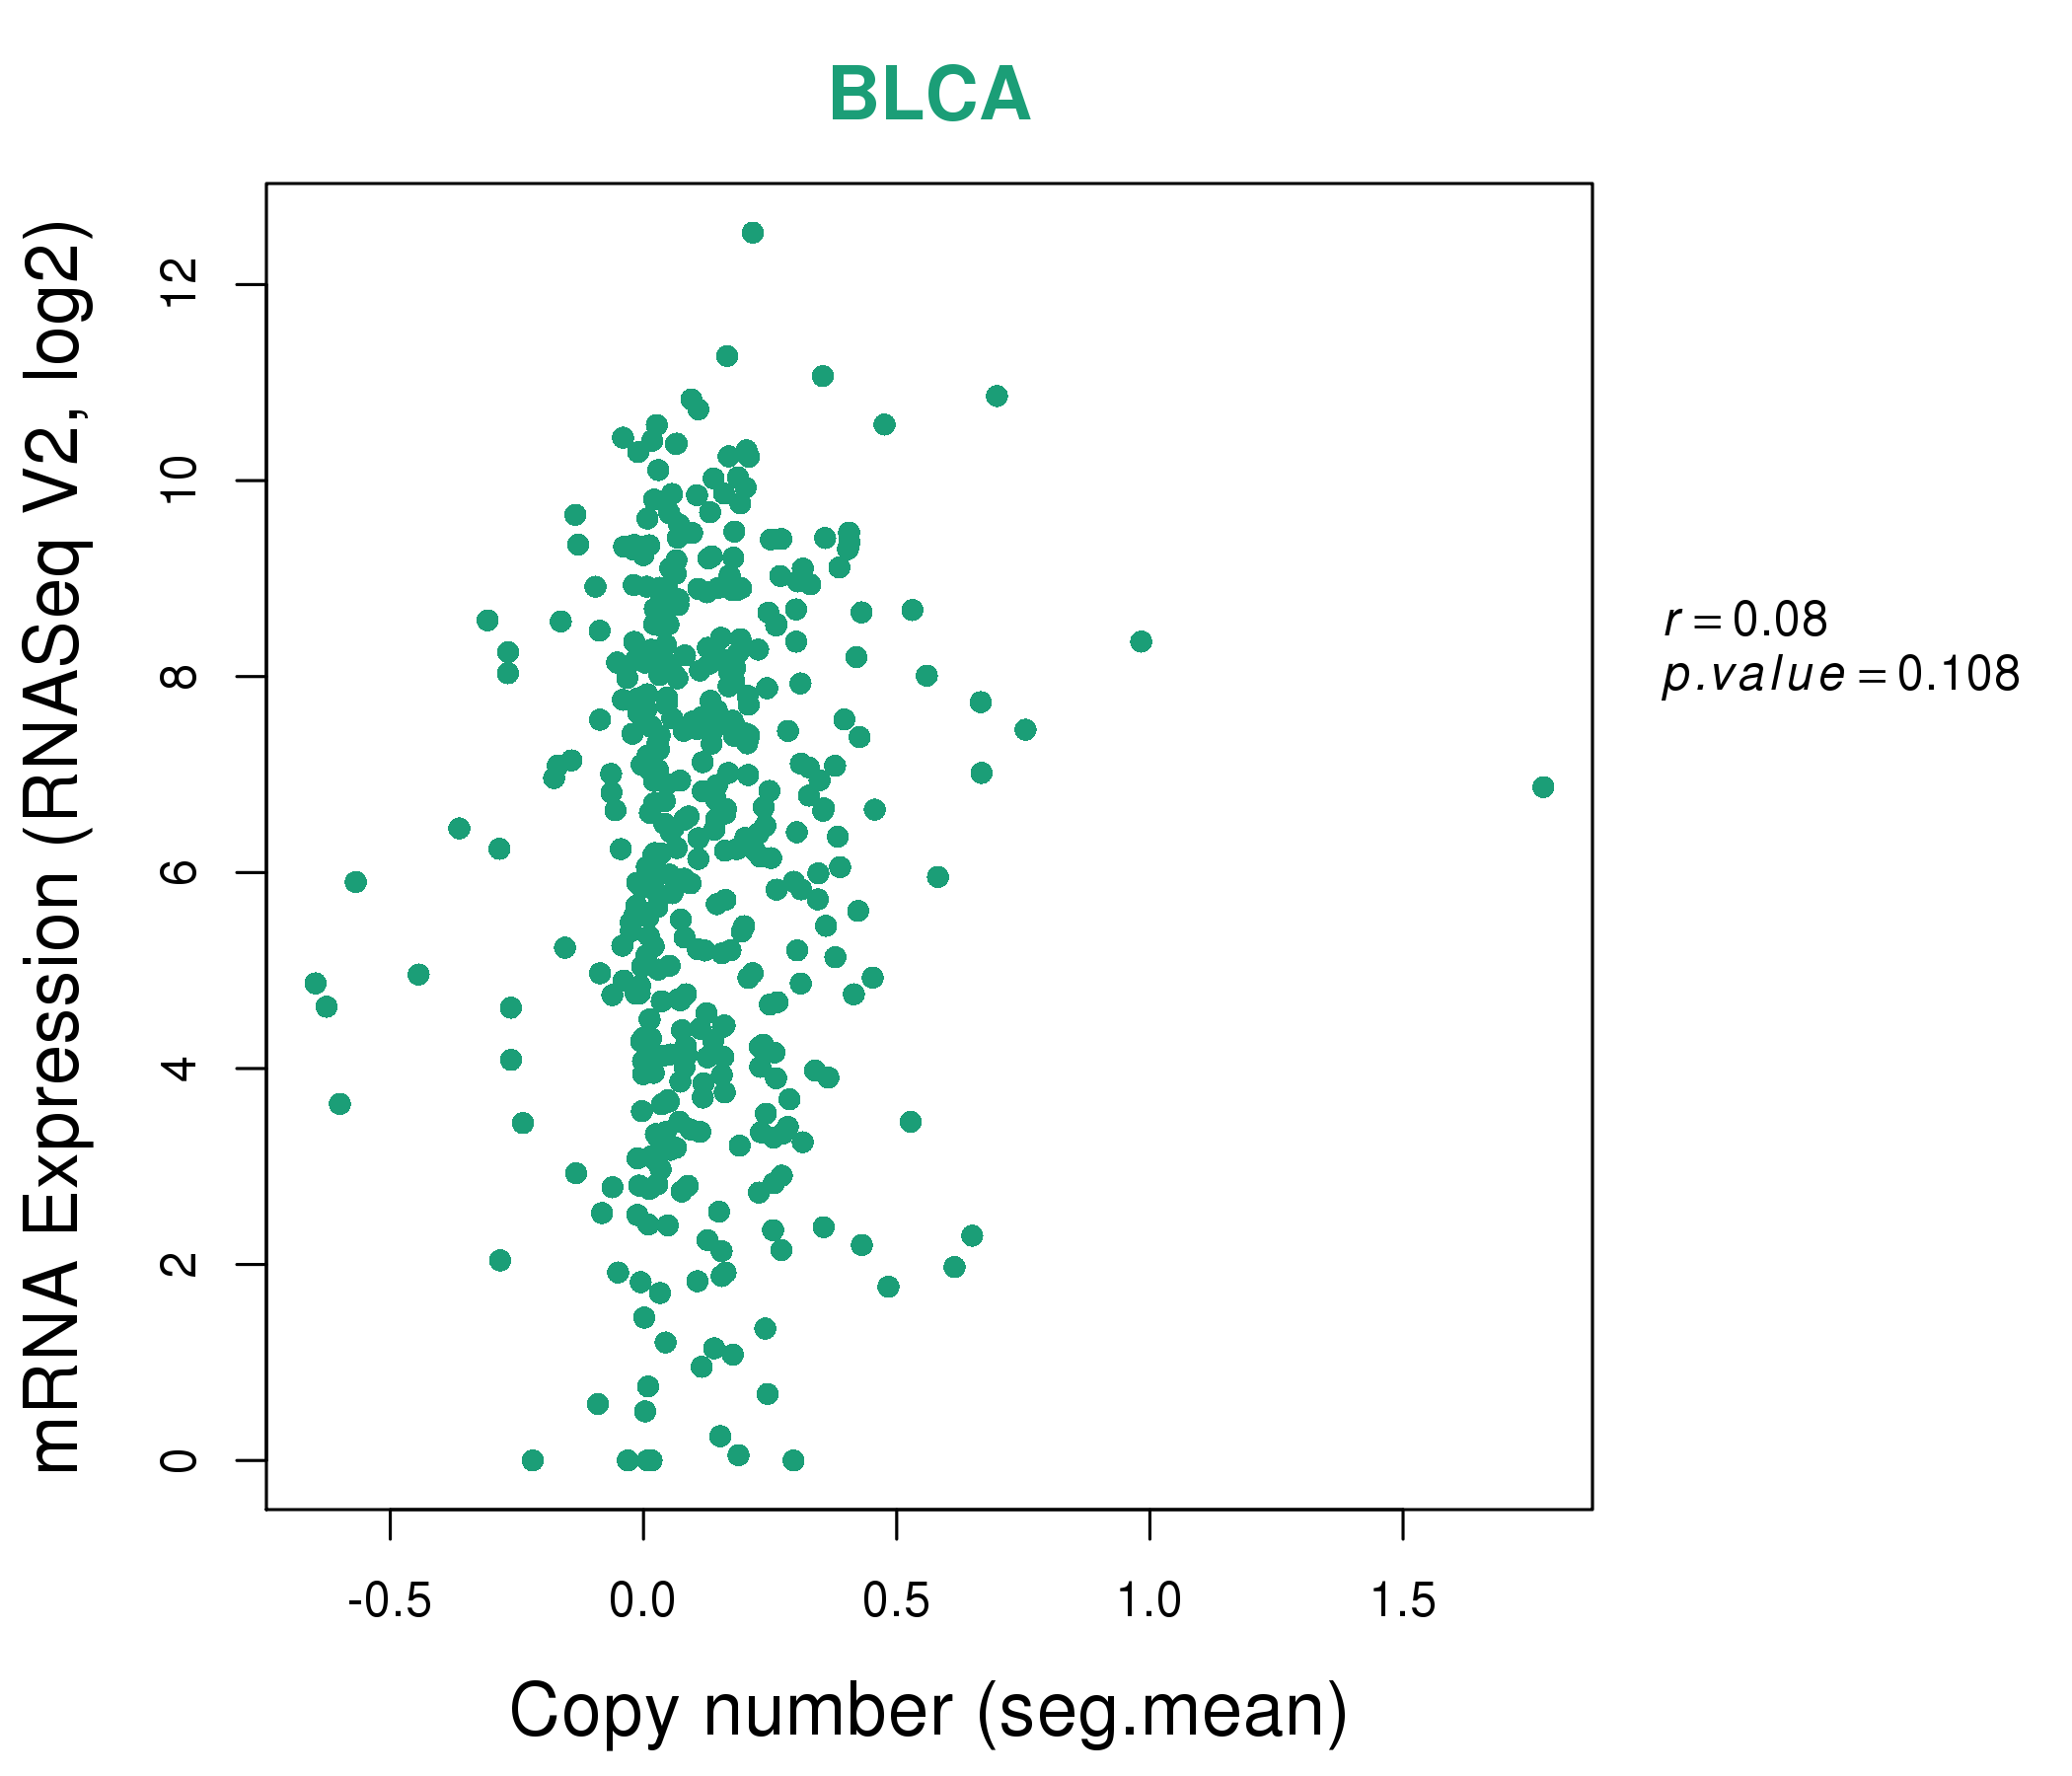
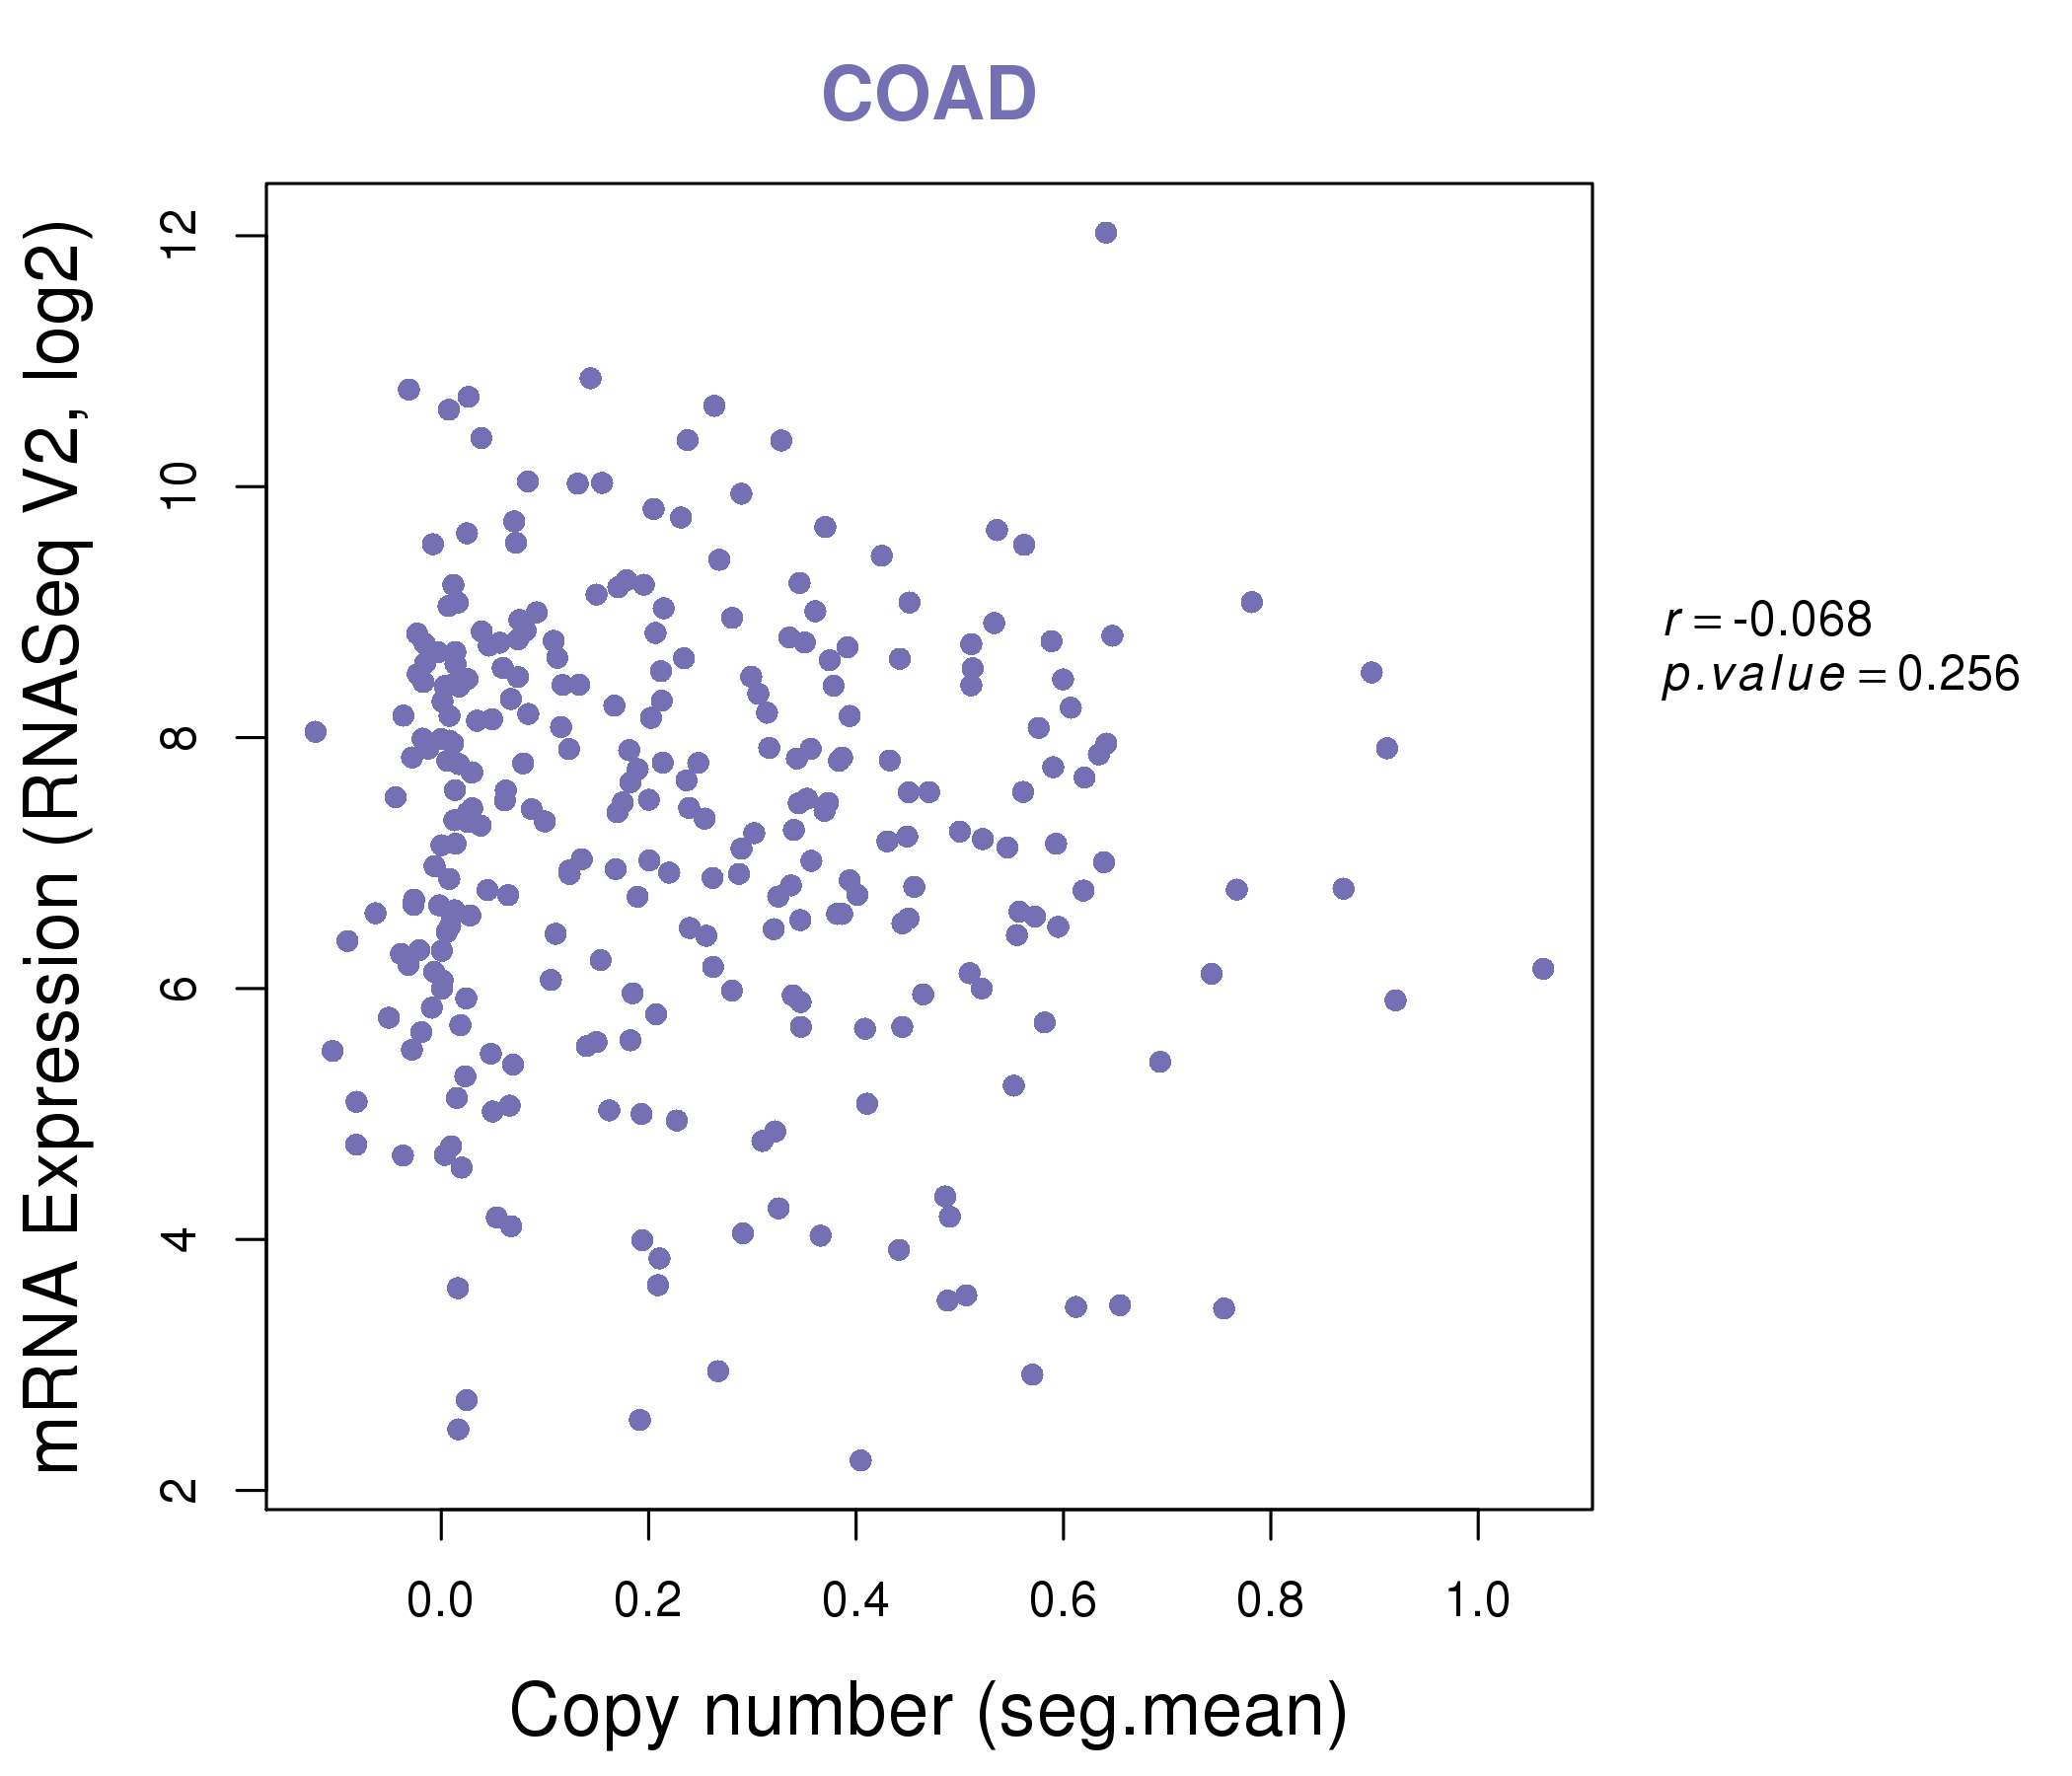
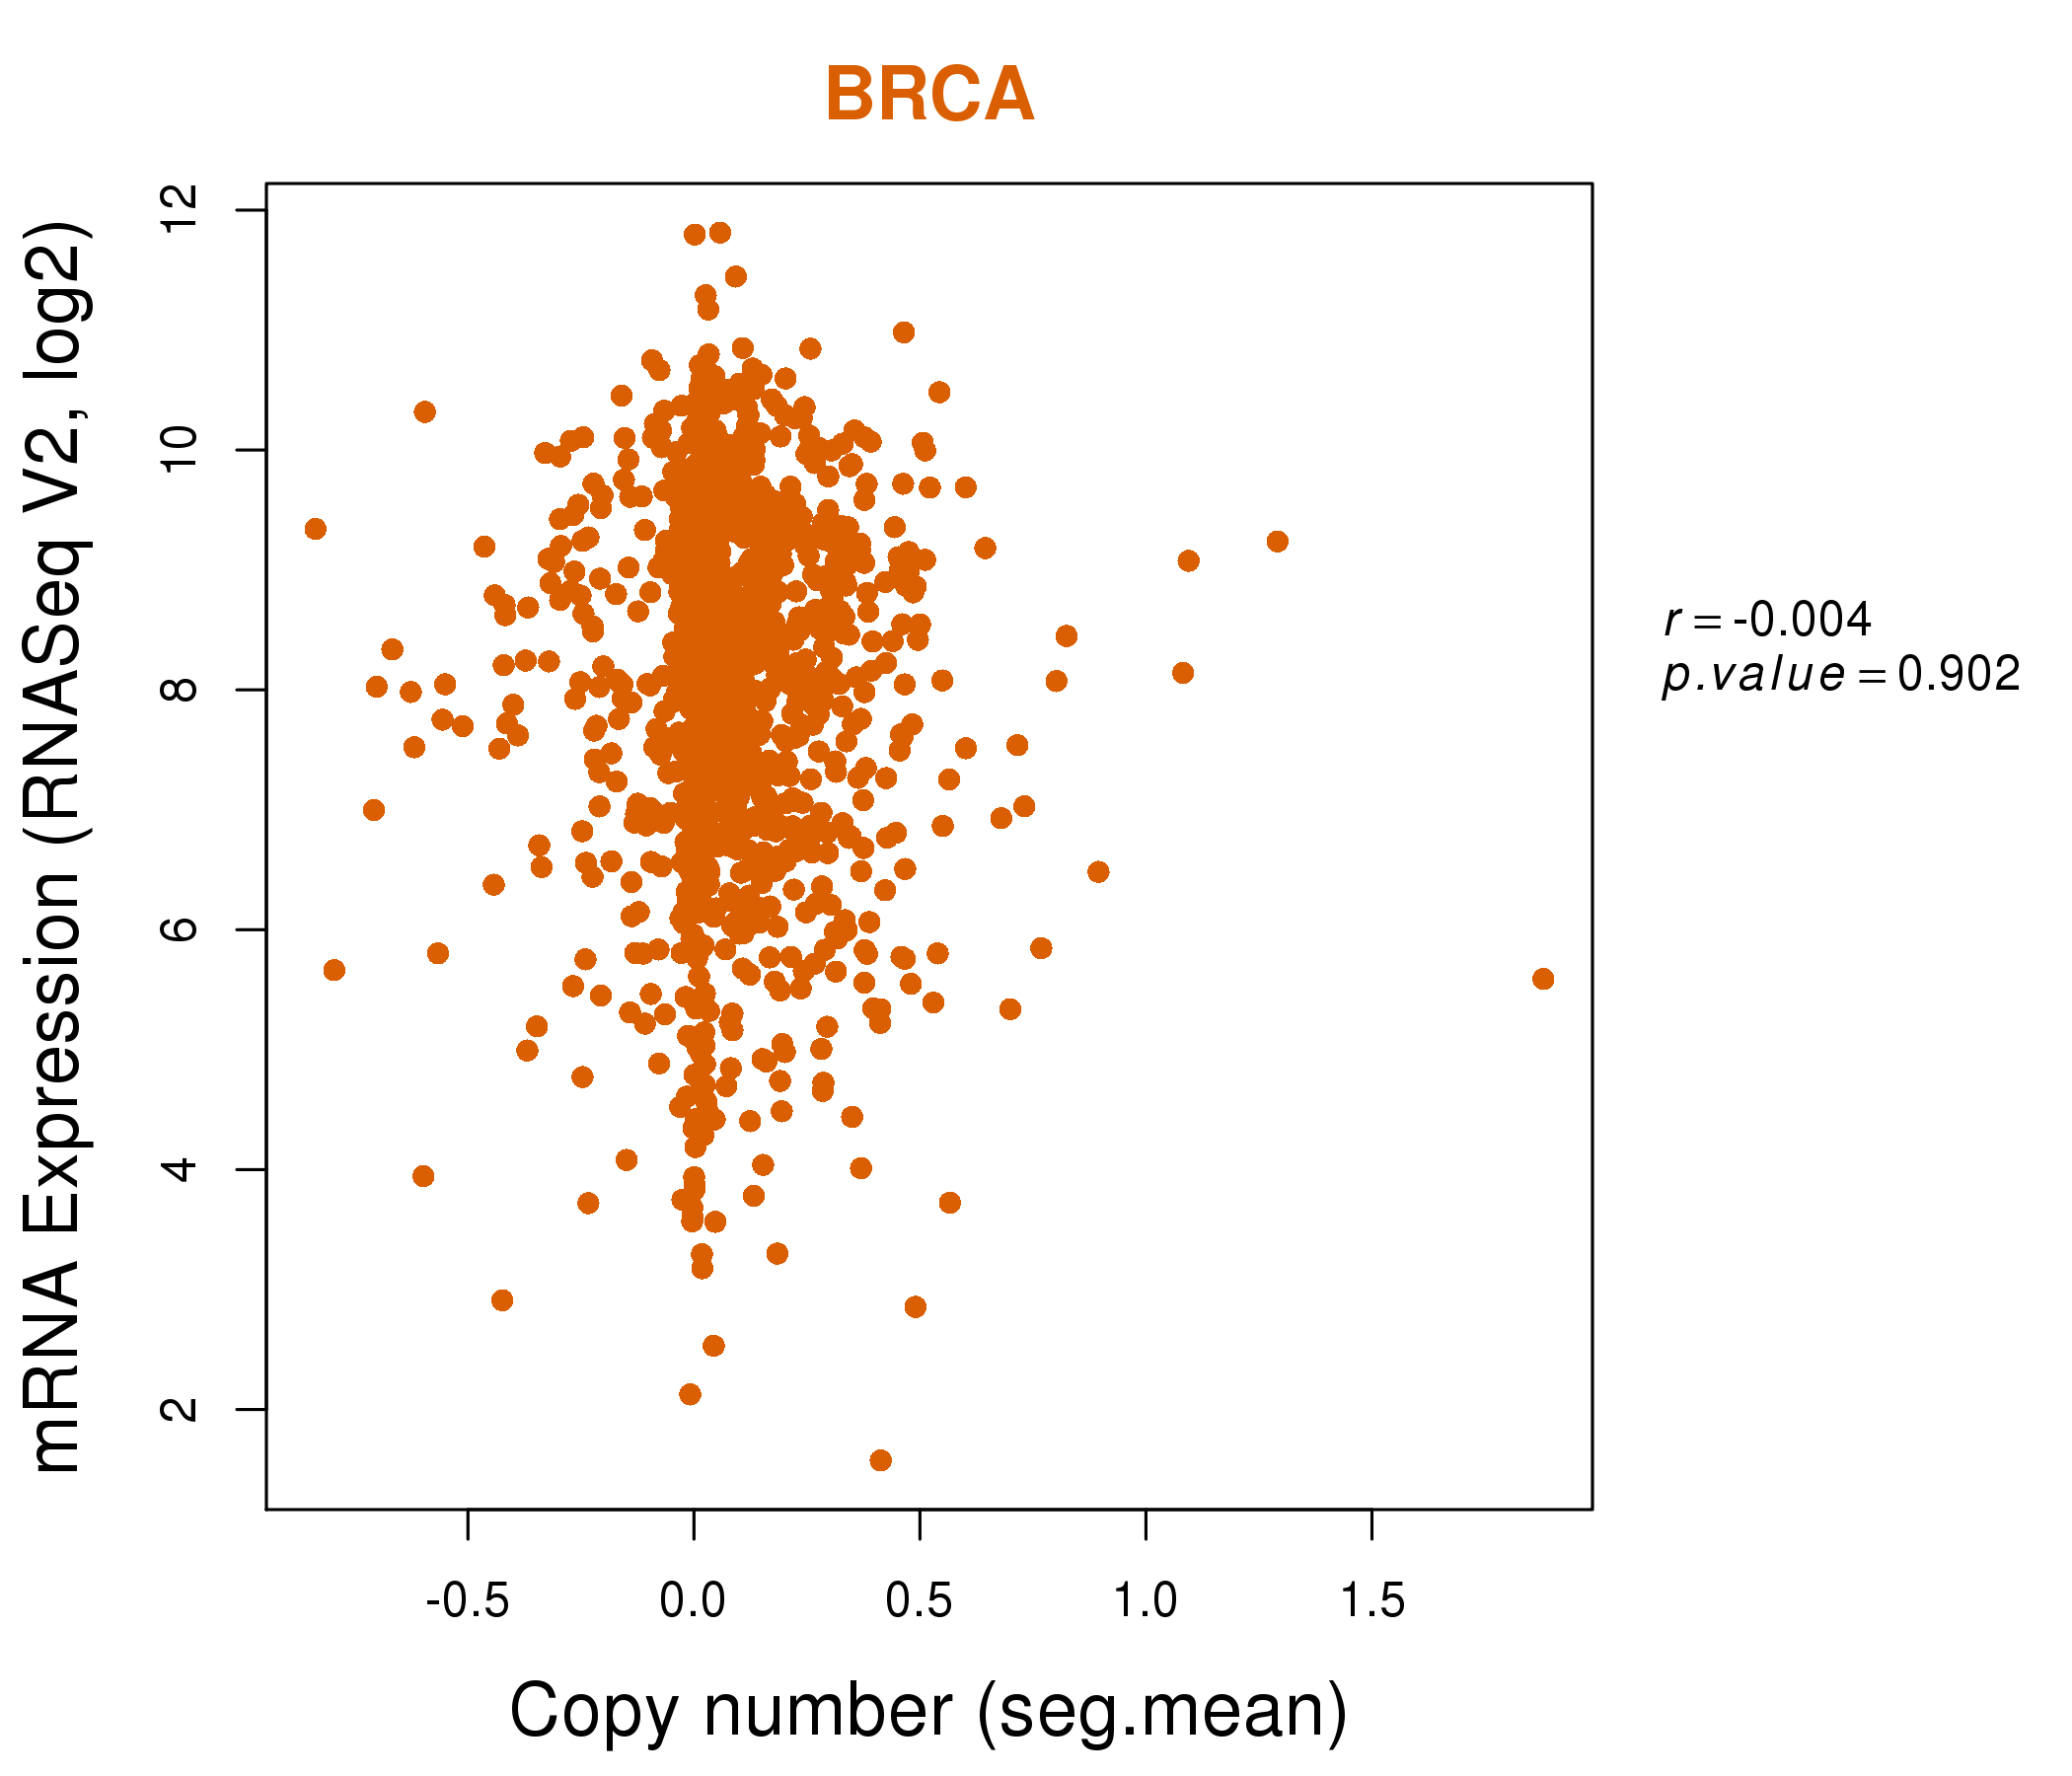
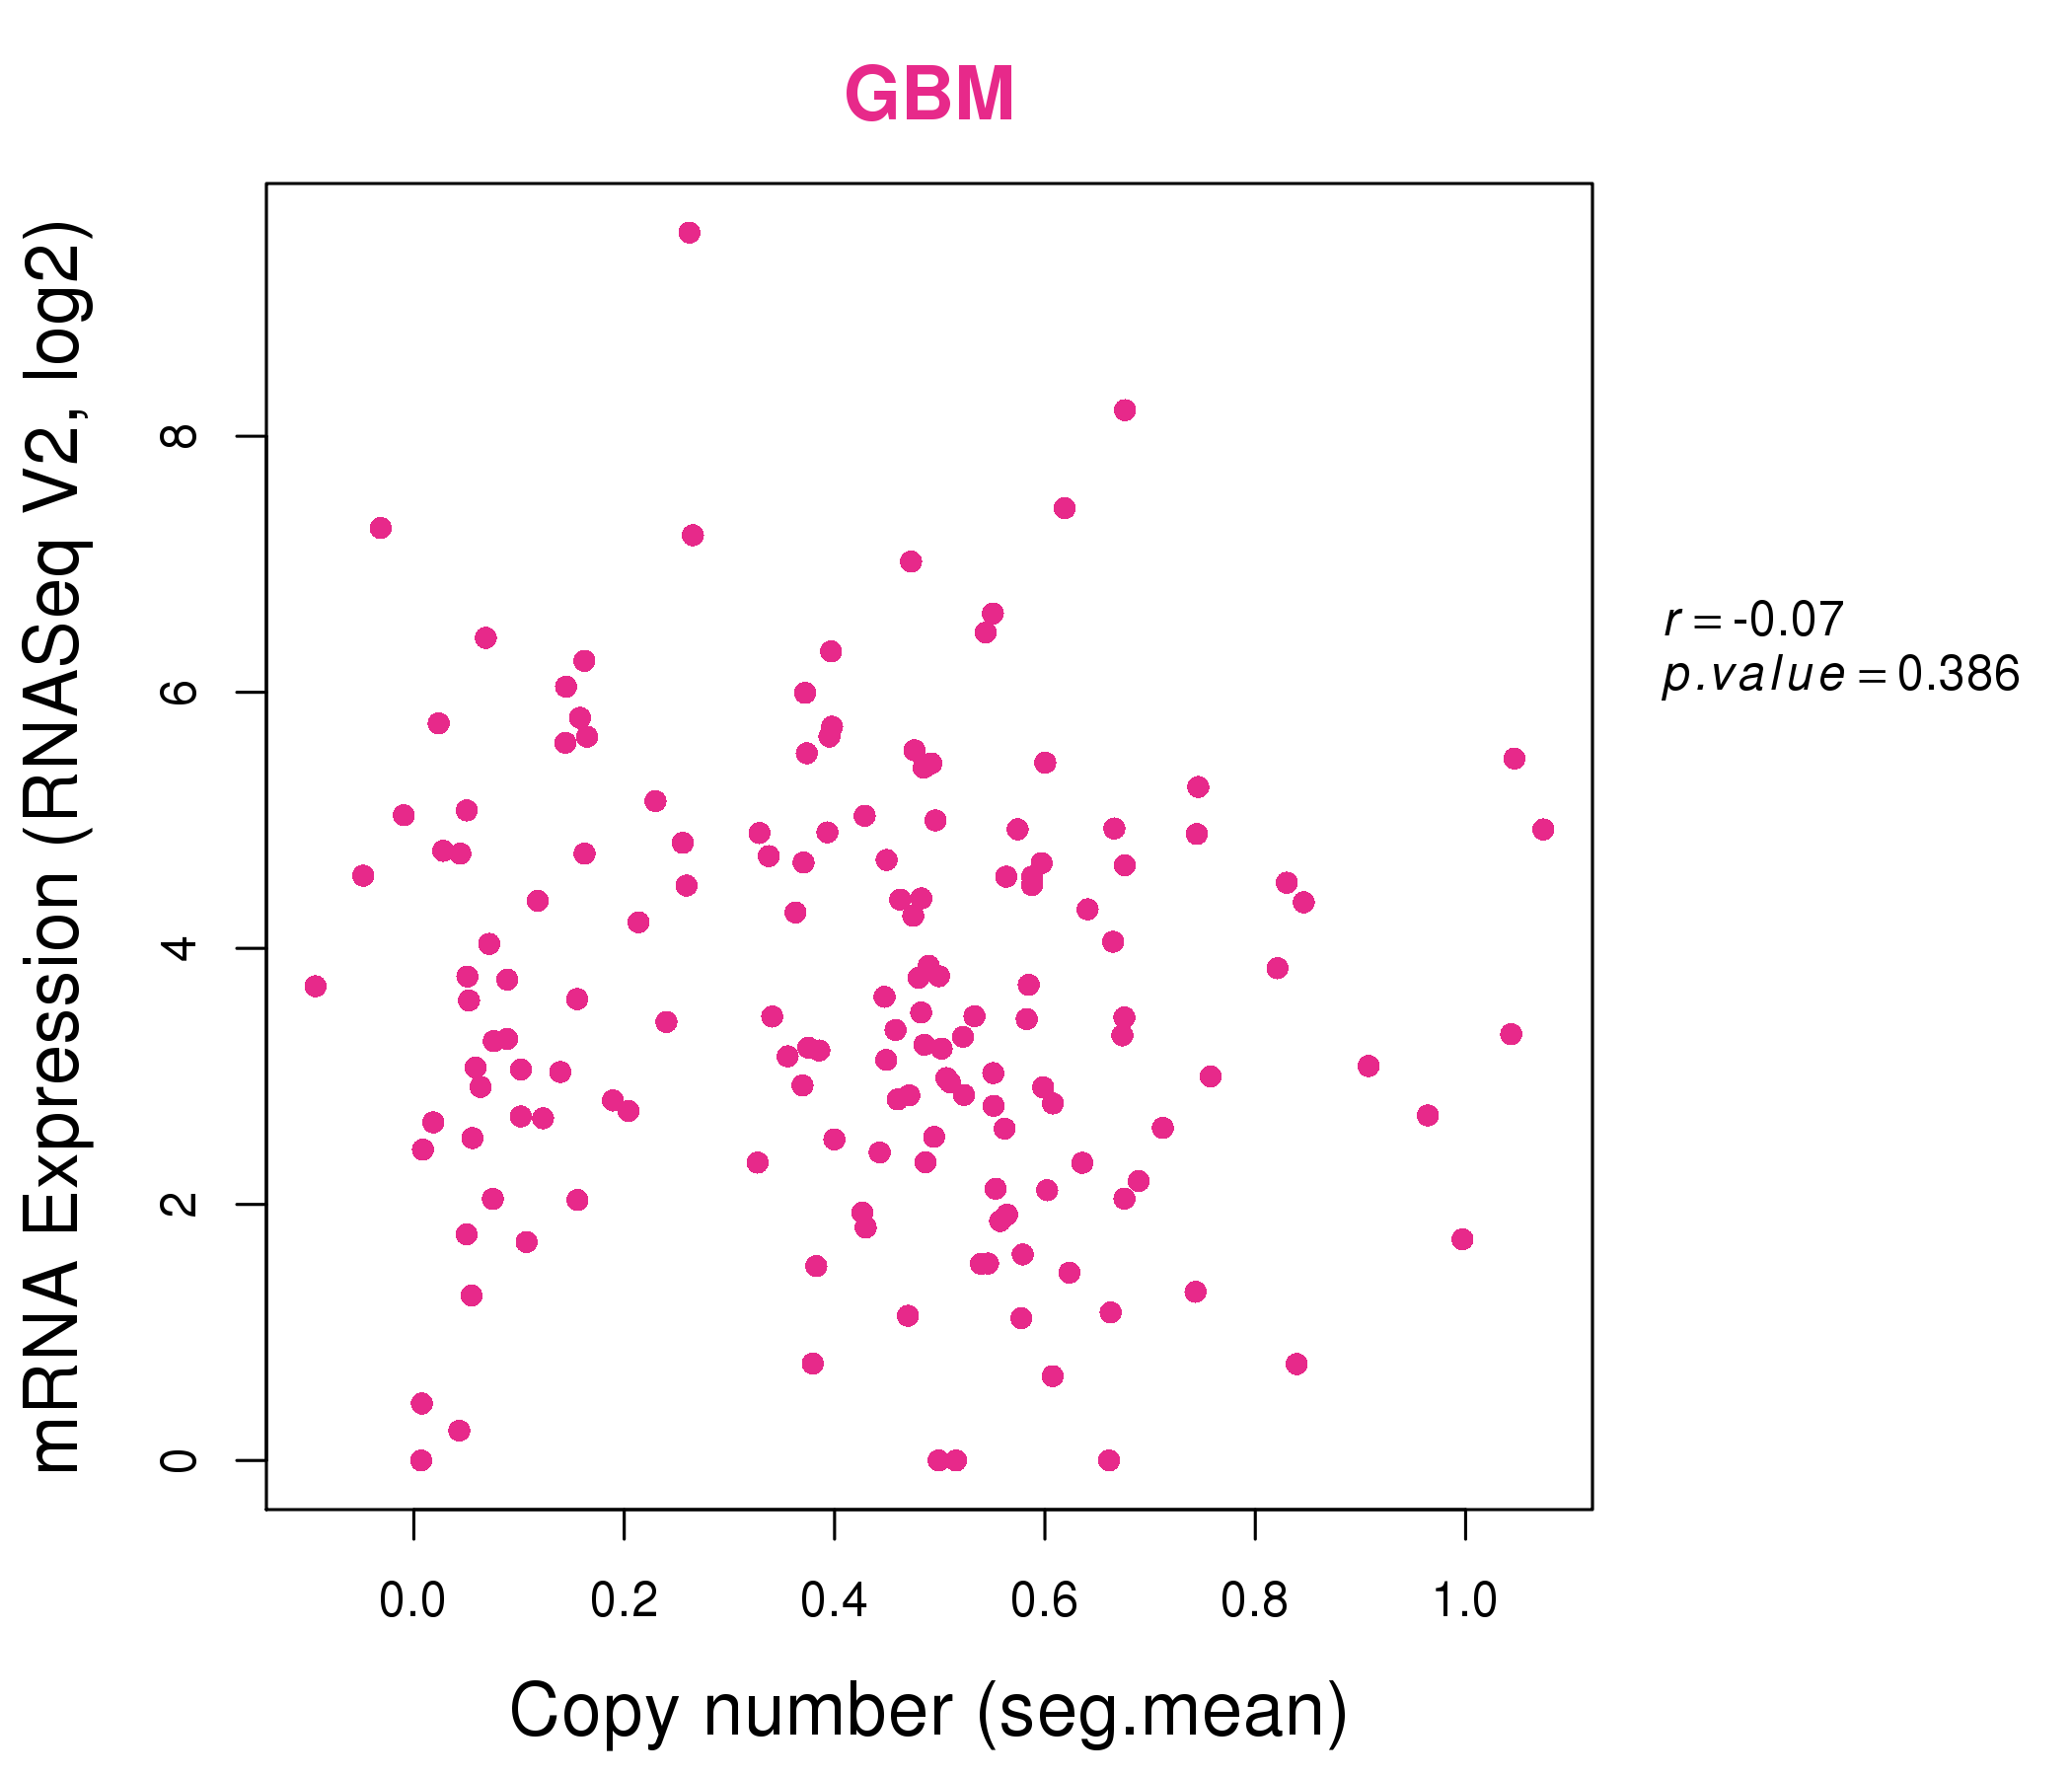
| * This plots show the correlation between CNV and gene expression. |
: Open all plots for all cancer types
 |
|
 |
|
| Top |
| Gene-Gene Network Information |
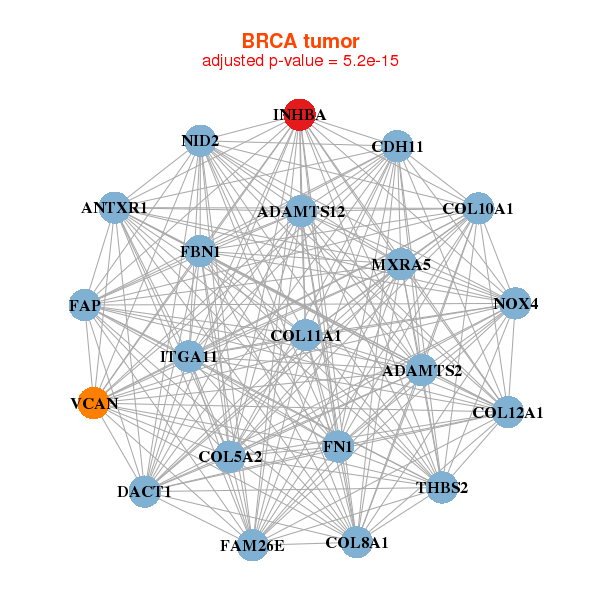
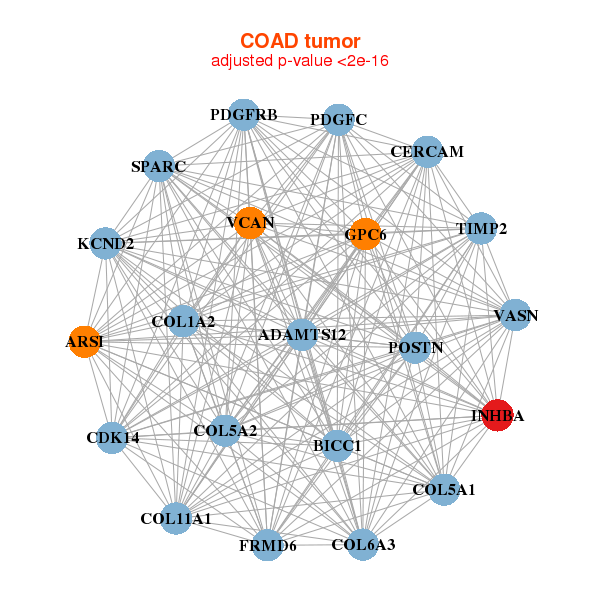
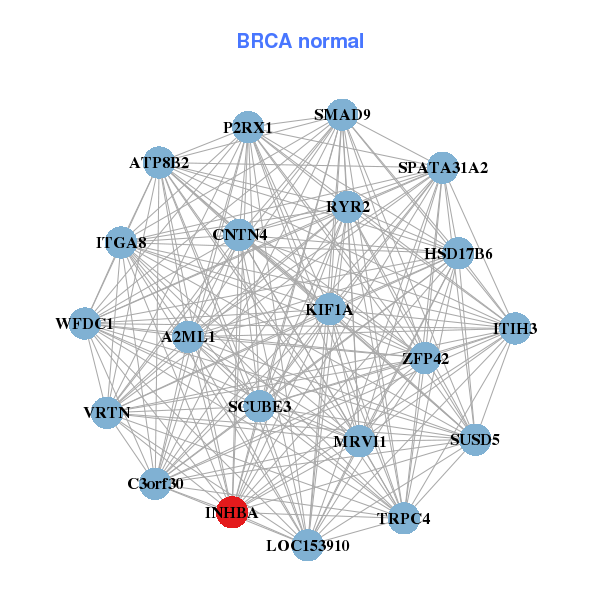
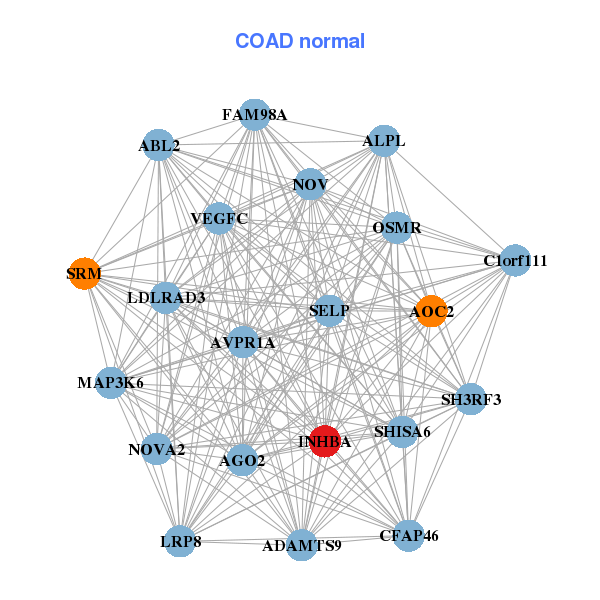
| * Co-Expression network figures were drawn using R package igraph. Only the top 20 genes with the highest correlations were shown. Red circle: input gene, orange circle: cell metabolism gene, sky circle: other gene |
: Open all plots for all cancer types
 |
|
| ADAMTS12,ADAMTS2,ANTXR1,CDH11,COL10A1,COL11A1,COL12A1, COL5A2,COL8A1,DACT1,FAM26E,FAP,FBN1,FN1, INHBA,ITGA11,MXRA5,NID2,NOX4,THBS2,VCAN | A2ML1,ATP8B2,VRTN,C3orf30,CNTN4,SPATA31A2,HSD17B6, INHBA,ITGA8,ITIH3,KIF1A,LOC153910,MRVI1,P2RX1, RYR2,SCUBE3,SMAD9,SUSD5,TRPC4,WFDC1,ZFP42 |
 |
|
| ADAMTS12,ARSI,BICC1,CDK14,CERCAM,COL11A1,COL1A2, COL5A1,COL5A2,COL6A3,FRMD6,GPC6,INHBA,KCND2, PDGFC,PDGFRB,POSTN,SPARC,TIMP2,VASN,VCAN | ABL2,ADAMTS9,ALPL,AOC2,AVPR1A,CFAP46,C1orf111, AGO2,FAM98A,INHBA,LDLRAD3,LRP8,MAP3K6,NOV, NOVA2,OSMR,SELP,SH3RF3,SHISA6,SRM,VEGFC |
| * Co-Expression network figures were drawn using R package igraph. Only the top 20 genes with the highest correlations were shown. Red circle: input gene, orange circle: cell metabolism gene, sky circle: other gene |
: Open all plots for all cancer types
| Top |
: Open all interacting genes' information including KEGG pathway for all interacting genes from DAVID
| Top |
| Pharmacological Information for INHBA |
| There's no related Drug. |
| Top |
| Cross referenced IDs for INHBA |
| * We obtained these cross-references from Uniprot database. It covers 150 different DBs, 18 categories. http://www.uniprot.org/help/cross_references_section |
: Open all cross reference information
|
Copyright © 2016-Present - The Univsersity of Texas Health Science Center at Houston @ |