|
||||||||||||||||||||
| |
| Phenotypic Information (metabolism pathway, cancer, disease, phenome) |
| |
| |
| Gene-Gene Network Information: Co-Expression Network, Interacting Genes & KEGG |
| |
|


| Gene Summary for INHBB |
| Basic gene info. | Gene symbol | INHBB |
| Gene name | inhibin, beta B | |
| Synonyms | - | |
| Cytomap | UCSC genome browser: 2cen-q13 | |
| Genomic location | chr2 :121103718-121109383 | |
| Type of gene | protein-coding | |
| RefGenes | NM_002193.2, | |
| Ensembl id | ENSG00000163083 | |
| Description | Inhibin, beta-2activin AB beta polypeptideactivin beta-B chaininhibin beta B chain | |
| Modification date | 20141207 | |
| dbXrefs | MIM : 147390 | |
| HGNC : HGNC | ||
| Ensembl : ENSG00000163083 | ||
| HPRD : 00934 | ||
| Vega : OTTHUMG00000131437 | ||
| Protein | UniProt: go to UniProt's Cross Reference DB Table | |
| Expression | CleanEX: HS_INHBB | |
| BioGPS: 3625 | ||
| Gene Expression Atlas: ENSG00000163083 | ||
| The Human Protein Atlas: ENSG00000163083 | ||
| Pathway | NCI Pathway Interaction Database: INHBB | |
| KEGG: INHBB | ||
| REACTOME: INHBB | ||
| ConsensusPathDB | ||
| Pathway Commons: INHBB | ||
| Metabolism | MetaCyc: INHBB | |
| HUMANCyc: INHBB | ||
| Regulation | Ensembl's Regulation: ENSG00000163083 | |
| miRBase: chr2 :121,103,718-121,109,383 | ||
| TargetScan: NM_002193 | ||
| cisRED: ENSG00000163083 | ||
| Context | iHOP: INHBB | |
| cancer metabolism search in PubMed: INHBB | ||
| UCL Cancer Institute: INHBB | ||
| Assigned class in ccmGDB | C | |
| Top |
| Phenotypic Information for INHBB(metabolism pathway, cancer, disease, phenome) |
| Cancer | CGAP: INHBB |
| Familial Cancer Database: INHBB | |
| * This gene is included in those cancer gene databases. |
|
|
|
|
|
|
| ||||||||||||||
Oncogene 1 | Significant driver gene in | |||||||||||||||||||
| cf) number; DB name 1 Oncogene; http://nar.oxfordjournals.org/content/35/suppl_1/D721.long, 2 Tumor Suppressor gene; https://bioinfo.uth.edu/TSGene/, 3 Cancer Gene Census; http://www.nature.com/nrc/journal/v4/n3/abs/nrc1299.html, 4 CancerGenes; http://nar.oxfordjournals.org/content/35/suppl_1/D721.long, 5 Network of Cancer Gene; http://ncg.kcl.ac.uk/index.php, 1Therapeutic Vulnerabilities in Cancer; http://cbio.mskcc.org/cancergenomics/statius/ |
| REACTOME_METABOLISM_OF_AMINO_ACIDS_AND_DERIVATIVES | |
| OMIM | |
| Orphanet | |
| Disease | KEGG Disease: INHBB |
| MedGen: INHBB (Human Medical Genetics with Condition) | |
| ClinVar: INHBB | |
| Phenotype | MGI: INHBB (International Mouse Phenotyping Consortium) |
| PhenomicDB: INHBB | |
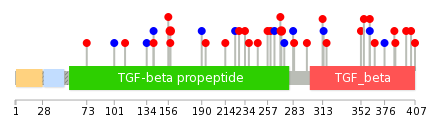
| Mutations for INHBB |
| * Under tables are showing count per each tissue to give us broad intuition about tissue specific mutation patterns.You can go to the detailed page for each mutation database's web site. |
| There's no structural variation information in COSMIC data for this gene. |
| * From mRNA Sanger sequences, Chitars2.0 arranged chimeric transcripts. This table shows INHBB related fusion information. |
| ID | Head Gene | Tail Gene | Accession | Gene_a | qStart_a | qEnd_a | Chromosome_a | tStart_a | tEnd_a | Gene_a | qStart_a | qEnd_a | Chromosome_a | tStart_a | tEnd_a |
| Top |
| There's no copy number variation information in COSMIC data for this gene. |
| Top |
|
 |
| Top |
| Stat. for Non-Synonymous SNVs (# total SNVs=20) | (# total SNVs=9) |
 |  |
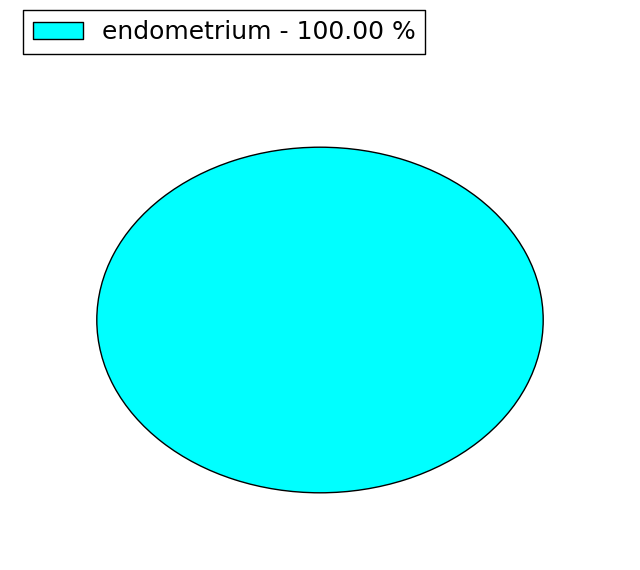
(# total SNVs=1) | (# total SNVs=0) |
 |
| Top |
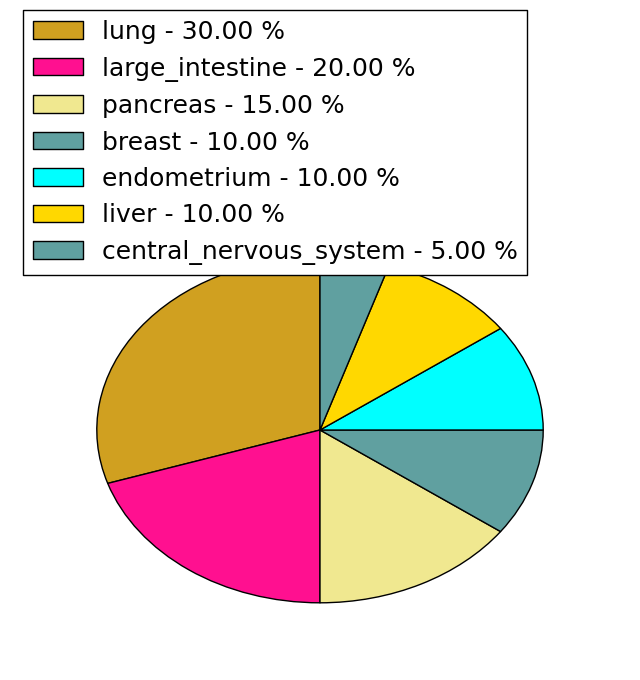
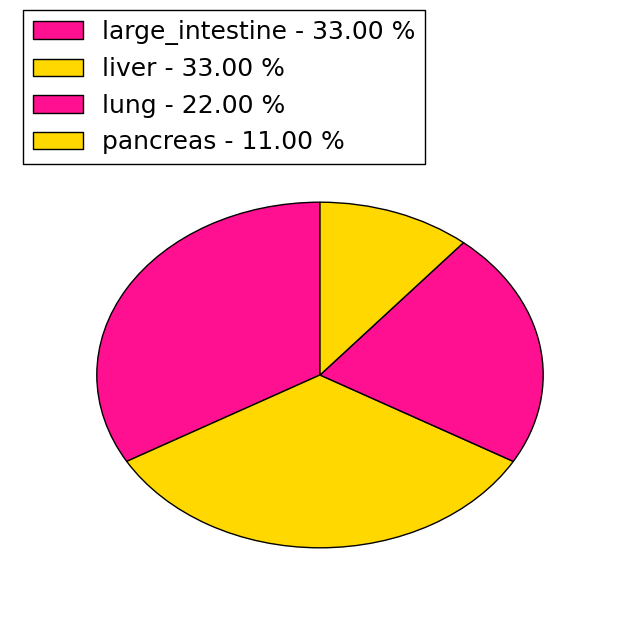
| * When you move the cursor on each content, you can see more deailed mutation information on the Tooltip. Those are primary_site,primary_histology,mutation(aa),pubmedID. |
| GRCh37 position | Mutation(aa) | Unique sampleID count |
| chr2:121106698-121106698 | p.R158C | 3 |
| chr2:121104092-121104092 | p.L110L | 3 |
| chr2:121106693-121106693 | p.R156Q | 3 |
| chr2:121104098-121104098 | p.A112T | 2 |
| chr2:121107018-121107018 | p.F264F | 2 |
| chr2:121107121-121107121 | p.R299W | 2 |
| chr2:121107038-121107038 | p.S271L | 2 |
| chr2:121107175-121107175 | p.W317R | 1 |
| chr2:121106908-121106908 | p.T228S | 1 |
| chr2:121107309-121107309 | p.R361R | 1 |
| Top |
|
 |
| Point Mutation/ Tissue ID | 1 | 2 | 3 | 4 | 5 | 6 | 7 | 8 | 9 | 10 | 11 | 12 | 13 | 14 | 15 | 16 | 17 | 18 | 19 | 20 |
| # sample | 1 | 1 | 1 | 5 | 1 | 2 | 4 | 1 | 8 | 10 | 1 | |||||||||
| # mutation | 1 | 1 | 1 | 5 | 1 | 2 | 4 | 1 | 11 | 13 | 1 | |||||||||
| nonsynonymous SNV | 1 | 1 | 3 | 2 | 2 | 1 | 8 | 11 | 1 | |||||||||||
| synonymous SNV | 1 | 2 | 1 | 2 | 3 | 2 |
| cf) Tissue ID; Tissue type (1; BLCA[Bladder Urothelial Carcinoma], 2; BRCA[Breast invasive carcinoma], 3; CESC[Cervical squamous cell carcinoma and endocervical adenocarcinoma], 4; COAD[Colon adenocarcinoma], 5; GBM[Glioblastoma multiforme], 6; Glioma Low Grade, 7; HNSC[Head and Neck squamous cell carcinoma], 8; KICH[Kidney Chromophobe], 9; KIRC[Kidney renal clear cell carcinoma], 10; KIRP[Kidney renal papillary cell carcinoma], 11; LAML[Acute Myeloid Leukemia], 12; LUAD[Lung adenocarcinoma], 13; LUSC[Lung squamous cell carcinoma], 14; OV[Ovarian serous cystadenocarcinoma ], 15; PAAD[Pancreatic adenocarcinoma], 16; PRAD[Prostate adenocarcinoma], 17; SKCM[Skin Cutaneous Melanoma], 18:STAD[Stomach adenocarcinoma], 19:THCA[Thyroid carcinoma], 20:UCEC[Uterine Corpus Endometrial Carcinoma]) |
| Top |
| * We represented just top 10 SNVs. When you move the cursor on each content, you can see more deailed mutation information on the Tooltip. Those are primary_site, primary_histology, mutation(aa), pubmedID. |
| Genomic Position | Mutation(aa) | Unique sampleID count |
| chr2:121106699 | p.S271L | 2 |
| chr2:121107038 | p.R158H | 2 |
| chr2:121106898 | p.A134A | 1 |
| chr2:121107075 | p.F264F | 1 |
| chr2:121104098 | p.D386Y | 1 |
| chr2:121107354 | p.S141P | 1 |
| chr2:121106908 | p.E270K | 1 |
| chr2:121107076 | p.D387G | 1 |
| chr2:121104166 | p.S141S | 1 |
| chr2:121107382 | p.N398K | 1 |
| * Copy number data were extracted from TCGA using R package TCGA-Assembler. The URLs of all public data files on TCGA DCC data server were gathered on Jan-05-2015. Function ProcessCNAData in TCGA-Assembler package was used to obtain gene-level copy number value which is calculated as the average copy number of the genomic region of a gene. |
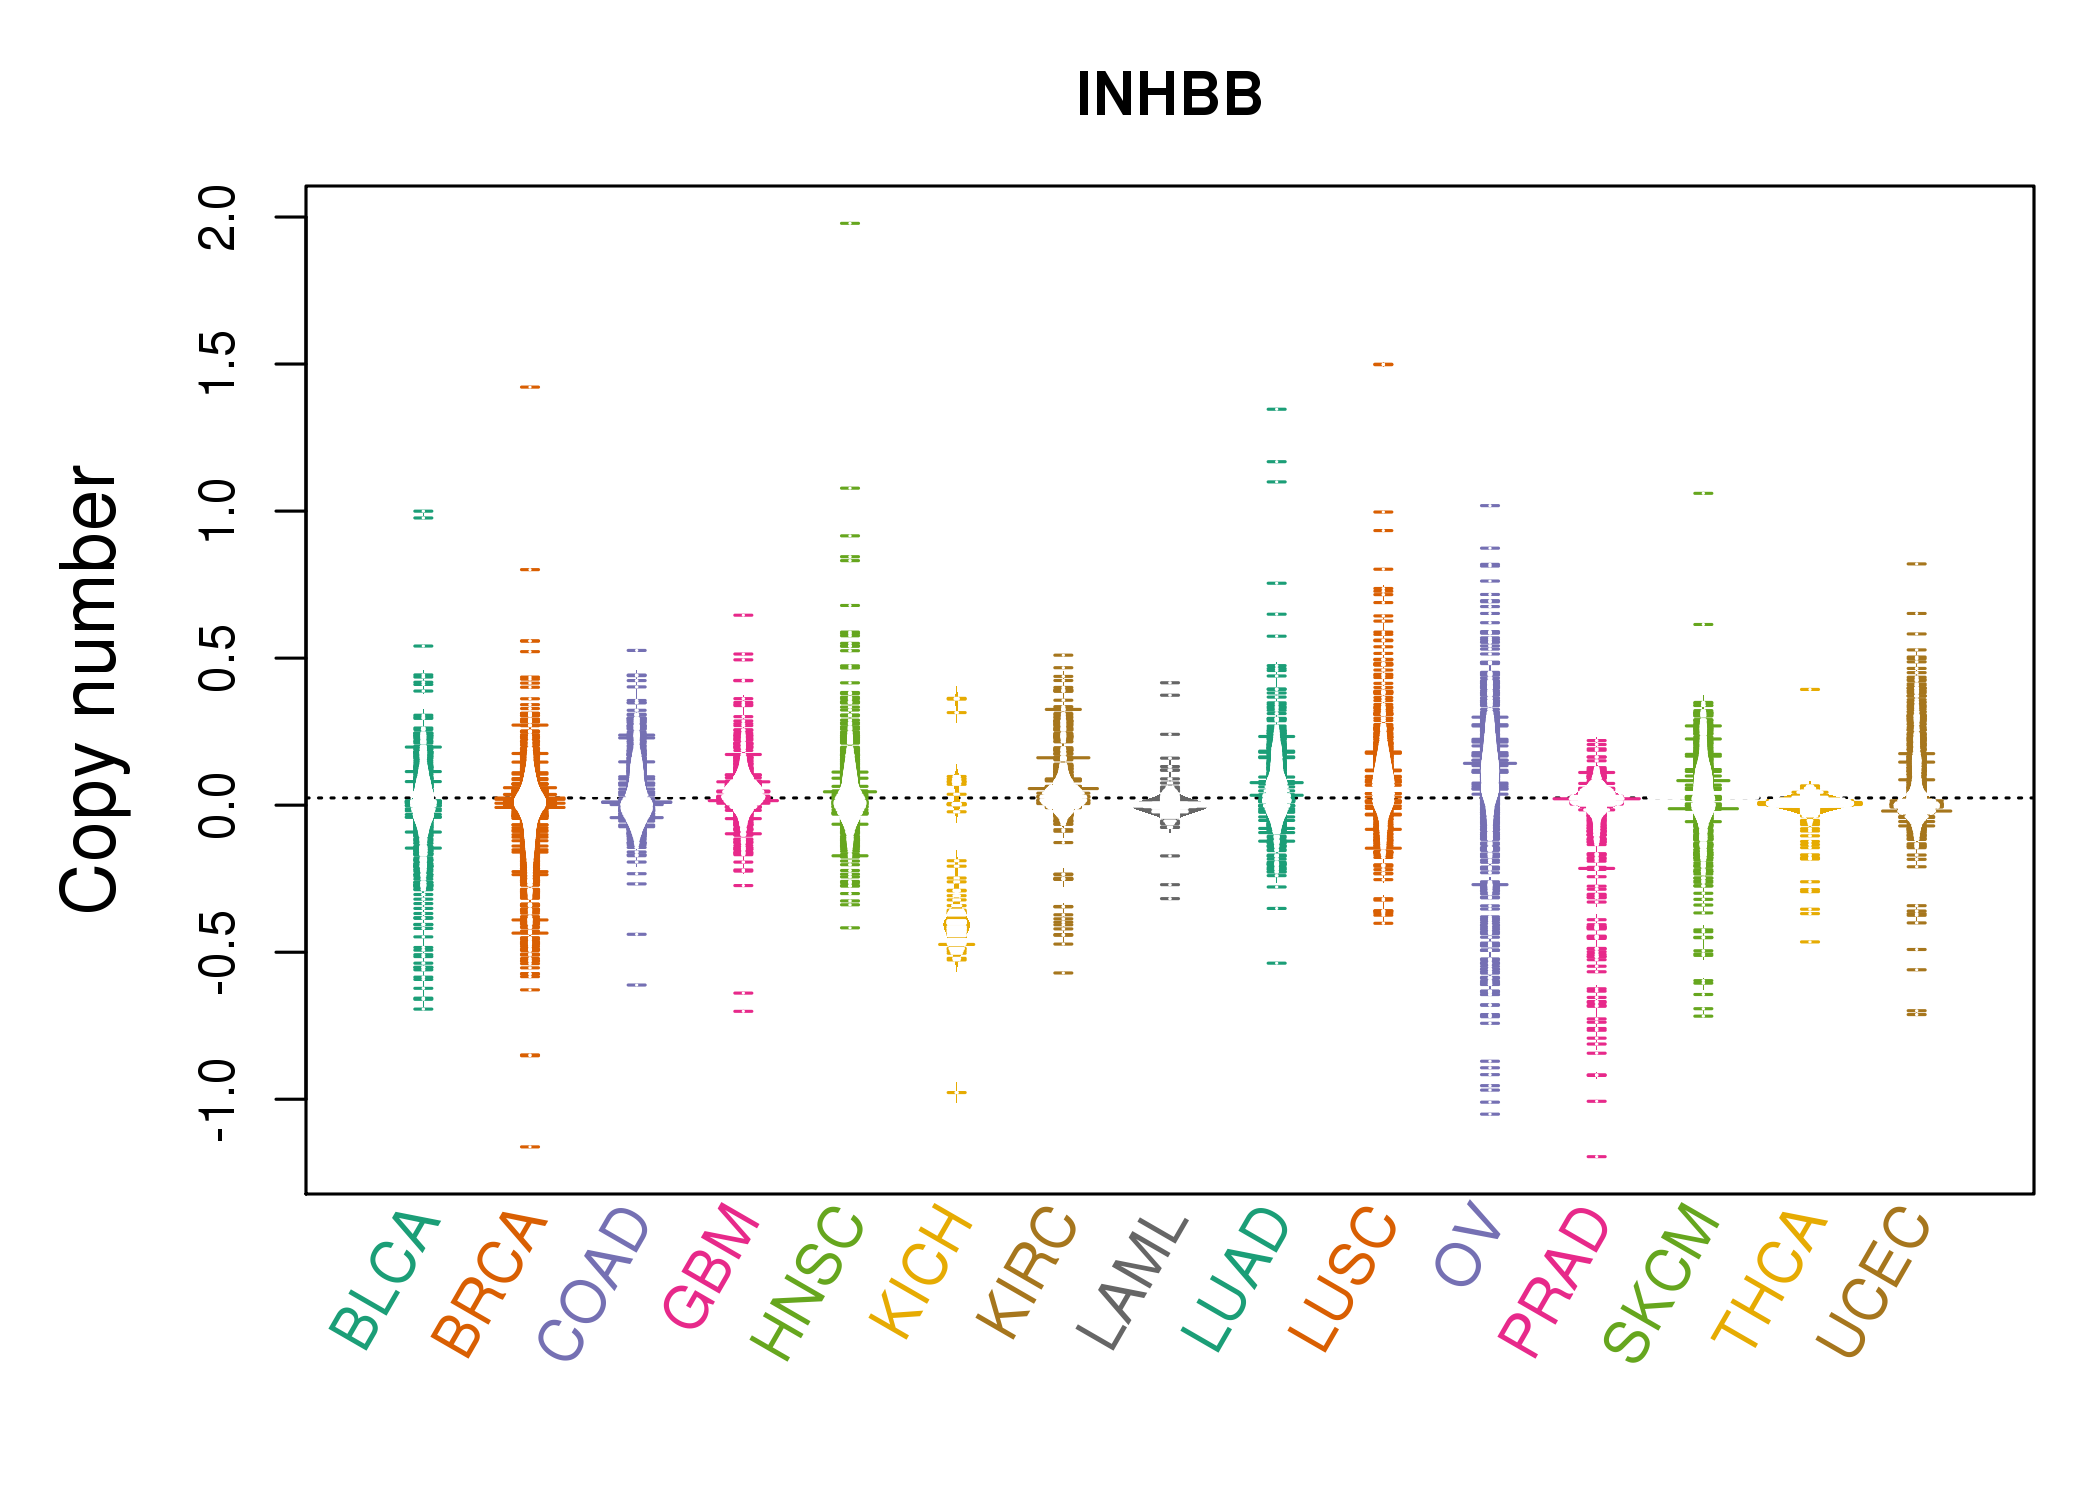 |
| cf) Tissue ID[Tissue type]: BLCA[Bladder Urothelial Carcinoma], BRCA[Breast invasive carcinoma], CESC[Cervical squamous cell carcinoma and endocervical adenocarcinoma], COAD[Colon adenocarcinoma], GBM[Glioblastoma multiforme], Glioma Low Grade, HNSC[Head and Neck squamous cell carcinoma], KICH[Kidney Chromophobe], KIRC[Kidney renal clear cell carcinoma], KIRP[Kidney renal papillary cell carcinoma], LAML[Acute Myeloid Leukemia], LUAD[Lung adenocarcinoma], LUSC[Lung squamous cell carcinoma], OV[Ovarian serous cystadenocarcinoma ], PAAD[Pancreatic adenocarcinoma], PRAD[Prostate adenocarcinoma], SKCM[Skin Cutaneous Melanoma], STAD[Stomach adenocarcinoma], THCA[Thyroid carcinoma], UCEC[Uterine Corpus Endometrial Carcinoma] |
| Top |
| Gene Expression for INHBB |
| * CCLE gene expression data were extracted from CCLE_Expression_Entrez_2012-10-18.res: Gene-centric RMA-normalized mRNA expression data. |
 |
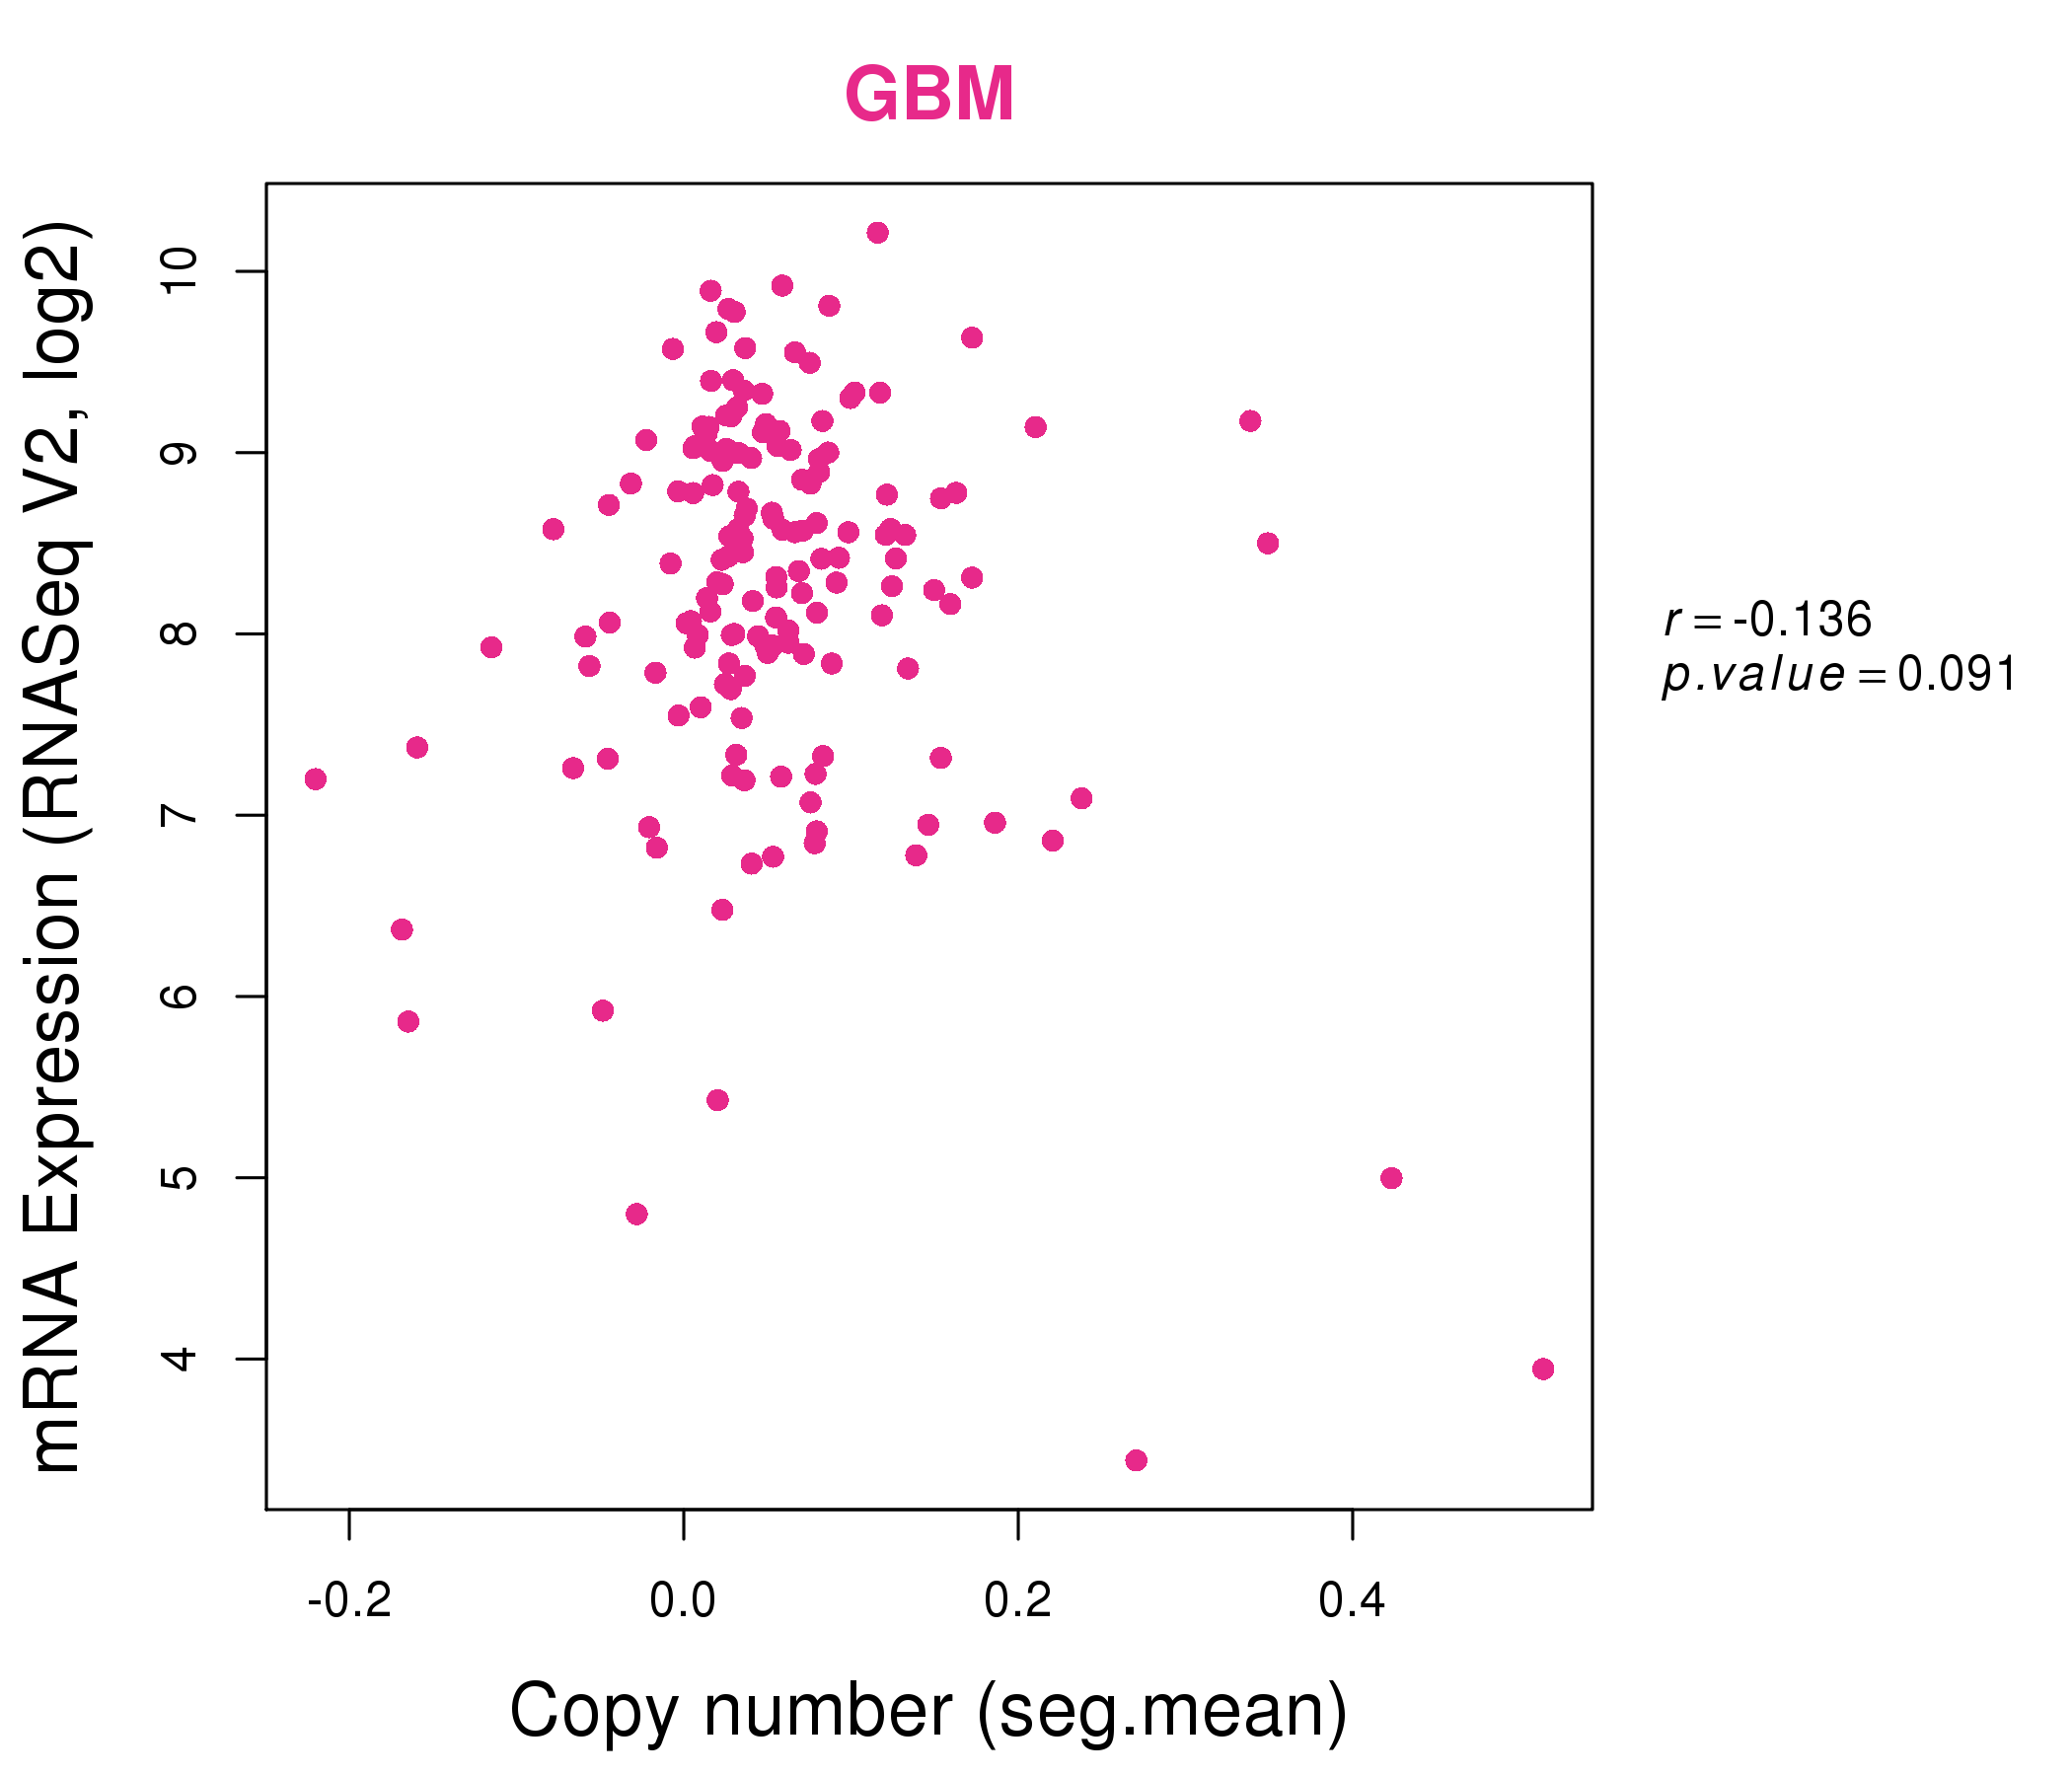
| * Normalized gene expression data of RNASeqV2 was extracted from TCGA using R package TCGA-Assembler. The URLs of all public data files on TCGA DCC data server were gathered at Jan-05-2015. Only eight cancer types have enough normal control samples for differential expression analysis. (t test, adjusted p<0.05 (using Benjamini-Hochberg FDR)) |
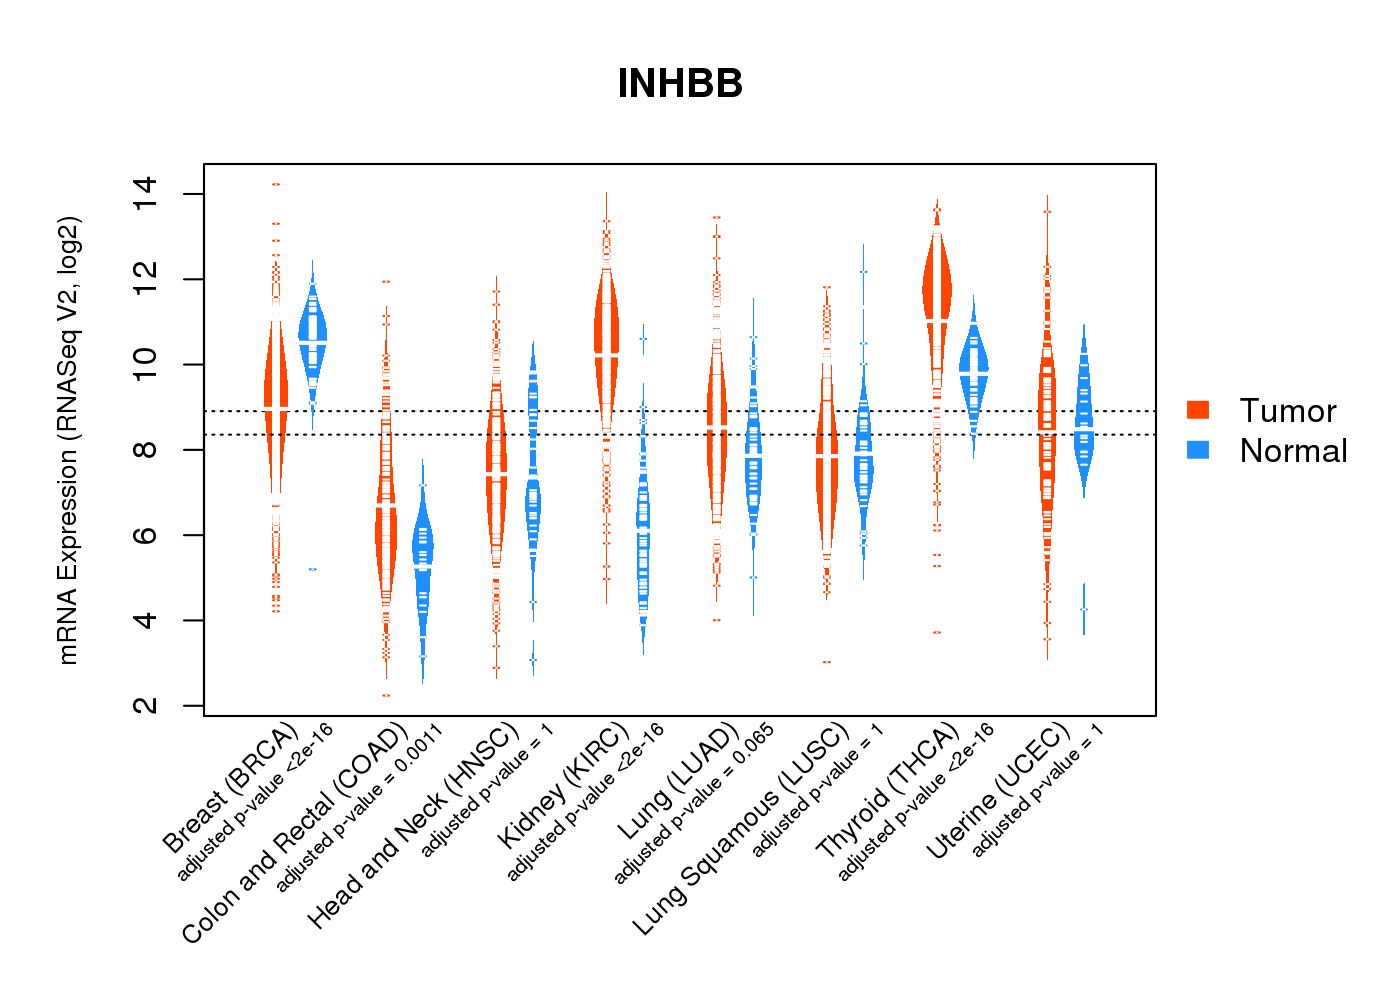 |
| Top |
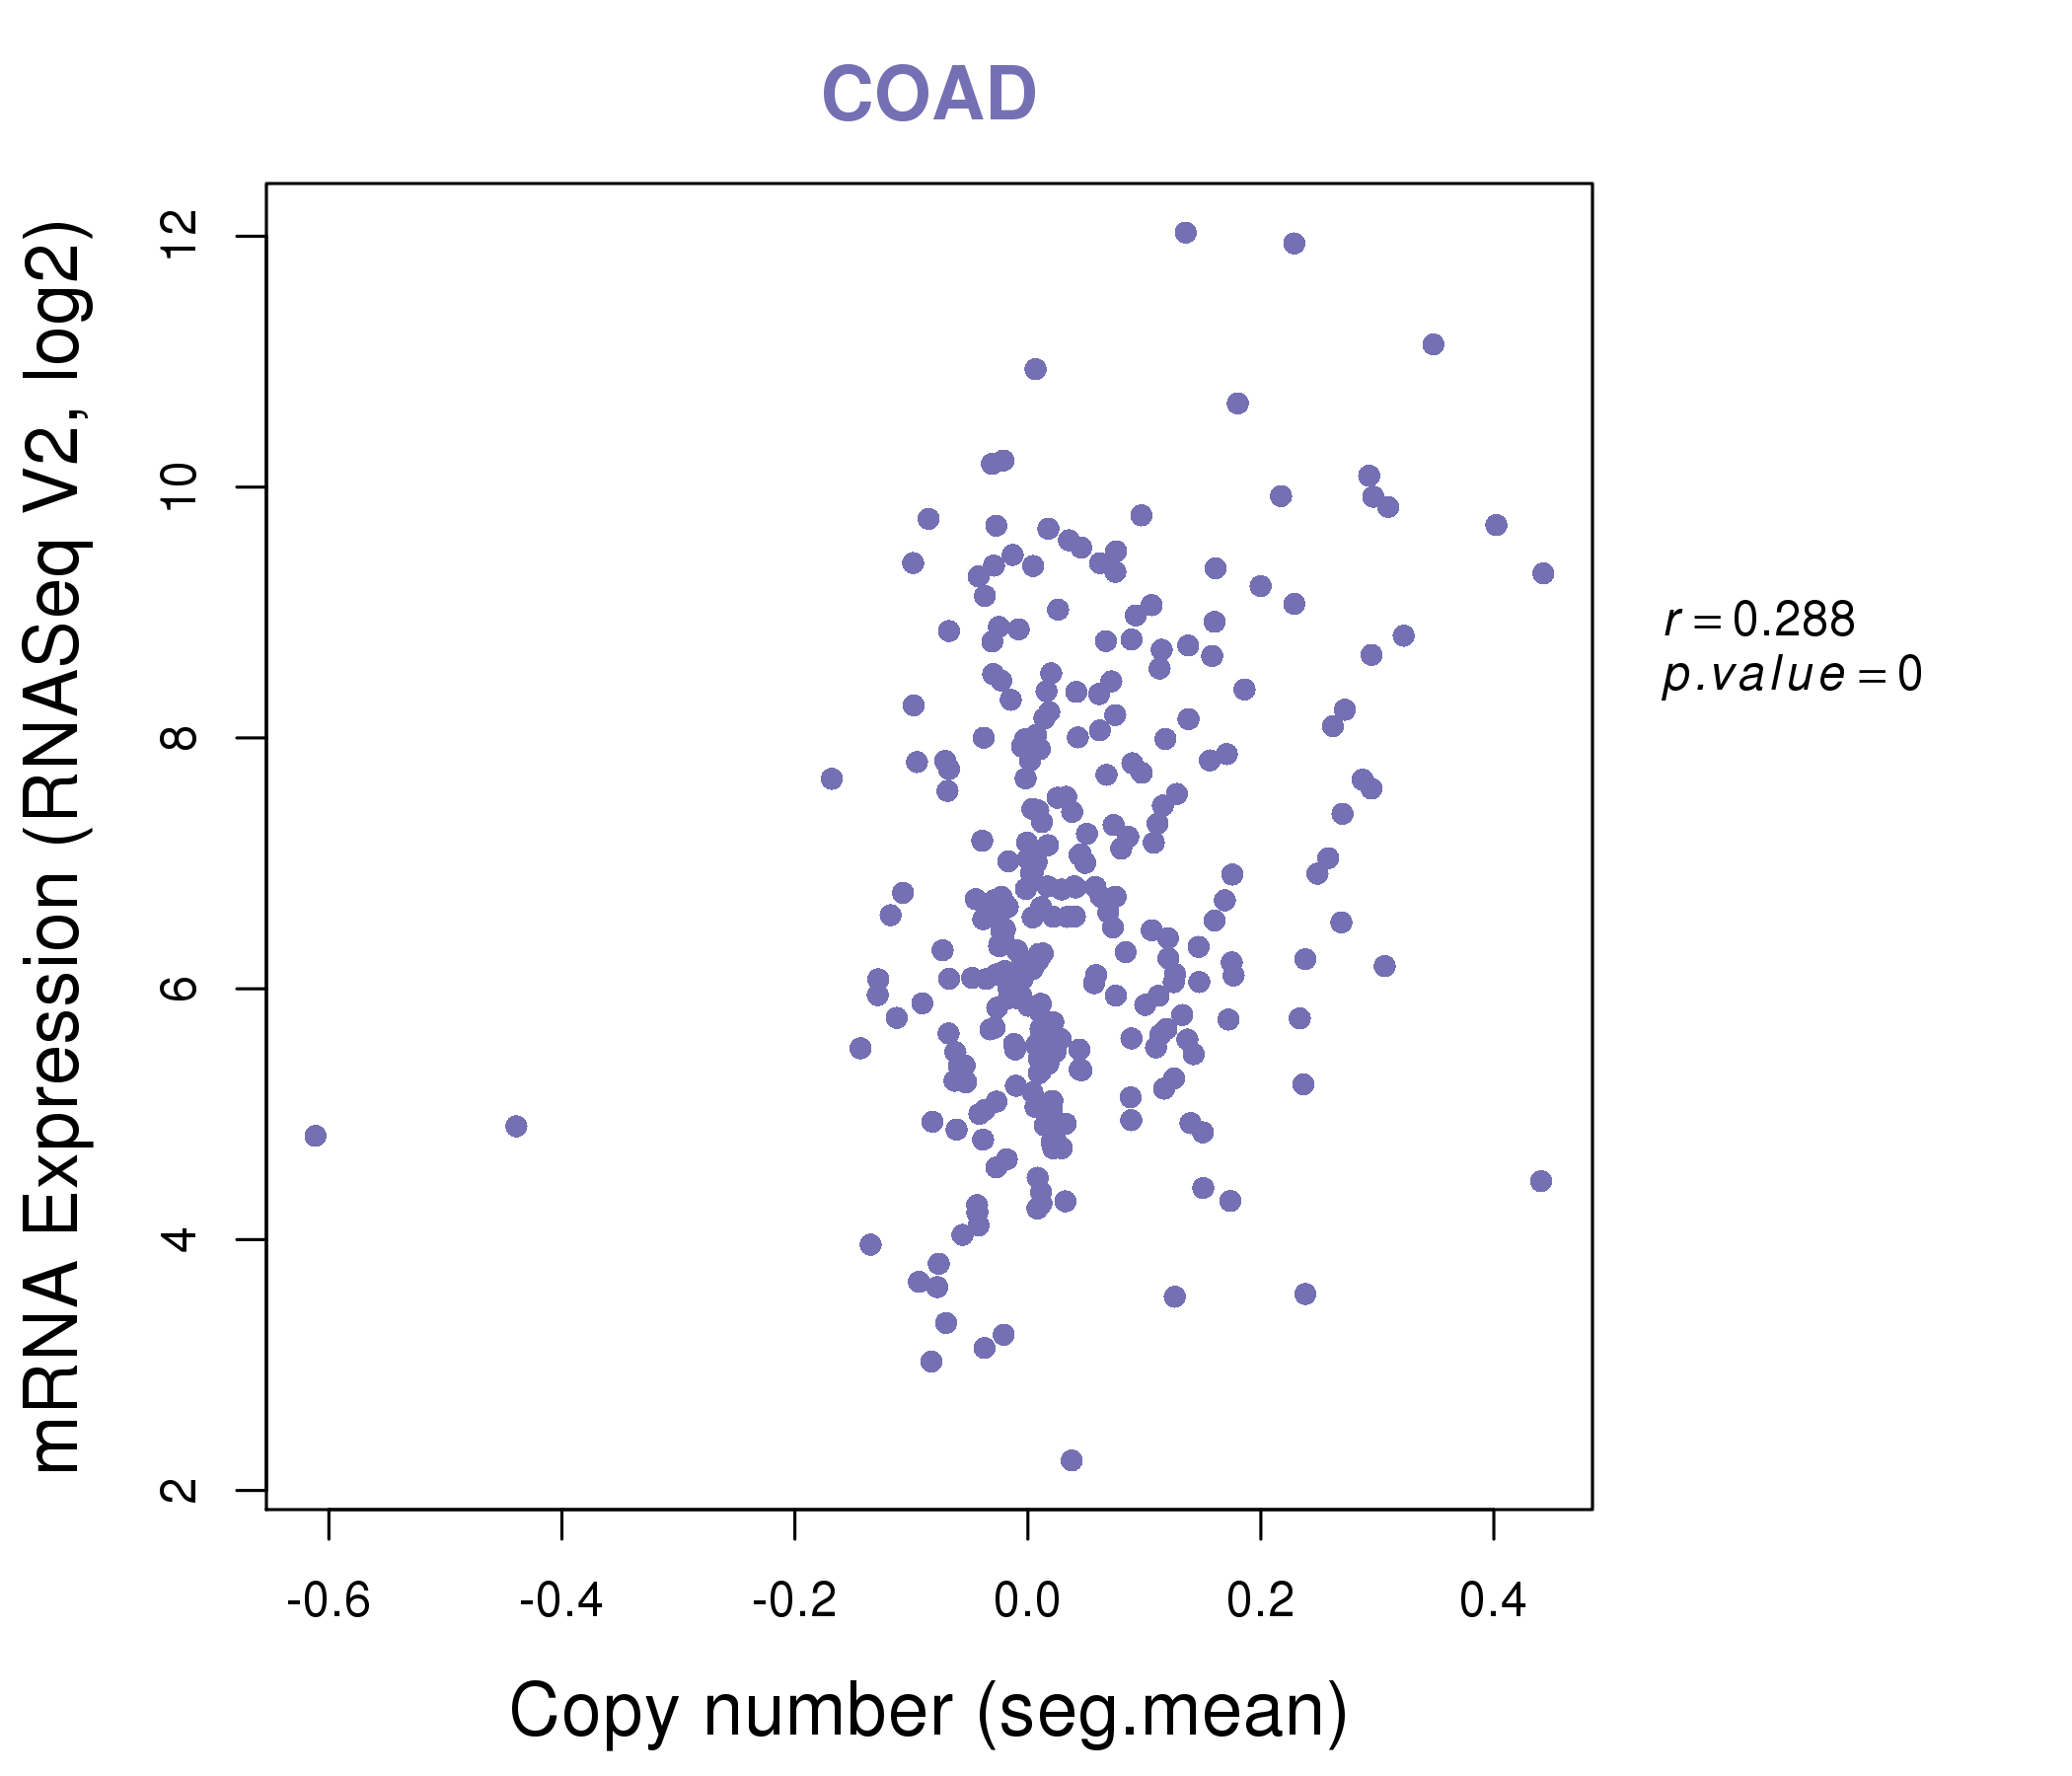
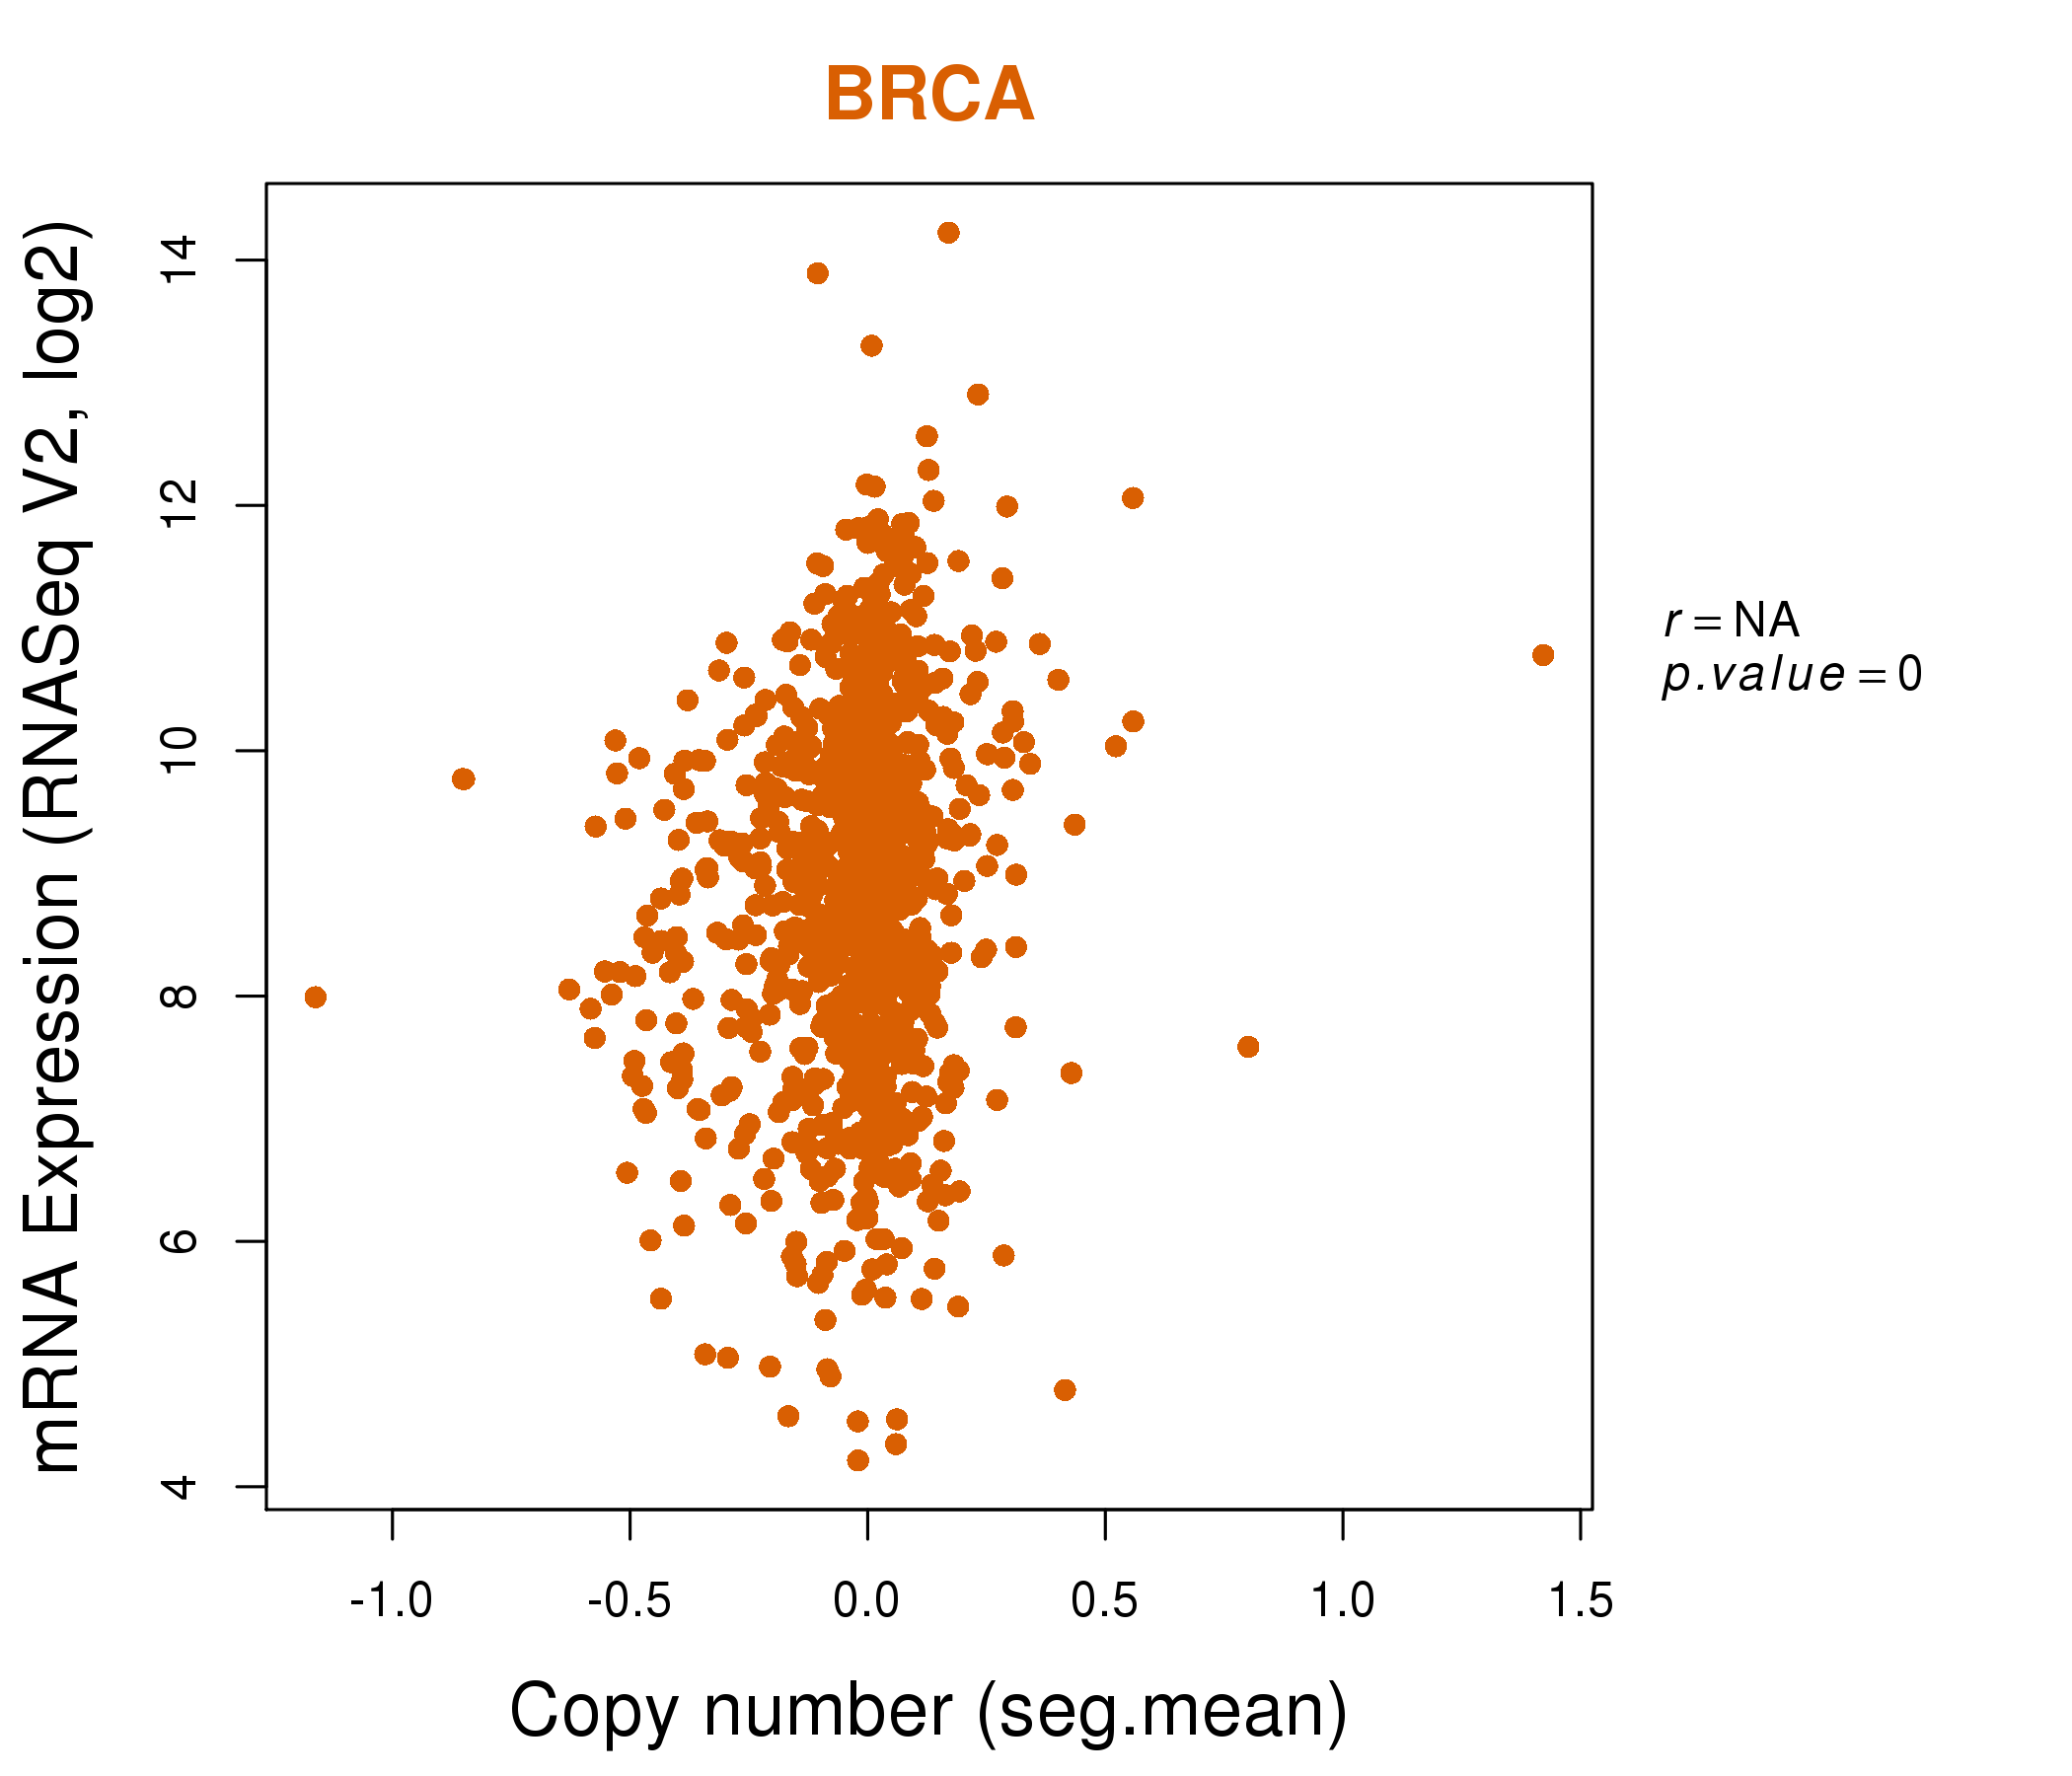
| * This plots show the correlation between CNV and gene expression. |
: Open all plots for all cancer types
 |
|
 |
|
| Top |
| Gene-Gene Network Information |
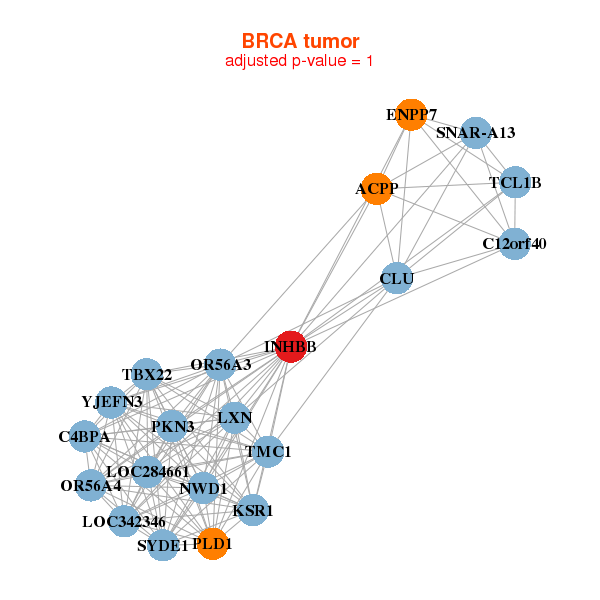
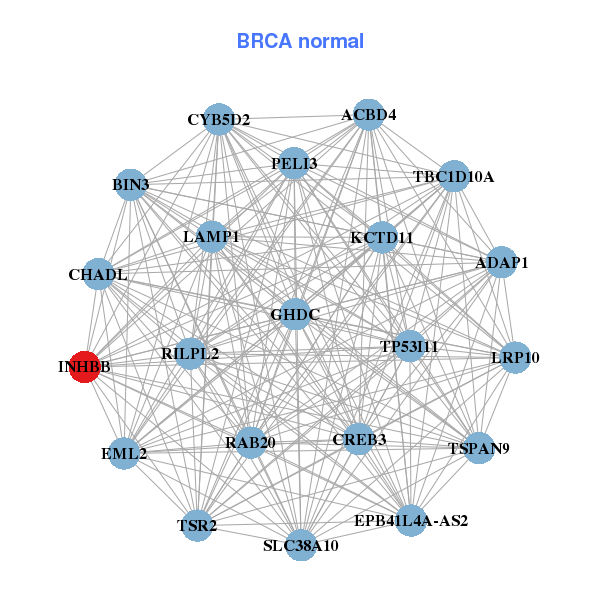
| * Co-Expression network figures were drawn using R package igraph. Only the top 20 genes with the highest correlations were shown. Red circle: input gene, orange circle: cell metabolism gene, sky circle: other gene |
: Open all plots for all cancer types
 |
|
| ACPP,C12orf40,C4BPA,CLU,ENPP7,INHBB,KSR1, LOC284661,LOC342346,LXN,NWD1,OR56A3,OR56A4,PKN3, PLD1,SNAR-A13,SYDE1,TBX22,TCL1B,TMC1,YJEFN3 | ACBD4,ADAP1,BIN3,CHADL,CREB3,CYB5D2,EML2, EPB41L4A-AS2,GHDC,INHBB,KCTD11,LAMP1,LRP10,PELI3, RAB20,RILPL2,SLC38A10,TBC1D10A,TP53I11,TSPAN9,TSR2 |
 |
|
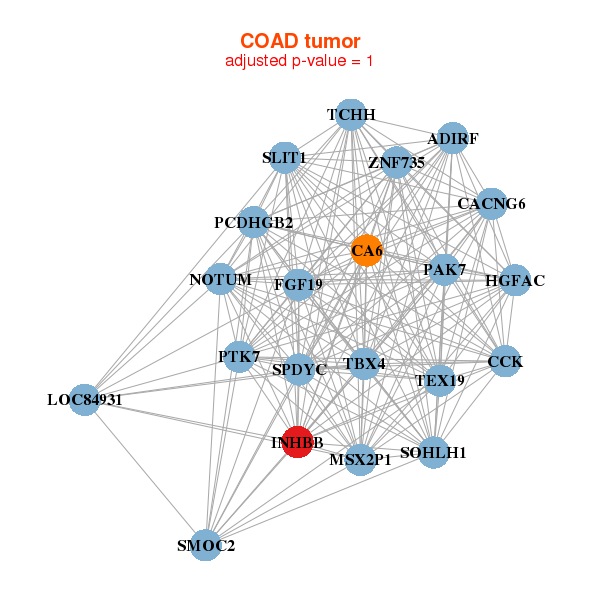
| ADIRF,CA6,CACNG6,CCK,FGF19,HGFAC,INHBB, LOC84931,MSX2P1,NOTUM,PAK7,PCDHGB2,PTK7,SLIT1, SMOC2,SOHLH1,SPDYC,TBX4,TCHH,TEX19,ZNF735 | AEBP1,ADM5,CLDN5,CYP1B1,ENPP2,FAM198A,GGT5, GRASP,FAM110D,IL1R1,INHBB,LOC441454,LRRC32,MMP14, NOTCH3,OVCH1,PDGFRB,S1PR1,SHANK3,SNAI1,SOX18 |

| * Co-Expression network figures were drawn using R package igraph. Only the top 20 genes with the highest correlations were shown. Red circle: input gene, orange circle: cell metabolism gene, sky circle: other gene |
: Open all plots for all cancer types
| Top |
: Open all interacting genes' information including KEGG pathway for all interacting genes from DAVID
| Top |
| Pharmacological Information for INHBB |
| There's no related Drug. |
| Top |
| Cross referenced IDs for INHBB |
| * We obtained these cross-references from Uniprot database. It covers 150 different DBs, 18 categories. http://www.uniprot.org/help/cross_references_section |
: Open all cross reference information
|
Copyright © 2016-Present - The Univsersity of Texas Health Science Center at Houston @ |