|
|||||||||||||||||||||||||||||||||||||||||||||||||||||||||||||||||||||||||||||||||||||||||||||||||||||||||||||||||||||||||||||||||||||||||||||||||||||||||||||||||||||||||||||||||||||||||||||||||||||||||||||||||||||||||||||||||||||||||||||||||||||||||||||||||||||||||||||||||||||||||||||||||||||||||||||||||||||||||||||||||||||||||||||
| |
| Phenotypic Information (metabolism pathway, cancer, disease, phenome) |
| |
| |
| Gene-Gene Network Information: Co-Expression Network, Interacting Genes & KEGG |
| |
|


| Gene Summary for INPP1 |
| Basic gene info. | Gene symbol | INPP1 |
| Gene name | inositol polyphosphate-1-phosphatase | |
| Synonyms | - | |
| Cytomap | UCSC genome browser: 2q32 | |
| Genomic location | chr2 :191208195-191236391 | |
| Type of gene | protein-coding | |
| RefGenes | NM_001128928.1, NM_002194.3, | |
| Ensembl id | ENSG00000151689 | |
| Description | IPPIPPaseinositol polyphosphate 1-phosphatase | |
| Modification date | 20141207 | |
| dbXrefs | MIM : 147263 | |
| HGNC : HGNC | ||
| Ensembl : ENSG00000151689 | ||
| HPRD : 00923 | ||
| Vega : OTTHUMG00000132672 | ||
| Protein | UniProt: go to UniProt's Cross Reference DB Table | |
| Expression | CleanEX: HS_INPP1 | |
| BioGPS: 3628 | ||
| Gene Expression Atlas: ENSG00000151689 | ||
| The Human Protein Atlas: ENSG00000151689 | ||
| Pathway | NCI Pathway Interaction Database: INPP1 | |
| KEGG: INPP1 | ||
| REACTOME: INPP1 | ||
| ConsensusPathDB | ||
| Pathway Commons: INPP1 | ||
| Metabolism | MetaCyc: INPP1 | |
| HUMANCyc: INPP1 | ||
| Regulation | Ensembl's Regulation: ENSG00000151689 | |
| miRBase: chr2 :191,208,195-191,236,391 | ||
| TargetScan: NM_001128928 | ||
| cisRED: ENSG00000151689 | ||
| Context | iHOP: INPP1 | |
| cancer metabolism search in PubMed: INPP1 | ||
| UCL Cancer Institute: INPP1 | ||
| Assigned class in ccmGDB | C | |
| Top |
| Phenotypic Information for INPP1(metabolism pathway, cancer, disease, phenome) |
| Cancer | CGAP: INPP1 |
| Familial Cancer Database: INPP1 | |
| * This gene is included in those cancer gene databases. |
|
|
|
|
|
| . | |||||||||||||||||||||||||||||||||||||||||||||||||||||||||||||||||||||||||||||||||||||||||||||||||||||||||||||||||||||||||||||||||||||||||||||||||||||||||||||||||||||||||||||||||||||||||||||||||||||||||||||||||||||||||||||||||||||||||||||||||||||||||||||||||||||||||||||||||||||||||||||||||||||||||||||||||||||||||||||||||||||||
Oncogene 1 | Significant driver gene in | ||||||||||||||||||||||||||||||||||||||||||||||||||||||||||||||||||||||||||||||||||||||||||||||||||||||||||||||||||||||||||||||||||||||||||||||||||||||||||||||||||||||||||||||||||||||||||||||||||||||||||||||||||||||||||||||||||||||||||||||||||||||||||||||||||||||||||||||||||||||||||||||||||||||||||||||||||||||||||||||||||||||||||||
| cf) number; DB name 1 Oncogene; http://nar.oxfordjournals.org/content/35/suppl_1/D721.long, 2 Tumor Suppressor gene; https://bioinfo.uth.edu/TSGene/, 3 Cancer Gene Census; http://www.nature.com/nrc/journal/v4/n3/abs/nrc1299.html, 4 CancerGenes; http://nar.oxfordjournals.org/content/35/suppl_1/D721.long, 5 Network of Cancer Gene; http://ncg.kcl.ac.uk/index.php, 1Therapeutic Vulnerabilities in Cancer; http://cbio.mskcc.org/cancergenomics/statius/ |
| KEGG_INOSITOL_PHOSPHATE_METABOLISM | |
| OMIM | |
| Orphanet | |
| Disease | KEGG Disease: INPP1 |
| MedGen: INPP1 (Human Medical Genetics with Condition) | |
| ClinVar: INPP1 | |
| Phenotype | MGI: INPP1 (International Mouse Phenotyping Consortium) |
| PhenomicDB: INPP1 | |
| Mutations for INPP1 |
| * Under tables are showing count per each tissue to give us broad intuition about tissue specific mutation patterns.You can go to the detailed page for each mutation database's web site. |
| There's no structural variation information in COSMIC data for this gene. |
| * From mRNA Sanger sequences, Chitars2.0 arranged chimeric transcripts. This table shows INPP1 related fusion information. |
| ID | Head Gene | Tail Gene | Accession | Gene_a | qStart_a | qEnd_a | Chromosome_a | tStart_a | tEnd_a | Gene_a | qStart_a | qEnd_a | Chromosome_a | tStart_a | tEnd_a |
| CK001646 | TMBIM6 | 4 | 59 | 12 | 50135340 | 50135395 | INPP1 | 57 | 673 | 2 | 191231419 | 191235819 | |
| BE720207 | PSMD2 | 6 | 279 | 3 | 184021161 | 184021806 | INPP1 | 260 | 458 | 2 | 191236012 | 191236210 | |
| BE720196 | PSMD2 | 2 | 285 | 3 | 184021161 | 184021818 | INPP1 | 266 | 464 | 2 | 191236012 | 191236210 | |
| Top |
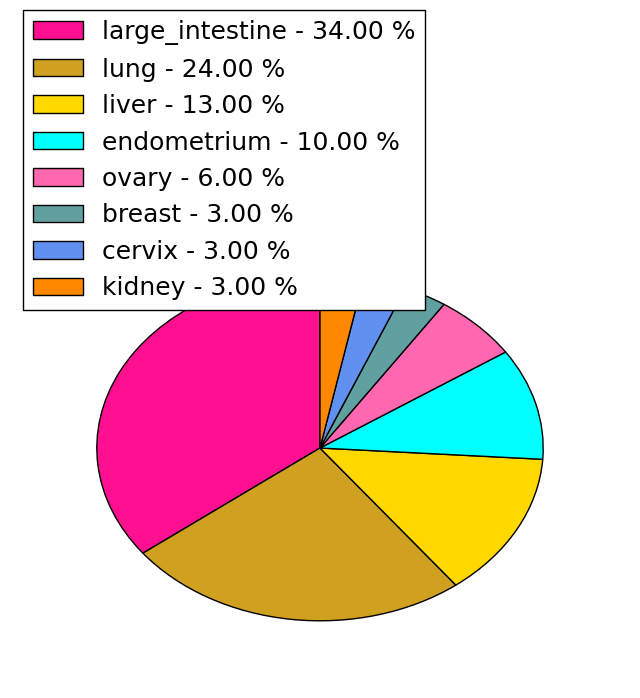
| Mutation type/ Tissue ID | brca | cns | cerv | endome | haematopo | kidn | Lintest | liver | lung | ns | ovary | pancre | prost | skin | stoma | thyro | urina | |||
| Total # sample | 3 | 1 | 1 | |||||||||||||||||
| GAIN (# sample) | 1 | |||||||||||||||||||
| LOSS (# sample) | 3 | 1 |
| cf) Tissue ID; Tissue type (1; Breast, 2; Central_nervous_system, 3; Cervix, 4; Endometrium, 5; Haematopoietic_and_lymphoid_tissue, 6; Kidney, 7; Large_intestine, 8; Liver, 9; Lung, 10; NS, 11; Ovary, 12; Pancreas, 13; Prostate, 14; Skin, 15; Stomach, 16; Thyroid, 17; Urinary_tract) |
| Top |
|
 |
| Top |
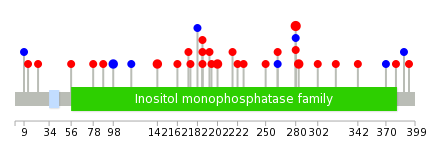
| Stat. for Non-Synonymous SNVs (# total SNVs=29) | (# total SNVs=7) |
 |  |
(# total SNVs=0) | (# total SNVs=0) |
| Top |
| * When you move the cursor on each content, you can see more deailed mutation information on the Tooltip. Those are primary_site,primary_histology,mutation(aa),pubmedID. |
| GRCh37 position | Mutation(aa) | Unique sampleID count |
| chr2:191235766-191235766 | p.C280R | 3 |
| chr2:191233921-191233921 | p.G187C | 2 |
| chr2:191235775-191235775 | p.R283C | 2 |
| chr2:191231449-191231449 | p.S98S | 2 |
| chr2:191233967-191233967 | p.N202S | 2 |
| chr2:191231580-191231580 | p.N142S | 2 |
| chr2:191233880-191233880 | p.G173E | 1 |
| chr2:191235676-191235676 | p.T250P | 1 |
| chr2:191224855-191224855 | p.L9L | 1 |
| chr2:191236066-191236066 | p.R380W | 1 |
| Top |
|
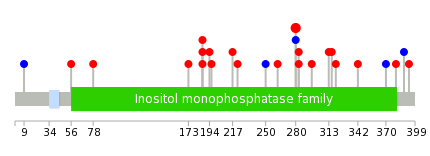 |
| Point Mutation/ Tissue ID | 1 | 2 | 3 | 4 | 5 | 6 | 7 | 8 | 9 | 10 | 11 | 12 | 13 | 14 | 15 | 16 | 17 | 18 | 19 | 20 |
| # sample | 1 | 1 | 1 | 9 | 2 | 7 | 1 | 1 | 2 | 3 | ||||||||||
| # mutation | 1 | 1 | 1 | 7 | 2 | 7 | 1 | 1 | 2 | 3 | ||||||||||
| nonsynonymous SNV | 1 | 1 | 6 | 2 | 5 | 1 | 1 | 2 | 2 | |||||||||||
| synonymous SNV | 1 | 1 | 2 | 1 |
| cf) Tissue ID; Tissue type (1; BLCA[Bladder Urothelial Carcinoma], 2; BRCA[Breast invasive carcinoma], 3; CESC[Cervical squamous cell carcinoma and endocervical adenocarcinoma], 4; COAD[Colon adenocarcinoma], 5; GBM[Glioblastoma multiforme], 6; Glioma Low Grade, 7; HNSC[Head and Neck squamous cell carcinoma], 8; KICH[Kidney Chromophobe], 9; KIRC[Kidney renal clear cell carcinoma], 10; KIRP[Kidney renal papillary cell carcinoma], 11; LAML[Acute Myeloid Leukemia], 12; LUAD[Lung adenocarcinoma], 13; LUSC[Lung squamous cell carcinoma], 14; OV[Ovarian serous cystadenocarcinoma ], 15; PAAD[Pancreatic adenocarcinoma], 16; PRAD[Prostate adenocarcinoma], 17; SKCM[Skin Cutaneous Melanoma], 18:STAD[Stomach adenocarcinoma], 19:THCA[Thyroid carcinoma], 20:UCEC[Uterine Corpus Endometrial Carcinoma]) |
| Top |
| * We represented just top 10 SNVs. When you move the cursor on each content, you can see more deailed mutation information on the Tooltip. Those are primary_site, primary_histology, mutation(aa), pubmedID. |
| Genomic Position | Mutation(aa) | Unique sampleID count |
| chr2:191235766 | p.C280R,INPP1 | 3 |
| chr2:191233921 | p.G187S,INPP1 | 2 |
| chr2:191235678 | p.R283C,INPP1 | 1 |
| chr2:191236038 | p.R283H,INPP1 | 1 |
| chr2:191224855 | p.L9L,INPP1 | 1 |
| chr2:191235713 | p.C296F,INPP1 | 1 |
| chr2:191236066 | p.L56Q,INPP1 | 1 |
| chr2:191224995 | p.F313L,INPP1 | 1 |
| chr2:191236092 | p.G78E,INPP1 | 1 |
| chr2:191227381 | p.D316Y,INPP1 | 1 |
| * Copy number data were extracted from TCGA using R package TCGA-Assembler. The URLs of all public data files on TCGA DCC data server were gathered on Jan-05-2015. Function ProcessCNAData in TCGA-Assembler package was used to obtain gene-level copy number value which is calculated as the average copy number of the genomic region of a gene. |
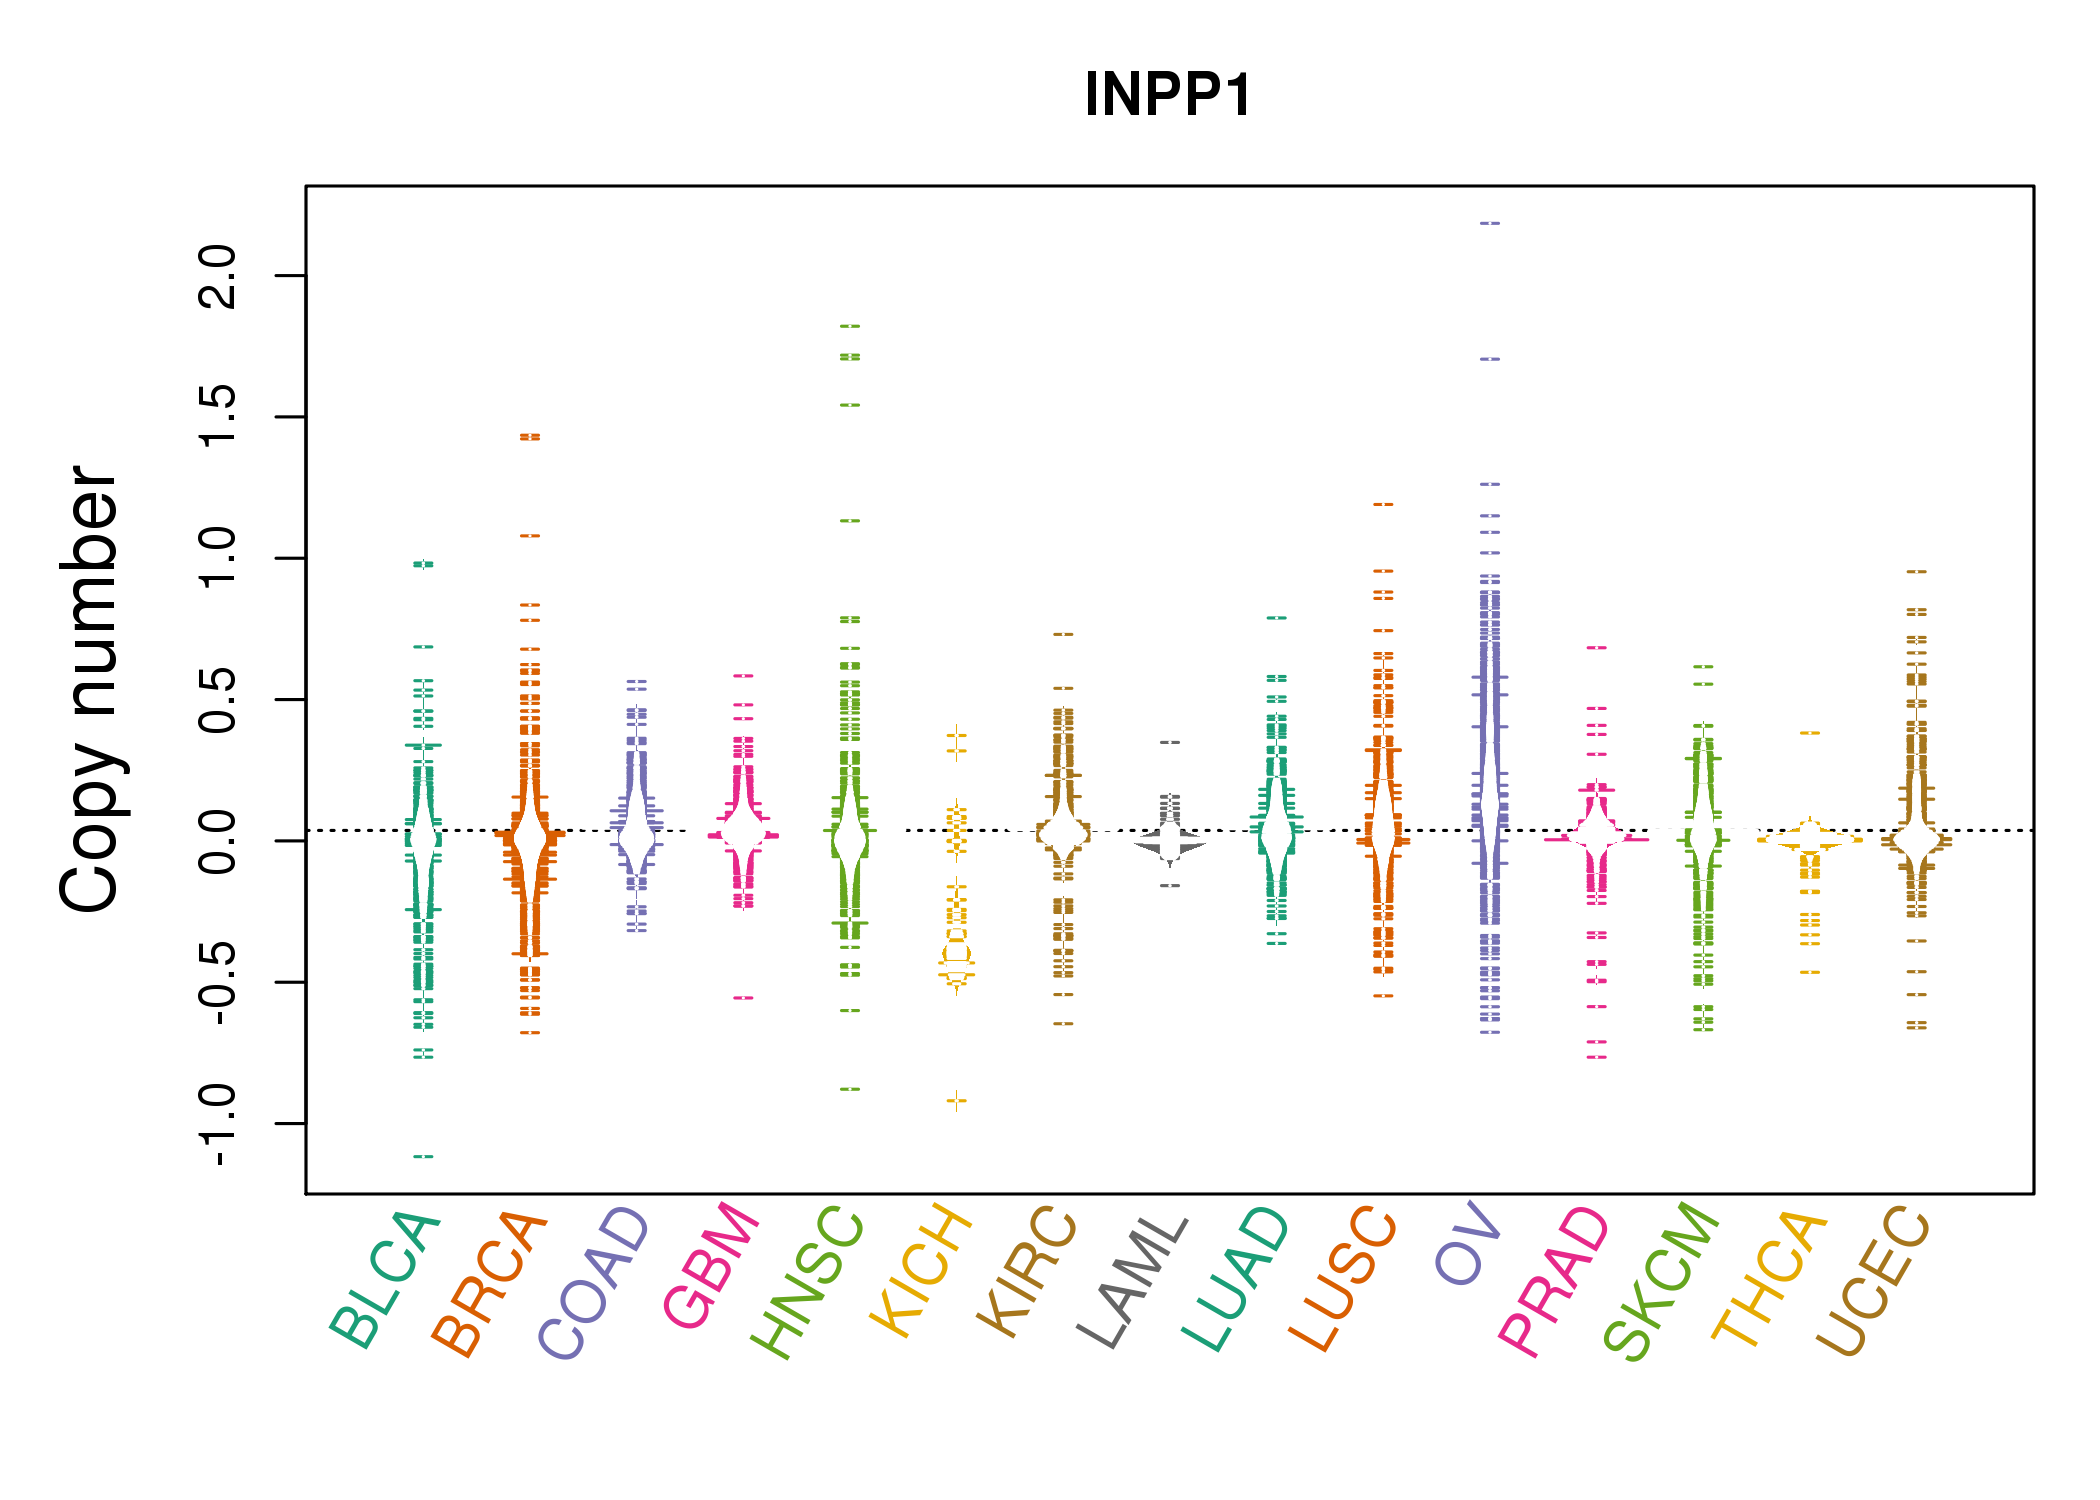 |
| cf) Tissue ID[Tissue type]: BLCA[Bladder Urothelial Carcinoma], BRCA[Breast invasive carcinoma], CESC[Cervical squamous cell carcinoma and endocervical adenocarcinoma], COAD[Colon adenocarcinoma], GBM[Glioblastoma multiforme], Glioma Low Grade, HNSC[Head and Neck squamous cell carcinoma], KICH[Kidney Chromophobe], KIRC[Kidney renal clear cell carcinoma], KIRP[Kidney renal papillary cell carcinoma], LAML[Acute Myeloid Leukemia], LUAD[Lung adenocarcinoma], LUSC[Lung squamous cell carcinoma], OV[Ovarian serous cystadenocarcinoma ], PAAD[Pancreatic adenocarcinoma], PRAD[Prostate adenocarcinoma], SKCM[Skin Cutaneous Melanoma], STAD[Stomach adenocarcinoma], THCA[Thyroid carcinoma], UCEC[Uterine Corpus Endometrial Carcinoma] |
| Top |
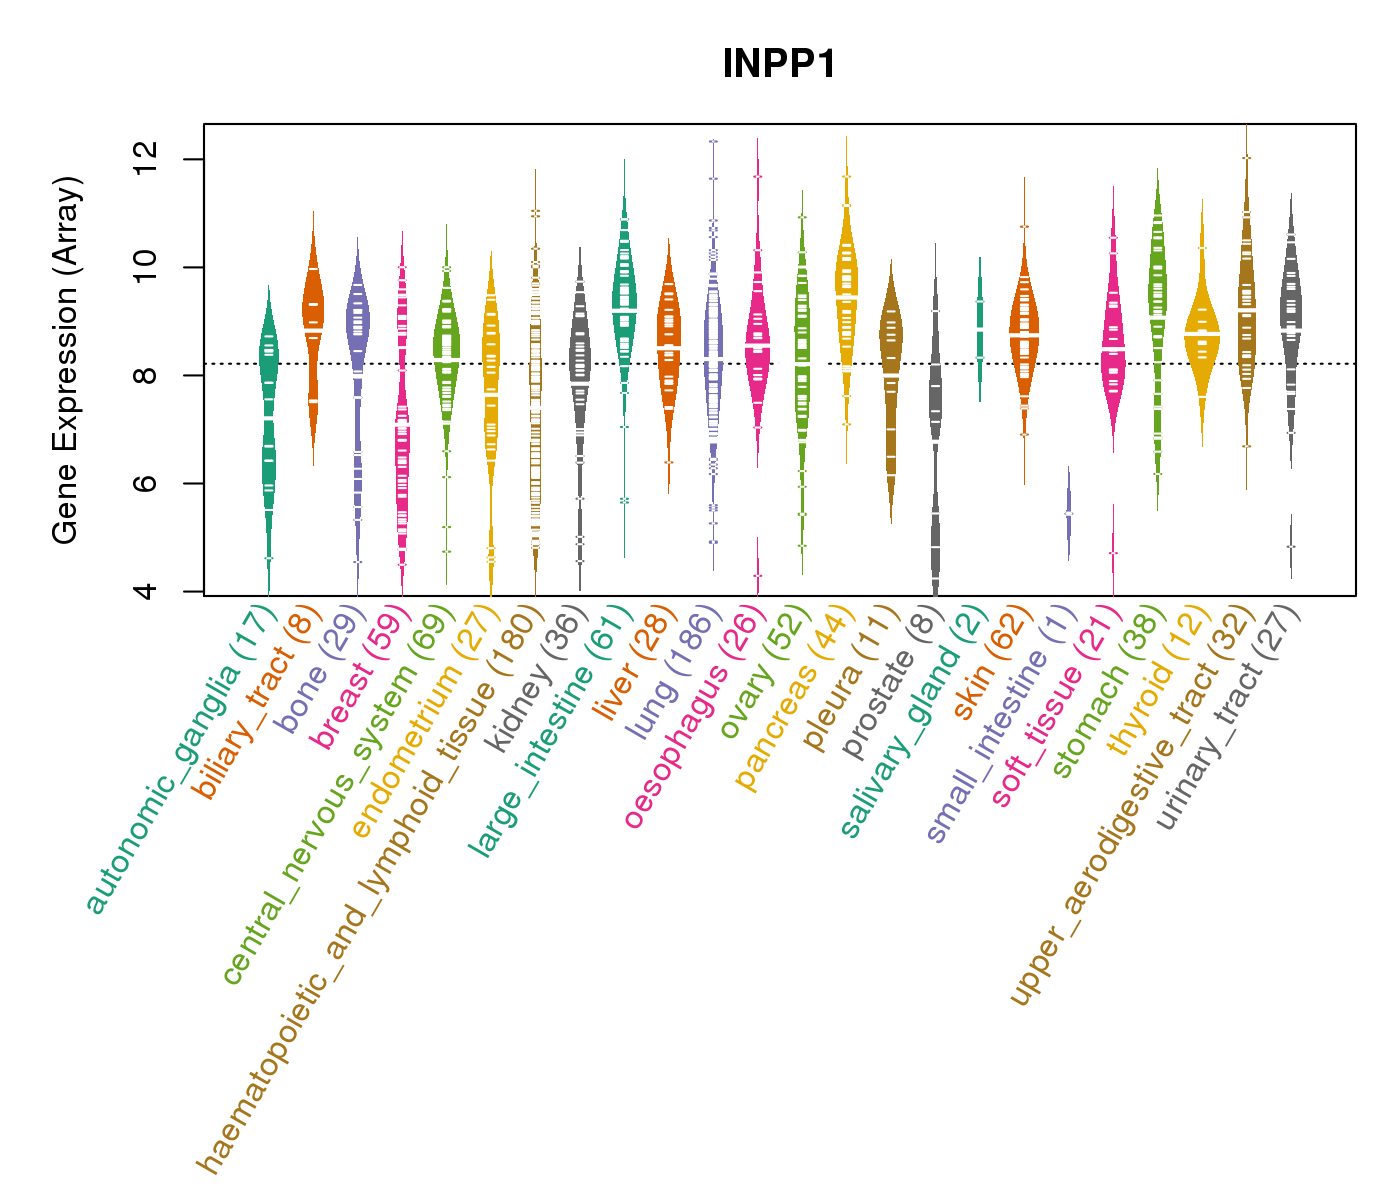
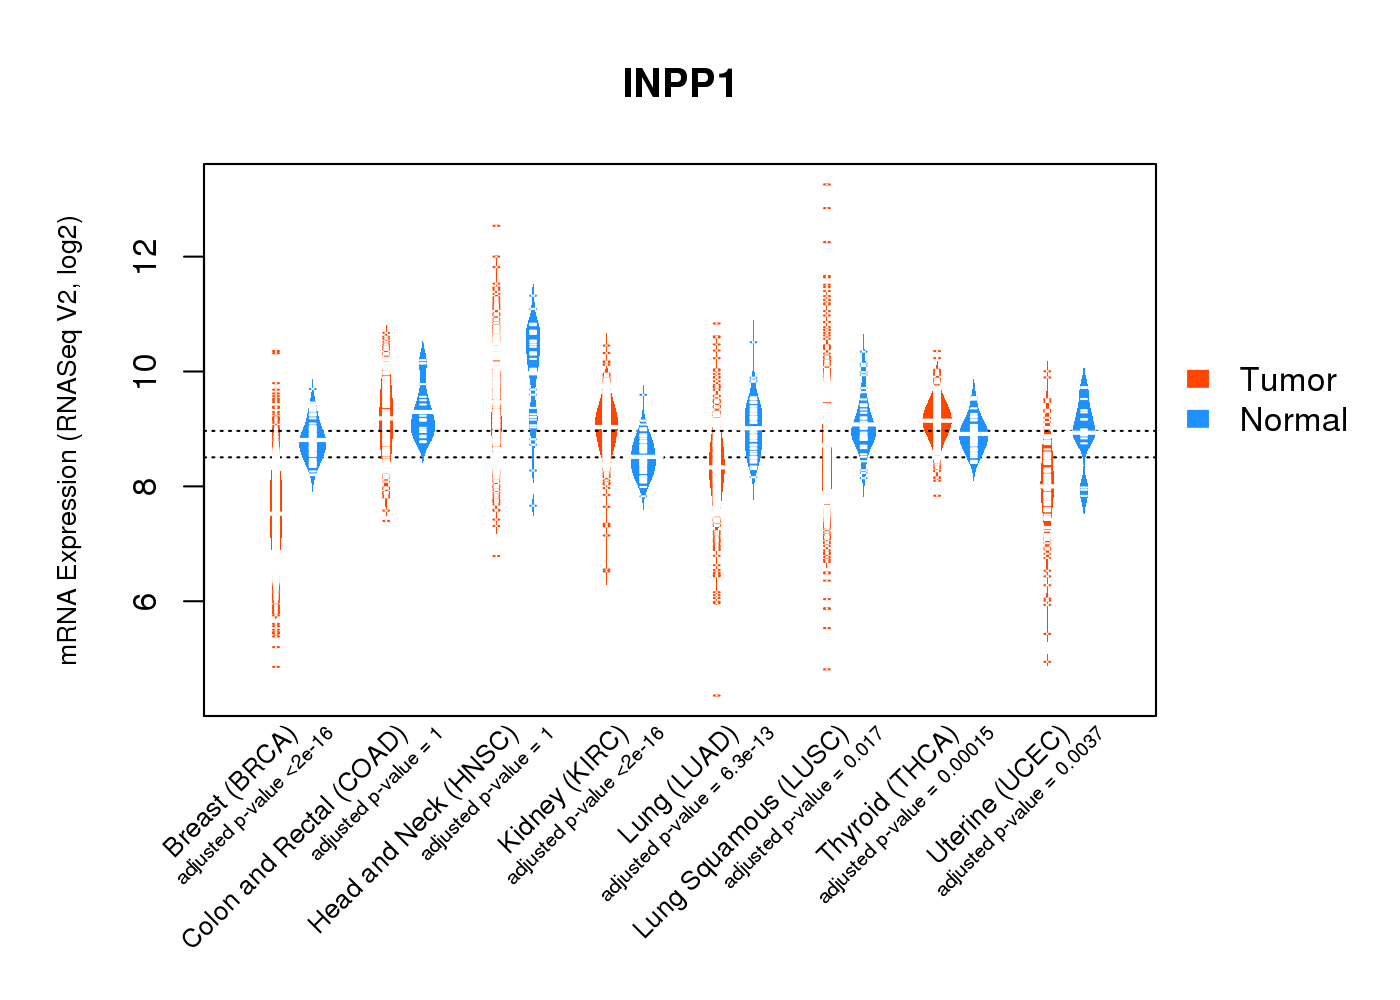
| Gene Expression for INPP1 |
| * CCLE gene expression data were extracted from CCLE_Expression_Entrez_2012-10-18.res: Gene-centric RMA-normalized mRNA expression data. |
 |
| * Normalized gene expression data of RNASeqV2 was extracted from TCGA using R package TCGA-Assembler. The URLs of all public data files on TCGA DCC data server were gathered at Jan-05-2015. Only eight cancer types have enough normal control samples for differential expression analysis. (t test, adjusted p<0.05 (using Benjamini-Hochberg FDR)) |
 |
| Top |
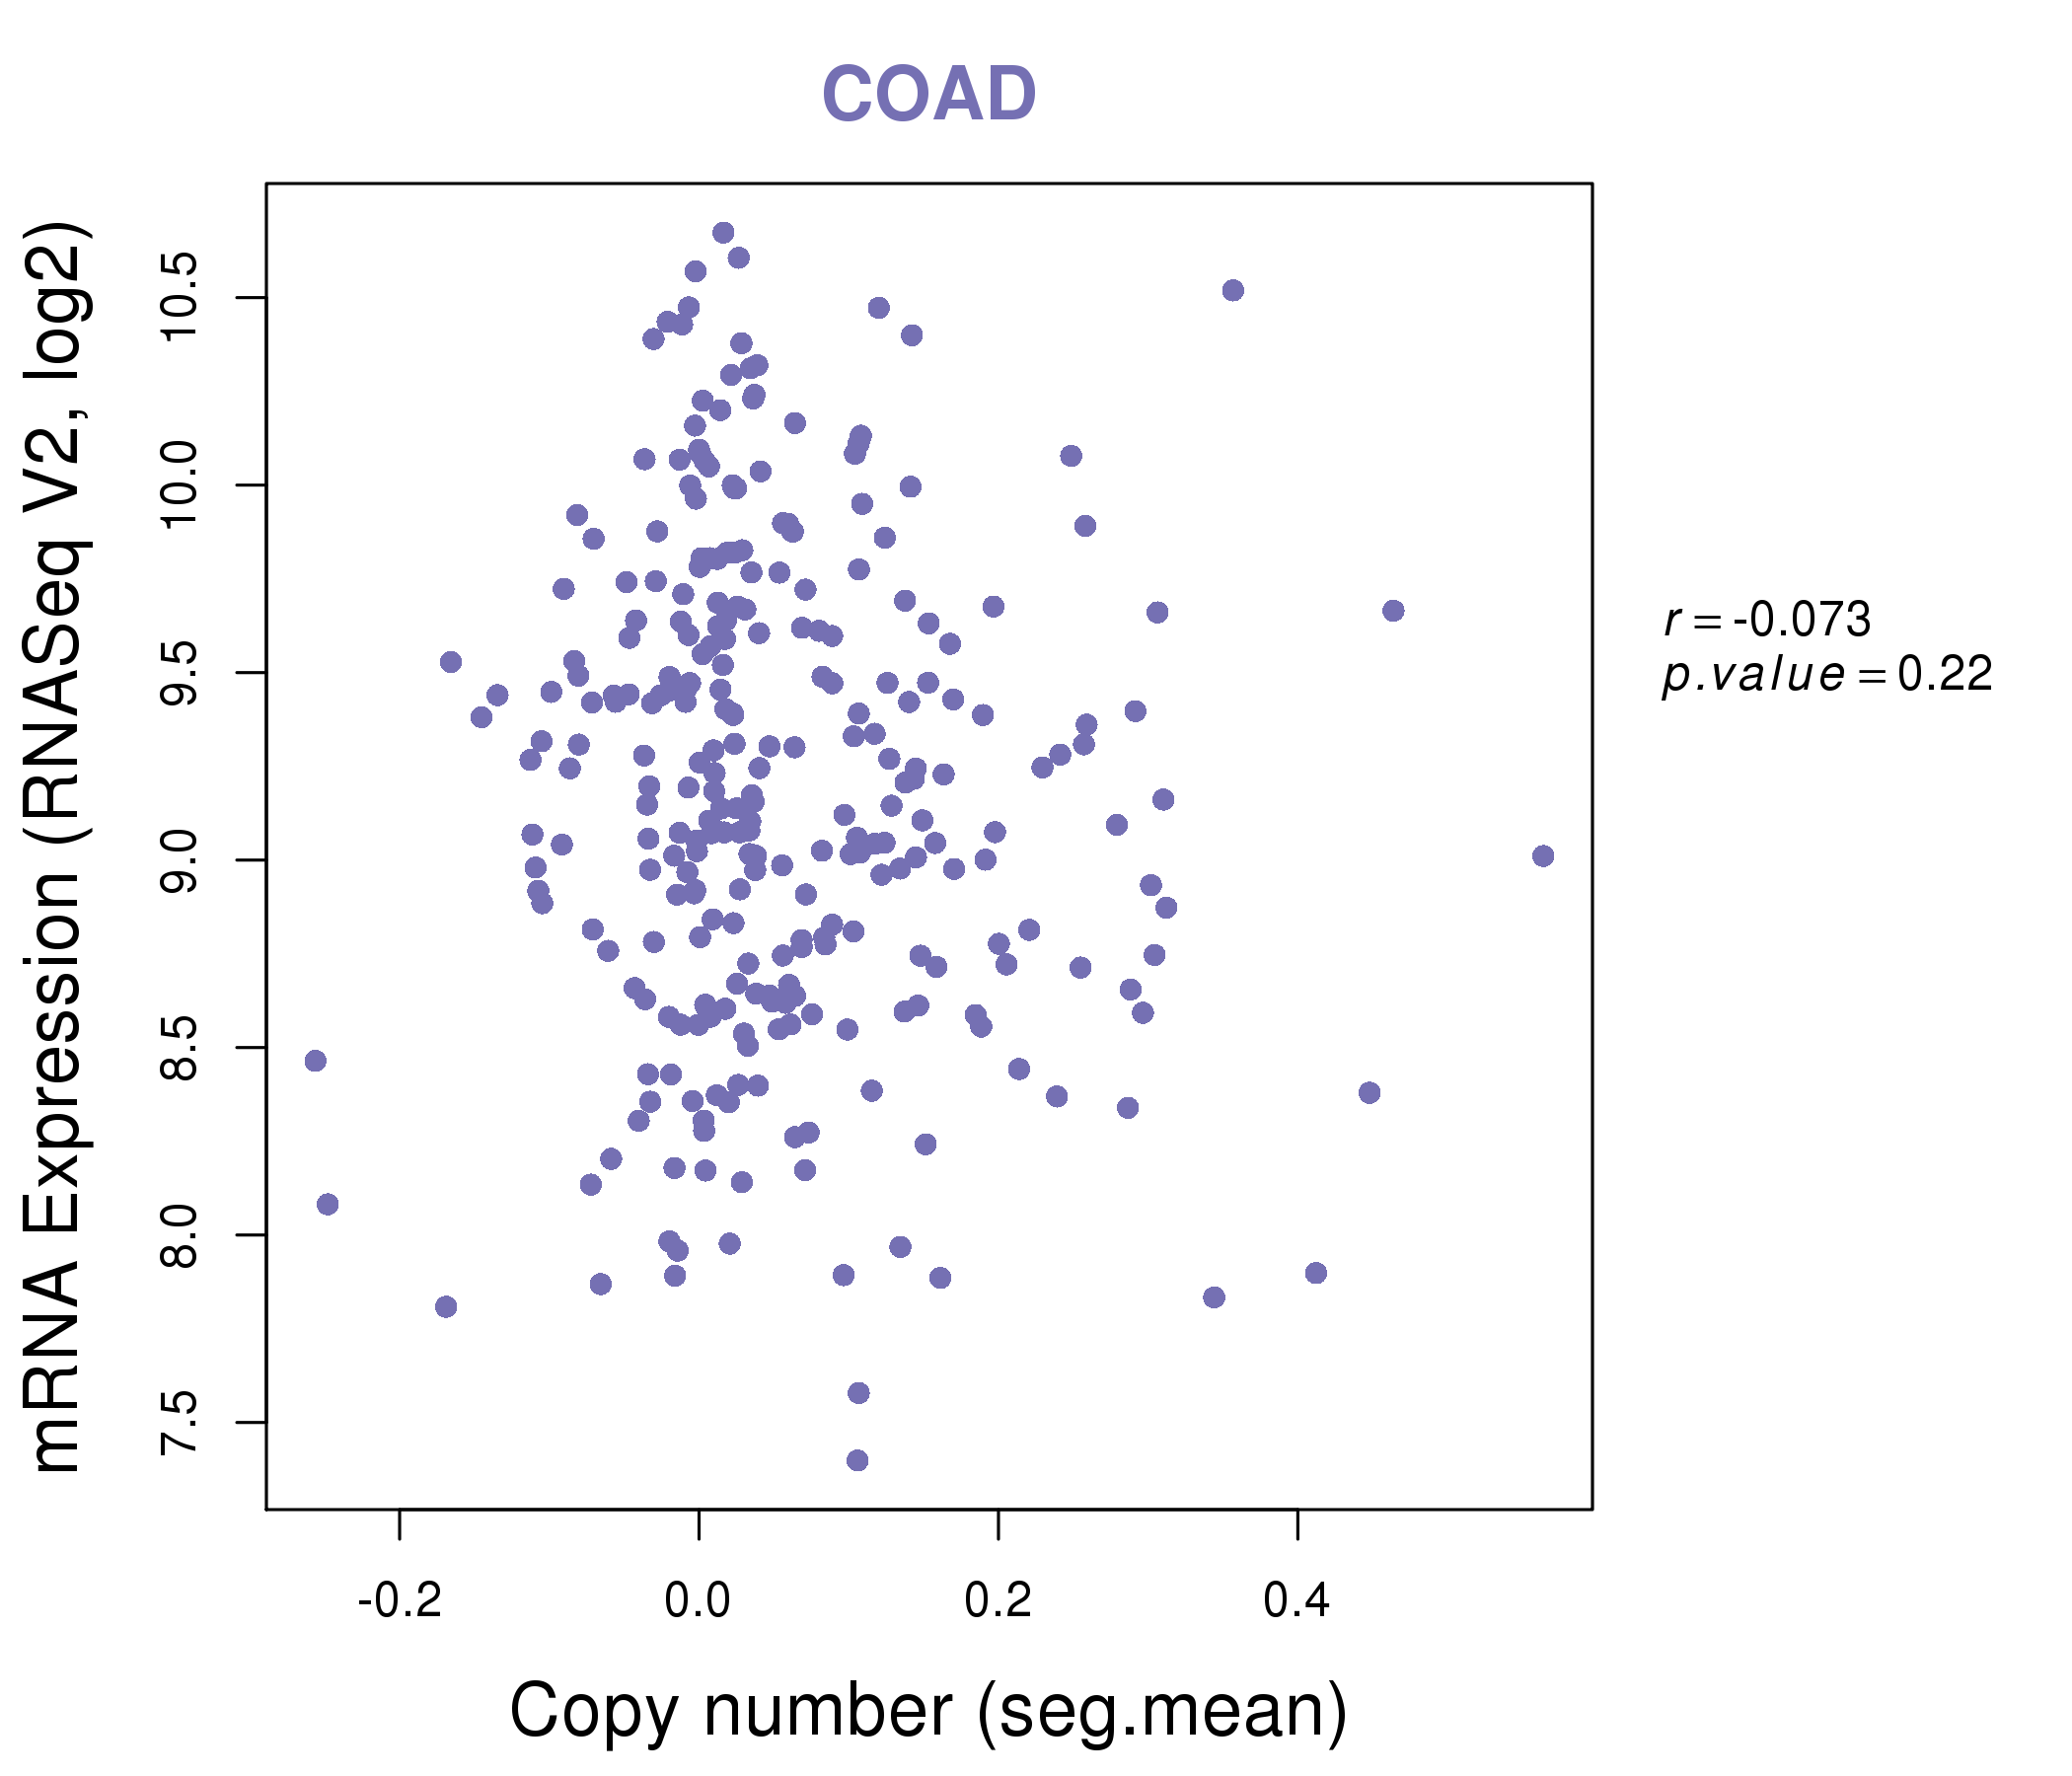
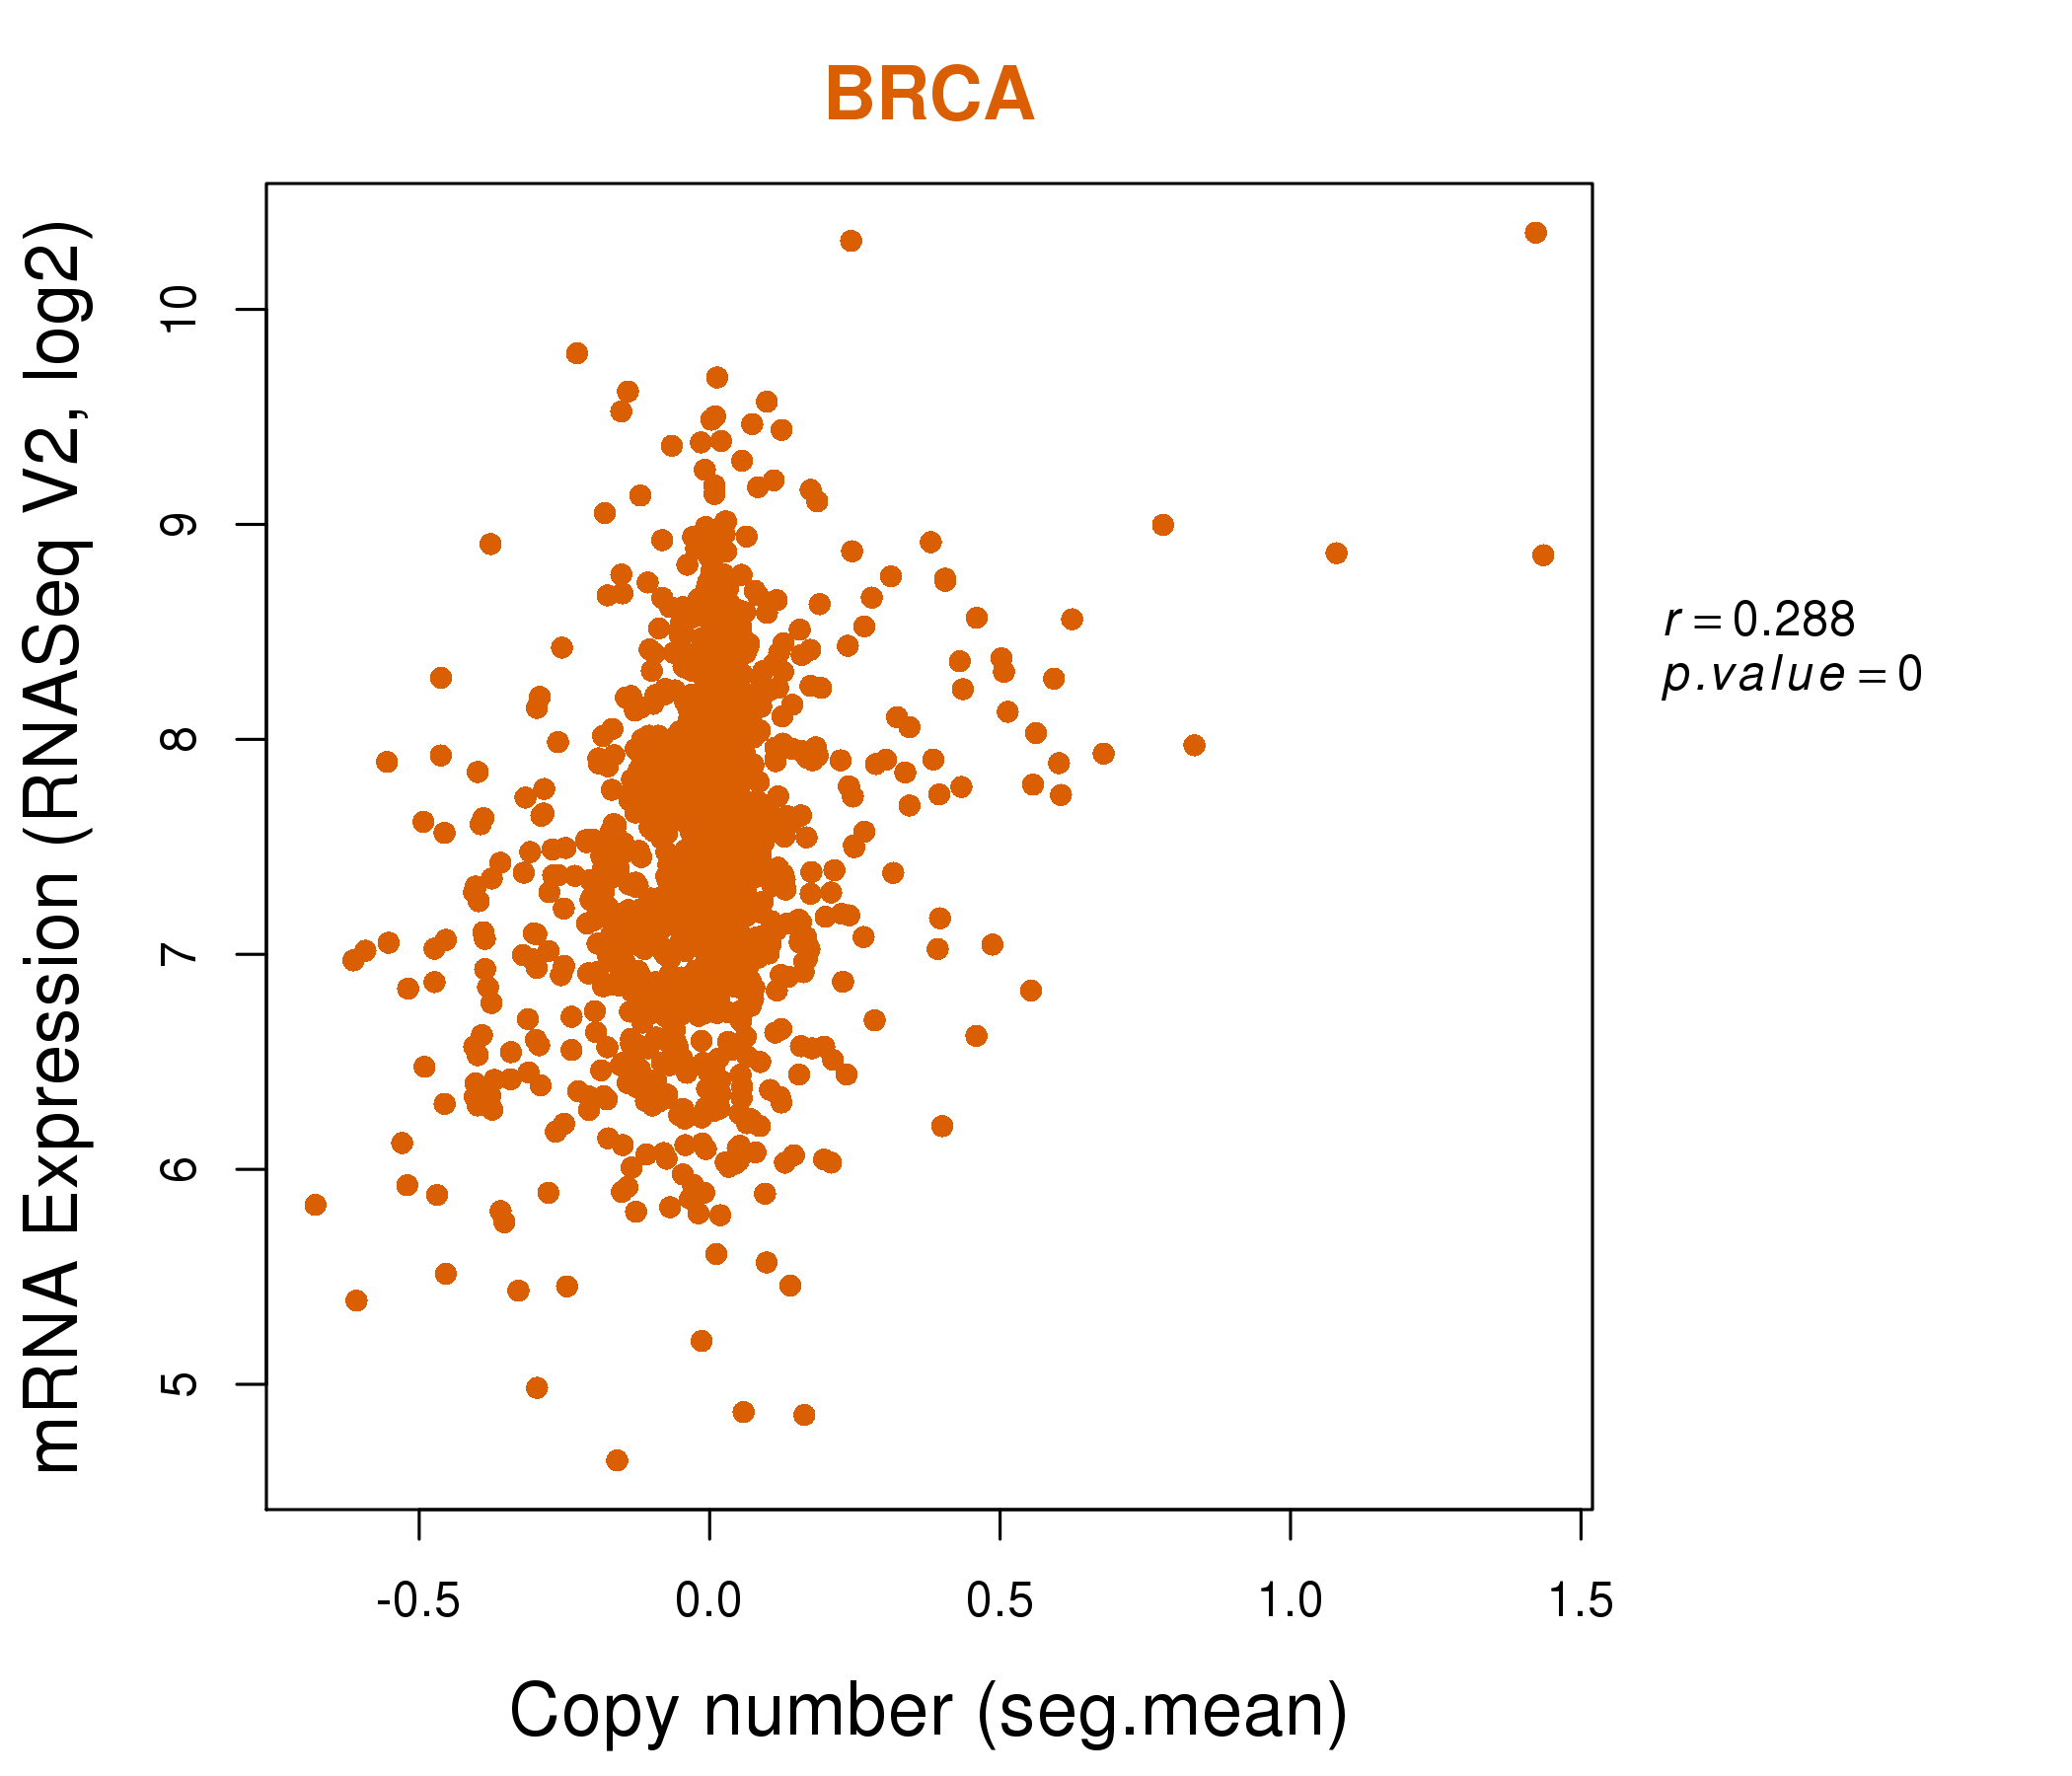
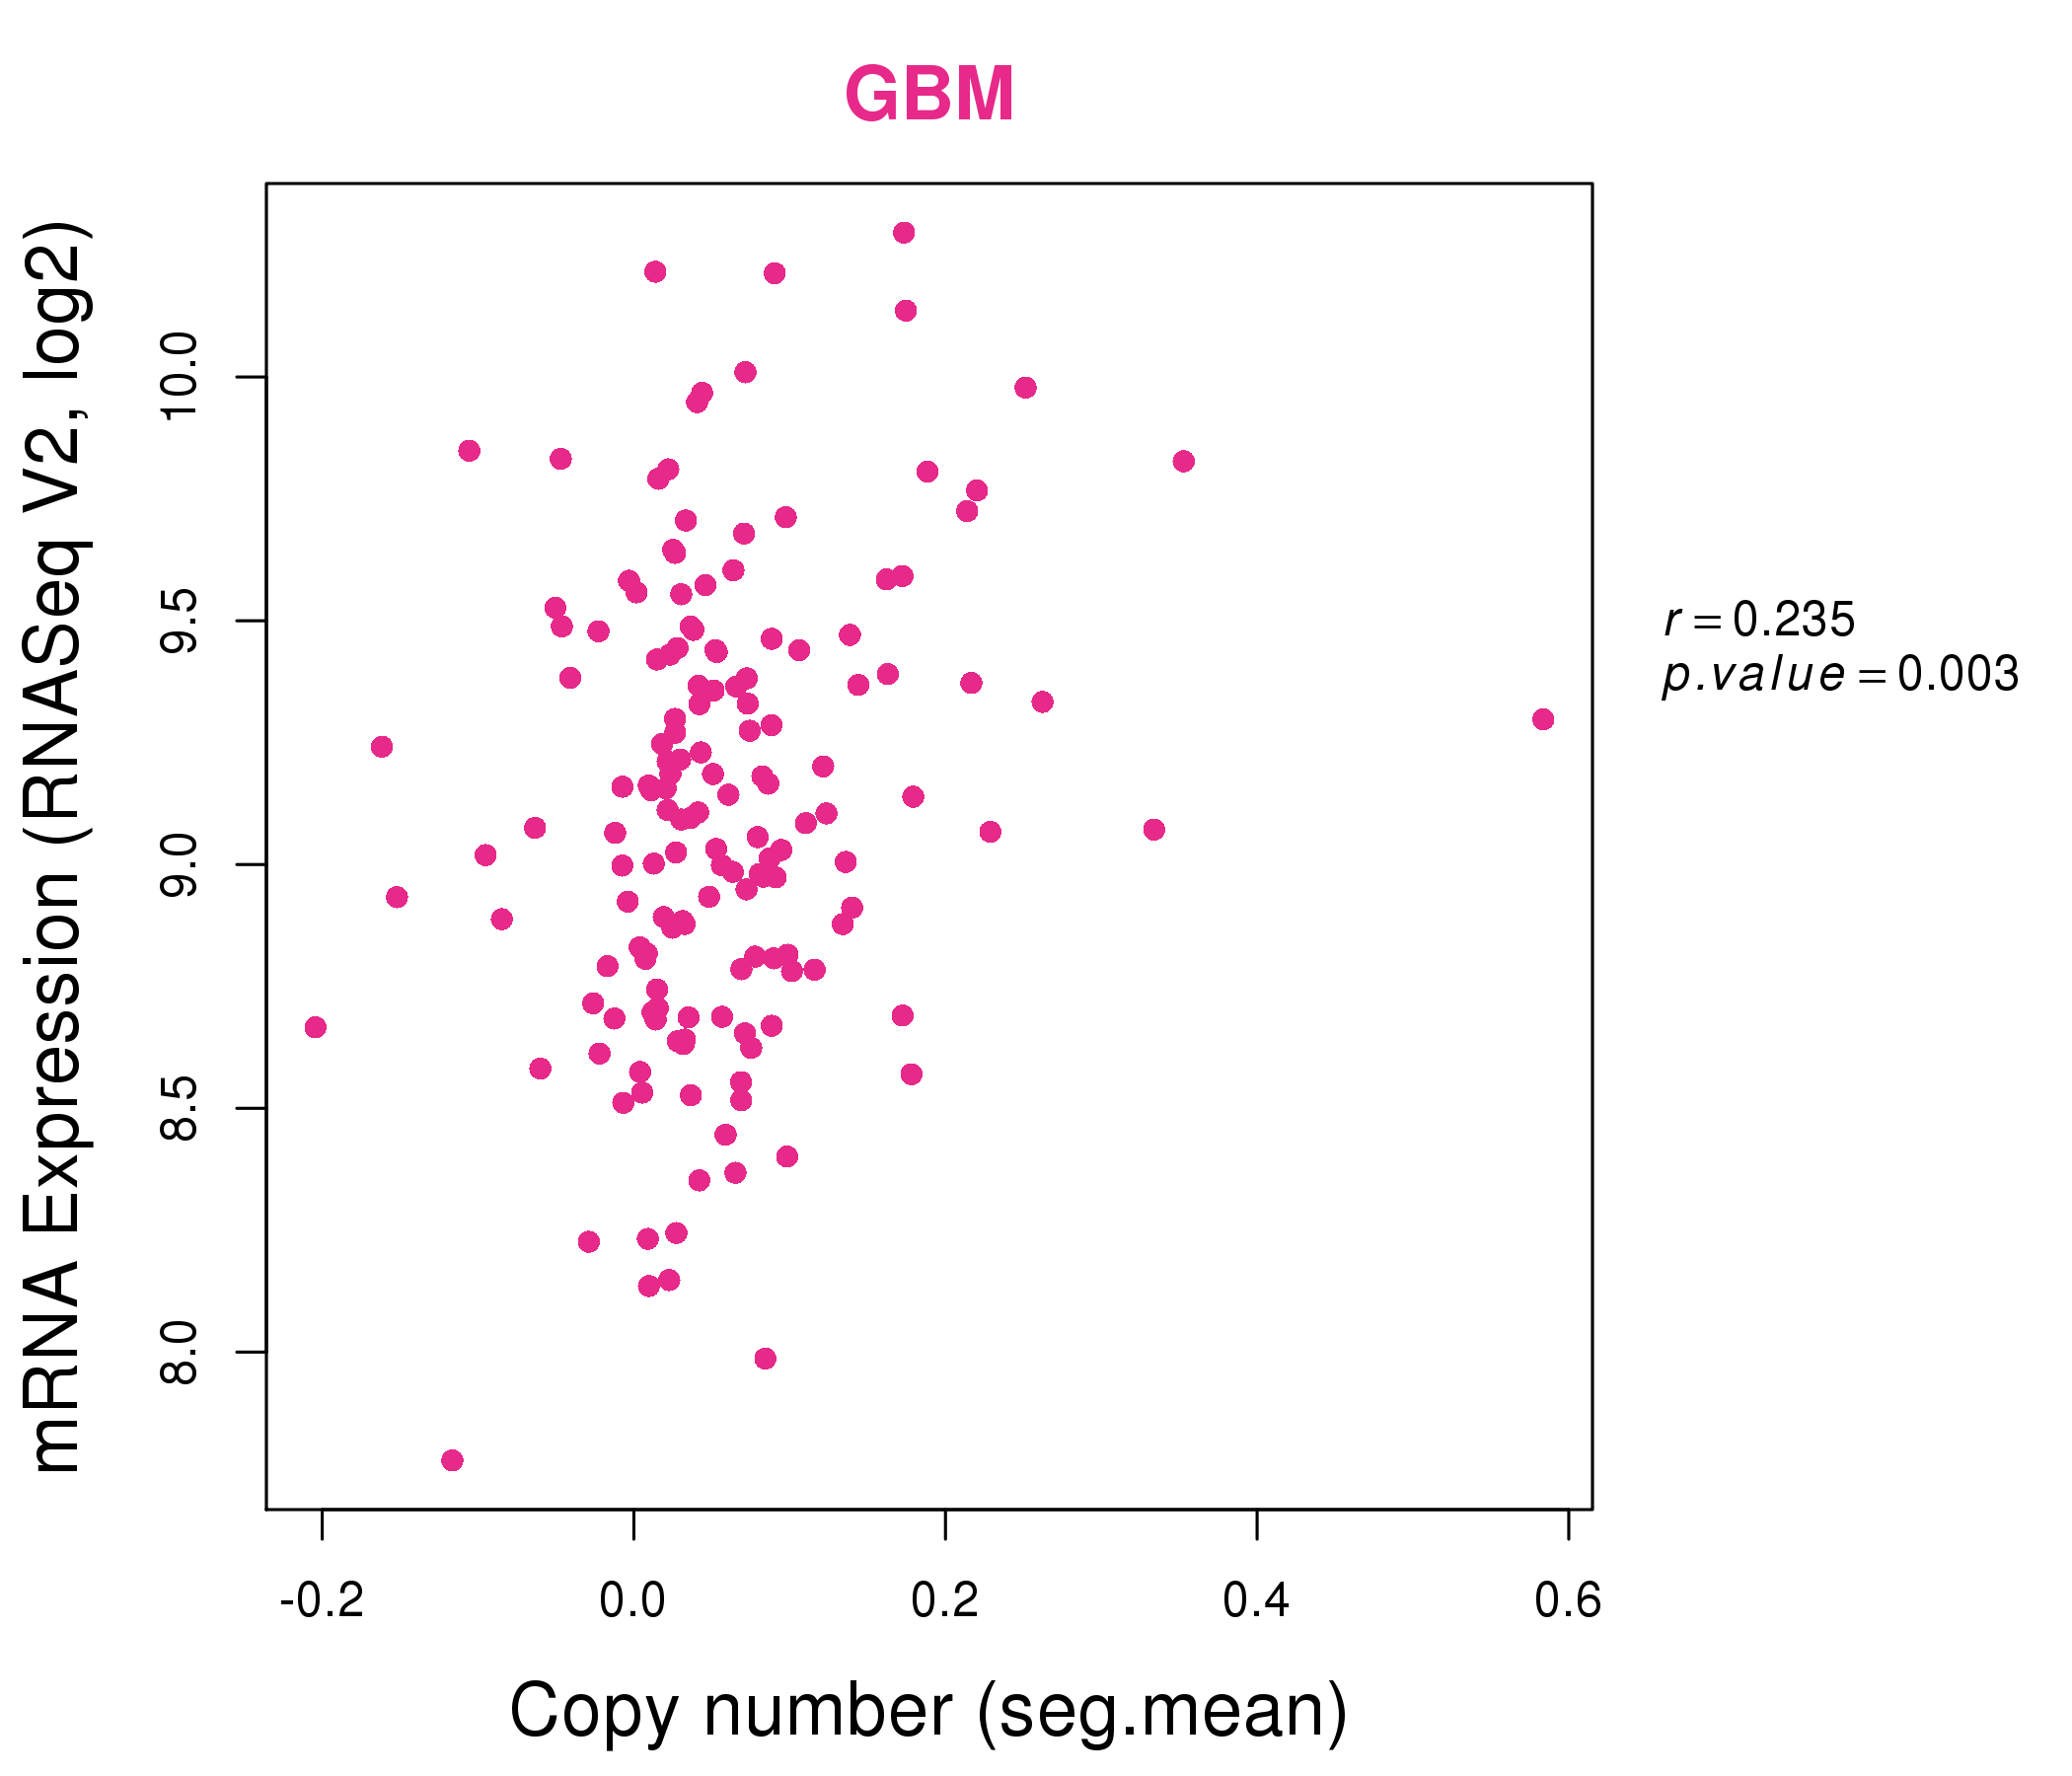
| * This plots show the correlation between CNV and gene expression. |
: Open all plots for all cancer types
 |
|
 |
|
| Top |
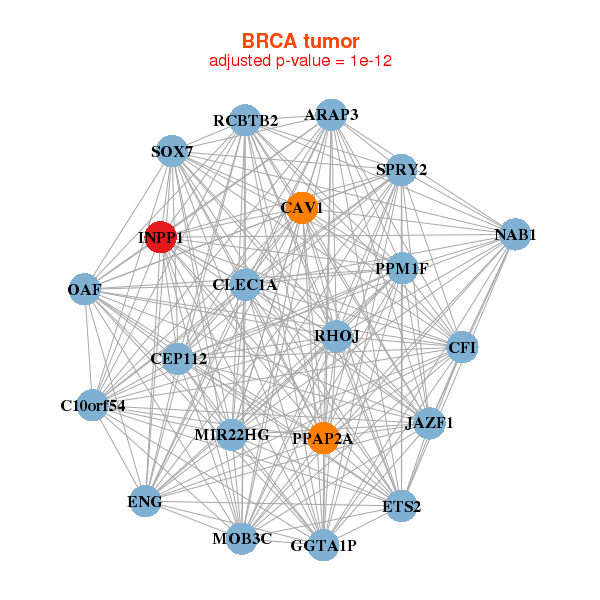
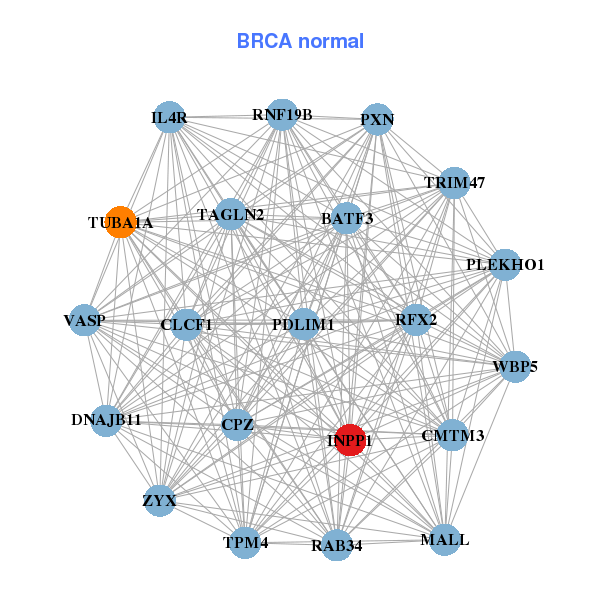
| Gene-Gene Network Information |
| * Co-Expression network figures were drawn using R package igraph. Only the top 20 genes with the highest correlations were shown. Red circle: input gene, orange circle: cell metabolism gene, sky circle: other gene |
: Open all plots for all cancer types
 |
| ||||
| ARAP3,C10orf54,MIR22HG,CAV1,CEP112,CFI,CLEC1A, ENG,ETS2,GGTA1P,INPP1,JAZF1,MOB3C,NAB1, OAF,PPAP2A,PPM1F,RCBTB2,RHOJ,SOX7,SPRY2 | BATF3,CLCF1,CMTM3,CPZ,DNAJB11,IL4R,INPP1, MALL,PDLIM1,PLEKHO1,PXN,RAB34,RFX2,RNF19B, TAGLN2,TPM4,TRIM47,TUBA1A,VASP,WBP5,ZYX | ||||
 |
| ||||
| ANXA2,ANXA2P2,ASPHD2,CYSTM1,CAPN8,CCDC68,CD55, CIB1,CREB3L1,INPP1,KCNK1,LIPH,LPCAT4,MAP3K5, S100A14,S100A16,SEMA4B,STYK1,TMEM92,TSPAN3,VPS37B | ANXA2,BZW1,MIR22HG,CHUK,ETF1,HRH1,INPP1, JMJD6,MAP2K3,MFSD2A,PLEK2,PPP2CA,PSMD12,S100A16, SERPINB1,SERPINB8,SERTAD1,SRXN1,TNFRSF12A,UBQLN1,XIRP1 |

| * Co-Expression network figures were drawn using R package igraph. Only the top 20 genes with the highest correlations were shown. Red circle: input gene, orange circle: cell metabolism gene, sky circle: other gene |
: Open all plots for all cancer types
| Top |
: Open all interacting genes' information including KEGG pathway for all interacting genes from DAVID
| Top |
| Pharmacological Information for INPP1 |
| DB Category | DB Name | DB's ID and Url link |
| * Gene Centered Interaction Network. |
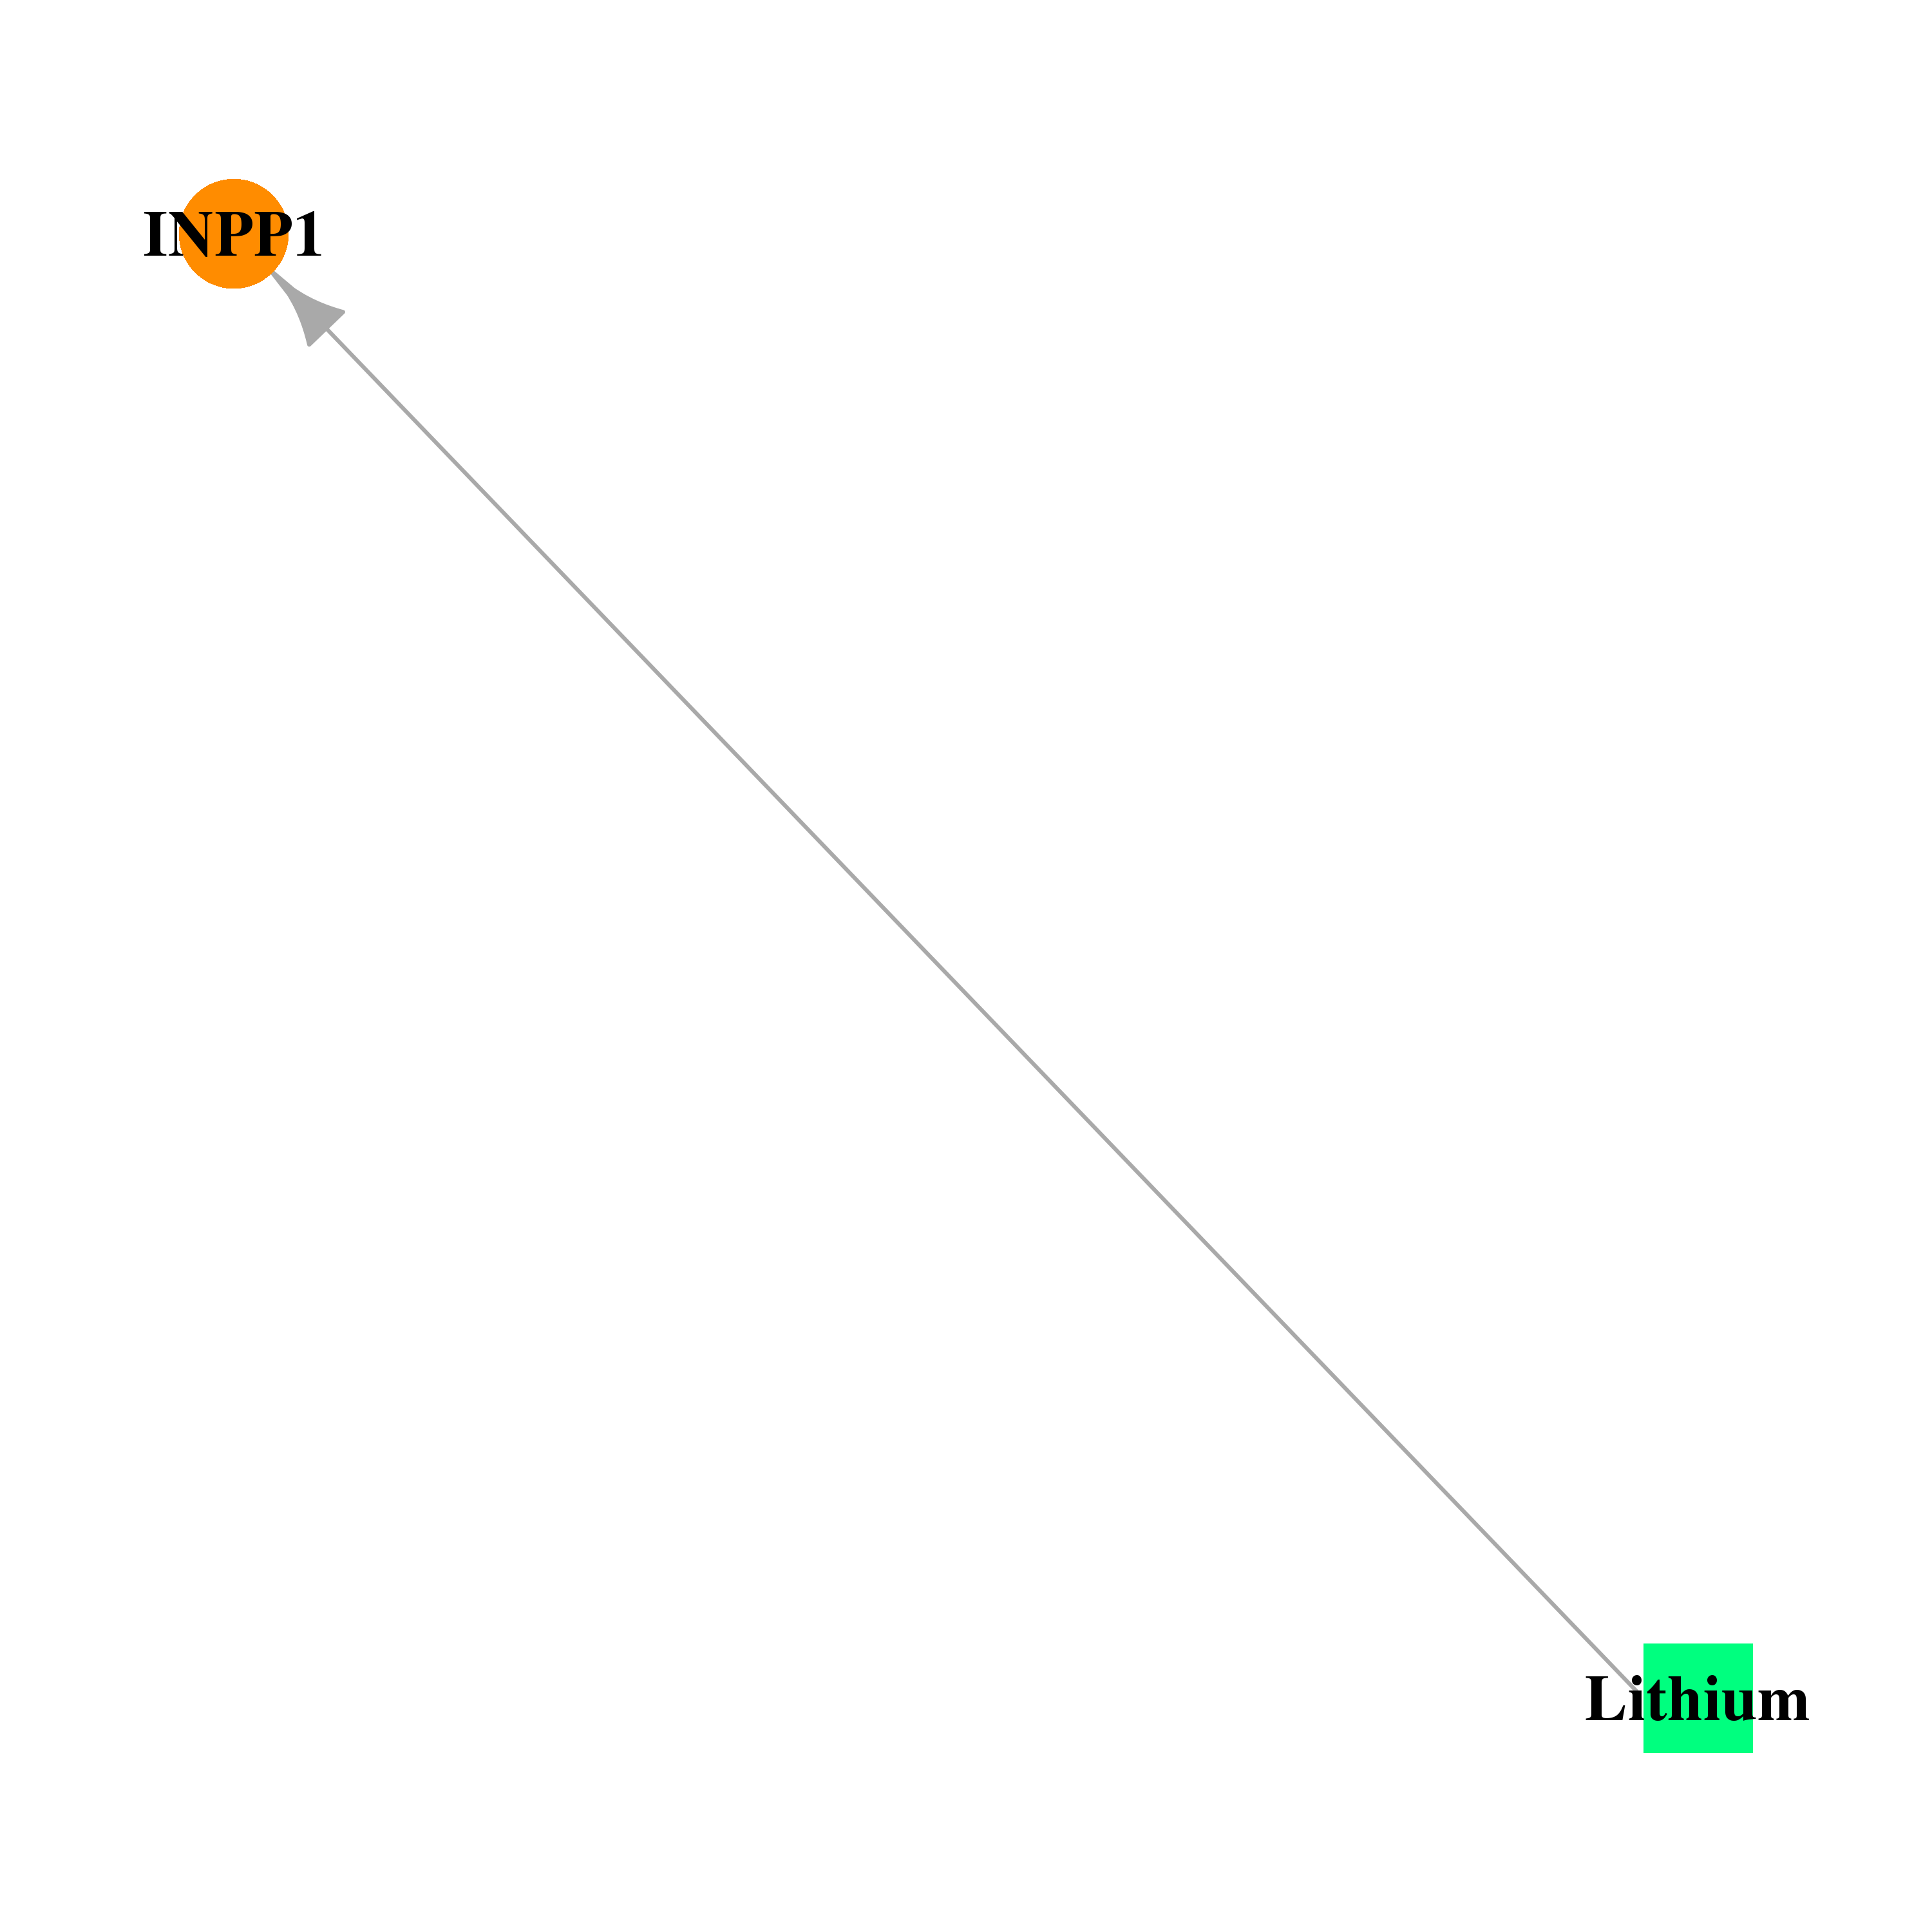 |
| * Drug Centered Interaction Network. |
| DrugBank ID | Target Name | Drug Groups | Generic Name | Drug Centered Network | Drug Structure |
| DB01356 | inositol polyphosphate-1-phosphatase | approved | Lithium | 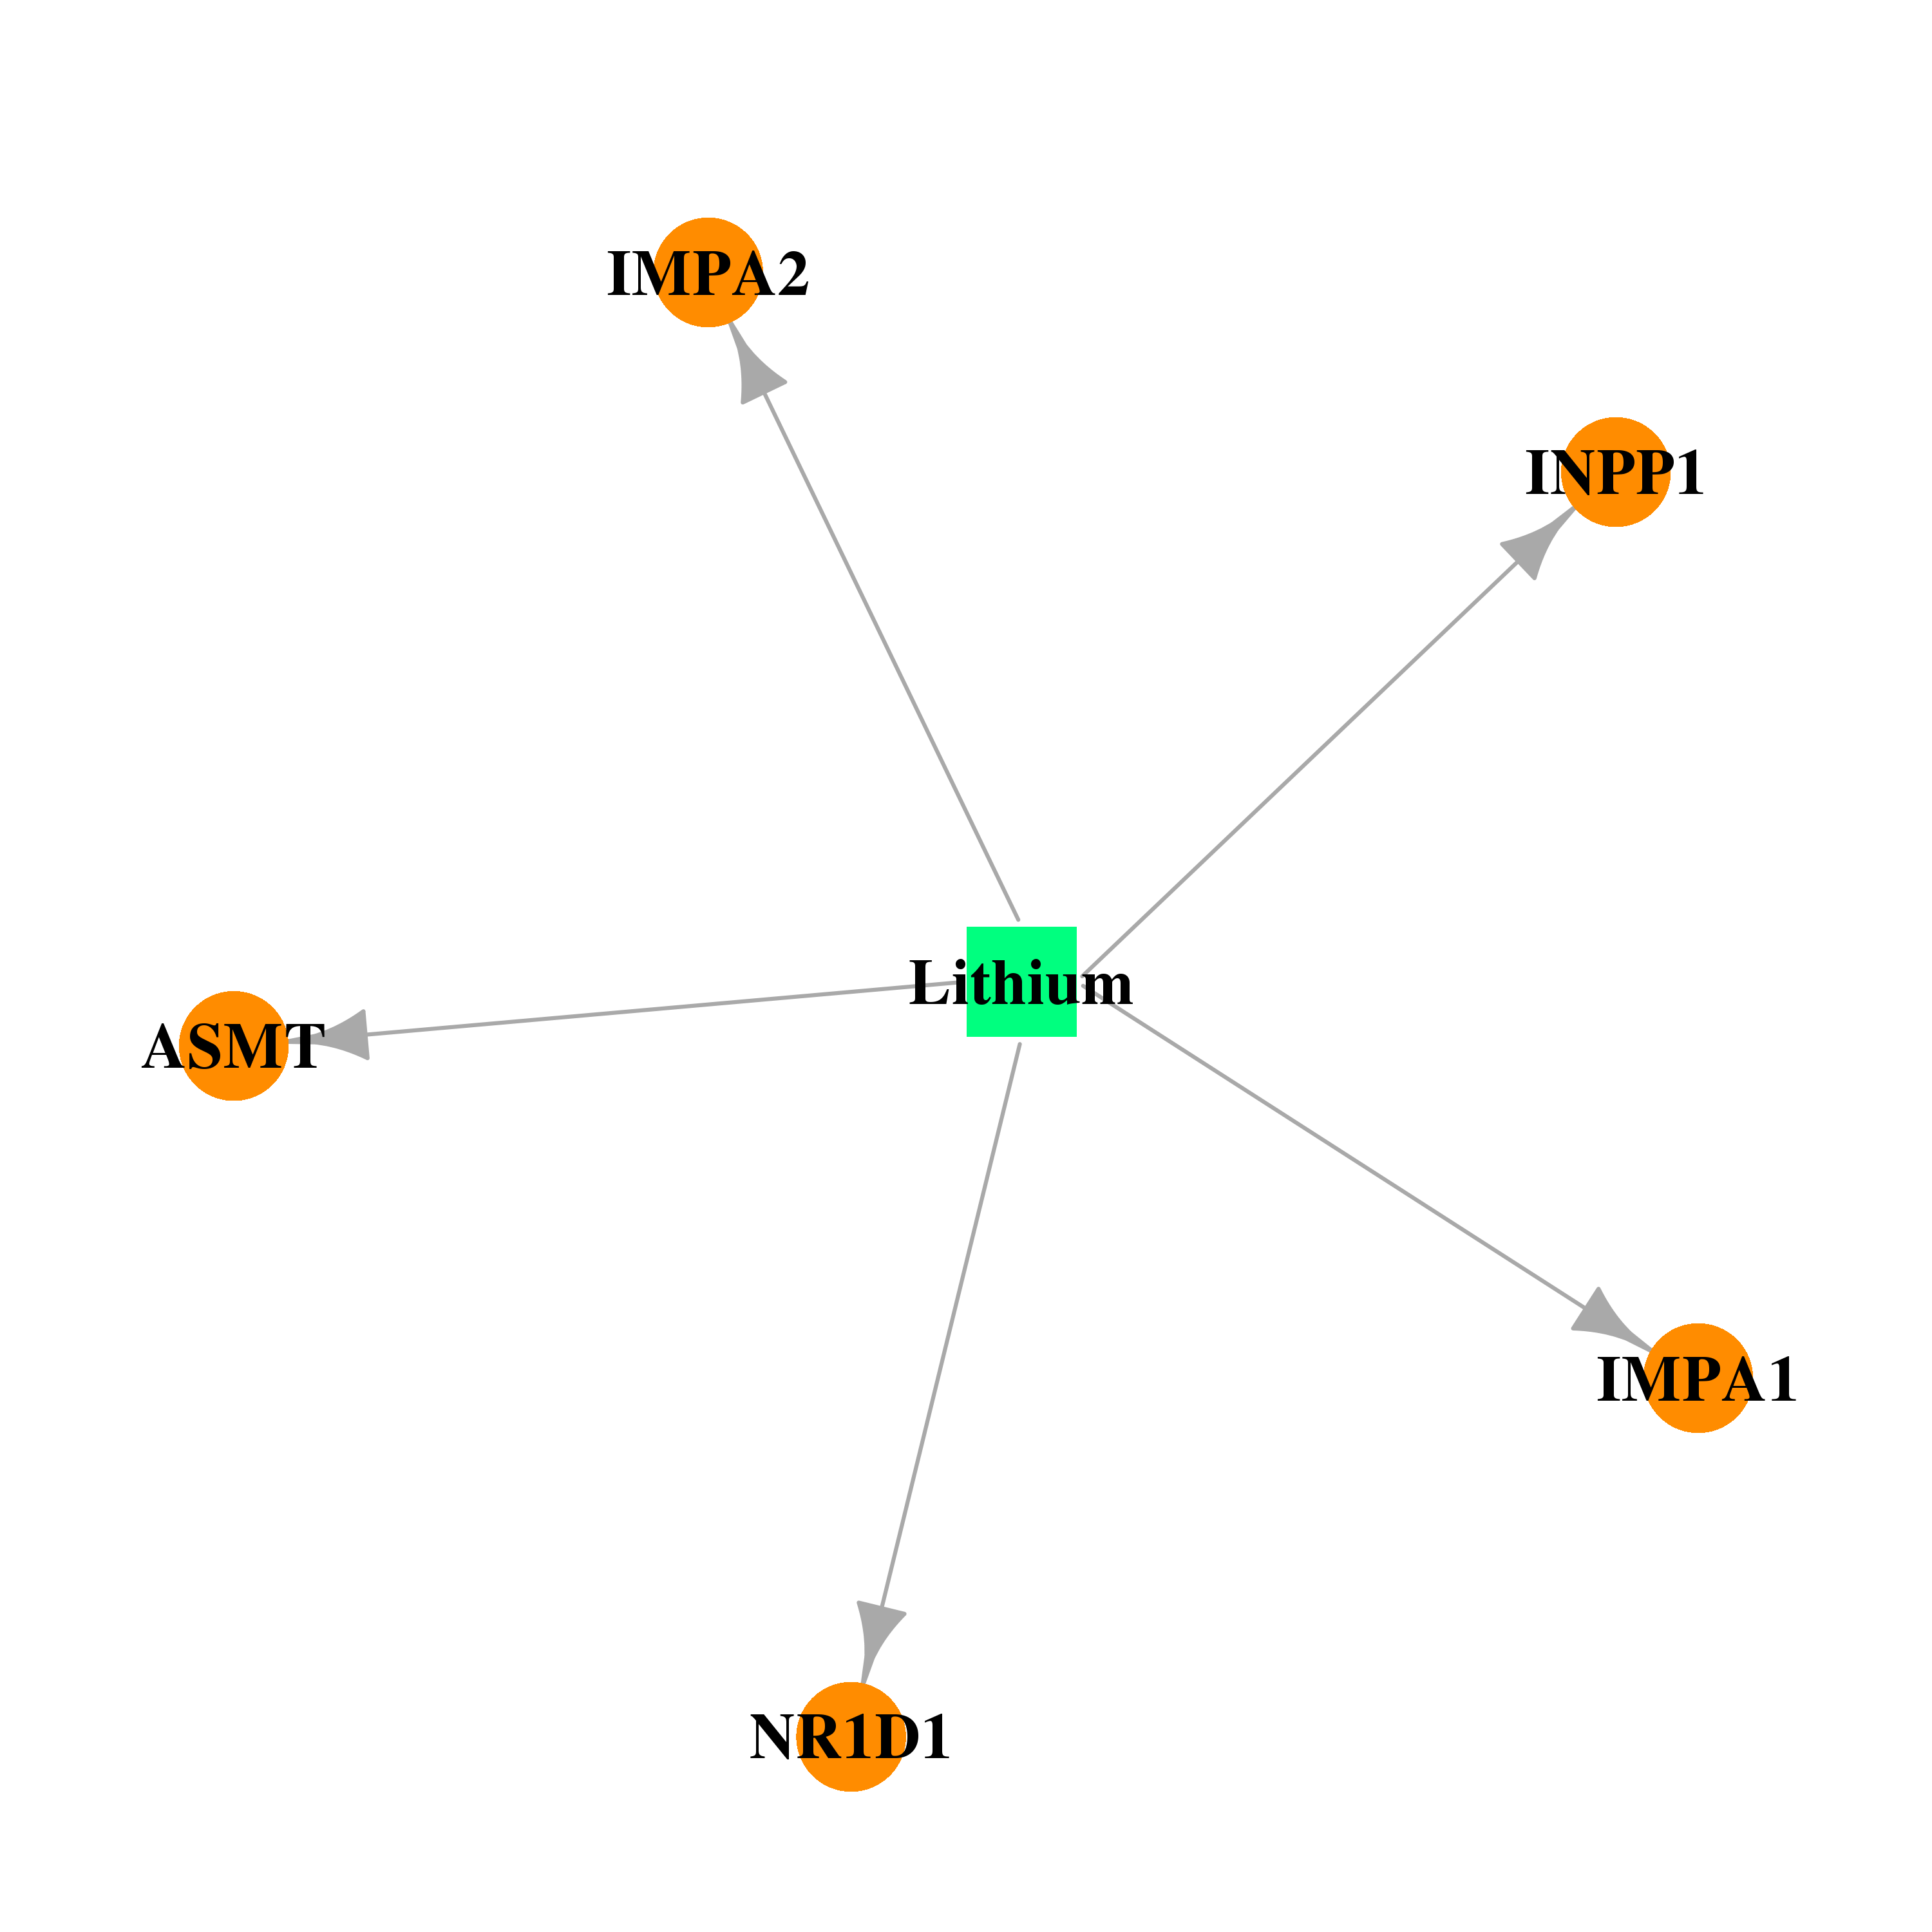 |  |
| Top |
| Cross referenced IDs for INPP1 |
| * We obtained these cross-references from Uniprot database. It covers 150 different DBs, 18 categories. http://www.uniprot.org/help/cross_references_section |
: Open all cross reference information
|
Copyright © 2016-Present - The Univsersity of Texas Health Science Center at Houston @ |