|
||||||||||||||||||||||||||||||||||||||||||||||||||||||||||||||||||||||||||||||||||||||||||||||||||||||||||||||||||||||||||||||||||||||||||||||||||||||||||||||||||||||||||||||||||||||||||||||||||||||||||||||||||||||||||||||||||||||||||||||||||||||||||||||||||||||||||||||||||||||||||||||||||||||||||||||||||||||||||
| |
| Phenotypic Information (metabolism pathway, cancer, disease, phenome) |
| |
| |
| Gene-Gene Network Information: Co-Expression Network, Interacting Genes & KEGG |
| |
|


| Gene Summary for INPP5A |
| Basic gene info. | Gene symbol | INPP5A |
| Gene name | inositol polyphosphate-5-phosphatase, 40kDa | |
| Synonyms | 5PTASE | |
| Cytomap | UCSC genome browser: 10q26.3 | |
| Genomic location | chr10 :134351352-134596984 | |
| Type of gene | protein-coding | |
| RefGenes | NM_005539.3, | |
| Ensembl id | ENSG00000068383 | |
| Description | 43 kDa inositol polyphosphate 5-phophataseCTCL tumor antigen HD-CL-02InsP3 5-phosphataseinositol polyphosphate-5-phosphatase, 40kDinositol trisphosphate-5-phosphatase, 40kDtype I inositol 1,4,5-trisphosphate 5-phosphatasetype I inositol-1,4,5-trisph | |
| Modification date | 20141207 | |
| dbXrefs | MIM : 600106 | |
| HGNC : HGNC | ||
| Ensembl : ENSG00000068383 | ||
| HPRD : 02521 | ||
| Vega : OTTHUMG00000019293 | ||
| Protein | UniProt: go to UniProt's Cross Reference DB Table | |
| Expression | CleanEX: HS_INPP5A | |
| BioGPS: 3632 | ||
| Gene Expression Atlas: ENSG00000068383 | ||
| The Human Protein Atlas: ENSG00000068383 | ||
| Pathway | NCI Pathway Interaction Database: INPP5A | |
| KEGG: INPP5A | ||
| REACTOME: INPP5A | ||
| ConsensusPathDB | ||
| Pathway Commons: INPP5A | ||
| Metabolism | MetaCyc: INPP5A | |
| HUMANCyc: INPP5A | ||
| Regulation | Ensembl's Regulation: ENSG00000068383 | |
| miRBase: chr10 :134,351,352-134,596,984 | ||
| TargetScan: NM_005539 | ||
| cisRED: ENSG00000068383 | ||
| Context | iHOP: INPP5A | |
| cancer metabolism search in PubMed: INPP5A | ||
| UCL Cancer Institute: INPP5A | ||
| Assigned class in ccmGDB | C | |
| Top |
| Phenotypic Information for INPP5A(metabolism pathway, cancer, disease, phenome) |
| Cancer | CGAP: INPP5A |
| Familial Cancer Database: INPP5A | |
| * This gene is included in those cancer gene databases. |
|
|
|
|
|
|
| ||||||||||||||||||||||||||||||||||||||||||||||||||||||||||||||||||||||||||||||||||||||||||||||||||||||||||||||||||||||||||||||||||||||||||||||||||||||||||||||||||||||||||||||||||||||||||||||||||||||||||||||||||||||||||||||||||||||||||||||||||||||||||||||||||||||||||||||||||||||||||||||||||||||||||||||||||||
Oncogene 1 | Significant driver gene in | |||||||||||||||||||||||||||||||||||||||||||||||||||||||||||||||||||||||||||||||||||||||||||||||||||||||||||||||||||||||||||||||||||||||||||||||||||||||||||||||||||||||||||||||||||||||||||||||||||||||||||||||||||||||||||||||||||||||||||||||||||||||||||||||||||||||||||||||||||||||||||||||||||||||||||||||||||||||||
| cf) number; DB name 1 Oncogene; http://nar.oxfordjournals.org/content/35/suppl_1/D721.long, 2 Tumor Suppressor gene; https://bioinfo.uth.edu/TSGene/, 3 Cancer Gene Census; http://www.nature.com/nrc/journal/v4/n3/abs/nrc1299.html, 4 CancerGenes; http://nar.oxfordjournals.org/content/35/suppl_1/D721.long, 5 Network of Cancer Gene; http://ncg.kcl.ac.uk/index.php, 1Therapeutic Vulnerabilities in Cancer; http://cbio.mskcc.org/cancergenomics/statius/ |
| KEGG_INOSITOL_PHOSPHATE_METABOLISM | |
| OMIM | |
| Orphanet | |
| Disease | KEGG Disease: INPP5A |
| MedGen: INPP5A (Human Medical Genetics with Condition) | |
| ClinVar: INPP5A | |
| Phenotype | MGI: INPP5A (International Mouse Phenotyping Consortium) |
| PhenomicDB: INPP5A | |
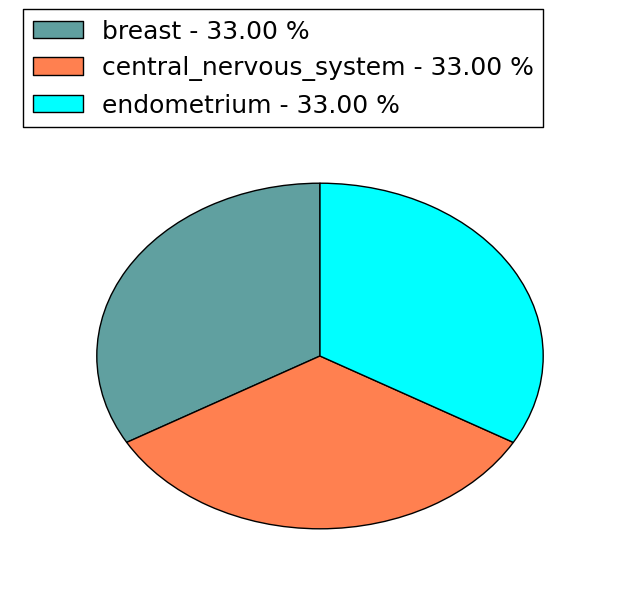
| Mutations for INPP5A |
| * Under tables are showing count per each tissue to give us broad intuition about tissue specific mutation patterns.You can go to the detailed page for each mutation database's web site. |
| - Statistics for Tissue and Mutation type | Top |
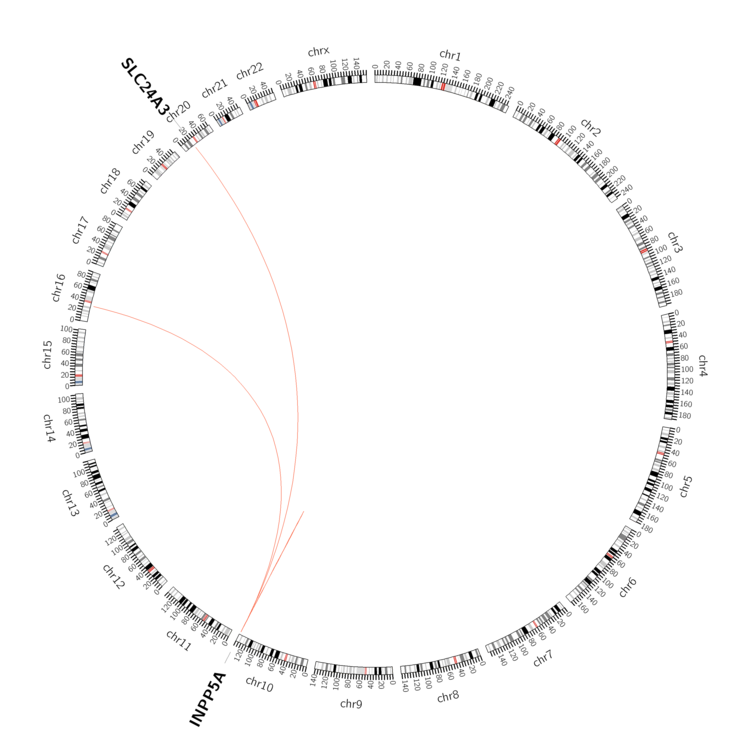 |
| - For Inter-chromosomal Variations |
| * Inter-chromosomal variantions includes 'interchromosomal amplicon to amplicon', 'interchromosomal amplicon to non-amplified dna', 'interchromosomal insertion', 'Interchromosomal unknown type'. |
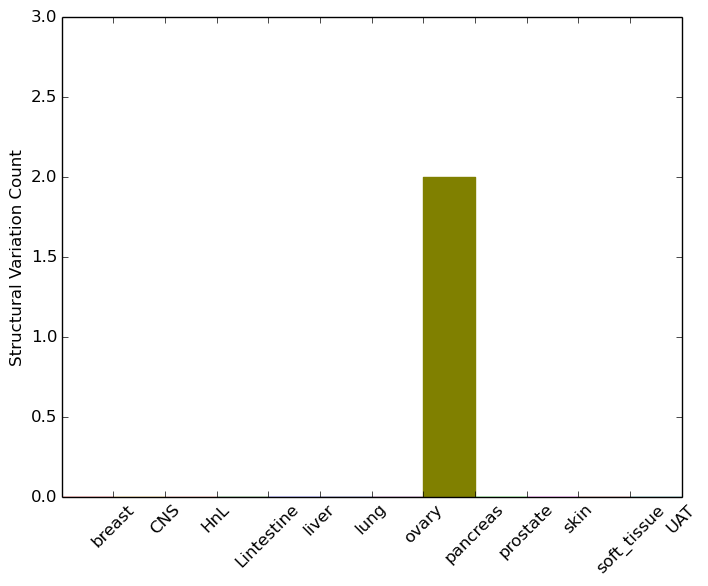 |
| - For Intra-chromosomal Variations |
| There's no intra-chromosomal structural variation. |
| Sample | Symbol_a | Chr_a | Start_a | End_a | Symbol_b | Chr_b | Start_b | End_b |
| ovary | INPP5A | chr10 | 134490772 | 134490792 | INPP5A | chr10 | 134490392 | 134490412 |
| ovary | INPP5A | chr10 | 134493718 | 134493738 | INPP5A | chr10 | 134518024 | 134518044 |
| ovary | INPP5A | chr10 | 134587778 | 134587798 | chr10 | 134857475 | 134857495 | |
| pancreas | INPP5A | chr10 | 134596766 | 134596786 | SLC24A3 | chr20 | 19371063 | 19371083 |
| cf) Tissue number; Tissue name (1;Breast, 2;Central_nervous_system, 3;Haematopoietic_and_lymphoid_tissue, 4;Large_intestine, 5;Liver, 6;Lung, 7;Ovary, 8;Pancreas, 9;Prostate, 10;Skin, 11;Soft_tissue, 12;Upper_aerodigestive_tract) |
| * From mRNA Sanger sequences, Chitars2.0 arranged chimeric transcripts. This table shows INPP5A related fusion information. |
| ID | Head Gene | Tail Gene | Accession | Gene_a | qStart_a | qEnd_a | Chromosome_a | tStart_a | tEnd_a | Gene_a | qStart_a | qEnd_a | Chromosome_a | tStart_a | tEnd_a |
| BF368694 | PAPPA | 1 | 85 | 9 | 119126716 | 119126800 | INPP5A | 79 | 491 | 10 | 134410696 | 134411106 | |
| Top |
| Mutation type/ Tissue ID | brca | cns | cerv | endome | haematopo | kidn | Lintest | liver | lung | ns | ovary | pancre | prost | skin | stoma | thyro | urina | |||
| Total # sample | 1 | |||||||||||||||||||
| GAIN (# sample) | 1 | |||||||||||||||||||
| LOSS (# sample) |
| cf) Tissue ID; Tissue type (1; Breast, 2; Central_nervous_system, 3; Cervix, 4; Endometrium, 5; Haematopoietic_and_lymphoid_tissue, 6; Kidney, 7; Large_intestine, 8; Liver, 9; Lung, 10; NS, 11; Ovary, 12; Pancreas, 13; Prostate, 14; Skin, 15; Stomach, 16; Thyroid, 17; Urinary_tract) |
| Top |
|
 |
| Top |
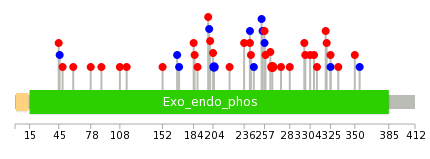
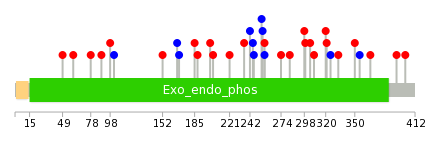
| Stat. for Non-Synonymous SNVs (# total SNVs=27) | (# total SNVs=3) |
 |  |
(# total SNVs=1) | (# total SNVs=0) |
 |
| Top |
| * When you move the cursor on each content, you can see more deailed mutation information on the Tooltip. Those are primary_site,primary_histology,mutation(aa),pubmedID. |
| GRCh37 position | Mutation(aa) | Unique sampleID count |
| chr10:134563082-134563082 | p.K265T | 3 |
| chr10:134463965-134463965 | p.R88* | 2 |
| chr10:134459368-134459368 | p.? | 2 |
| chr10:134523928-134523928 | p.I205I | 2 |
| chr10:134463923-134463923 | p.E74* | 2 |
| chr10:134540404-134540404 | p.V243M | 1 |
| chr10:134563122-134563122 | p.? | 1 |
| chr10:134463950-134463950 | p.E83* | 1 |
| chr10:134591194-134591194 | p.A333T | 1 |
| chr10:134523875-134523875 | p.D188H | 1 |
| Top |
|
 |
| Point Mutation/ Tissue ID | 1 | 2 | 3 | 4 | 5 | 6 | 7 | 8 | 9 | 10 | 11 | 12 | 13 | 14 | 15 | 16 | 17 | 18 | 19 | 20 |
| # sample | 4 | 1 | 2 | 1 | 2 | 1 | 3 | 4 | 8 | 6 | 3 | |||||||||
| # mutation | 4 | 1 | 2 | 1 | 2 | 1 | 3 | 4 | 8 | 6 | 4 | |||||||||
| nonsynonymous SNV | 3 | 1 | 2 | 1 | 1 | 3 | 4 | 4 | 4 | 3 | ||||||||||
| synonymous SNV | 1 | 2 | 4 | 2 | 1 |
| cf) Tissue ID; Tissue type (1; BLCA[Bladder Urothelial Carcinoma], 2; BRCA[Breast invasive carcinoma], 3; CESC[Cervical squamous cell carcinoma and endocervical adenocarcinoma], 4; COAD[Colon adenocarcinoma], 5; GBM[Glioblastoma multiforme], 6; Glioma Low Grade, 7; HNSC[Head and Neck squamous cell carcinoma], 8; KICH[Kidney Chromophobe], 9; KIRC[Kidney renal clear cell carcinoma], 10; KIRP[Kidney renal papillary cell carcinoma], 11; LAML[Acute Myeloid Leukemia], 12; LUAD[Lung adenocarcinoma], 13; LUSC[Lung squamous cell carcinoma], 14; OV[Ovarian serous cystadenocarcinoma ], 15; PAAD[Pancreatic adenocarcinoma], 16; PRAD[Prostate adenocarcinoma], 17; SKCM[Skin Cutaneous Melanoma], 18:STAD[Stomach adenocarcinoma], 19:THCA[Thyroid carcinoma], 20:UCEC[Uterine Corpus Endometrial Carcinoma]) |
| Top |
| * We represented just top 10 SNVs. When you move the cursor on each content, you can see more deailed mutation information on the Tooltip. Those are primary_site, primary_histology, mutation(aa), pubmedID. |
| Genomic Position | Mutation(aa) | Unique sampleID count |
| chr10:134579331 | p.N298K | 1 |
| chr10:134521843 | p.T169T | 1 |
| chr10:134563050 | p.G299S | 1 |
| chr10:134579334 | p.L185F | 1 |
| chr10:134521849 | p.E304Q | 1 |
| chr10:134563053 | p.D188H | 1 |
| chr10:134579348 | p.E308Q | 1 |
| chr10:134523866 | p.V201A | 1 |
| chr10:134563057 | p.D320H | 1 |
| chr10:134591194 | p.G204E | 1 |
| * Copy number data were extracted from TCGA using R package TCGA-Assembler. The URLs of all public data files on TCGA DCC data server were gathered on Jan-05-2015. Function ProcessCNAData in TCGA-Assembler package was used to obtain gene-level copy number value which is calculated as the average copy number of the genomic region of a gene. |
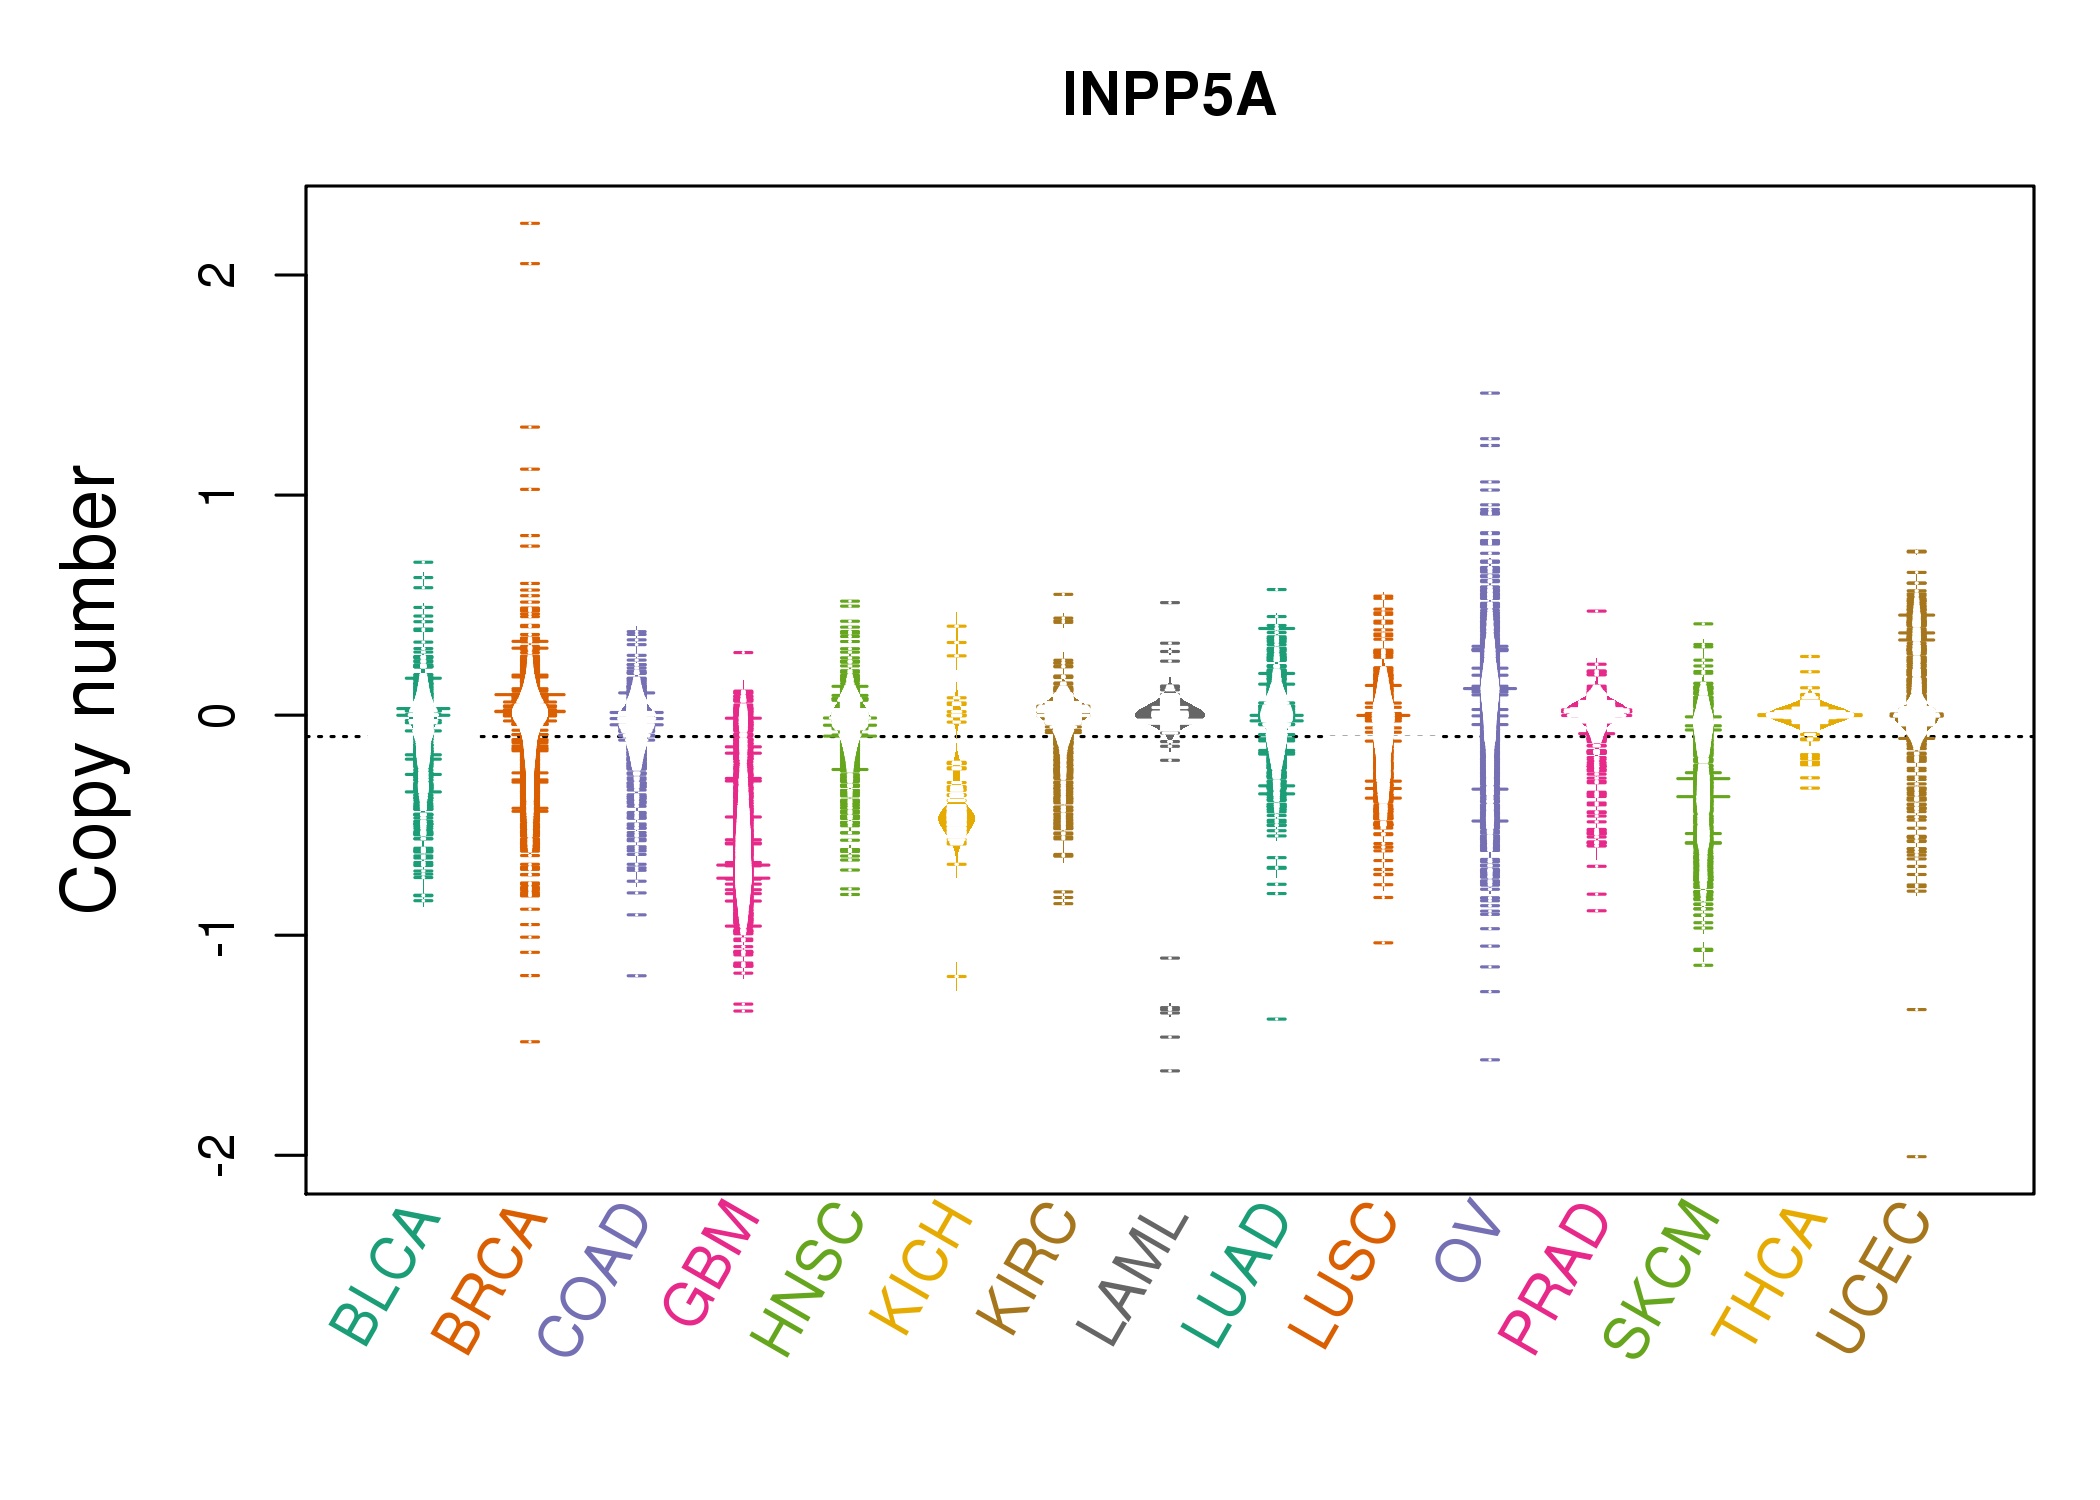 |
| cf) Tissue ID[Tissue type]: BLCA[Bladder Urothelial Carcinoma], BRCA[Breast invasive carcinoma], CESC[Cervical squamous cell carcinoma and endocervical adenocarcinoma], COAD[Colon adenocarcinoma], GBM[Glioblastoma multiforme], Glioma Low Grade, HNSC[Head and Neck squamous cell carcinoma], KICH[Kidney Chromophobe], KIRC[Kidney renal clear cell carcinoma], KIRP[Kidney renal papillary cell carcinoma], LAML[Acute Myeloid Leukemia], LUAD[Lung adenocarcinoma], LUSC[Lung squamous cell carcinoma], OV[Ovarian serous cystadenocarcinoma ], PAAD[Pancreatic adenocarcinoma], PRAD[Prostate adenocarcinoma], SKCM[Skin Cutaneous Melanoma], STAD[Stomach adenocarcinoma], THCA[Thyroid carcinoma], UCEC[Uterine Corpus Endometrial Carcinoma] |
| Top |
| Gene Expression for INPP5A |
| * CCLE gene expression data were extracted from CCLE_Expression_Entrez_2012-10-18.res: Gene-centric RMA-normalized mRNA expression data. |
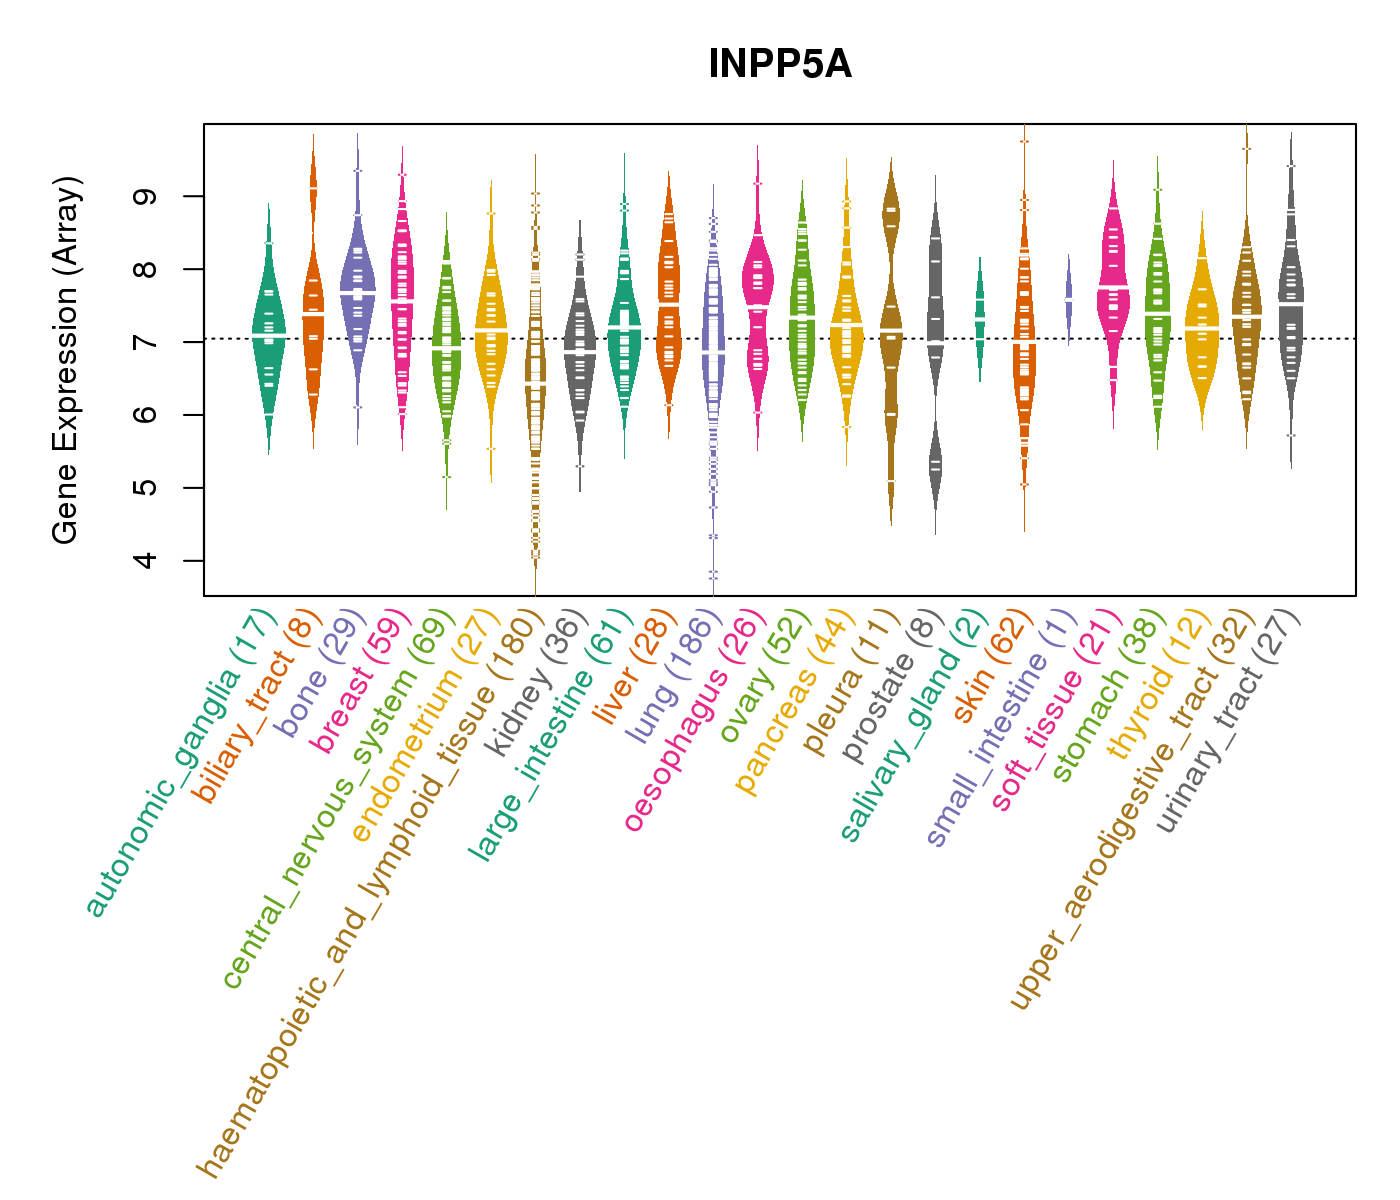 |
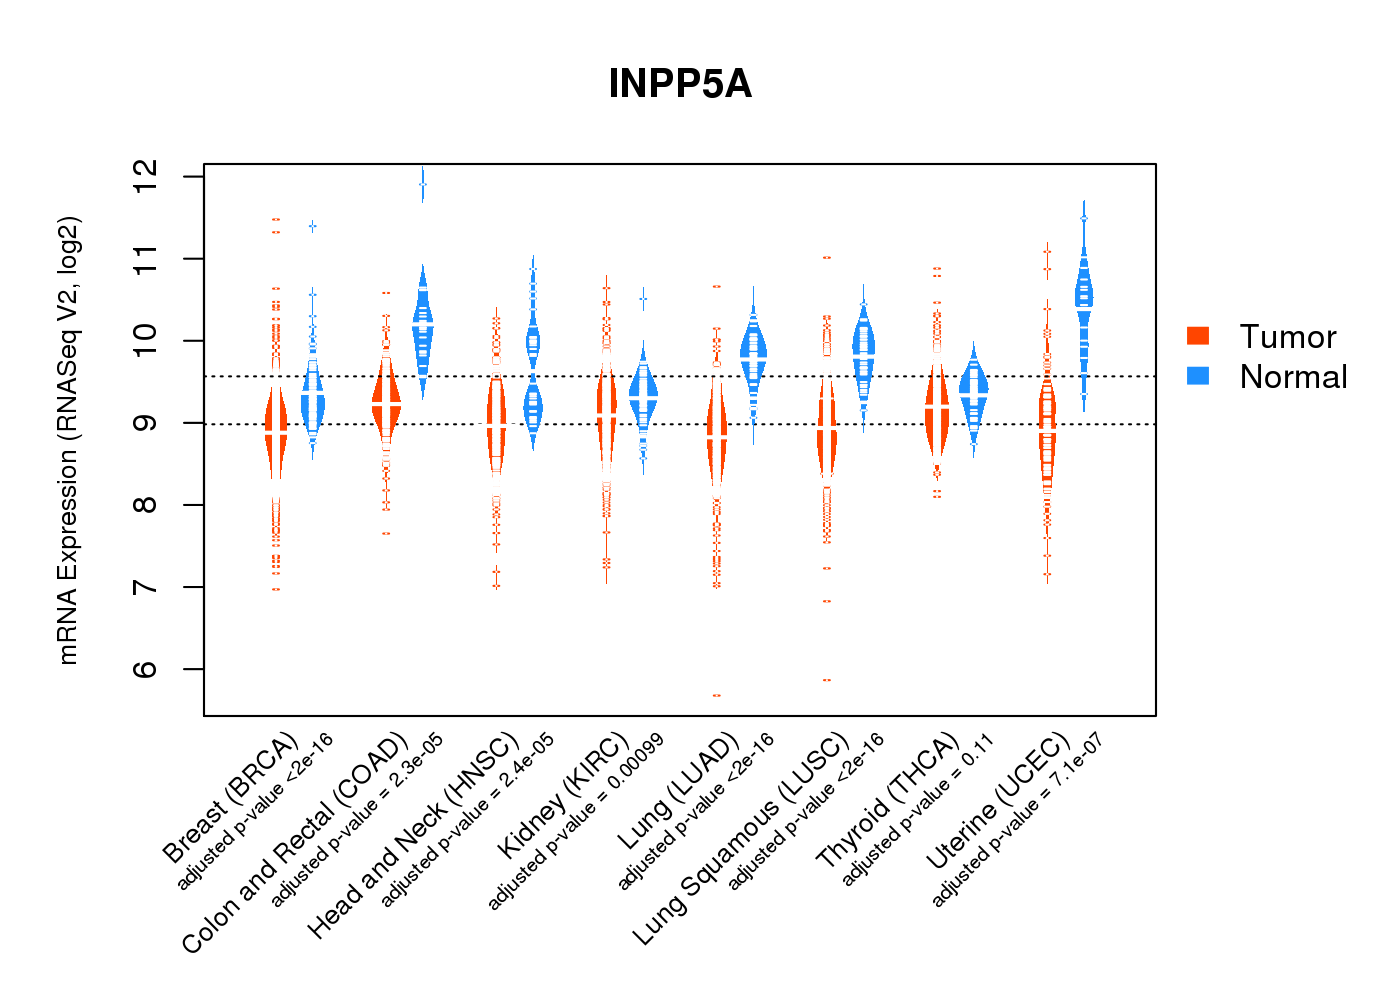
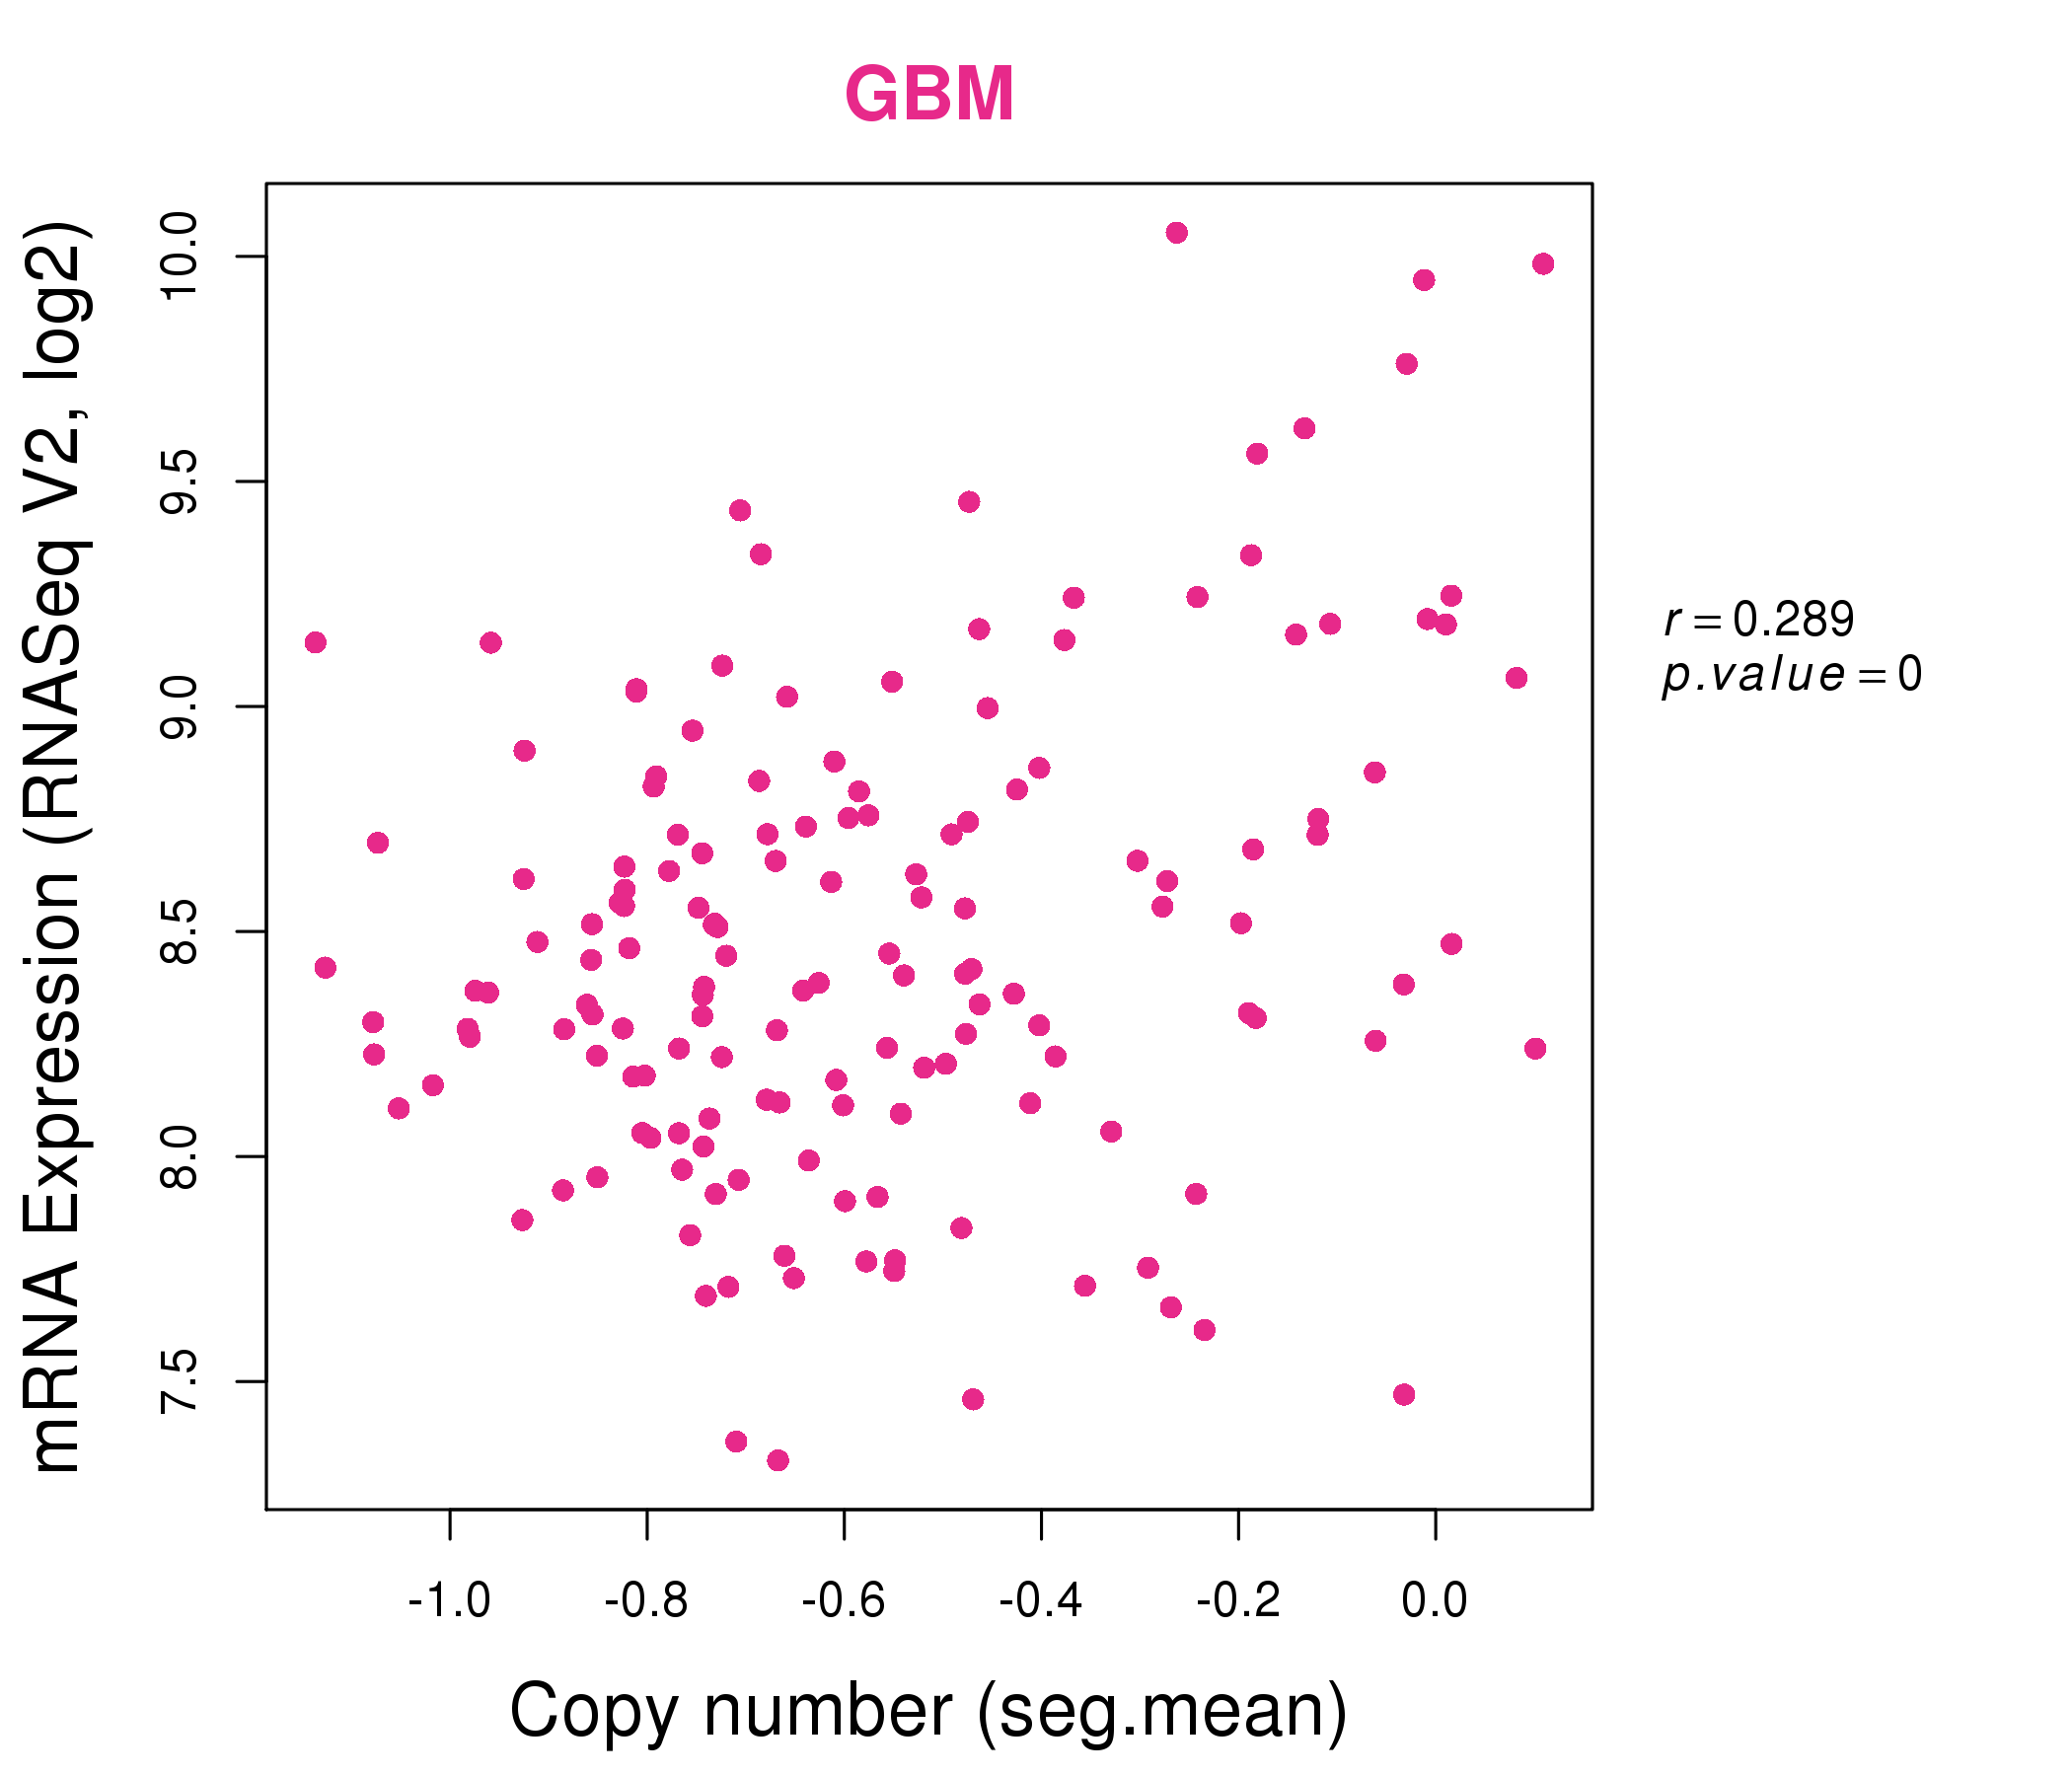
| * Normalized gene expression data of RNASeqV2 was extracted from TCGA using R package TCGA-Assembler. The URLs of all public data files on TCGA DCC data server were gathered at Jan-05-2015. Only eight cancer types have enough normal control samples for differential expression analysis. (t test, adjusted p<0.05 (using Benjamini-Hochberg FDR)) |
 |
| Top |
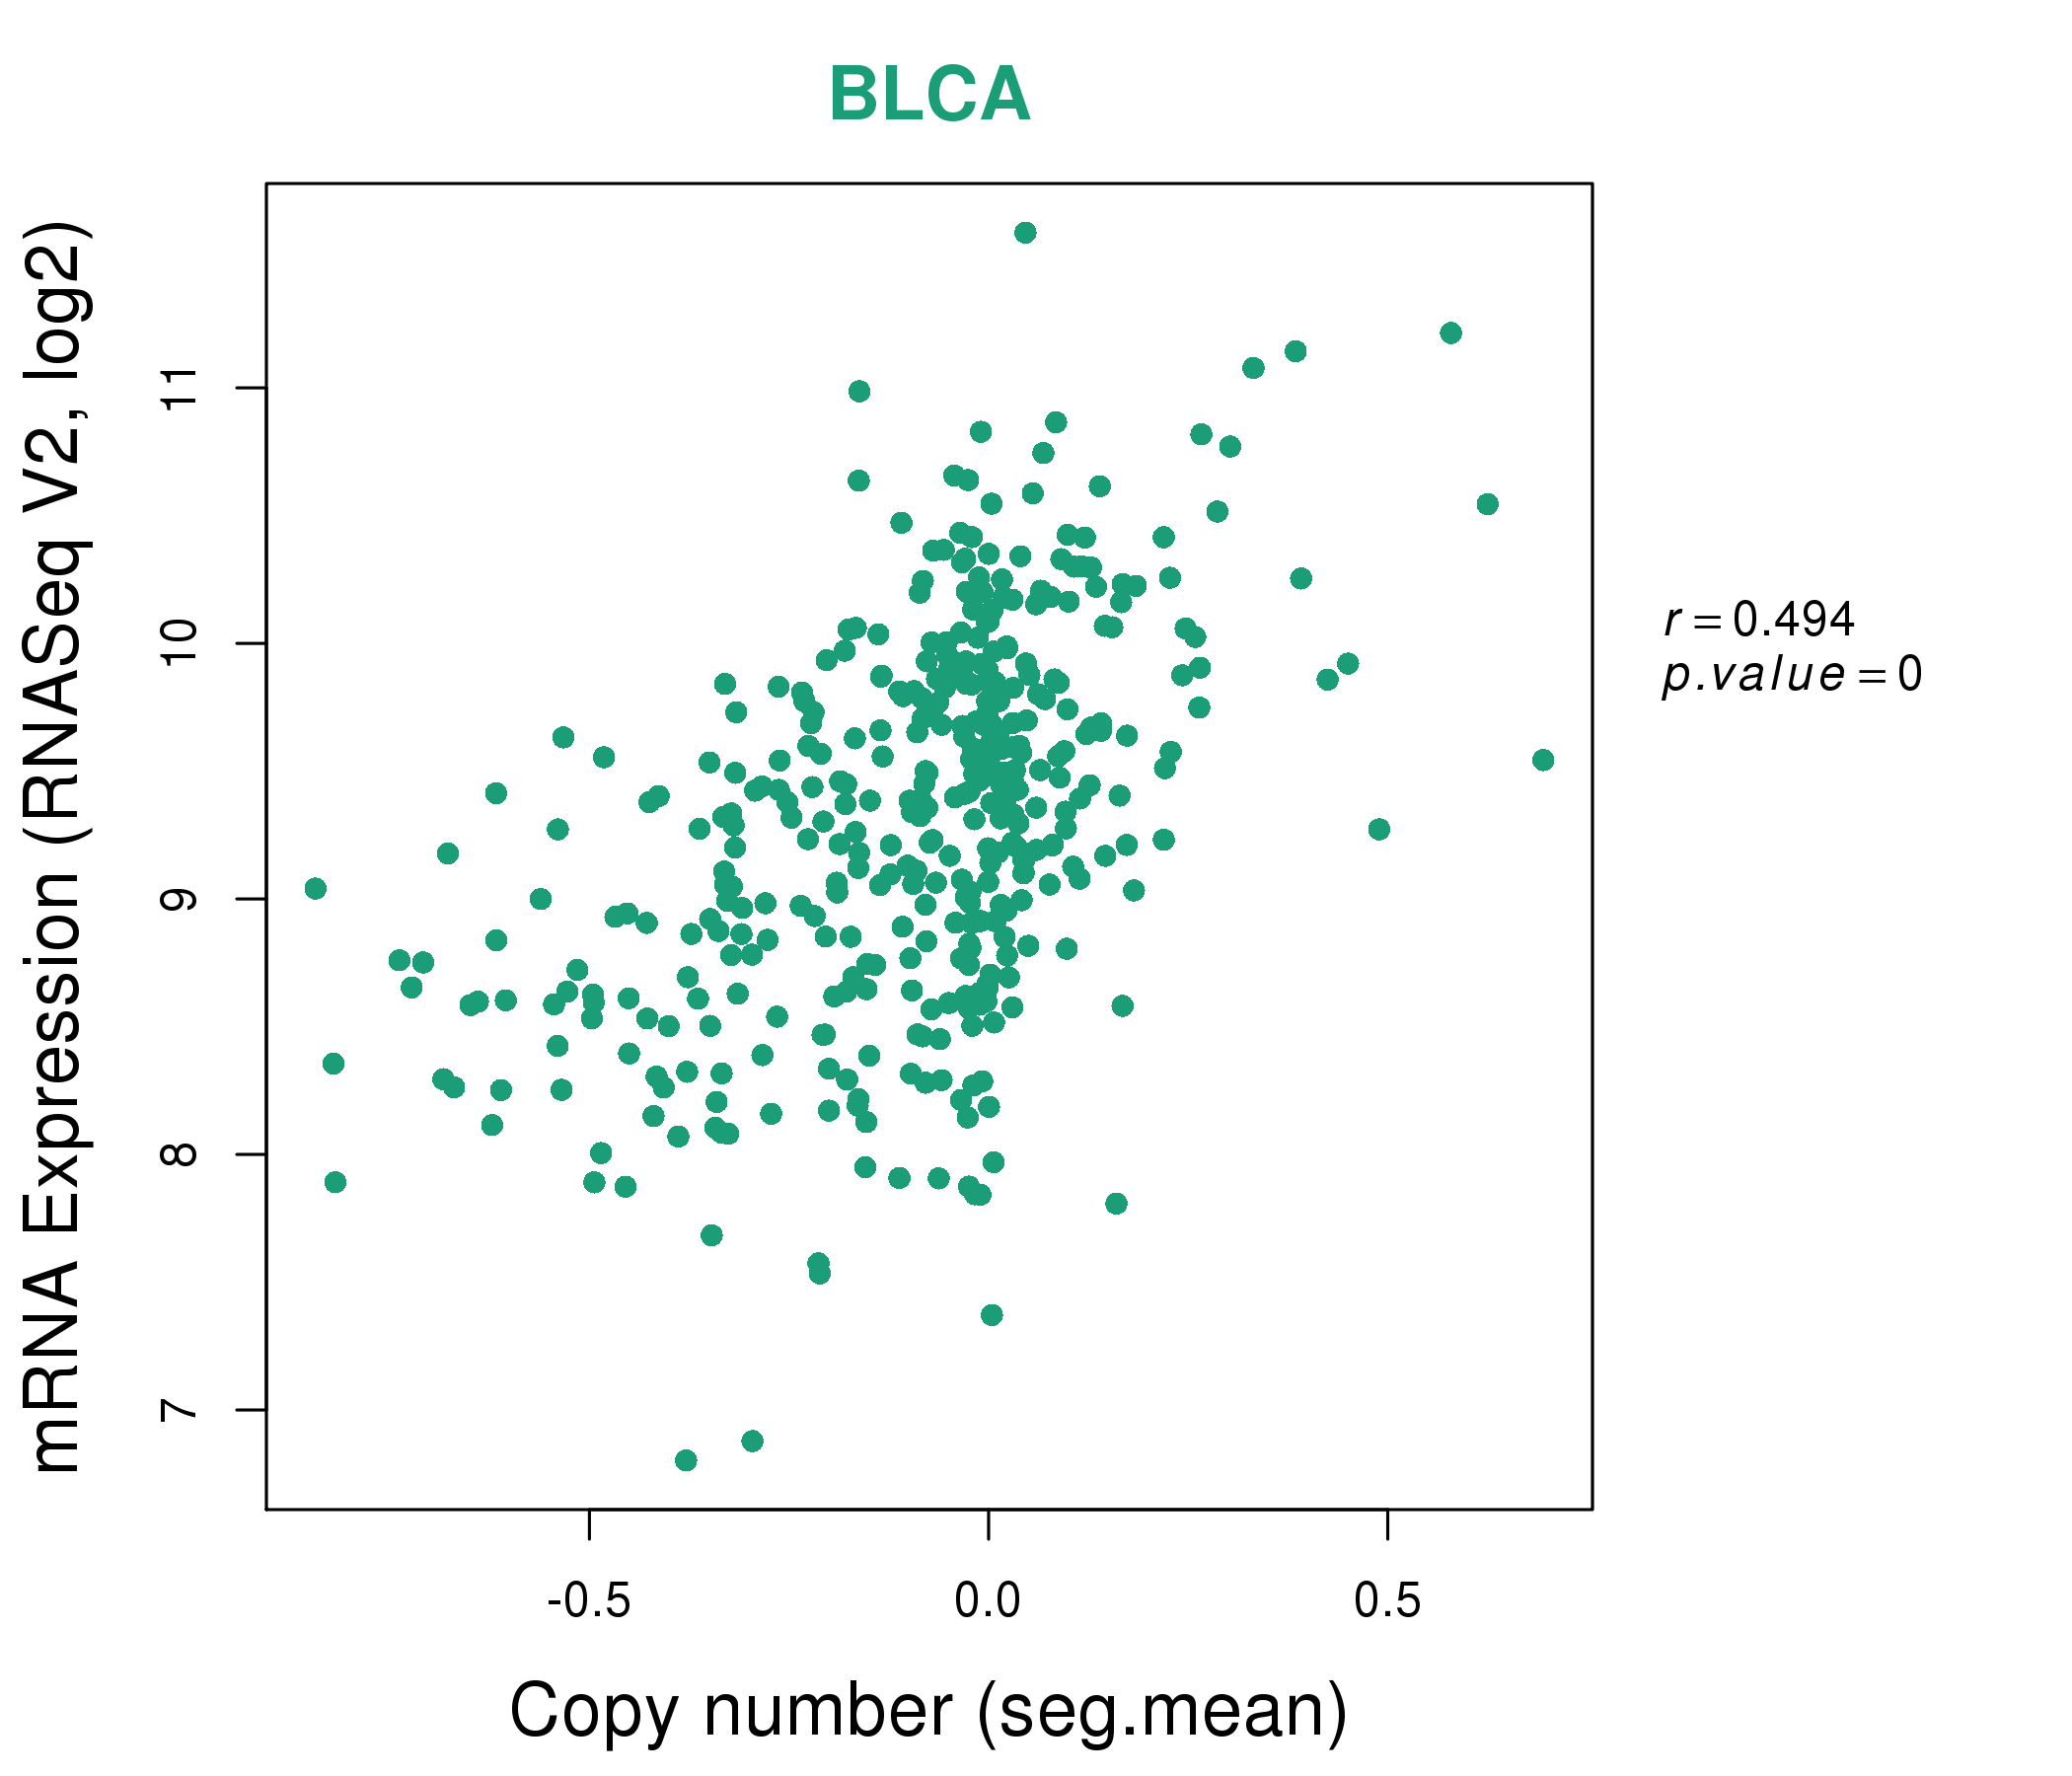
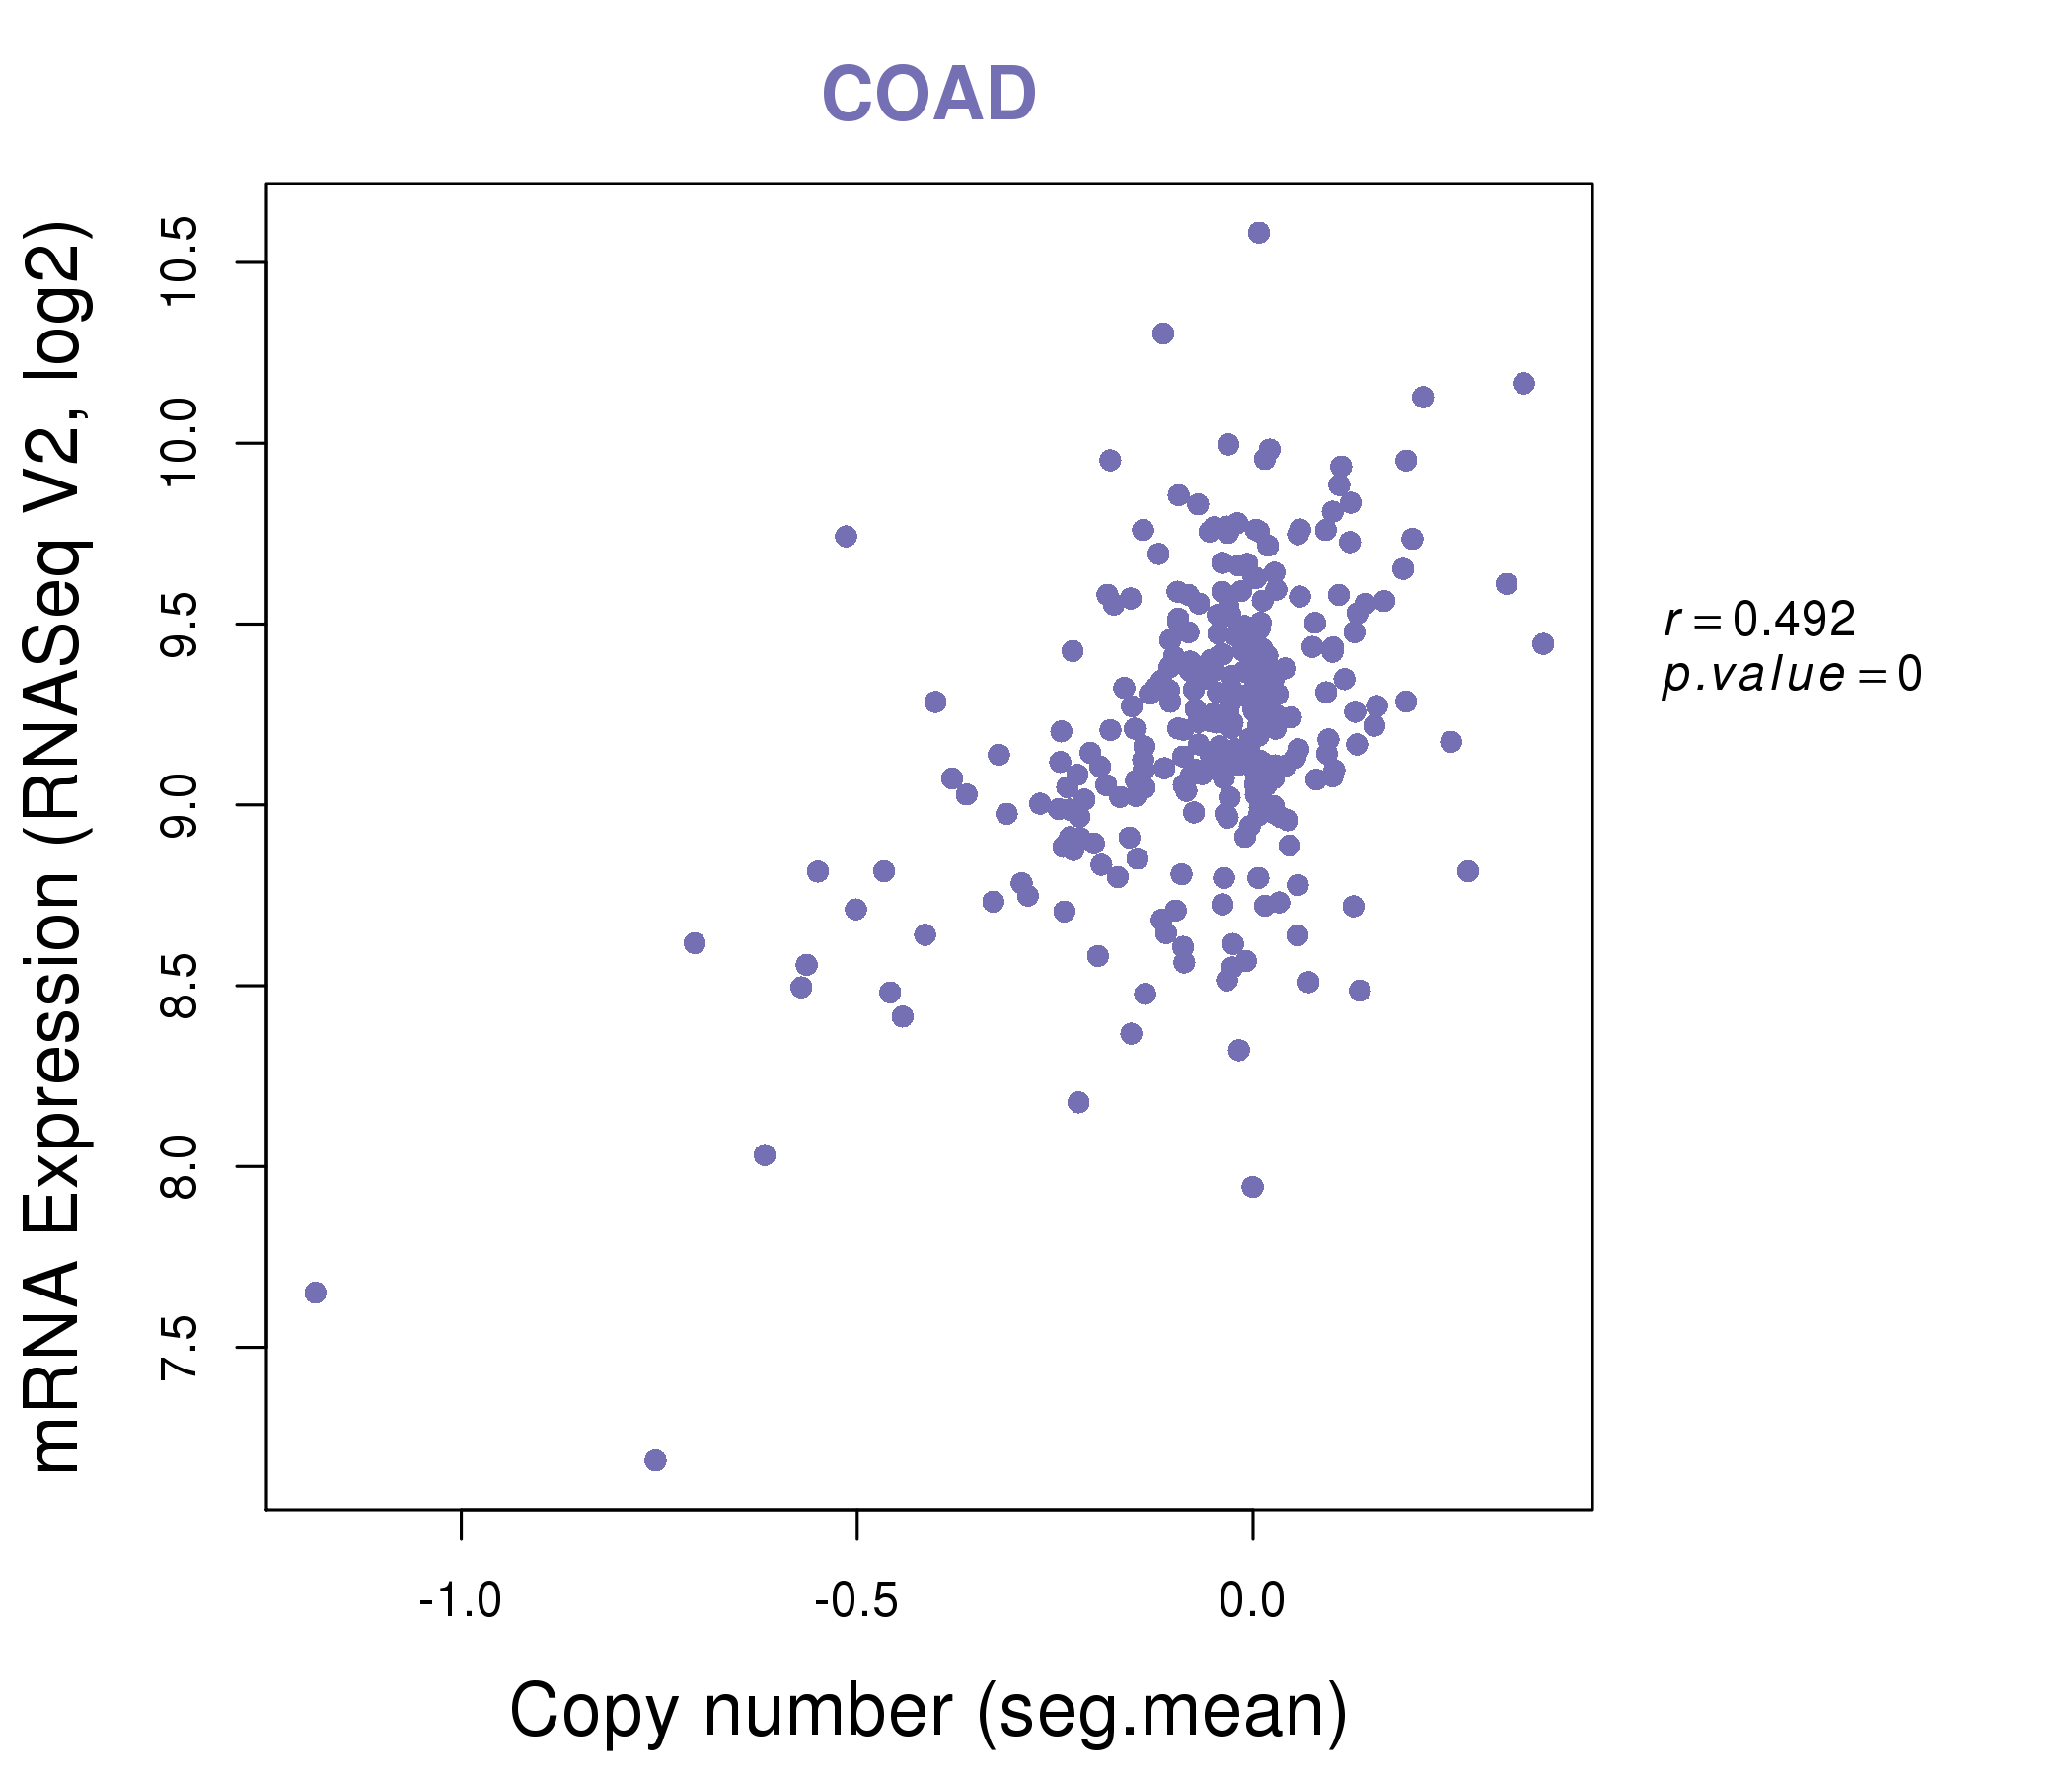
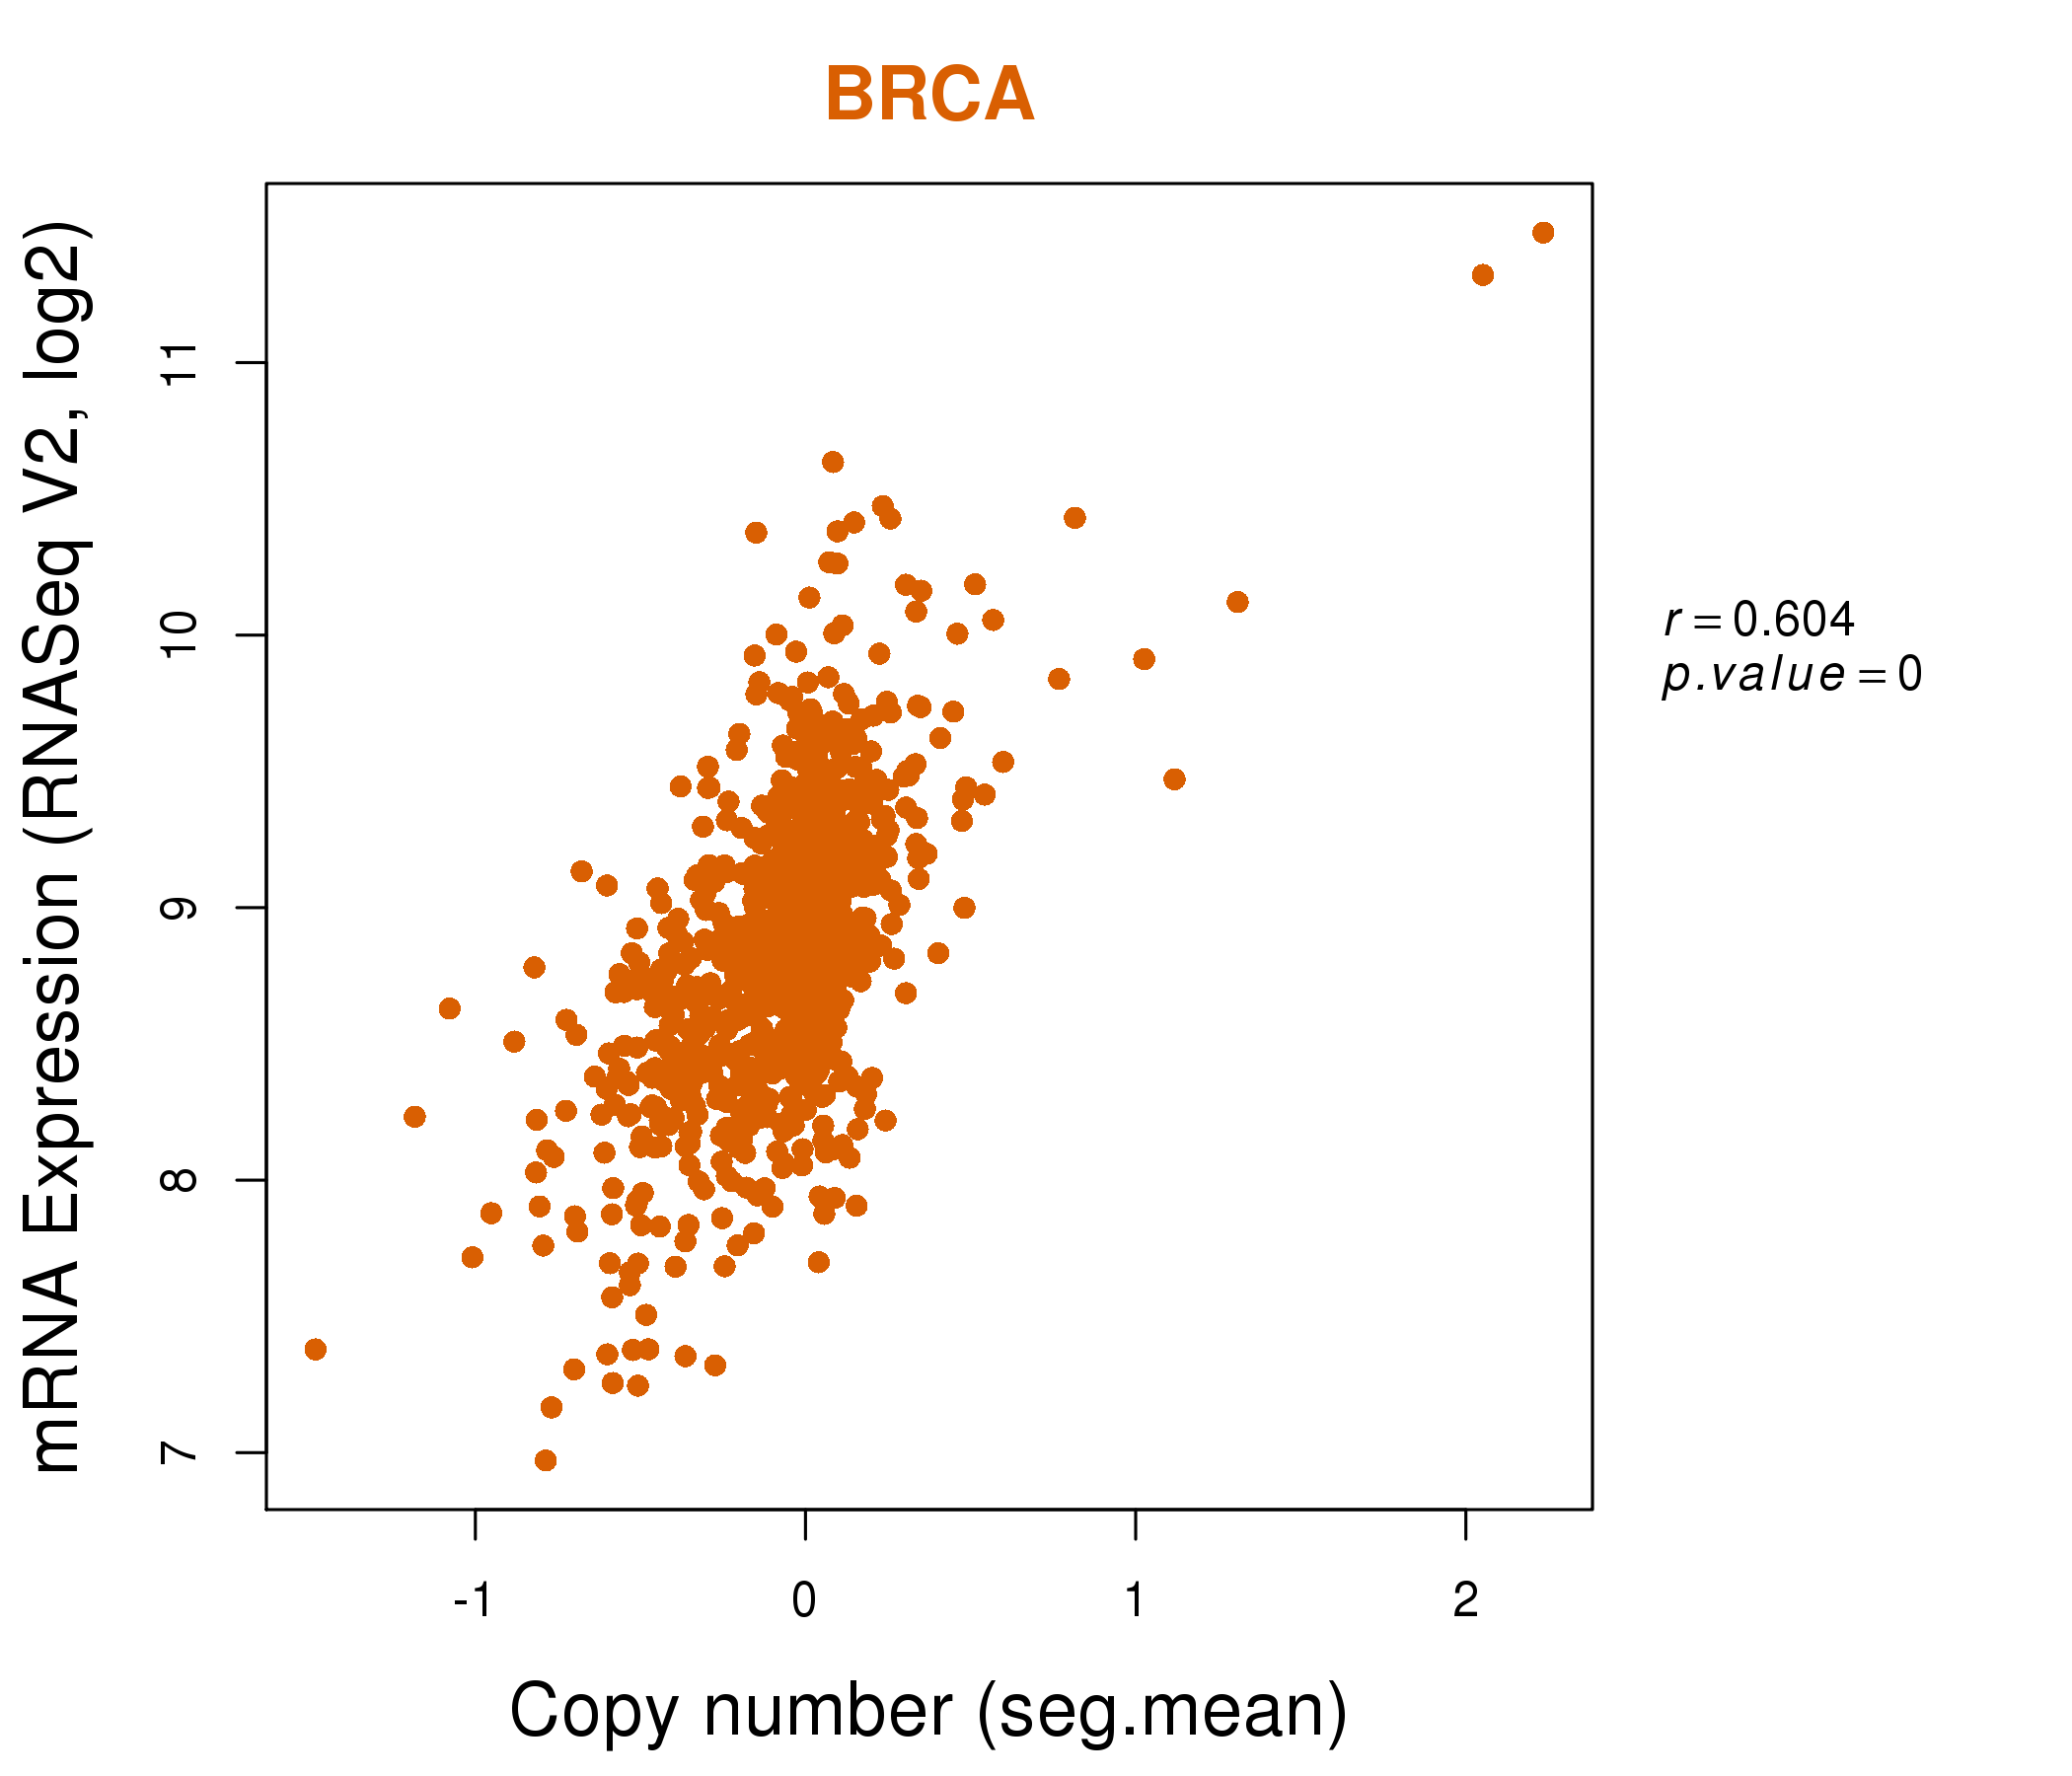
| * This plots show the correlation between CNV and gene expression. |
: Open all plots for all cancer types
 |
|
 |
|
| Top |
| Gene-Gene Network Information |
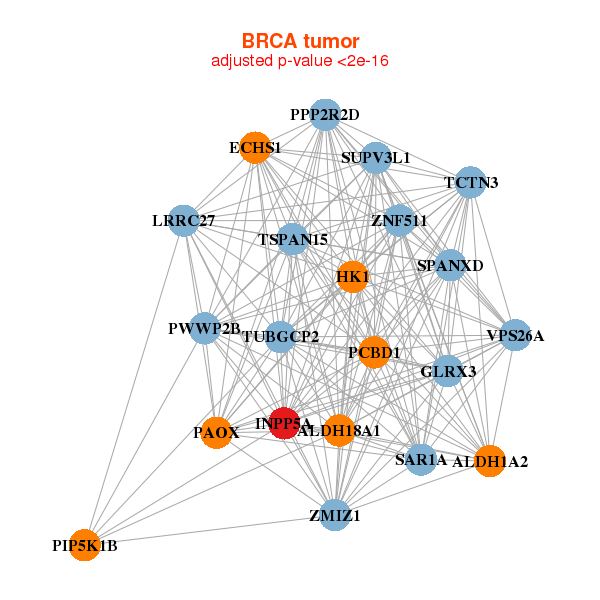
| * Co-Expression network figures were drawn using R package igraph. Only the top 20 genes with the highest correlations were shown. Red circle: input gene, orange circle: cell metabolism gene, sky circle: other gene |
: Open all plots for all cancer types
 |
|
| ALDH18A1,ALDH1A2,ECHS1,GLRX3,HK1,INPP5A,LRRC27, PAOX,PCBD1,PIP5K1B,PPP2R2D,PWWP2B,SAR1A,SPANXD, SUPV3L1,TCTN3,TSPAN15,TUBGCP2,VPS26A,ZMIZ1,ZNF511 | ACAT1,CASQ2,EPM2A,FEZ2,HADHB,HSPB6,INPP5A, LOC401093,NNT,OGDH,OPTN,PARK2,PGM1,PHYH, PKNOX2,PPP3CB,RXRG,SGCG,SNTA1,SOX6,ZAK |
 |
|
| ACTG2,CNN1,CSRP1,DACT3,DES,FLNC,FXYD1, GPM6A,HSPB6,INPP5A,LDB3,LOC401093,MYH11,PDZRN4, PRIMA1,PSD,PYGM,RBPMS2,SGCA,SYNPO2,TCEAL2 | ACTG2,ATP1A2,BVES,CAMK2G,DACT3,DES,DMPK, INPP5A,KY,LDB3,MOB2,MYOM1,NTSR1,PCP4L1, PDLIM7,PDZD4,PNCK,PYGM,SLC2A4,SLC8A2,SMTN |
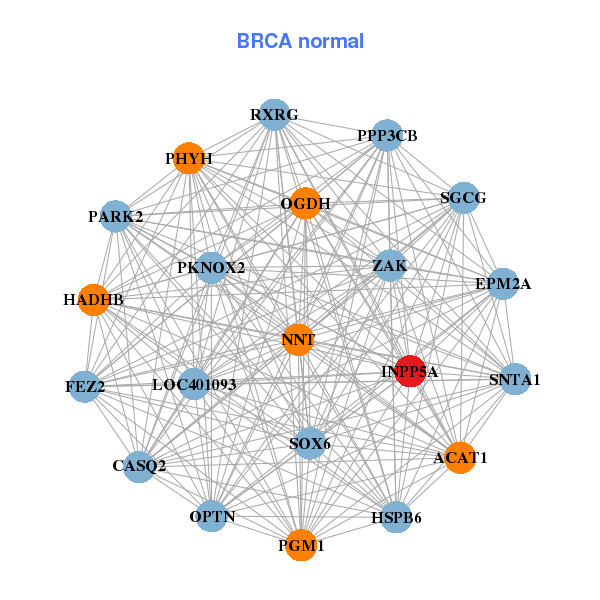

| * Co-Expression network figures were drawn using R package igraph. Only the top 20 genes with the highest correlations were shown. Red circle: input gene, orange circle: cell metabolism gene, sky circle: other gene |
: Open all plots for all cancer types
| Top |
: Open all interacting genes' information including KEGG pathway for all interacting genes from DAVID
| Top |
| Pharmacological Information for INPP5A |
| There's no related Drug. |
| Top |
| Cross referenced IDs for INPP5A |
| * We obtained these cross-references from Uniprot database. It covers 150 different DBs, 18 categories. http://www.uniprot.org/help/cross_references_section |
: Open all cross reference information
|
Copyright © 2016-Present - The Univsersity of Texas Health Science Center at Houston @ |