|
||||||||||||||||||||||||||||||||||||||||||||||||||||||||||||||||||||||||||||||||||||||||||||||||||||||||||||||||||||||||||||||||||||||||||||||||||||||||||||||||||||||||||||||||||||||||||||||||||||||||||||||||||||||||||||||||||||||||||||||||||||||||||||||||||||||||||||||||||||||||||||||||||||||||||||||||||||||||||
| |
| Phenotypic Information (metabolism pathway, cancer, disease, phenome) |
| |
| |
| Gene-Gene Network Information: Co-Expression Network, Interacting Genes & KEGG |
| |
|


| Gene Summary for INPP5B |
| Top |
| Phenotypic Information for INPP5B(metabolism pathway, cancer, disease, phenome) |
| Cancer | CGAP: INPP5B |
| Familial Cancer Database: INPP5B | |
| * This gene is included in those cancer gene databases. |
|
|
|
|
|
|
| ||||||||||||||||||||||||||||||||||||||||||||||||||||||||||||||||||||||||||||||||||||||||||||||||||||||||||||||||||||||||||||||||||||||||||||||||||||||||||||||||||||||||||||||||||||||||||||||||||||||||||||||||||||||||||||||||||||||||||||||||||||||||||||||||||||||||||||||||||||||||||||||||||||||||||||||||||||
Oncogene 1 | Significant driver gene in | |||||||||||||||||||||||||||||||||||||||||||||||||||||||||||||||||||||||||||||||||||||||||||||||||||||||||||||||||||||||||||||||||||||||||||||||||||||||||||||||||||||||||||||||||||||||||||||||||||||||||||||||||||||||||||||||||||||||||||||||||||||||||||||||||||||||||||||||||||||||||||||||||||||||||||||||||||||||||
| cf) number; DB name 1 Oncogene; http://nar.oxfordjournals.org/content/35/suppl_1/D721.long, 2 Tumor Suppressor gene; https://bioinfo.uth.edu/TSGene/, 3 Cancer Gene Census; http://www.nature.com/nrc/journal/v4/n3/abs/nrc1299.html, 4 CancerGenes; http://nar.oxfordjournals.org/content/35/suppl_1/D721.long, 5 Network of Cancer Gene; http://ncg.kcl.ac.uk/index.php, 1Therapeutic Vulnerabilities in Cancer; http://cbio.mskcc.org/cancergenomics/statius/ |
| KEGG_INOSITOL_PHOSPHATE_METABOLISM | |
| OMIM | |
| Orphanet | |
| Disease | KEGG Disease: INPP5B |
| MedGen: INPP5B (Human Medical Genetics with Condition) | |
| ClinVar: INPP5B | |
| Phenotype | MGI: INPP5B (International Mouse Phenotyping Consortium) |
| PhenomicDB: INPP5B | |
| Mutations for INPP5B |
| * Under tables are showing count per each tissue to give us broad intuition about tissue specific mutation patterns.You can go to the detailed page for each mutation database's web site. |
| - Statistics for Tissue and Mutation type | Top |
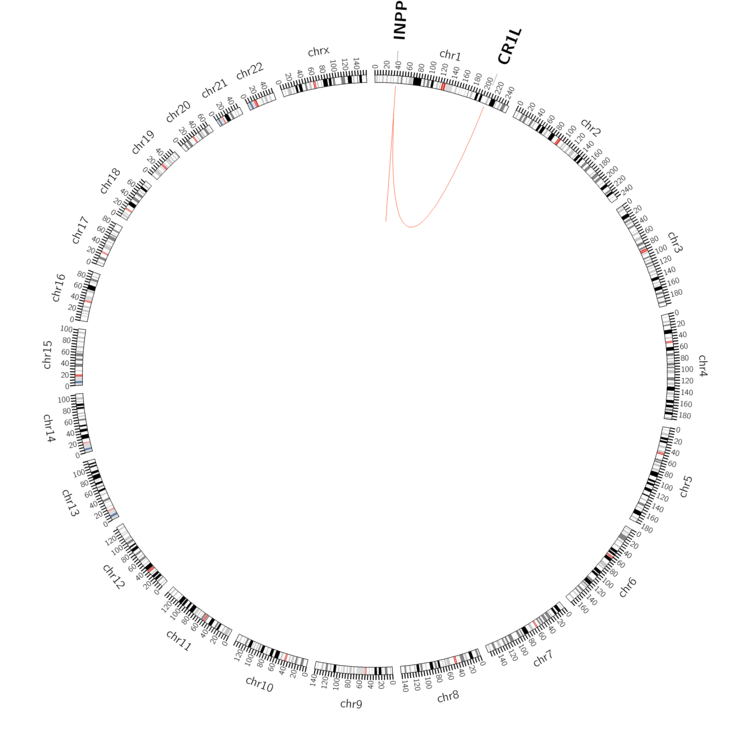 |
| - For Inter-chromosomal Variations |
| There's no inter-chromosomal structural variation. |
| - For Intra-chromosomal Variations |
| * Intra-chromosomal variantions includes 'intrachromosomal amplicon to amplicon', 'intrachromosomal amplicon to non-amplified dna', 'intrachromosomal deletion', 'intrachromosomal fold-back inversion', 'intrachromosomal inversion', 'intrachromosomal tandem duplication', 'Intrachromosomal unknown type', 'intrachromosomal with inverted orientation', 'intrachromosomal with non-inverted orientation'. |
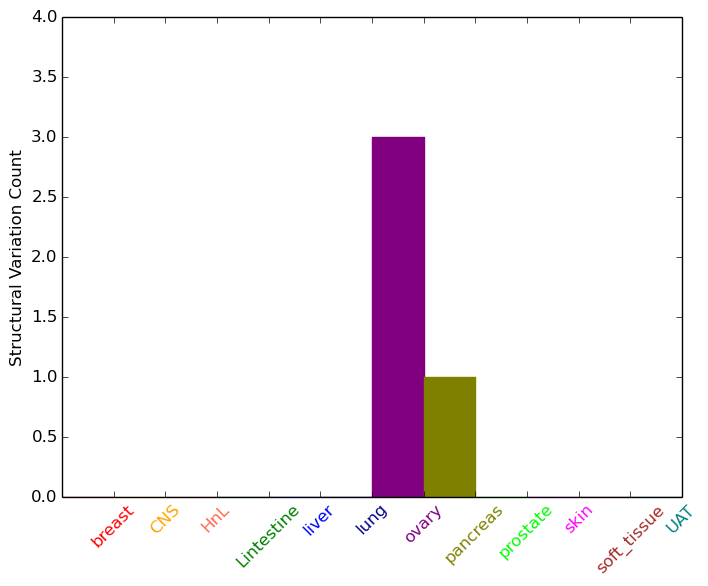 |
| Sample | Symbol_a | Chr_a | Start_a | End_a | Symbol_b | Chr_b | Start_b | End_b |
| ovary | INPP5B | chr1 | 38411069 | 38411089 | CR1L | chr1 | 207837809 | 207837829 |
| pancreas | INPP5B | chr1 | 38398329 | 38398349 | INPP5B | chr1 | 38401447 | 38401467 |
| cf) Tissue number; Tissue name (1;Breast, 2;Central_nervous_system, 3;Haematopoietic_and_lymphoid_tissue, 4;Large_intestine, 5;Liver, 6;Lung, 7;Ovary, 8;Pancreas, 9;Prostate, 10;Skin, 11;Soft_tissue, 12;Upper_aerodigestive_tract) |
| * From mRNA Sanger sequences, Chitars2.0 arranged chimeric transcripts. This table shows INPP5B related fusion information. |
| ID | Head Gene | Tail Gene | Accession | Gene_a | qStart_a | qEnd_a | Chromosome_a | tStart_a | tEnd_a | Gene_a | qStart_a | qEnd_a | Chromosome_a | tStart_a | tEnd_a |
| AA256218 | INPP5B | 1 | 209 | 1 | 38327943 | 38330032 | PDCL | 206 | 430 | 9 | 125581560 | 125581784 | |
| CR738758 | RANBP2 | 6 | 230 | 2 | 109401034 | 109401258 | INPP5B | 223 | 543 | 1 | 38327455 | 38327775 | |
| AW364441 | INPP5B | 10 | 251 | 1 | 38383879 | 38384120 | INPP5B | 246 | 619 | 1 | 38393827 | 38394518 | |
| BF988467 | SNX22 | 12 | 220 | 15 | 64448923 | 64452326 | INPP5B | 214 | 608 | 1 | 38338211 | 38338604 | |
| Top |
| Mutation type/ Tissue ID | brca | cns | cerv | endome | haematopo | kidn | Lintest | liver | lung | ns | ovary | pancre | prost | skin | stoma | thyro | urina | |||
| Total # sample | 1 | 1 | ||||||||||||||||||
| GAIN (# sample) | 1 | 1 | ||||||||||||||||||
| LOSS (# sample) |
| cf) Tissue ID; Tissue type (1; Breast, 2; Central_nervous_system, 3; Cervix, 4; Endometrium, 5; Haematopoietic_and_lymphoid_tissue, 6; Kidney, 7; Large_intestine, 8; Liver, 9; Lung, 10; NS, 11; Ovary, 12; Pancreas, 13; Prostate, 14; Skin, 15; Stomach, 16; Thyroid, 17; Urinary_tract) |
| Top |
|
 |
| Top |
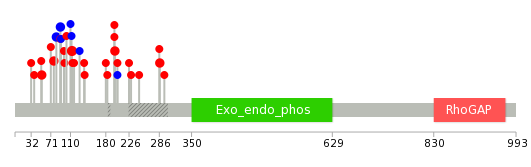
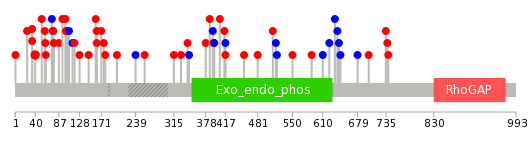
| Stat. for Non-Synonymous SNVs (# total SNVs=22) | (# total SNVs=5) |
 |  |
(# total SNVs=0) | (# total SNVs=0) |
| Top |
| * When you move the cursor on each content, you can see more deailed mutation information on the Tooltip. Those are primary_site,primary_histology,mutation(aa),pubmedID. |
| GRCh37 position | Mutation(aa) | Unique sampleID count |
| chr1:38409491-38409491 | p.S113L | 3 |
| chr1:38411445-38411445 | p.H82H | 2 |
| chr1:38411462-38411462 | p.R77C | 2 |
| chr1:38397636-38397636 | p.G198C | 2 |
| chr1:38411934-38411934 | p.Y53C | 2 |
| chr1:38397369-38397369 | p.G287S | 2 |
| chr1:38409559-38409559 | p.F90F | 2 |
| chr1:38397621-38397621 | p.L203I | 1 |
| chr1:38409488-38409488 | p.R114Q | 1 |
| chr1:38411480-38411480 | p.R71C | 1 |
| Top |
|
 |
| Point Mutation/ Tissue ID | 1 | 2 | 3 | 4 | 5 | 6 | 7 | 8 | 9 | 10 | 11 | 12 | 13 | 14 | 15 | 16 | 17 | 18 | 19 | 20 |
| # sample | 2 | 5 | 4 | 1 | 4 | 1 | 3 | 1 | 4 | 8 | 1 | 11 | 6 | 1 | 7 | |||||
| # mutation | 2 | 5 | 4 | 1 | 4 | 1 | 3 | 2 | 4 | 8 | 1 | 12 | 6 | 1 | 8 | |||||
| nonsynonymous SNV | 1 | 4 | 3 | 1 | 3 | 1 | 3 | 1 | 3 | 7 | 1 | 5 | 6 | 5 | ||||||
| synonymous SNV | 1 | 1 | 1 | 1 | 1 | 1 | 1 | 7 | 1 | 3 |
| cf) Tissue ID; Tissue type (1; BLCA[Bladder Urothelial Carcinoma], 2; BRCA[Breast invasive carcinoma], 3; CESC[Cervical squamous cell carcinoma and endocervical adenocarcinoma], 4; COAD[Colon adenocarcinoma], 5; GBM[Glioblastoma multiforme], 6; Glioma Low Grade, 7; HNSC[Head and Neck squamous cell carcinoma], 8; KICH[Kidney Chromophobe], 9; KIRC[Kidney renal clear cell carcinoma], 10; KIRP[Kidney renal papillary cell carcinoma], 11; LAML[Acute Myeloid Leukemia], 12; LUAD[Lung adenocarcinoma], 13; LUSC[Lung squamous cell carcinoma], 14; OV[Ovarian serous cystadenocarcinoma ], 15; PAAD[Pancreatic adenocarcinoma], 16; PRAD[Prostate adenocarcinoma], 17; SKCM[Skin Cutaneous Melanoma], 18:STAD[Stomach adenocarcinoma], 19:THCA[Thyroid carcinoma], 20:UCEC[Uterine Corpus Endometrial Carcinoma]) |
| Top |
| * We represented just top 10 SNVs. When you move the cursor on each content, you can see more deailed mutation information on the Tooltip. Those are primary_site, primary_histology, mutation(aa), pubmedID. |
| Genomic Position | Mutation(aa) | Unique sampleID count |
| chr1:38411462 | p.R40C | 2 |
| chr1:38345781 | p.D345D,INPP5B | 1 |
| chr1:38353938 | p.H87Y,INPP5B | 1 |
| chr1:38331538 | p.F53I | 1 |
| chr1:38406399 | p.E588Q,INPP5B | 1 |
| chr1:38341323 | p.T342M,INPP5B | 1 |
| chr1:38411480 | p.S61F,INPP5B | 1 |
| chr1:38345821 | p.M550T,INPP5B | 1 |
| chr1:38353980 | p.E329Q,INPP5B | 1 |
| chr1:38331553 | p.R59S,INPP5B | 1 |
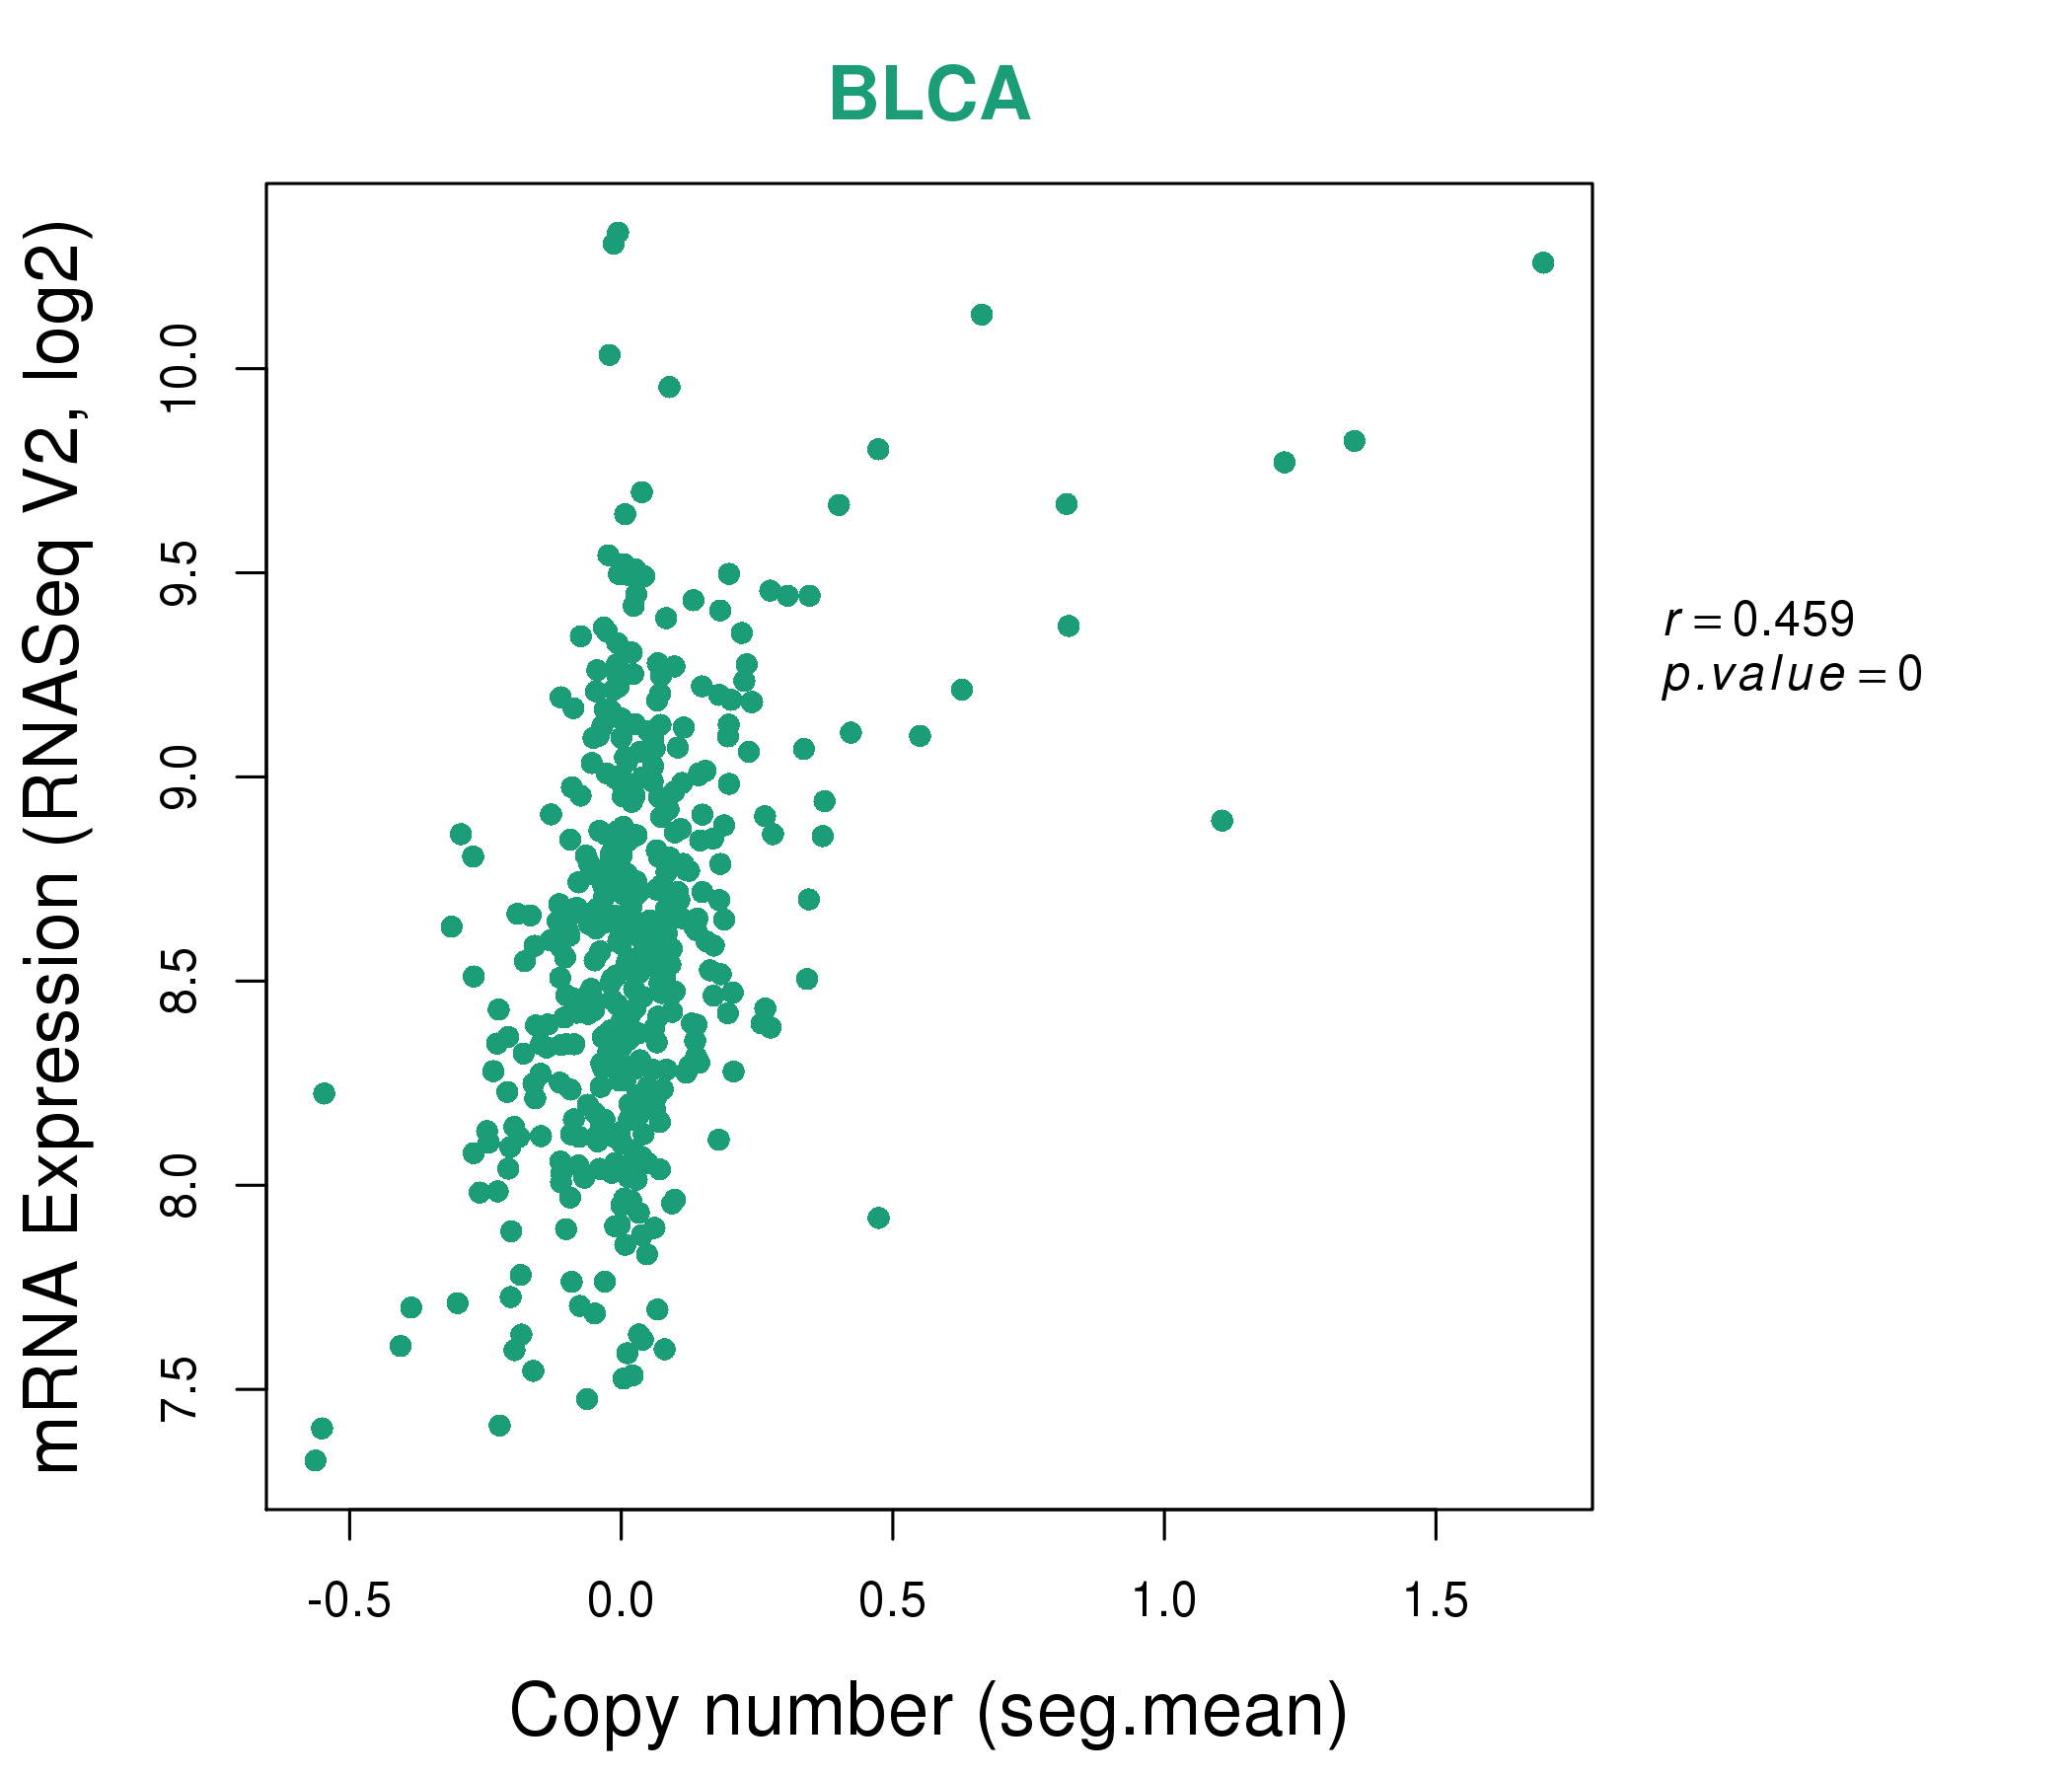
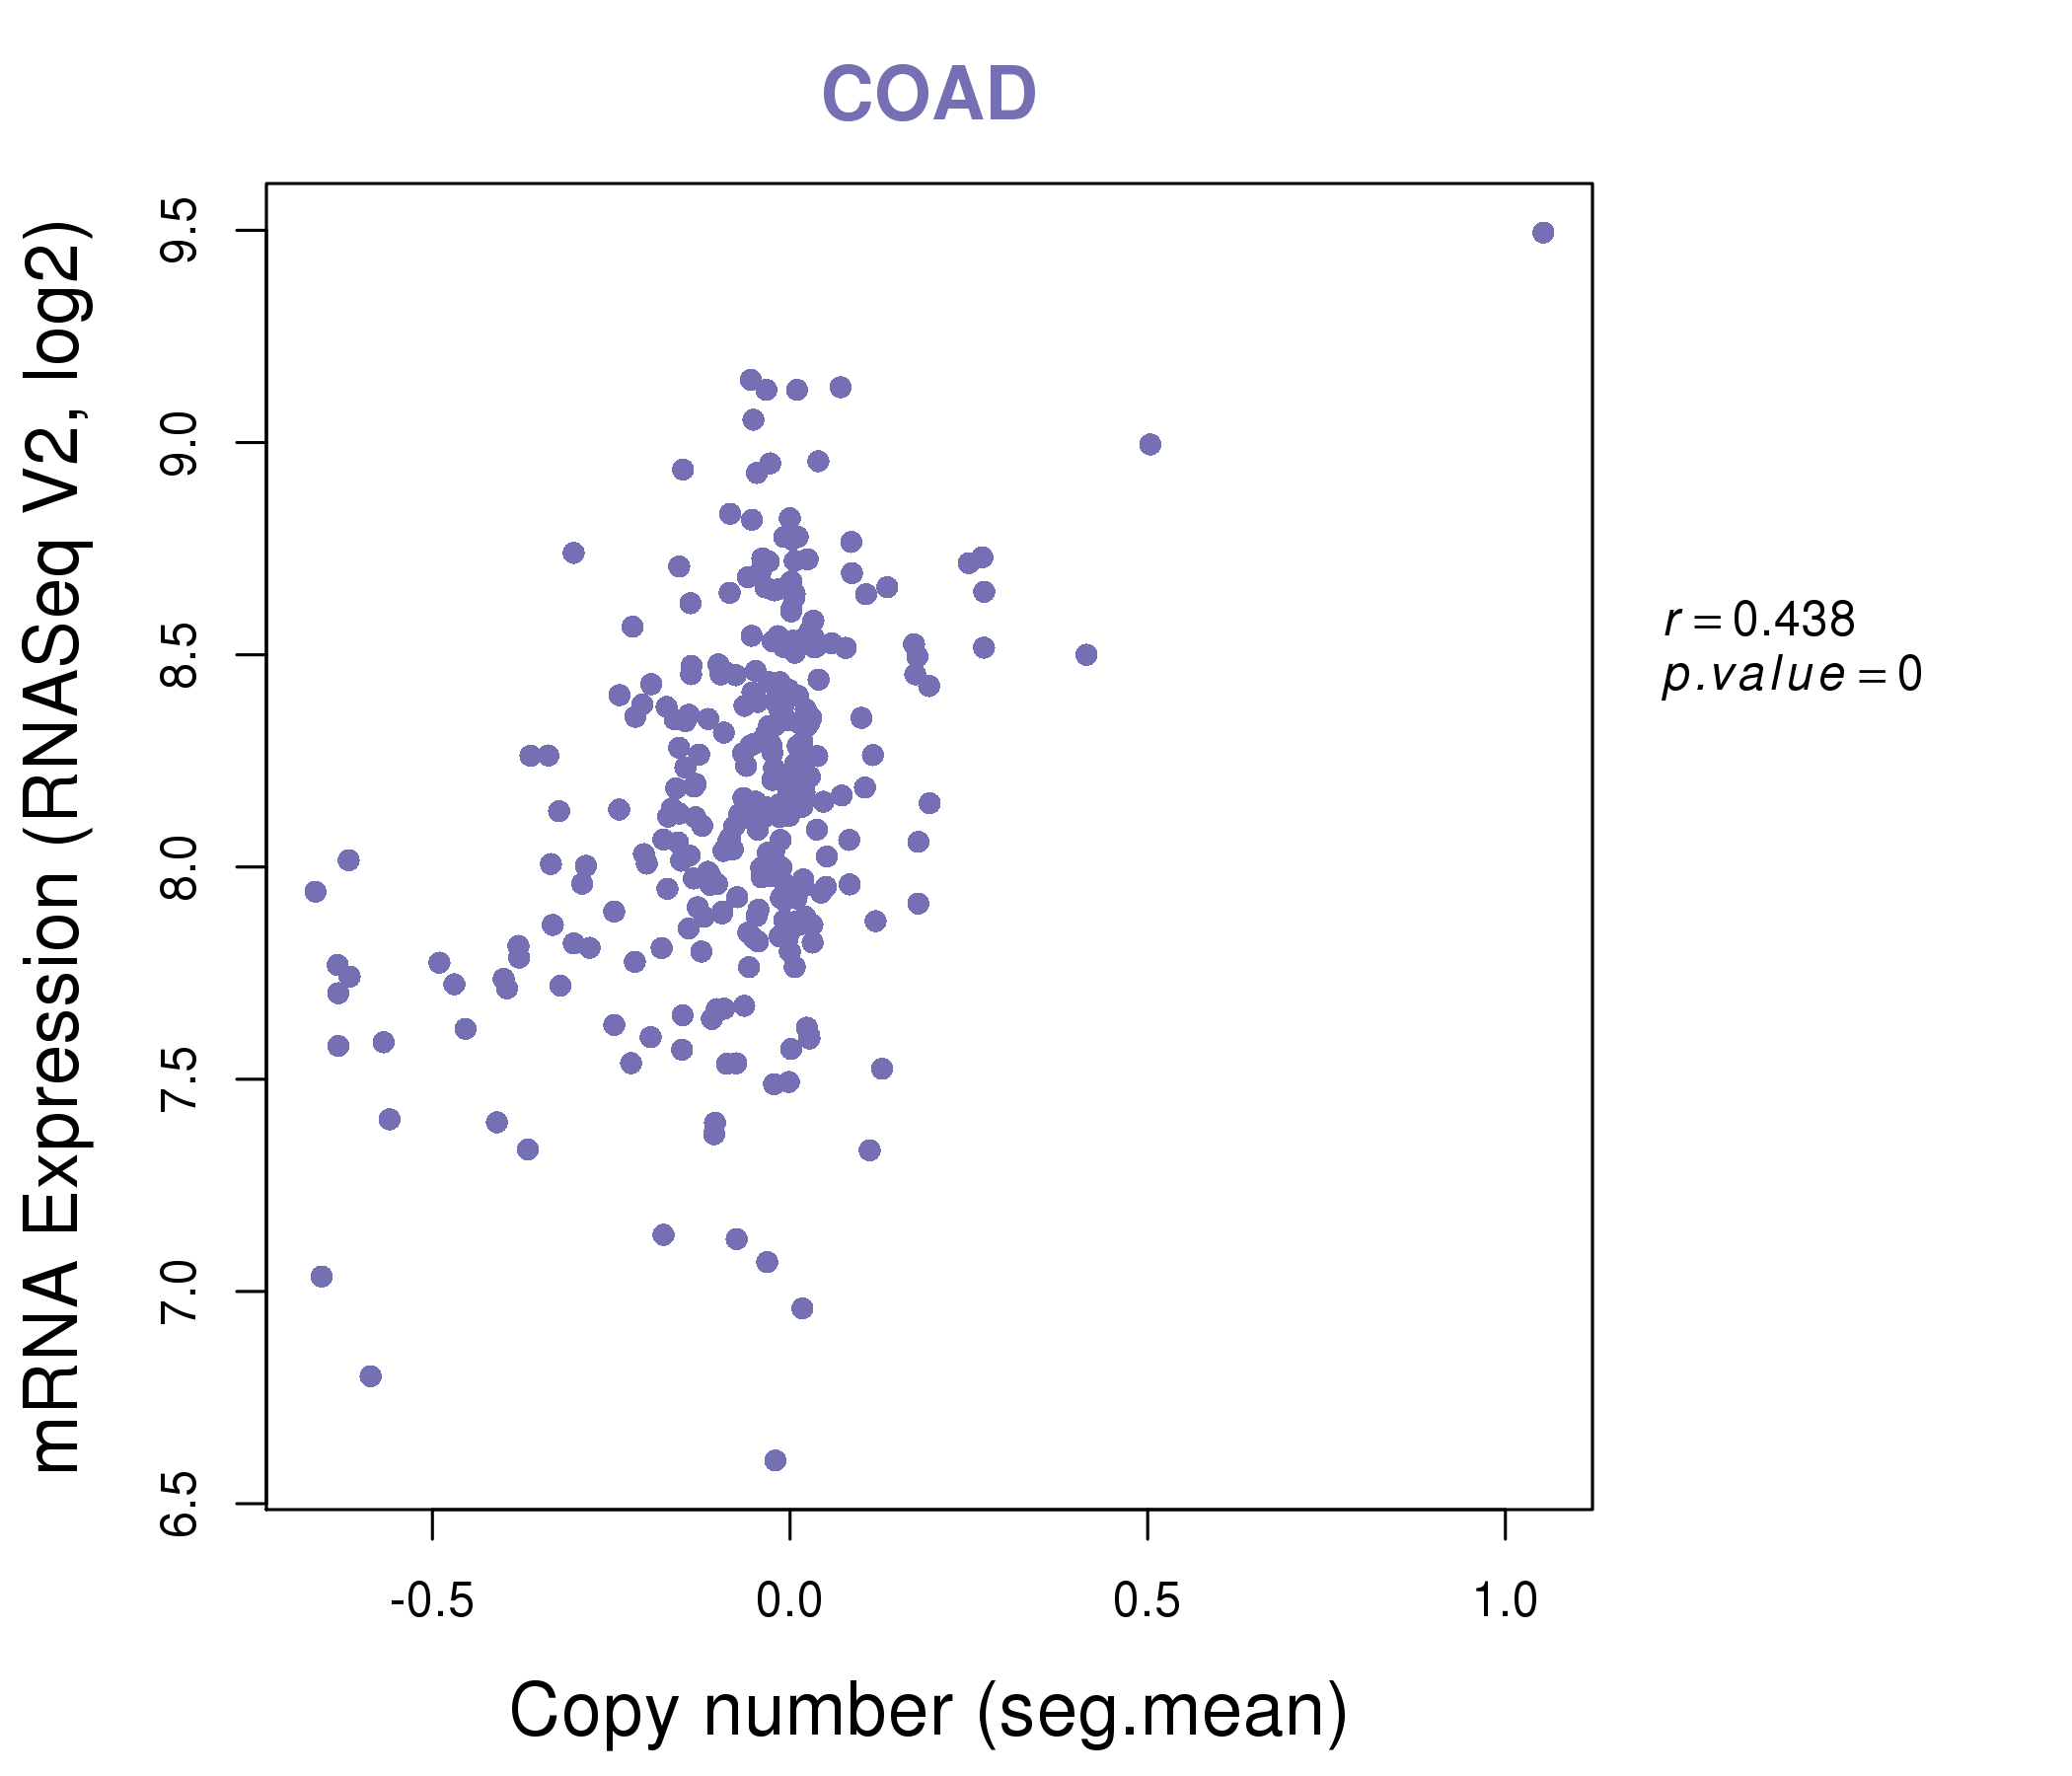
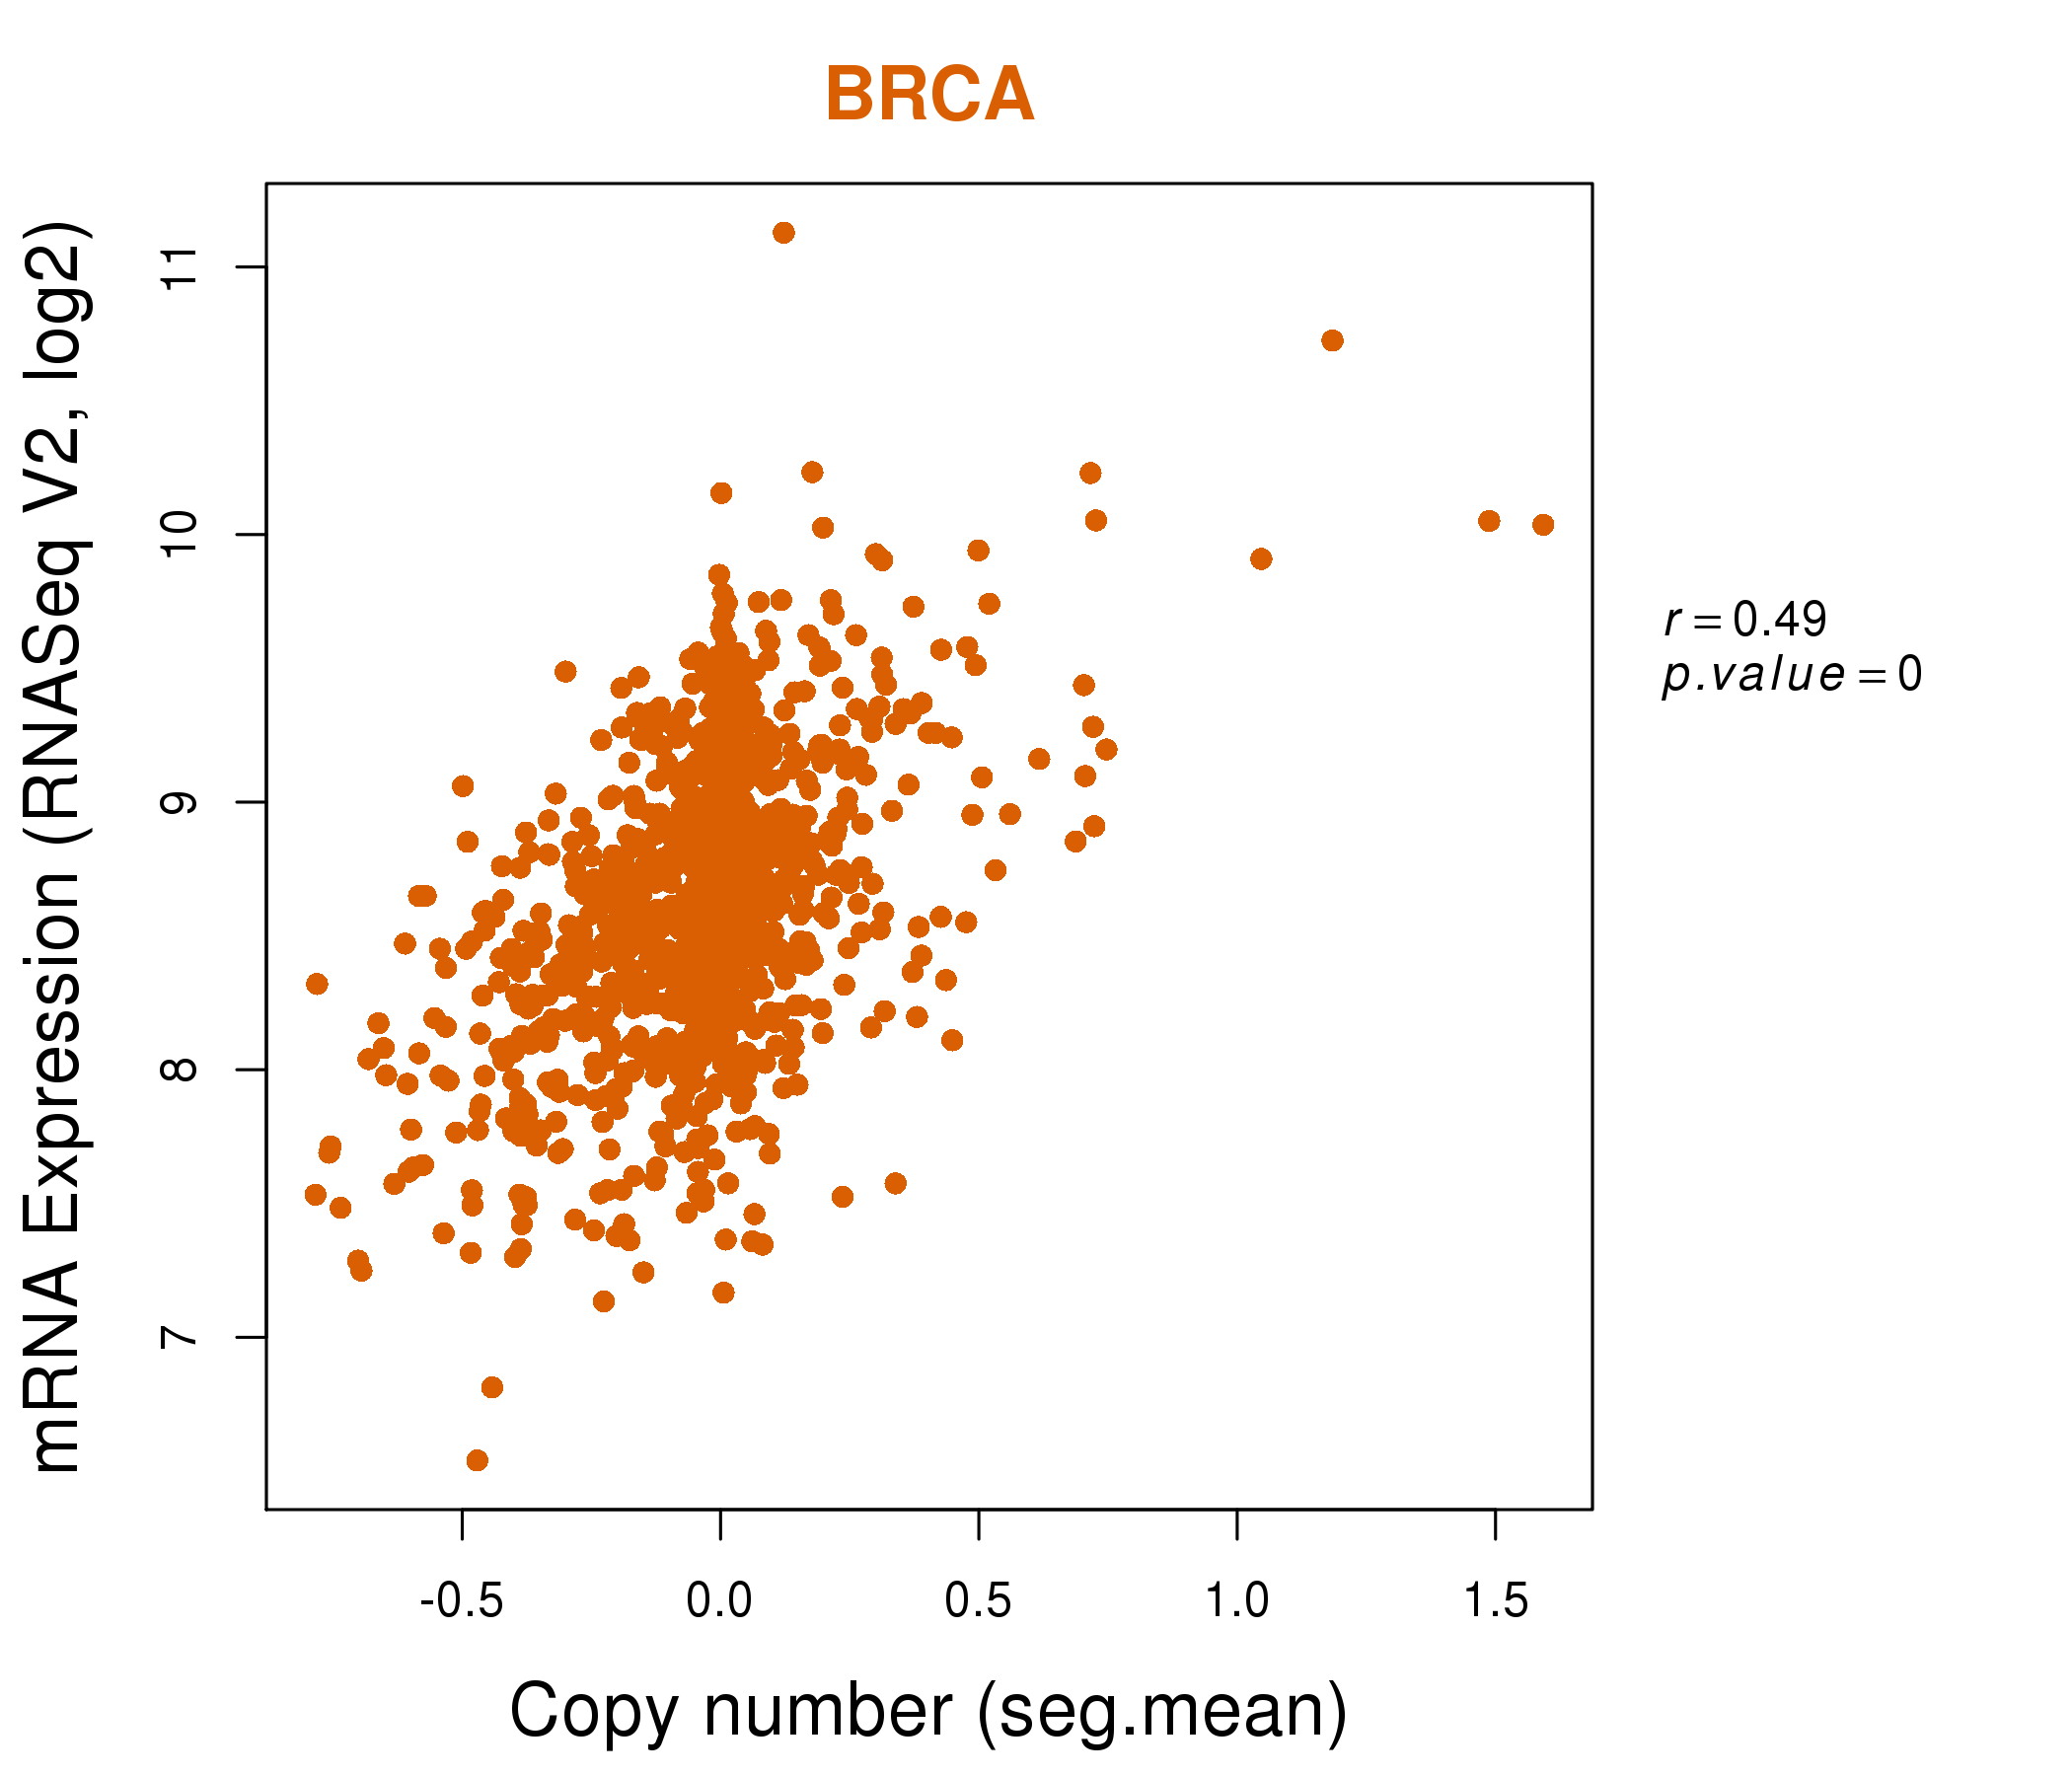
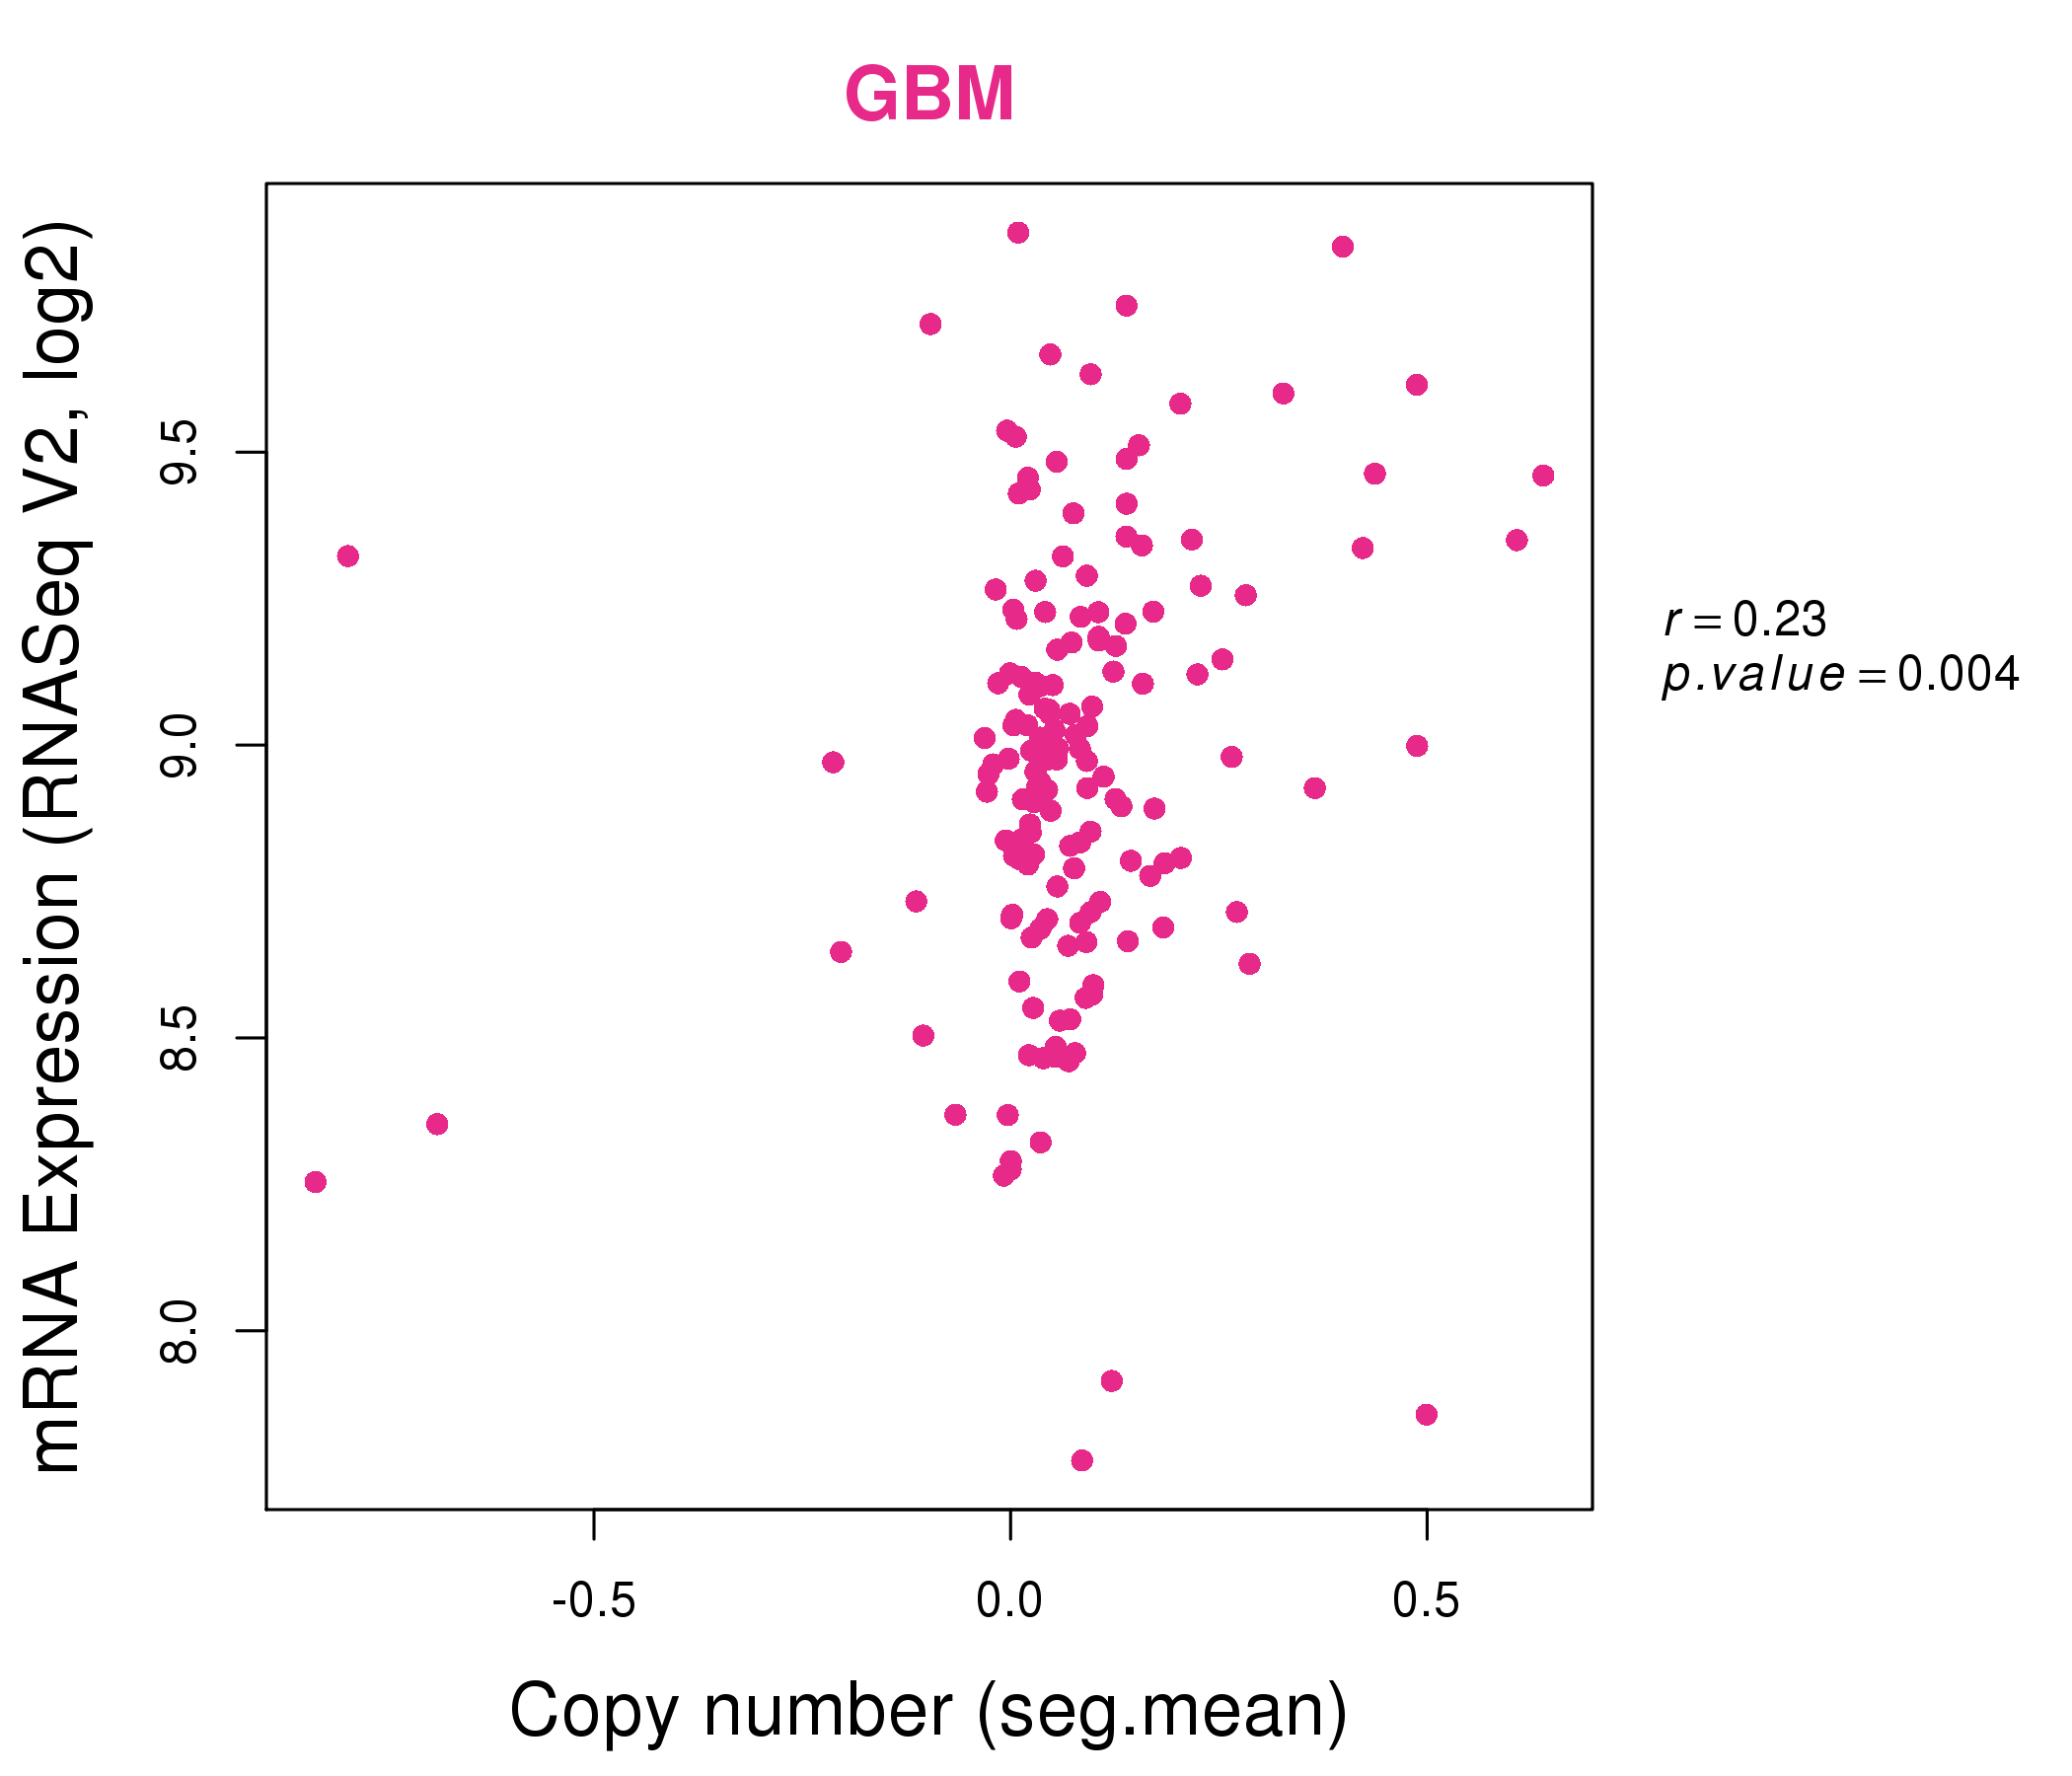
| * Copy number data were extracted from TCGA using R package TCGA-Assembler. The URLs of all public data files on TCGA DCC data server were gathered on Jan-05-2015. Function ProcessCNAData in TCGA-Assembler package was used to obtain gene-level copy number value which is calculated as the average copy number of the genomic region of a gene. |
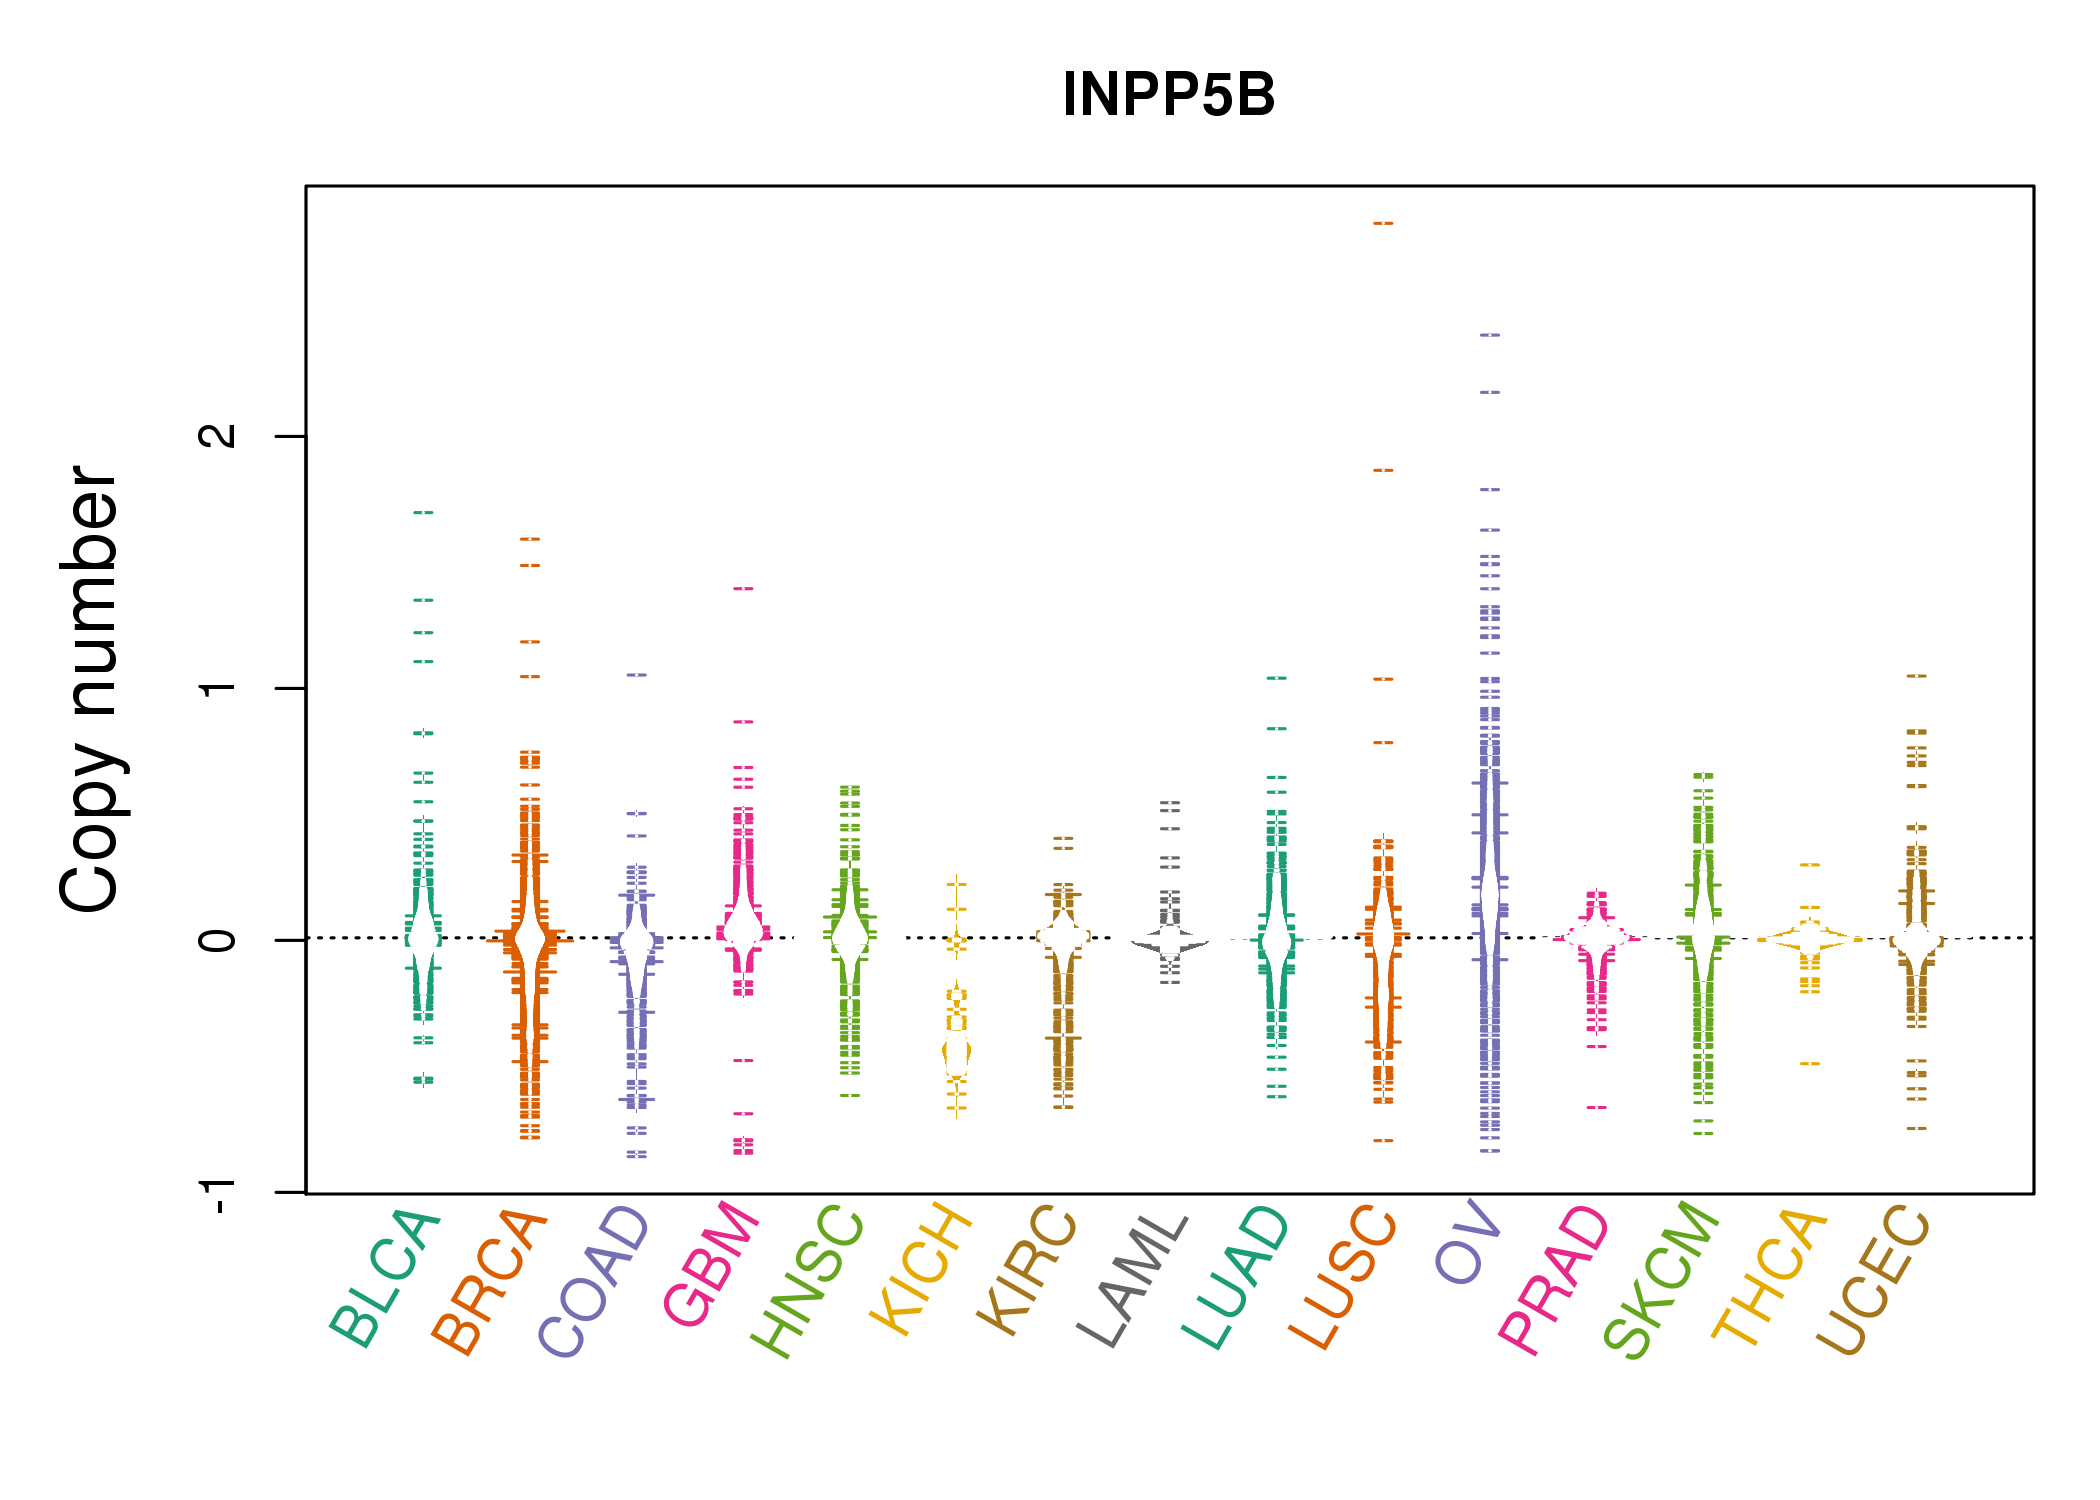 |
| cf) Tissue ID[Tissue type]: BLCA[Bladder Urothelial Carcinoma], BRCA[Breast invasive carcinoma], CESC[Cervical squamous cell carcinoma and endocervical adenocarcinoma], COAD[Colon adenocarcinoma], GBM[Glioblastoma multiforme], Glioma Low Grade, HNSC[Head and Neck squamous cell carcinoma], KICH[Kidney Chromophobe], KIRC[Kidney renal clear cell carcinoma], KIRP[Kidney renal papillary cell carcinoma], LAML[Acute Myeloid Leukemia], LUAD[Lung adenocarcinoma], LUSC[Lung squamous cell carcinoma], OV[Ovarian serous cystadenocarcinoma ], PAAD[Pancreatic adenocarcinoma], PRAD[Prostate adenocarcinoma], SKCM[Skin Cutaneous Melanoma], STAD[Stomach adenocarcinoma], THCA[Thyroid carcinoma], UCEC[Uterine Corpus Endometrial Carcinoma] |
| Top |
| Gene Expression for INPP5B |
| * CCLE gene expression data were extracted from CCLE_Expression_Entrez_2012-10-18.res: Gene-centric RMA-normalized mRNA expression data. |
 |
| * Normalized gene expression data of RNASeqV2 was extracted from TCGA using R package TCGA-Assembler. The URLs of all public data files on TCGA DCC data server were gathered at Jan-05-2015. Only eight cancer types have enough normal control samples for differential expression analysis. (t test, adjusted p<0.05 (using Benjamini-Hochberg FDR)) |
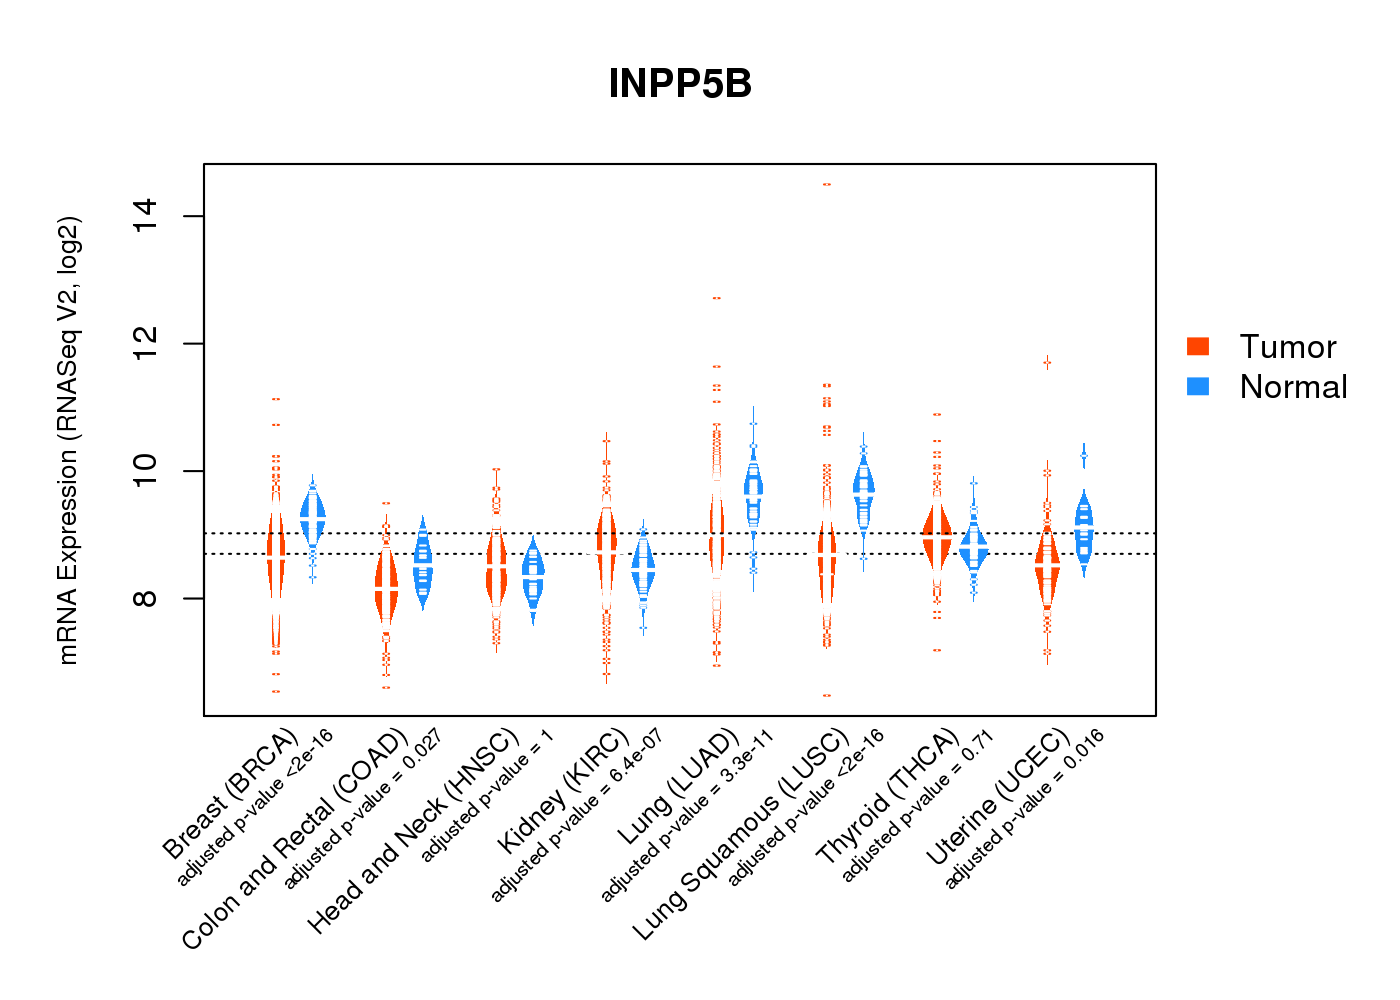 |
| Top |
| * This plots show the correlation between CNV and gene expression. |
: Open all plots for all cancer types
 |
|
 |
|
| Top |
| Gene-Gene Network Information |
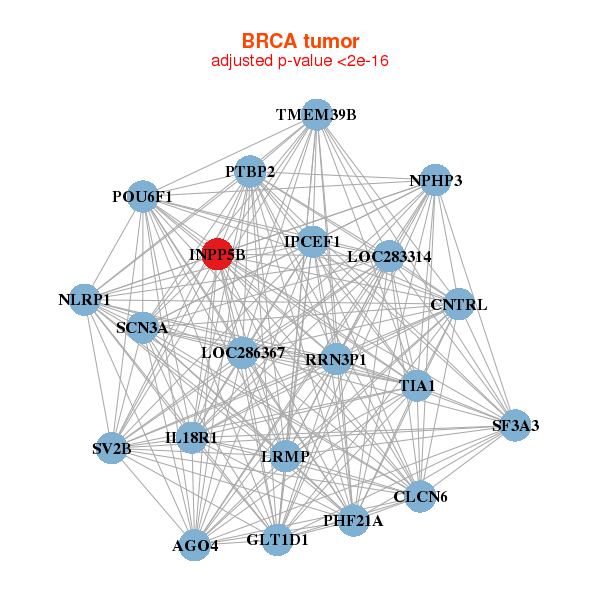
| * Co-Expression network figures were drawn using R package igraph. Only the top 20 genes with the highest correlations were shown. Red circle: input gene, orange circle: cell metabolism gene, sky circle: other gene |
: Open all plots for all cancer types
 |
|
| CNTRL,CLCN6,AGO4,GLT1D1,IL18R1,INPP5B,IPCEF1, LOC283314,LOC286367,LRMP,NLRP1,NPHP3,PHF21A,POU6F1, PTBP2,RRN3P1,SCN3A,SF3A3,SV2B,TIA1,TMEM39B | CELF6,CEP120,DMTF1,GATAD1,GOLGA6L10,GPRASP1,INPP5B, KCNMB3,CEP162,MLLT10,NPHP3,PHF21A,S100PBP,SEPT7P2, PNISR,TTF1,TUBGCP3,USPL1,ZMAT1,KRBOX4,ZNF75D |
 |
|
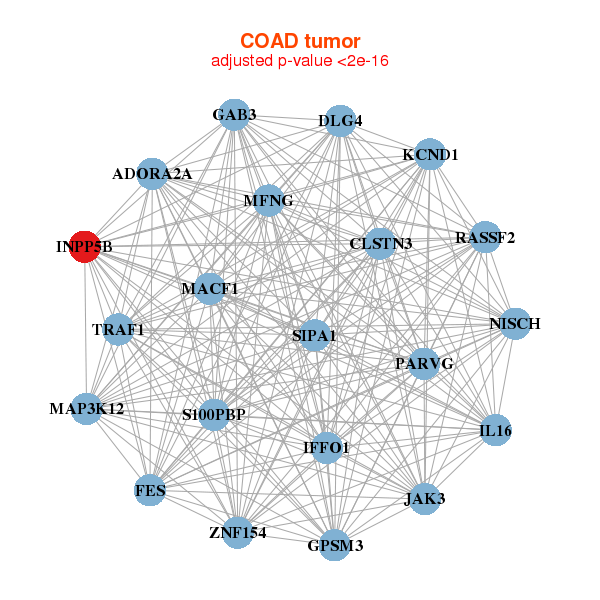
| ADORA2A,CLSTN3,DLG4,FES,GAB3,GPSM3,IFFO1, IL16,INPP5B,JAK3,KCND1,MACF1,MAP3K12,MFNG, NISCH,PARVG,RASSF2,S100PBP,SIPA1,TRAF1,ZNF154 | ANKRD23,ASXL1,ATM,BZRAP1,CEP97,INPP5B,L3MBTL1, NBPF15,NLRP1,OBSCN,PNISR,SLC25A27,SPIN3,SYNGAP1, TRAF5,TTLL3,ZCCHC11,ZNF37BP,ZNF589,ZNF594,ZNF767P |


| * Co-Expression network figures were drawn using R package igraph. Only the top 20 genes with the highest correlations were shown. Red circle: input gene, orange circle: cell metabolism gene, sky circle: other gene |
: Open all plots for all cancer types
| Top |
: Open all interacting genes' information including KEGG pathway for all interacting genes from DAVID
| Top |
| Pharmacological Information for INPP5B |
| There's no related Drug. |
| Top |
| Cross referenced IDs for INPP5B |
| * We obtained these cross-references from Uniprot database. It covers 150 different DBs, 18 categories. http://www.uniprot.org/help/cross_references_section |
: Open all cross reference information
|
Copyright © 2016-Present - The Univsersity of Texas Health Science Center at Houston @ |