|
|||||||||||||||||||||||||||||||||||||||||||||||||||||||||||||||||||||||||||||||||||||||||||||||||||||||||||||||||||||||||||||||||||||||||||||||||||||||||||||||||||||||||||||||||||||||||||||||||||||||||||||||||||||||||||||||||||||||||||||||||||||||||||||||||||||||||||||||||||||||||||||||||||||||||||||||||||||||||||||||||||||||||||||||||||||||||
| |
| Phenotypic Information (metabolism pathway, cancer, disease, phenome) |
| |
| |
| Gene-Gene Network Information: Co-Expression Network, Interacting Genes & KEGG |
| |
|


| Gene Summary for INPPL1 |
| Basic gene info. | Gene symbol | INPPL1 |
| Gene name | inositol polyphosphate phosphatase-like 1 | |
| Synonyms | OPSMD|SHIP2 | |
| Cytomap | UCSC genome browser: 11q13 | |
| Genomic location | chr11 :71935881-71950188 | |
| Type of gene | protein-coding | |
| RefGenes | NM_001567.3, | |
| Ensembl id | ENSG00000165458 | |
| Description | 51C proteinINPPL-1SH2 domain-containing inositol 5'-phosphatase 2SH2 domain-containing inositol-5'-phosphatase 2SHIP-2phosphatidylinositol 3,4,5-trisphosphate 5-phosphatase 2phosphatidylinositol-3,4,5-trisphosphate 5-phosphatase 2protein 51C | |
| Modification date | 20141207 | |
| dbXrefs | MIM : 600829 | |
| HGNC : HGNC | ||
| Ensembl : ENSG00000165458 | ||
| HPRD : 02900 | ||
| Vega : OTTHUMG00000167879 | ||
| Protein | UniProt: O15357 go to UniProt's Cross Reference DB Table | |
| Expression | CleanEX: HS_INPPL1 | |
| BioGPS: 3636 | ||
| Gene Expression Atlas: ENSG00000165458 | ||
| The Human Protein Atlas: ENSG00000165458 | ||
| Pathway | NCI Pathway Interaction Database: INPPL1 | |
| KEGG: INPPL1 | ||
| REACTOME: INPPL1 | ||
| ConsensusPathDB | ||
| Pathway Commons: INPPL1 | ||
| Metabolism | MetaCyc: INPPL1 | |
| HUMANCyc: INPPL1 | ||
| Regulation | Ensembl's Regulation: ENSG00000165458 | |
| miRBase: chr11 :71,935,881-71,950,188 | ||
| TargetScan: NM_001567 | ||
| cisRED: ENSG00000165458 | ||
| Context | iHOP: INPPL1 | |
| cancer metabolism search in PubMed: INPPL1 | ||
| UCL Cancer Institute: INPPL1 | ||
| Assigned class in ccmGDB | B - This gene belongs to cancer gene. | |
| Top |
| Phenotypic Information for INPPL1(metabolism pathway, cancer, disease, phenome) |
| Cancer | CGAP: INPPL1 |
| Familial Cancer Database: INPPL1 | |
| * This gene is included in those cancer gene databases. |
|
|
|
|
|
|
| |||||||||||||||||||||||||||||||||||||||||||||||||||||||||||||||||||||||||||||||||||||||||||||||||||||||||||||||||||||||||||||||||||||||||||||||||||||||||||||||||||||||||||||||||||||||||||||||||||||||||||||||||||||||||||||||||||||||||||||||||||||||||||||||||||||||||||||||||||||||||||||||||||||||||||||||||||||||||||||||||||||||||||||||||||
Oncogene 1 | Significant driver gene in UCEC 6, | ||||||||||||||||||||||||||||||||||||||||||||||||||||||||||||||||||||||||||||||||||||||||||||||||||||||||||||||||||||||||||||||||||||||||||||||||||||||||||||||||||||||||||||||||||||||||||||||||||||||||||||||||||||||||||||||||||||||||||||||||||||||||||||||||||||||||||||||||||||||||||||||||||||||||||||||||||||||||||||||||||||||||||||||||||||||||
| cf) number; DB name 1 Oncogene; http://nar.oxfordjournals.org/content/35/suppl_1/D721.long, 2 Tumor Suppressor gene; https://bioinfo.uth.edu/TSGene/, 3 Cancer Gene Census; http://www.nature.com/nrc/journal/v4/n3/abs/nrc1299.html, 4 CancerGenes; http://nar.oxfordjournals.org/content/35/suppl_1/D721.long, 5 Network of Cancer Gene; http://ncg.kcl.ac.uk/index.php, 6 http://www.nature.com/nature/journal/v497/n7447/full/nature12113.html, 7Therapeutic Vulnerabilities in Cancer; http://cbio.mskcc.org/cancergenomics/statius/ |
| KEGG_INOSITOL_PHOSPHATE_METABOLISM REACTOME_PHOSPHOLIPID_METABOLISM REACTOME_PI_METABOLISM REACTOME_METABOLISM_OF_LIPIDS_AND_LIPOPROTEINS | |
| OMIM | 125853; phenotype. 258480; phenotype. 600829; gene. |
| Orphanet | 2746; Opsismodysplasia. |
| Disease | KEGG Disease: INPPL1 |
| MedGen: INPPL1 (Human Medical Genetics with Condition) | |
| ClinVar: INPPL1 | |
| Phenotype | MGI: INPPL1 (International Mouse Phenotyping Consortium) |
| PhenomicDB: INPPL1 | |
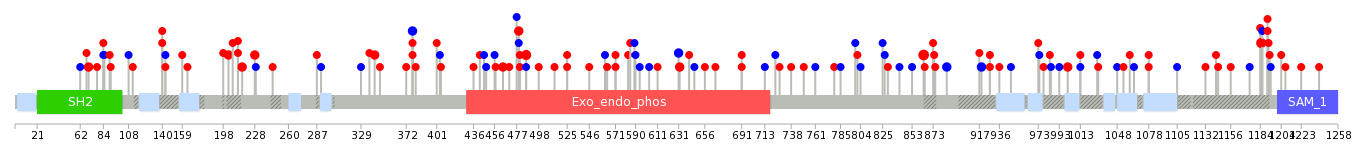
| Mutations for INPPL1 |
| * Under tables are showing count per each tissue to give us broad intuition about tissue specific mutation patterns.You can go to the detailed page for each mutation database's web site. |
| There's no structural variation information in COSMIC data for this gene. |
| * From mRNA Sanger sequences, Chitars2.0 arranged chimeric transcripts. This table shows INPPL1 related fusion information. |
| ID | Head Gene | Tail Gene | Accession | Gene_a | qStart_a | qEnd_a | Chromosome_a | tStart_a | tEnd_a | Gene_a | qStart_a | qEnd_a | Chromosome_a | tStart_a | tEnd_a |
| BE280713 | INPPL1 | 1 | 444 | 11 | 71944488 | 71946231 | INPPL1 | 436 | 460 | 11 | 71946224 | 71946248 | |
| BE765401 | INPPL1 | 17 | 139 | 11 | 71944142 | 71944542 | INPPL1 | 133 | 262 | 11 | 71944753 | 71945418 | |
| BC071891 | INPPL1 | 22 | 307 | 11 | 71948741 | 71949358 | NPM1 | 308 | 1586 | 5 | 170814870 | 170837881 | |
| BG991798 | INPPL1 | 19 | 391 | 11 | 71949304 | 71949677 | INPPL1 | 385 | 491 | 11 | 71946193 | 71946391 | |
| BF990573 | INPPL1 | 1 | 93 | 11 | 71940704 | 71940796 | COIL | 83 | 165 | 17 | 55016435 | 55016517 | |
| Top |
| Mutation type/ Tissue ID | brca | cns | cerv | endome | haematopo | kidn | Lintest | liver | lung | ns | ovary | pancre | prost | skin | stoma | thyro | urina | |||
| Total # sample | 1 | 1 | ||||||||||||||||||
| GAIN (# sample) | 1 | 1 | ||||||||||||||||||
| LOSS (# sample) |
| cf) Tissue ID; Tissue type (1; Breast, 2; Central_nervous_system, 3; Cervix, 4; Endometrium, 5; Haematopoietic_and_lymphoid_tissue, 6; Kidney, 7; Large_intestine, 8; Liver, 9; Lung, 10; NS, 11; Ovary, 12; Pancreas, 13; Prostate, 14; Skin, 15; Stomach, 16; Thyroid, 17; Urinary_tract) |
| Top |
|
 |
| Top |
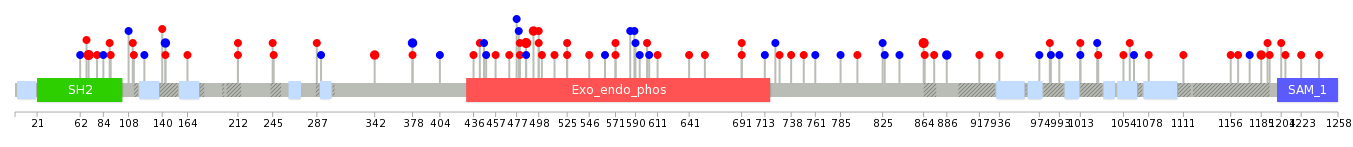
| Stat. for Non-Synonymous SNVs (# total SNVs=84) | (# total SNVs=32) |
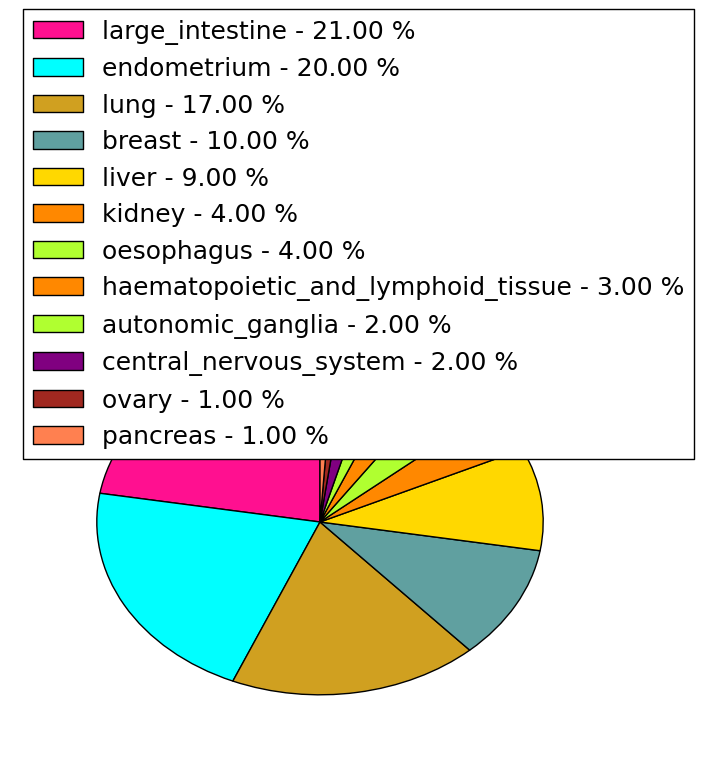 | 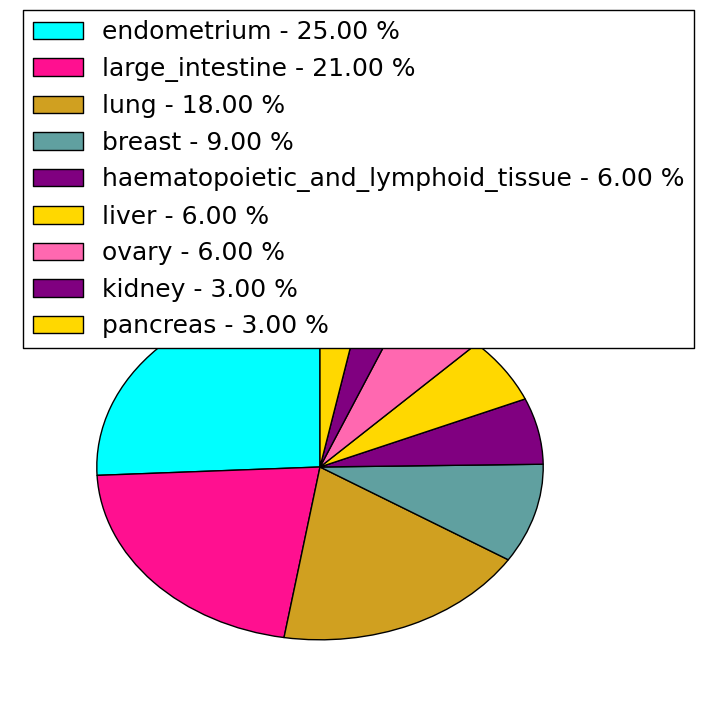 |
(# total SNVs=5) | (# total SNVs=2) |
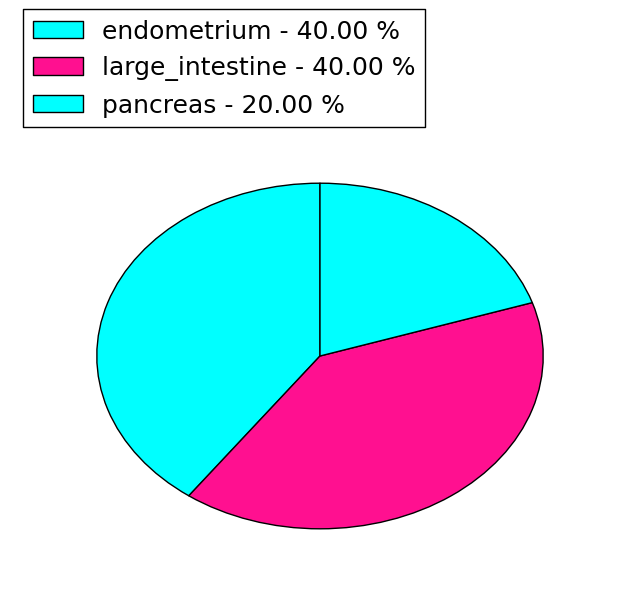 |  |
| Top |
| * When you move the cursor on each content, you can see more deailed mutation information on the Tooltip. Those are primary_site,primary_histology,mutation(aa),pubmedID. |
| GRCh37 position | Mutation(aa) | Unique sampleID count |
| chr11:71946427-71946427 | p.G864D | 4 |
| chr11:71949087-71949087 | p.A1185D | 3 |
| chr11:71948748-71948748 | p.R1156fs*46 | 3 |
| chr11:71942192-71942192 | p.R486C | 3 |
| chr11:71943961-71943961 | p.L632I | 2 |
| chr11:71941449-71941449 | p.G378G | 2 |
| chr11:71946908-71946908 | p.P919P | 2 |
| chr11:71939260-71939260 | p.R70H | 2 |
| chr11:71948289-71948289 | p.P1001S | 2 |
| chr11:71946931-71946931 | p.P927L | 2 |
| Top |
|
 |
| Point Mutation/ Tissue ID | 1 | 2 | 3 | 4 | 5 | 6 | 7 | 8 | 9 | 10 | 11 | 12 | 13 | 14 | 15 | 16 | 17 | 18 | 19 | 20 |
| # sample | 4 | 6 | 19 | 1 | 2 | 1 | 1 | 12 | 2 | 3 | 13 | 12 | 1 | 16 | ||||||
| # mutation | 5 | 6 | 15 | 1 | 1 | 1 | 1 | 13 | 2 | 3 | 17 | 12 | 1 | 22 | ||||||
| nonsynonymous SNV | 3 | 4 | 9 | 1 | 1 | 1 | 1 | 9 | 2 | 1 | 9 | 10 | 14 | |||||||
| synonymous SNV | 2 | 2 | 6 | 4 | 2 | 8 | 2 | 1 | 8 |
| cf) Tissue ID; Tissue type (1; BLCA[Bladder Urothelial Carcinoma], 2; BRCA[Breast invasive carcinoma], 3; CESC[Cervical squamous cell carcinoma and endocervical adenocarcinoma], 4; COAD[Colon adenocarcinoma], 5; GBM[Glioblastoma multiforme], 6; Glioma Low Grade, 7; HNSC[Head and Neck squamous cell carcinoma], 8; KICH[Kidney Chromophobe], 9; KIRC[Kidney renal clear cell carcinoma], 10; KIRP[Kidney renal papillary cell carcinoma], 11; LAML[Acute Myeloid Leukemia], 12; LUAD[Lung adenocarcinoma], 13; LUSC[Lung squamous cell carcinoma], 14; OV[Ovarian serous cystadenocarcinoma ], 15; PAAD[Pancreatic adenocarcinoma], 16; PRAD[Prostate adenocarcinoma], 17; SKCM[Skin Cutaneous Melanoma], 18:STAD[Stomach adenocarcinoma], 19:THCA[Thyroid carcinoma], 20:UCEC[Uterine Corpus Endometrial Carcinoma]) |
| Top |
| * We represented just top 10 SNVs. When you move the cursor on each content, you can see more deailed mutation information on the Tooltip. Those are primary_site, primary_histology, mutation(aa), pubmedID. |
| Genomic Position | Mutation(aa) | Unique sampleID count |
| chr11:71939260 | p.R70H | 3 |
| chr11:71942192 | p.R486C | 3 |
| chr11:71946427 | p.G864D | 3 |
| chr11:71941449 | p.R342Q | 2 |
| chr11:71939802 | p.T493M | 2 |
| chr11:71942214 | p.R498S | 2 |
| chr11:71949087 | p.G378G | 2 |
| chr11:71942228 | p.Y886Y | 2 |
| chr11:71946494 | p.A1185D | 2 |
| chr11:71941250 | p.P143P | 2 |
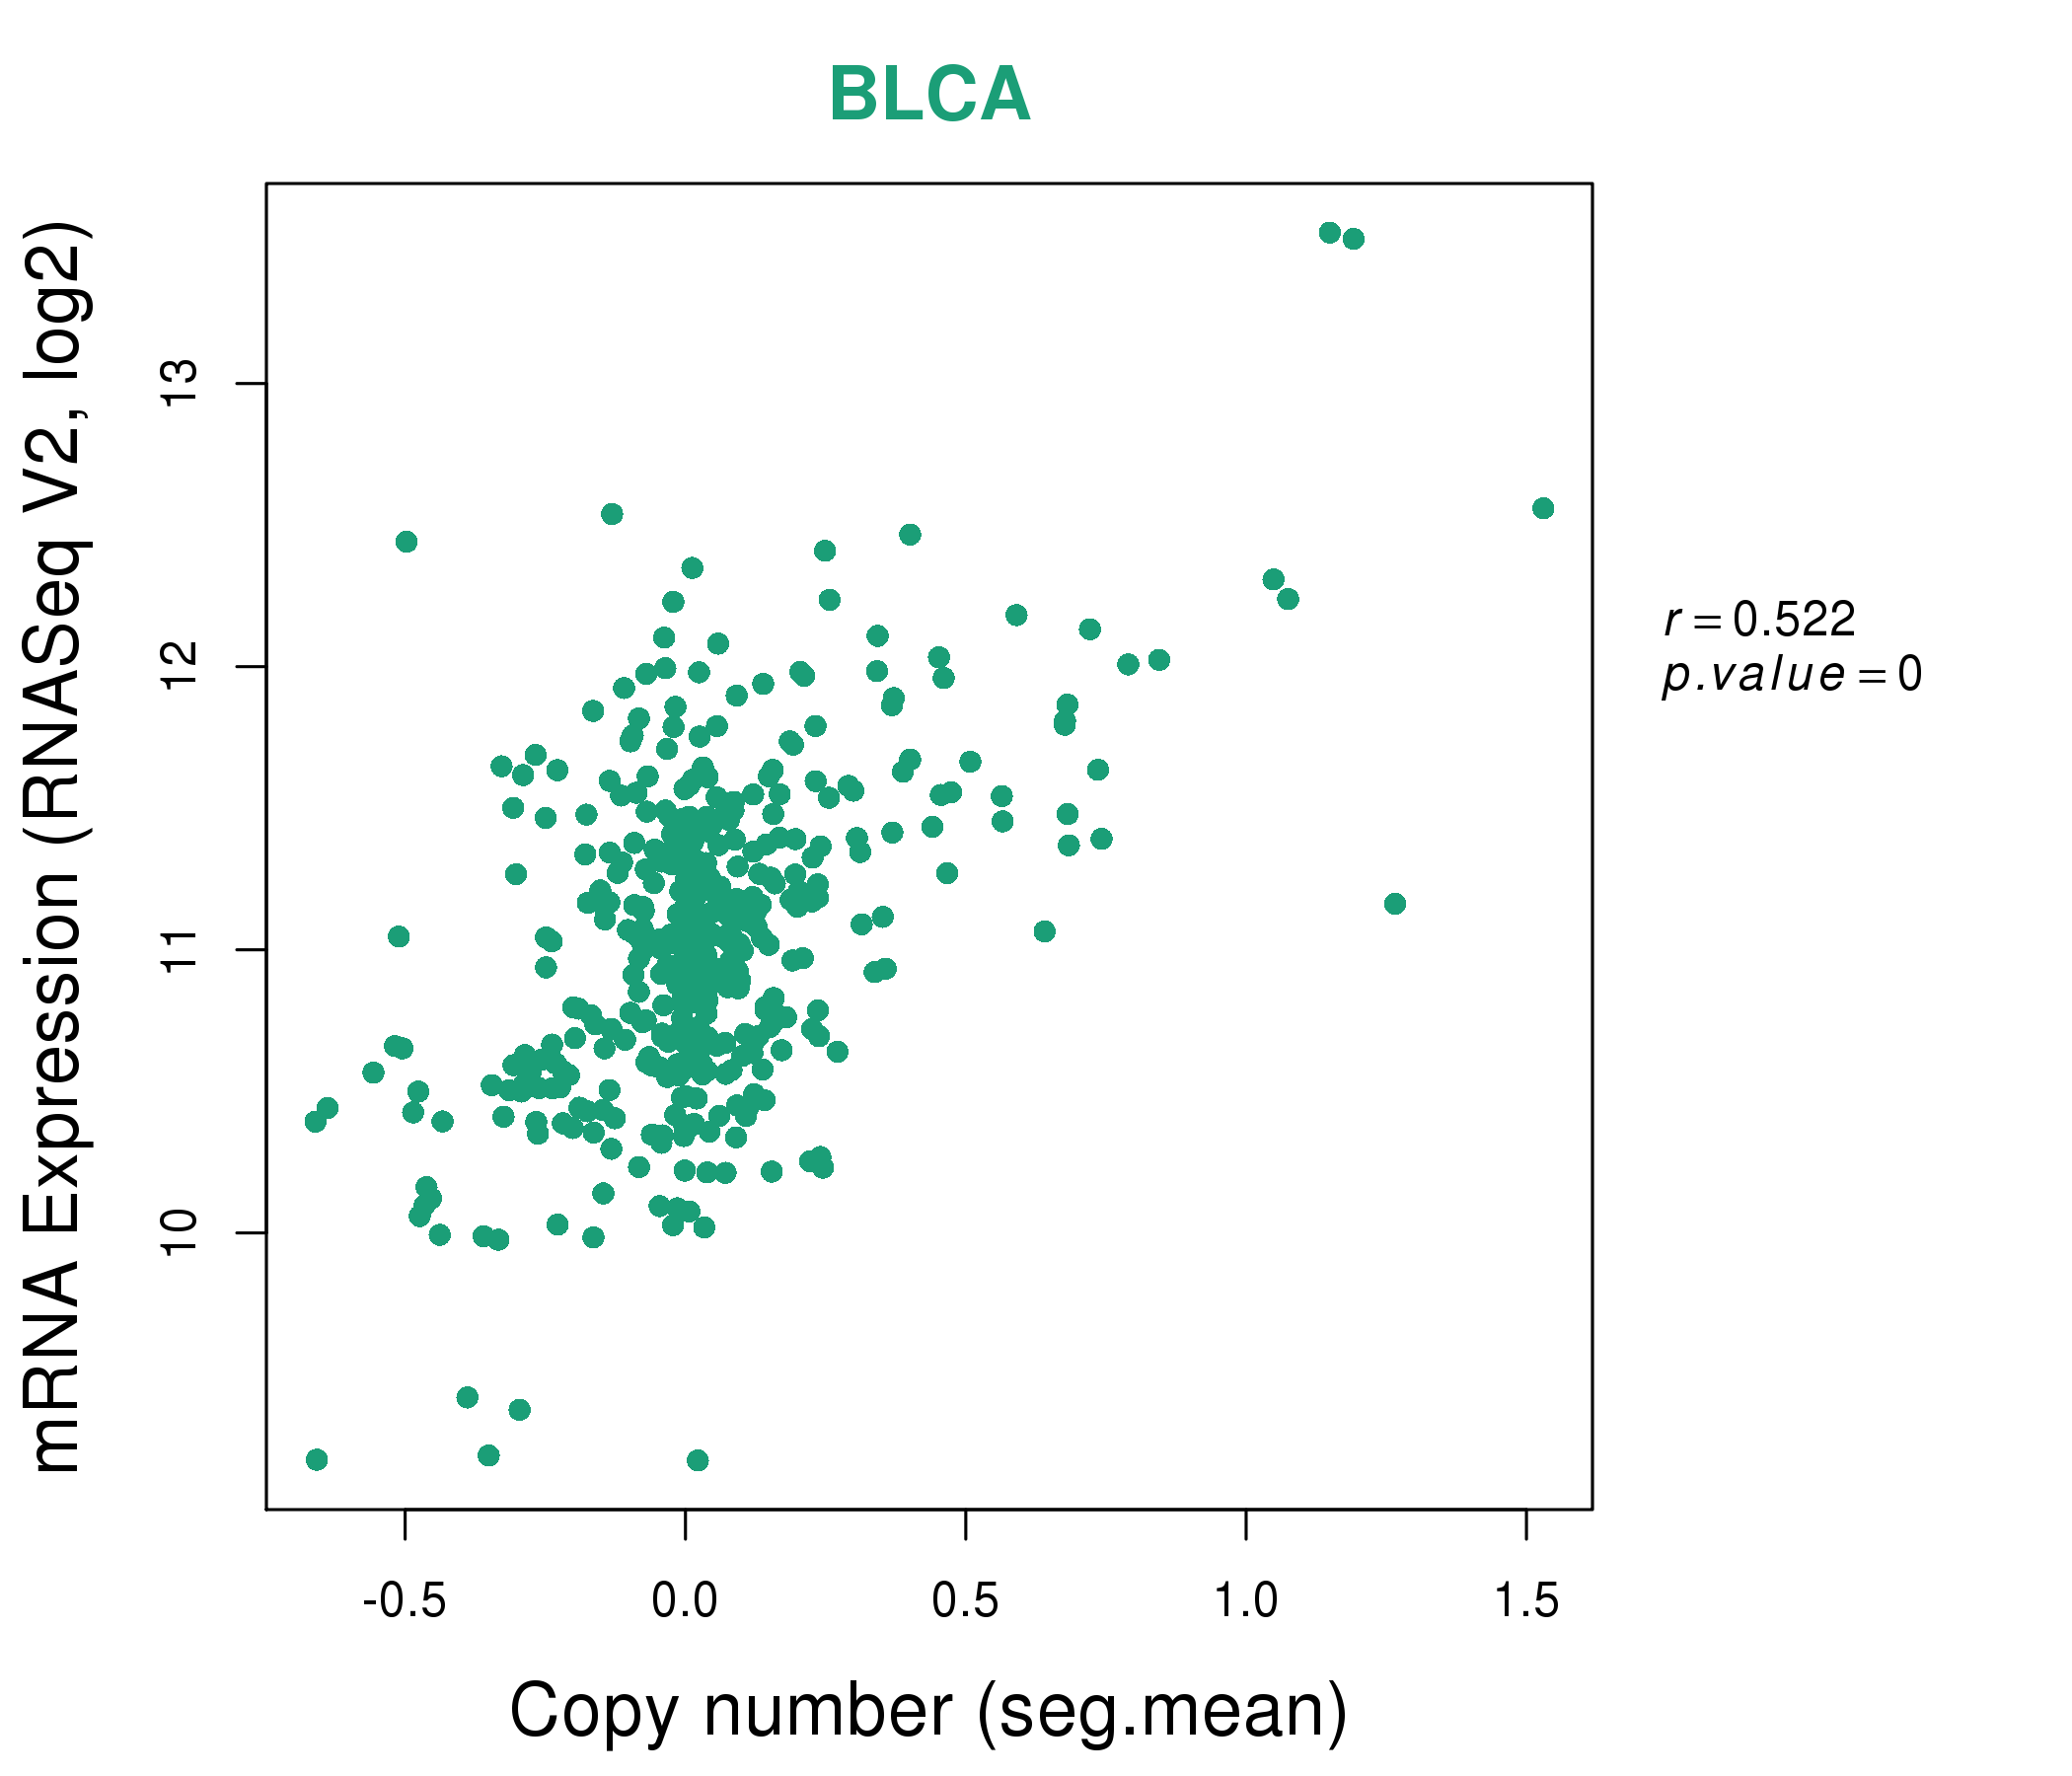
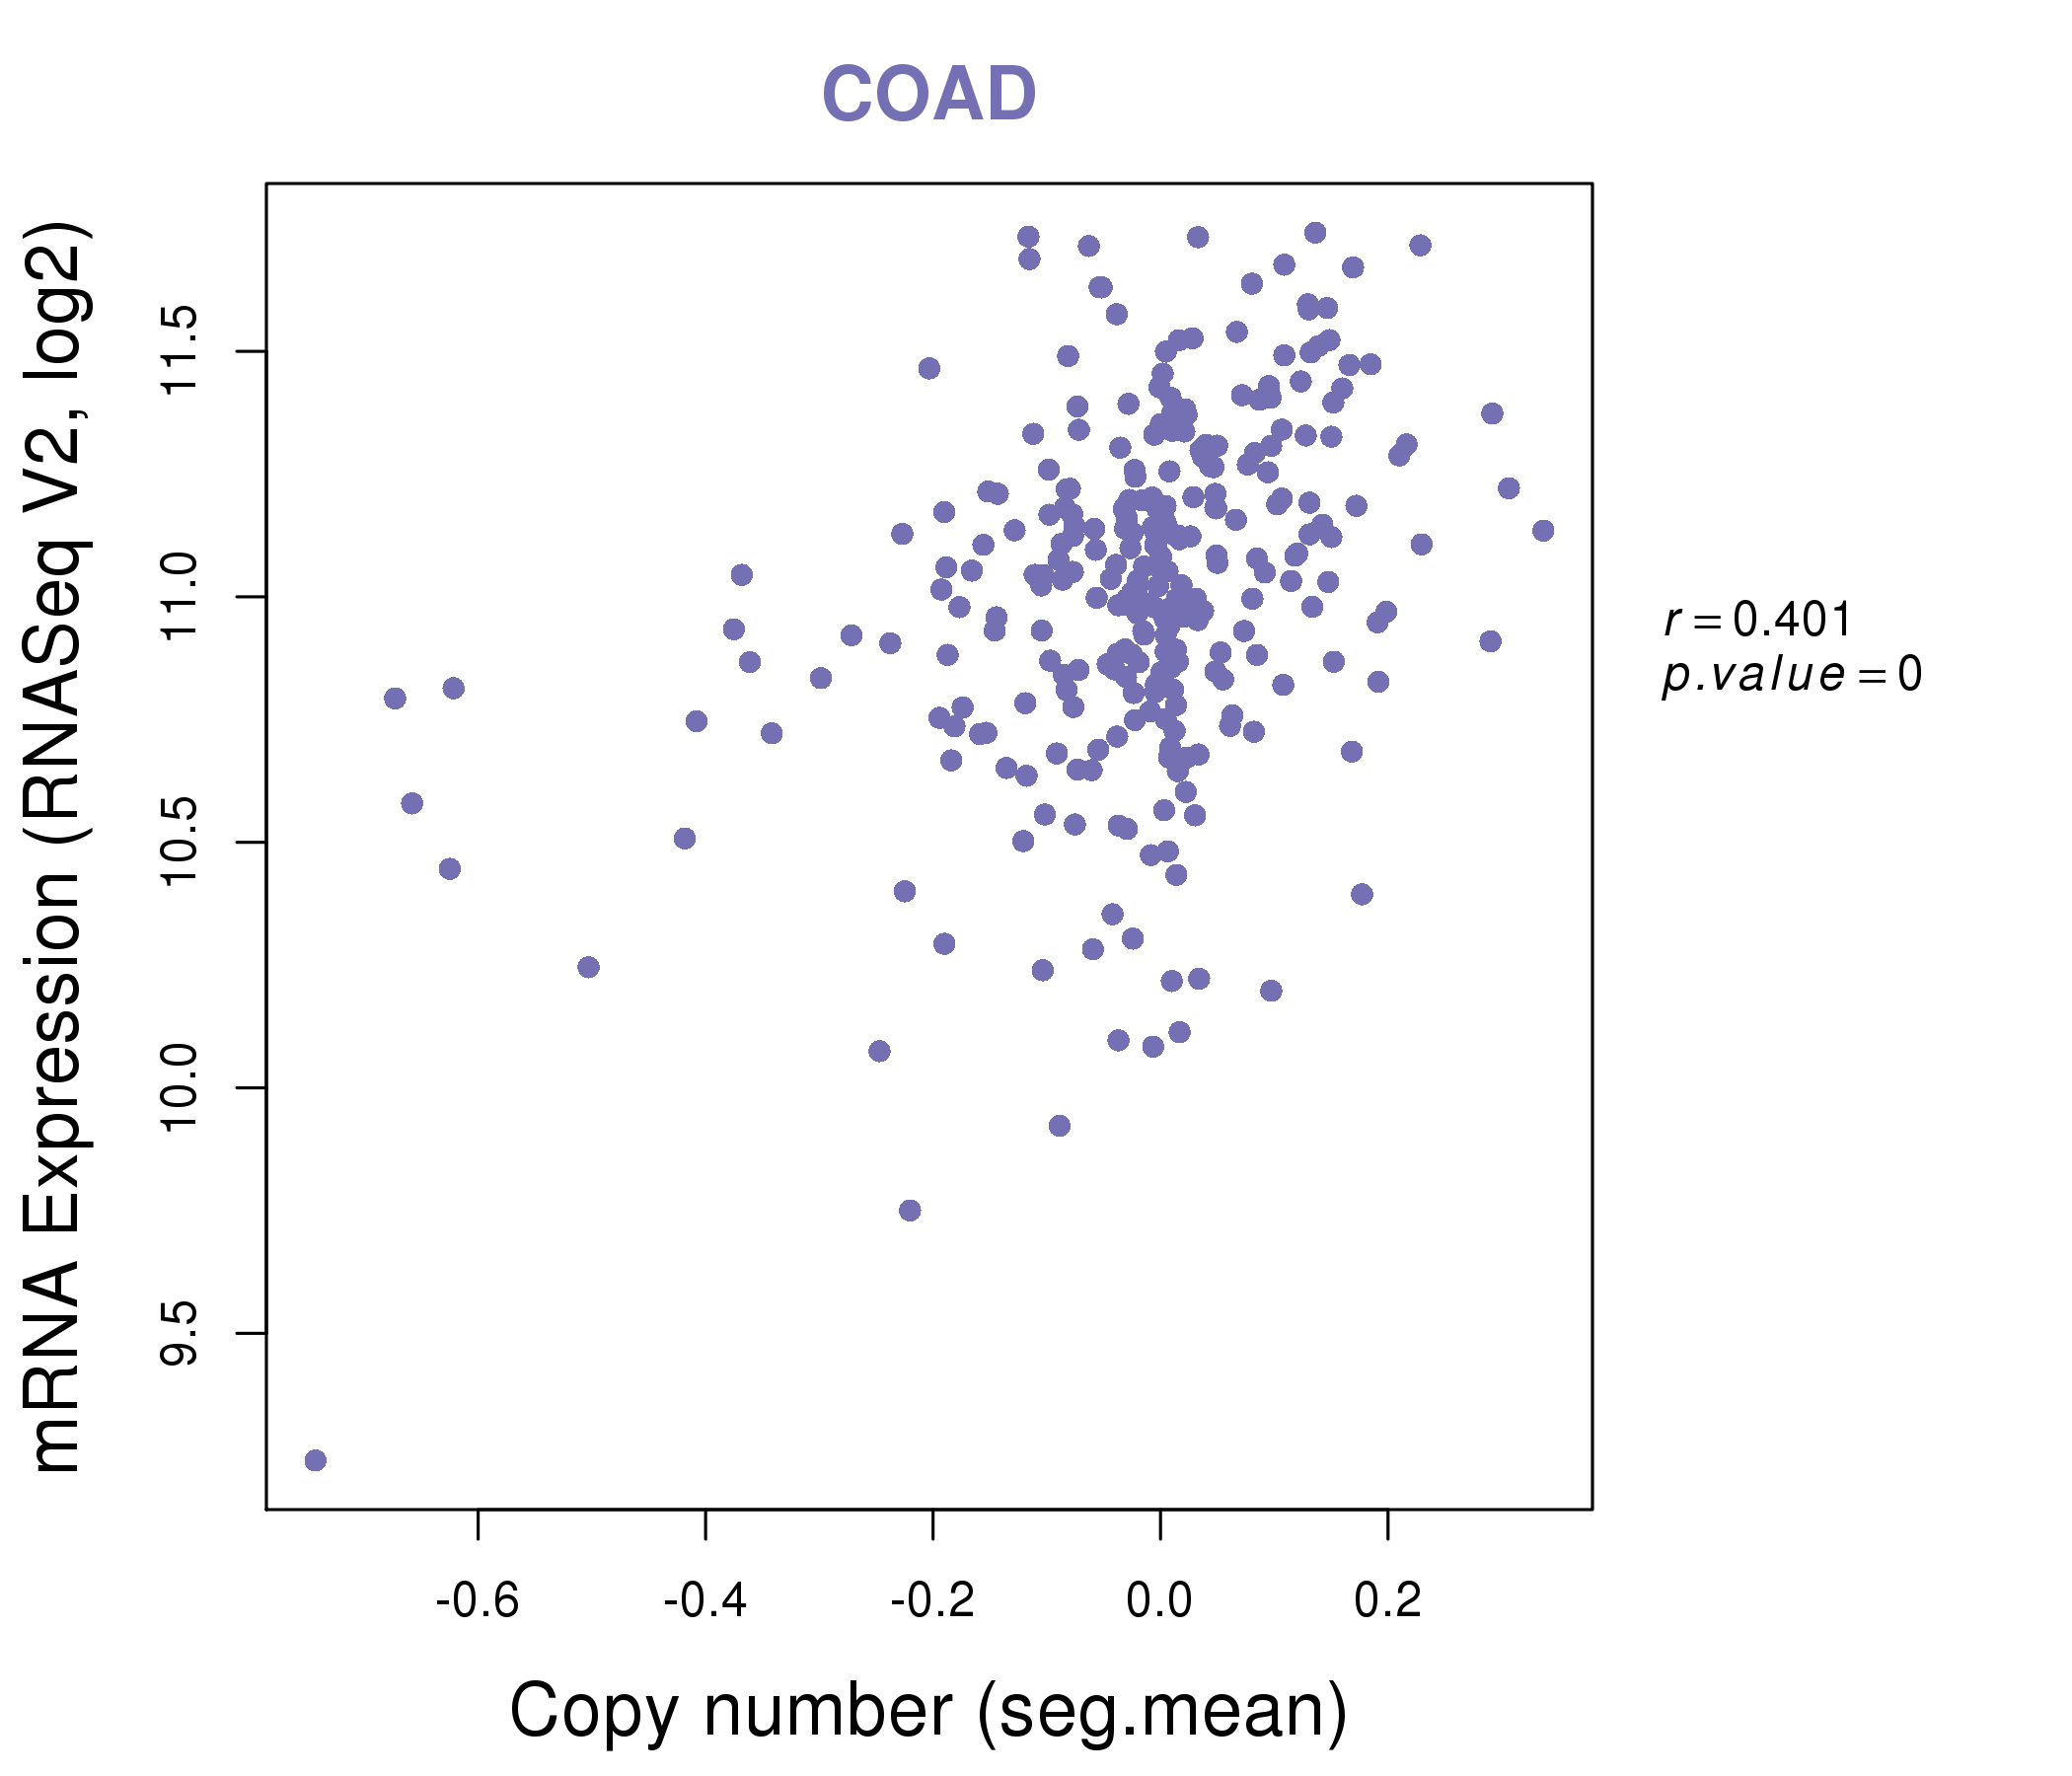
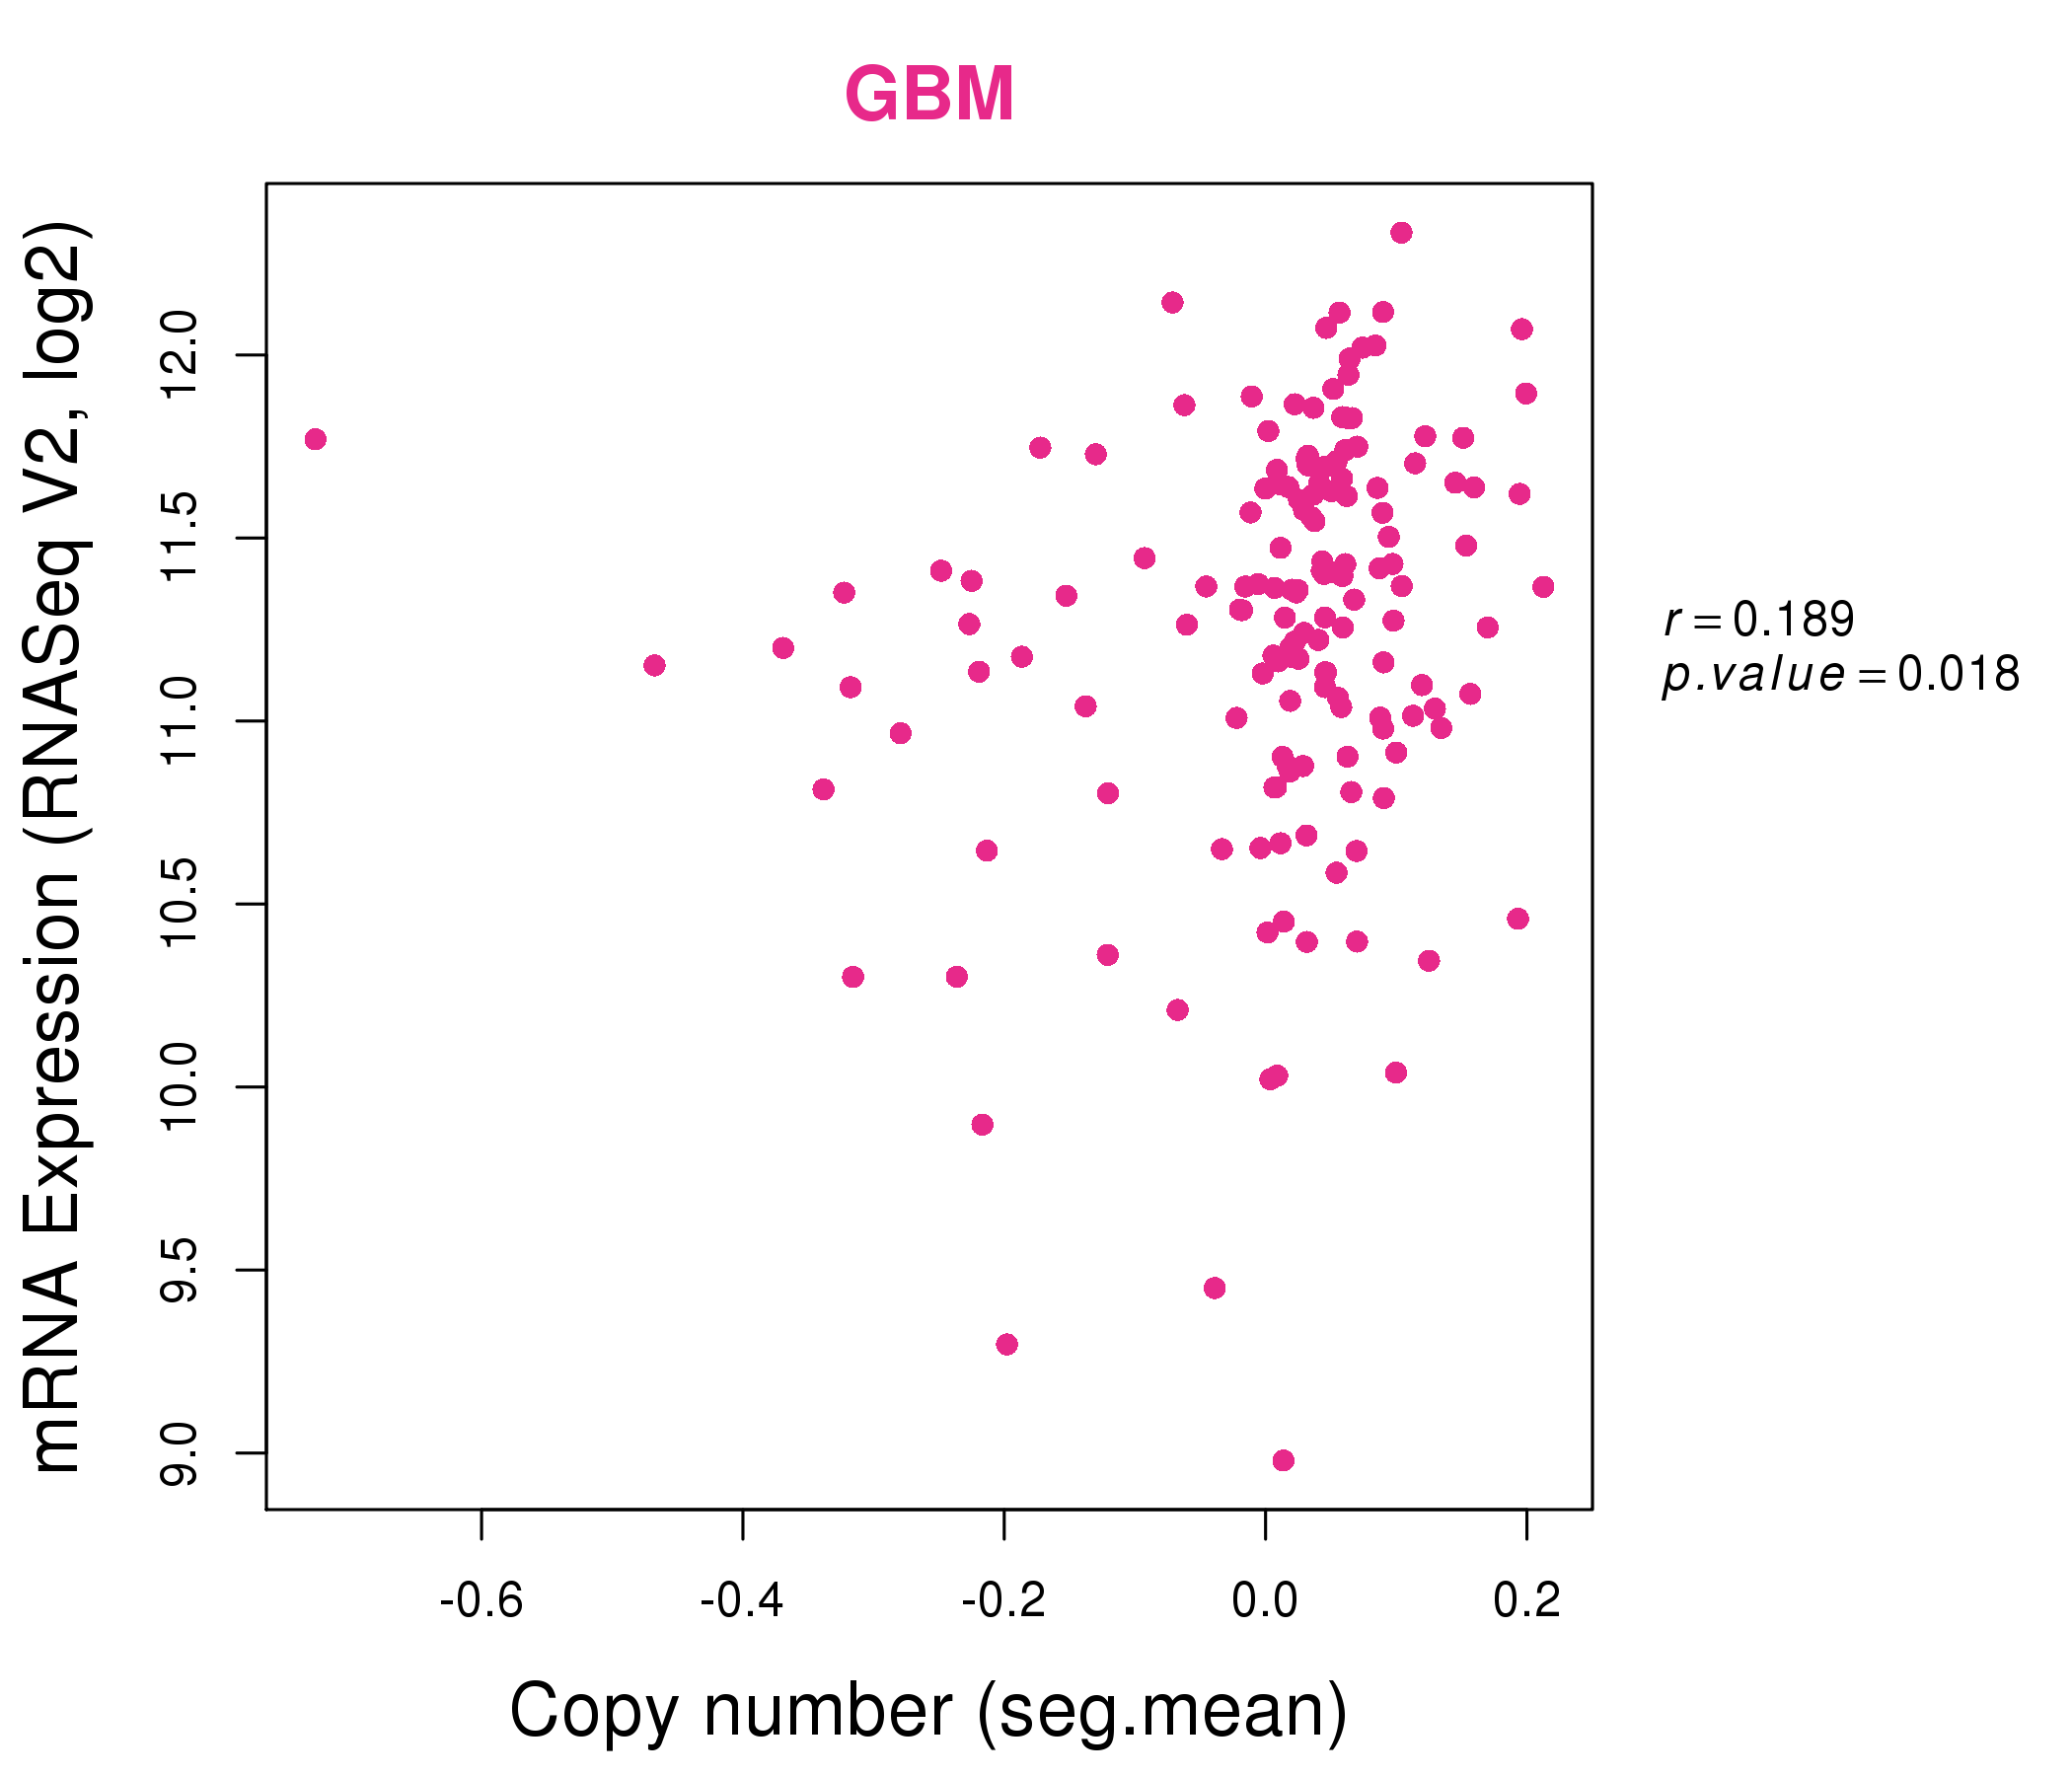
| * Copy number data were extracted from TCGA using R package TCGA-Assembler. The URLs of all public data files on TCGA DCC data server were gathered on Jan-05-2015. Function ProcessCNAData in TCGA-Assembler package was used to obtain gene-level copy number value which is calculated as the average copy number of the genomic region of a gene. |
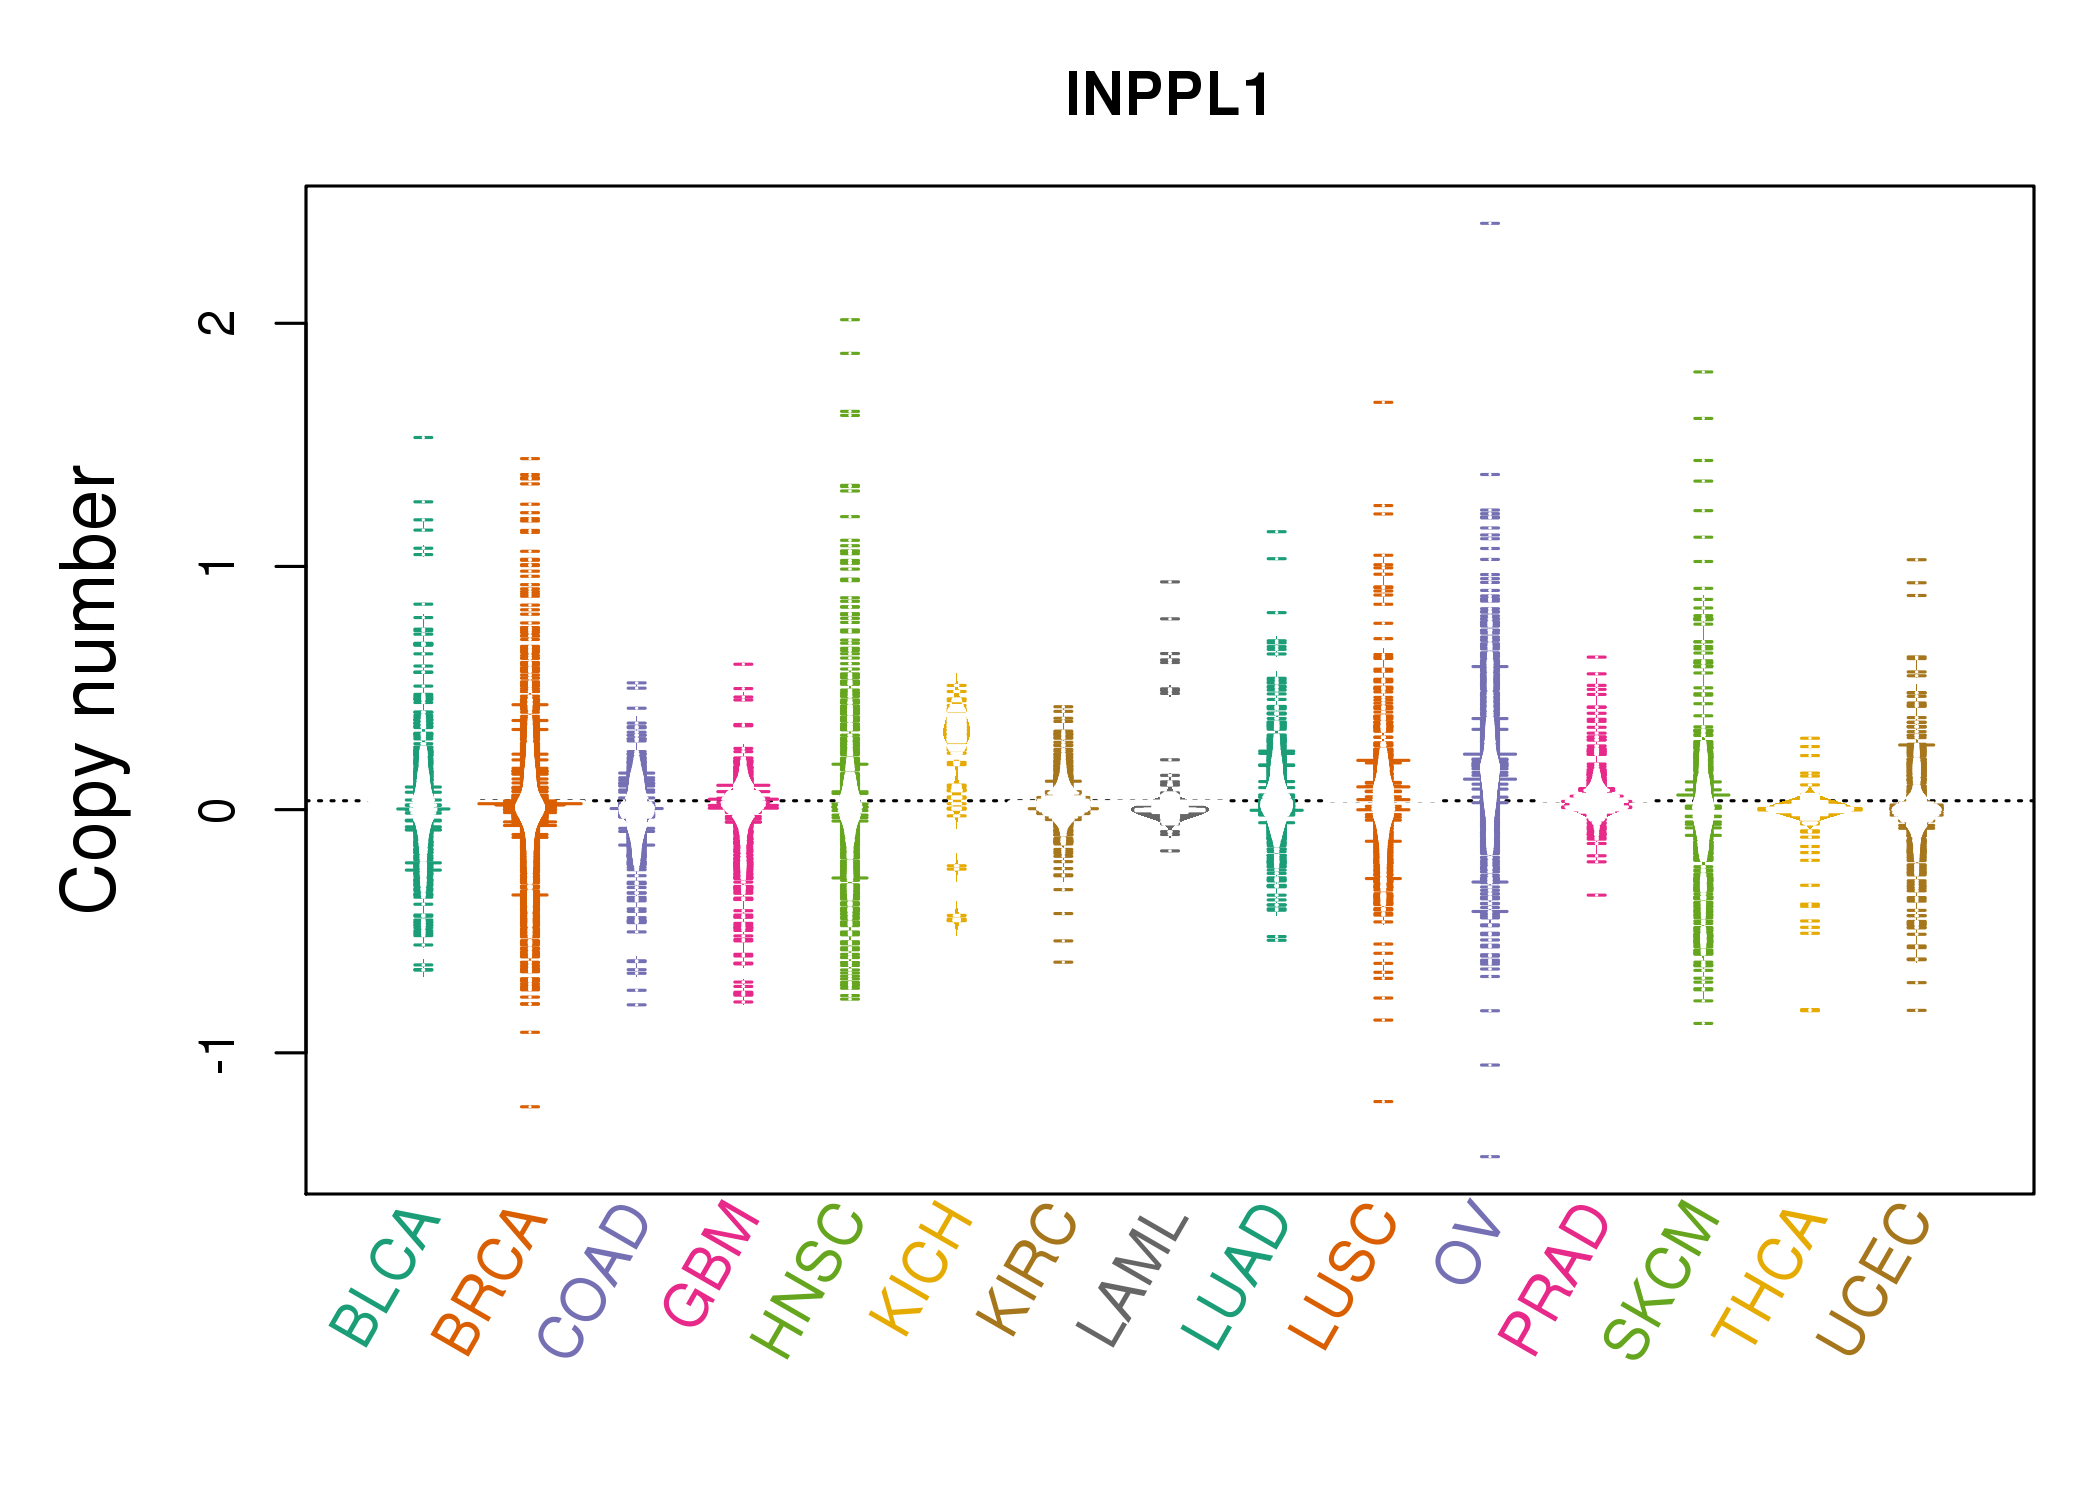 |
| cf) Tissue ID[Tissue type]: BLCA[Bladder Urothelial Carcinoma], BRCA[Breast invasive carcinoma], CESC[Cervical squamous cell carcinoma and endocervical adenocarcinoma], COAD[Colon adenocarcinoma], GBM[Glioblastoma multiforme], Glioma Low Grade, HNSC[Head and Neck squamous cell carcinoma], KICH[Kidney Chromophobe], KIRC[Kidney renal clear cell carcinoma], KIRP[Kidney renal papillary cell carcinoma], LAML[Acute Myeloid Leukemia], LUAD[Lung adenocarcinoma], LUSC[Lung squamous cell carcinoma], OV[Ovarian serous cystadenocarcinoma ], PAAD[Pancreatic adenocarcinoma], PRAD[Prostate adenocarcinoma], SKCM[Skin Cutaneous Melanoma], STAD[Stomach adenocarcinoma], THCA[Thyroid carcinoma], UCEC[Uterine Corpus Endometrial Carcinoma] |
| Top |
| Gene Expression for INPPL1 |
| * CCLE gene expression data were extracted from CCLE_Expression_Entrez_2012-10-18.res: Gene-centric RMA-normalized mRNA expression data. |
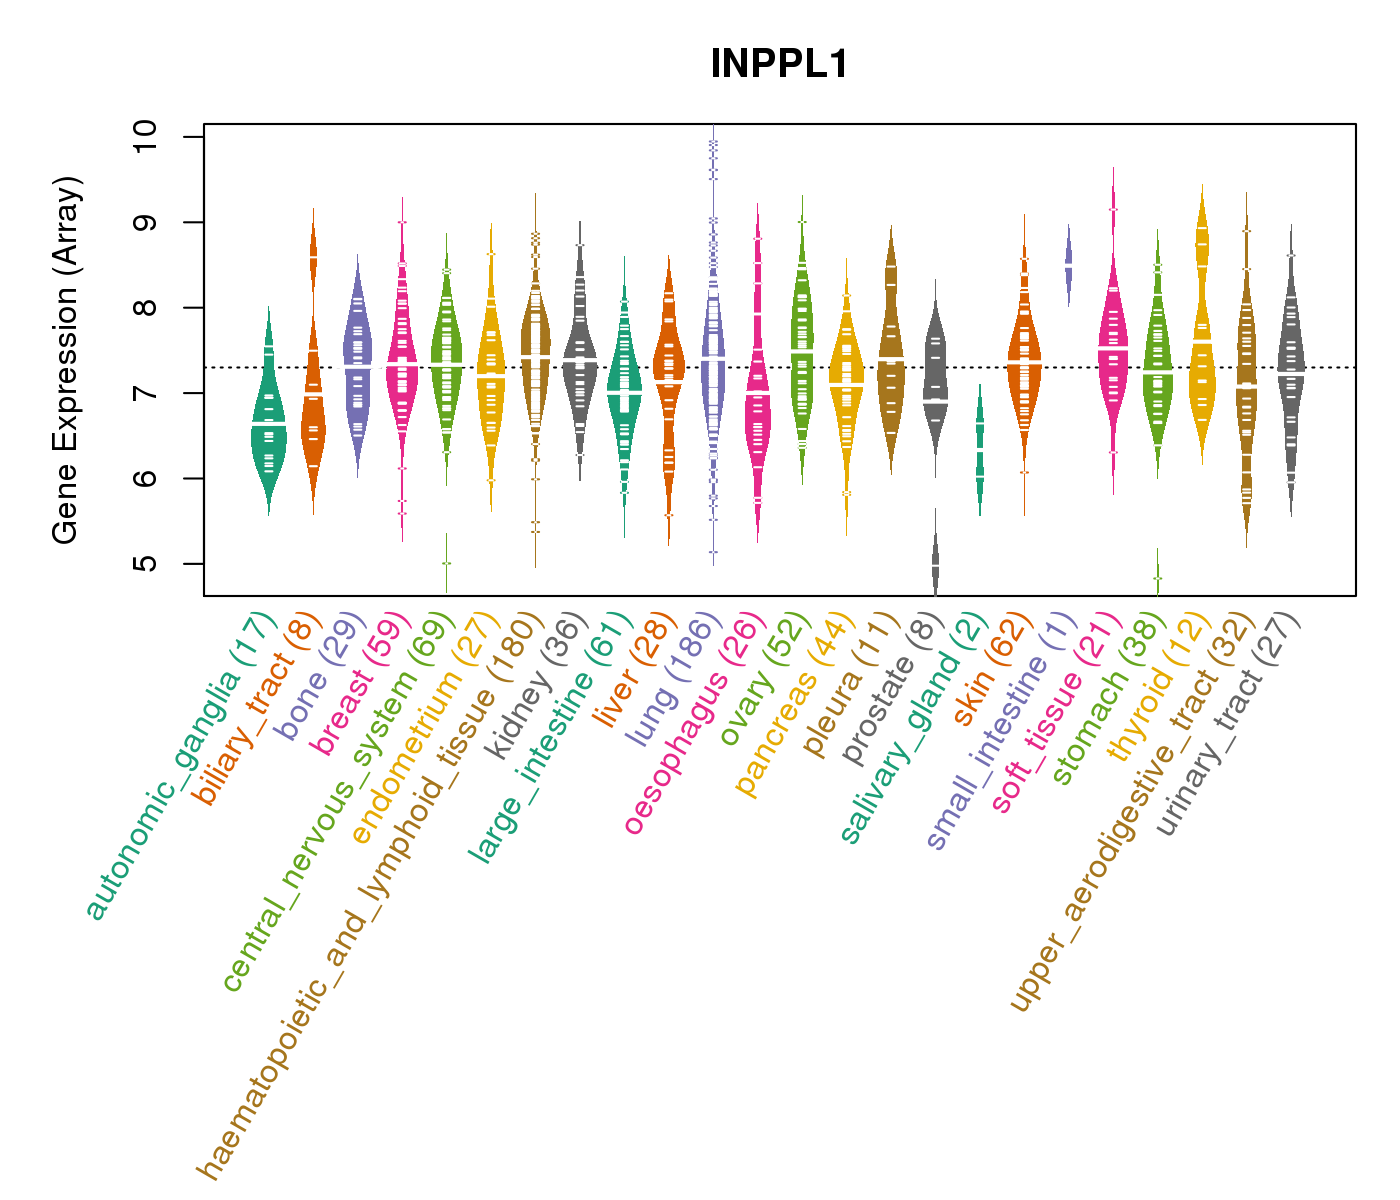 |
| * Normalized gene expression data of RNASeqV2 was extracted from TCGA using R package TCGA-Assembler. The URLs of all public data files on TCGA DCC data server were gathered at Jan-05-2015. Only eight cancer types have enough normal control samples for differential expression analysis. (t test, adjusted p<0.05 (using Benjamini-Hochberg FDR)) |
 |
| Top |
| * This plots show the correlation between CNV and gene expression. |
: Open all plots for all cancer types
 |
|
 |
|

| Top |
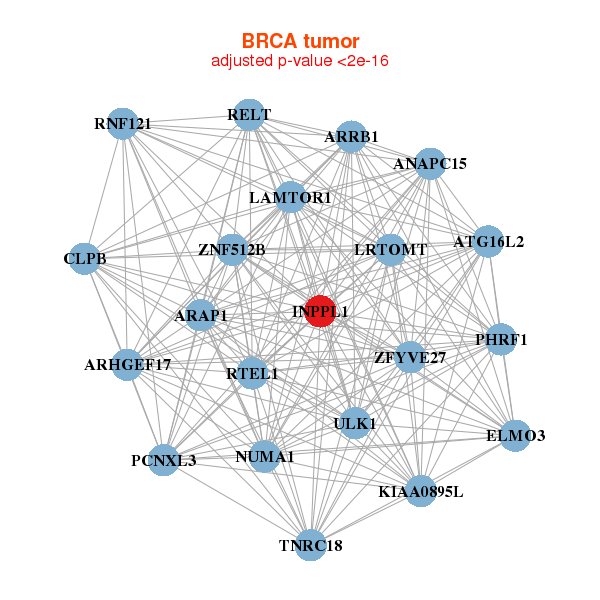
| Gene-Gene Network Information |
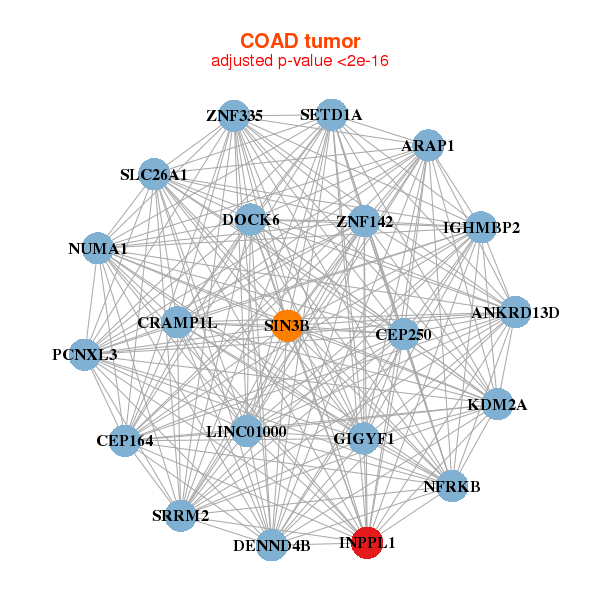
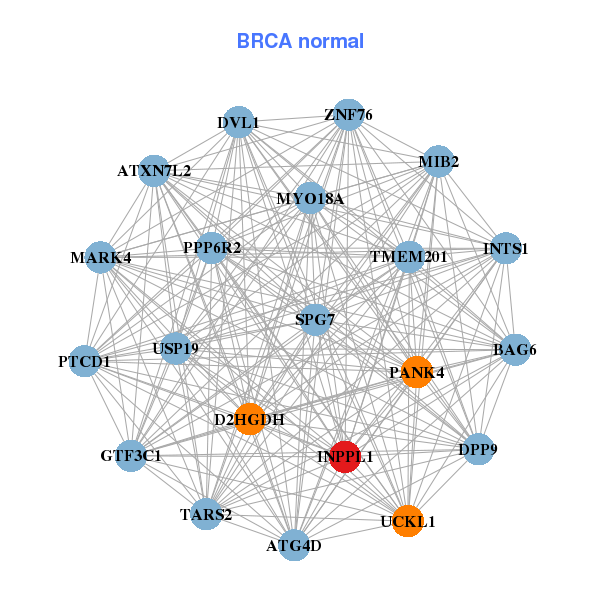
| * Co-Expression network figures were drawn using R package igraph. Only the top 20 genes with the highest correlations were shown. Red circle: input gene, orange circle: cell metabolism gene, sky circle: other gene |
: Open all plots for all cancer types
 |
| ||||
| ARAP1,ARHGEF17,ARRB1,ATG16L2,ANAPC15,LAMTOR1,CLPB, ELMO3,INPPL1,KIAA0895L,LRTOMT,NUMA1,PCNXL3,PHRF1, RELT,RNF121,RTEL1,TNRC18,ULK1,ZFYVE27,ZNF512B | ATG4D,ATXN7L2,BAG6,D2HGDH,DPP9,DVL1,GTF3C1, INPPL1,INTS1,MARK4,MIB2,MYO18A,PANK4,PTCD1, PPP6R2,SPG7,TARS2,TMEM201,UCKL1,USP19,ZNF76 | ||||
 |
| ||||
| ANKRD13D,ARAP1,CEP164,CEP250,CRAMP1L,DENND4B,DOCK6, LINC01000,GIGYF1,IGHMBP2,INPPL1,KDM2A,NFRKB,NUMA1, PCNXL3,SETD1A,SIN3B,SLC26A1,SRRM2,ZNF142,ZNF335 | ANKRD11,PRRC2A,SLX4,HECTD4,CAMTA2,CIC,CRAMP1L, FAM160B2,FAM193A,GIGYF1,GYS1,INPPL1,GSE1,PSMG3-AS1, NEURL4,PLCG1,PLXNB1,PRR12,SETD1B,SH3PXD2A,SIN3B |
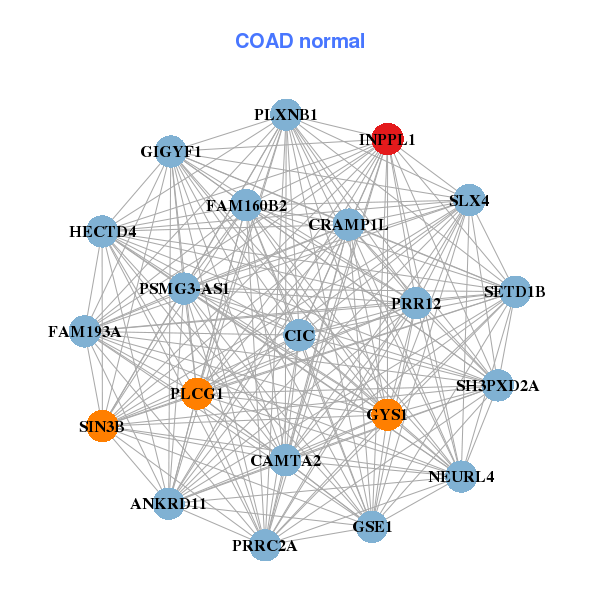
| * Co-Expression network figures were drawn using R package igraph. Only the top 20 genes with the highest correlations were shown. Red circle: input gene, orange circle: cell metabolism gene, sky circle: other gene |
: Open all plots for all cancer types
| Top |
: Open all interacting genes' information including KEGG pathway for all interacting genes from DAVID
| Top |
| Pharmacological Information for INPPL1 |
| DB Category | DB Name | DB's ID and Url link |
| Chemistry | BindingDB | O15357; -. |
| Chemistry | ChEMBL | CHEMBL2331064; -. |
| Organism-specific databases | PharmGKB | PA29888; -. |
| Organism-specific databases | CTD | 3636; -. |
| * Gene Centered Interaction Network. |
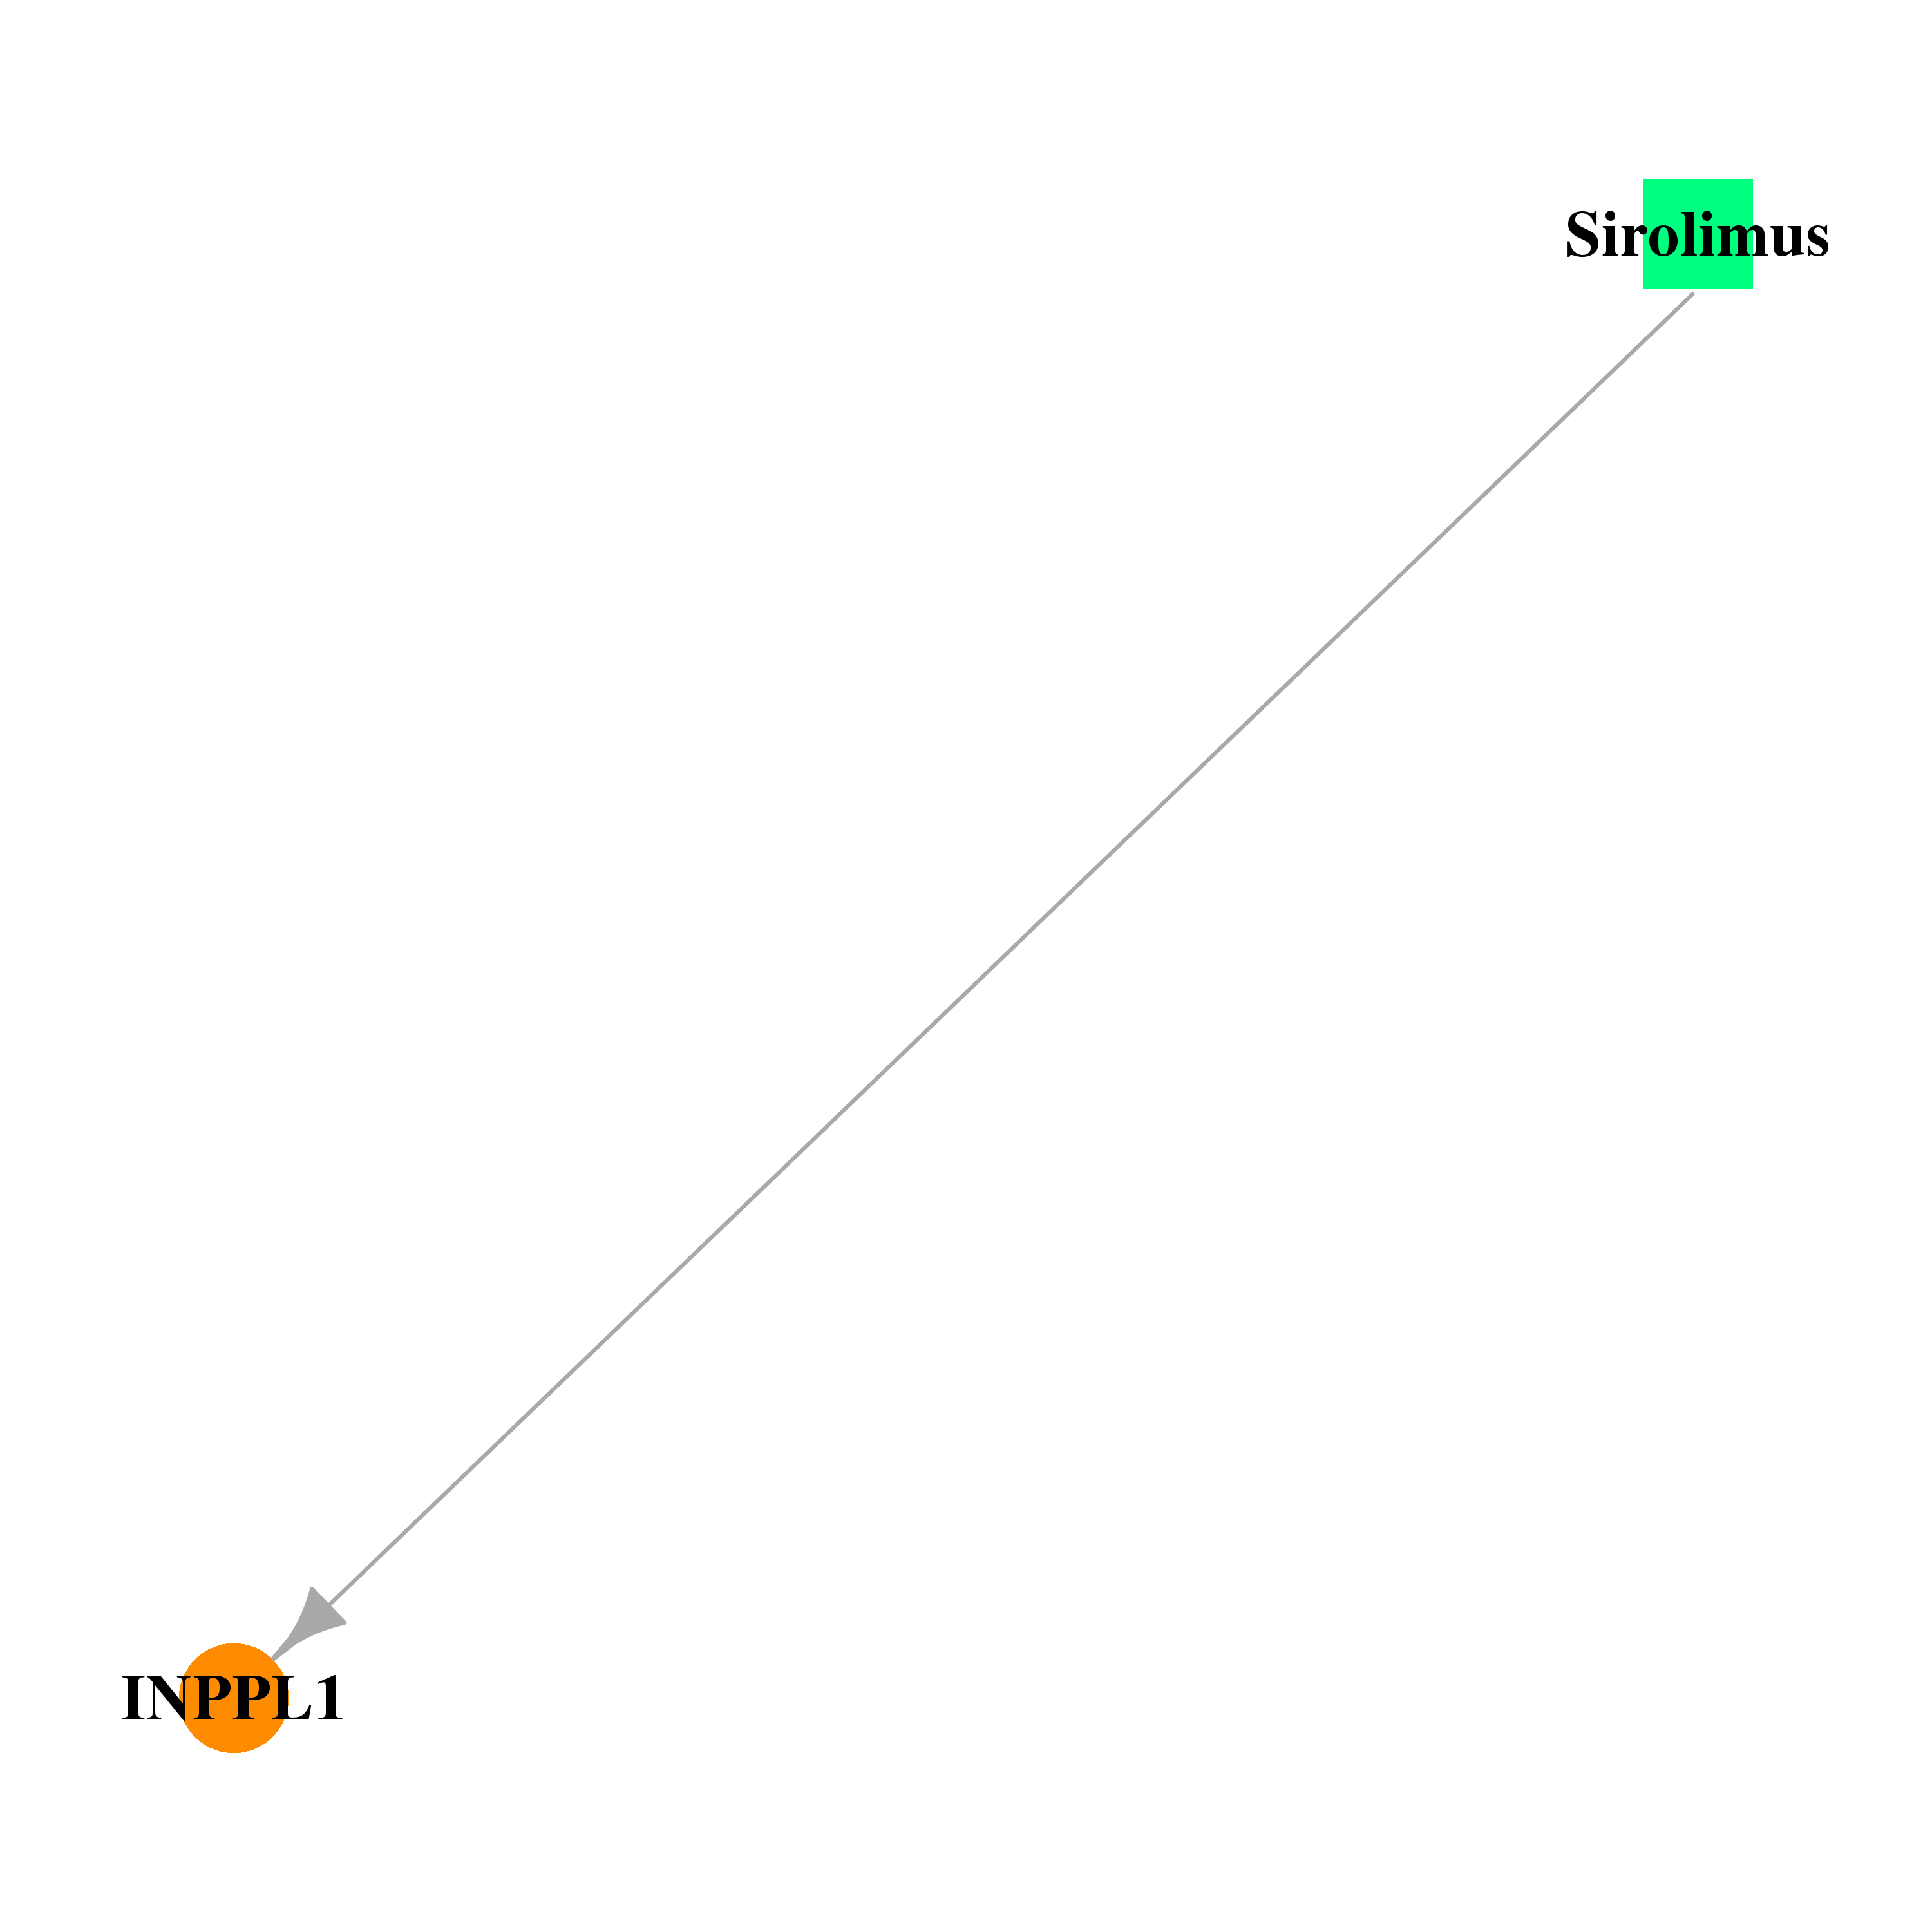 |
| * Drug Centered Interaction Network. |
| DrugBank ID | Target Name | Drug Groups | Generic Name | Drug Centered Network | Drug Structure |
| DB00877 | inositol polyphosphate phosphatase-like 1 | approved; investigational | Sirolimus | 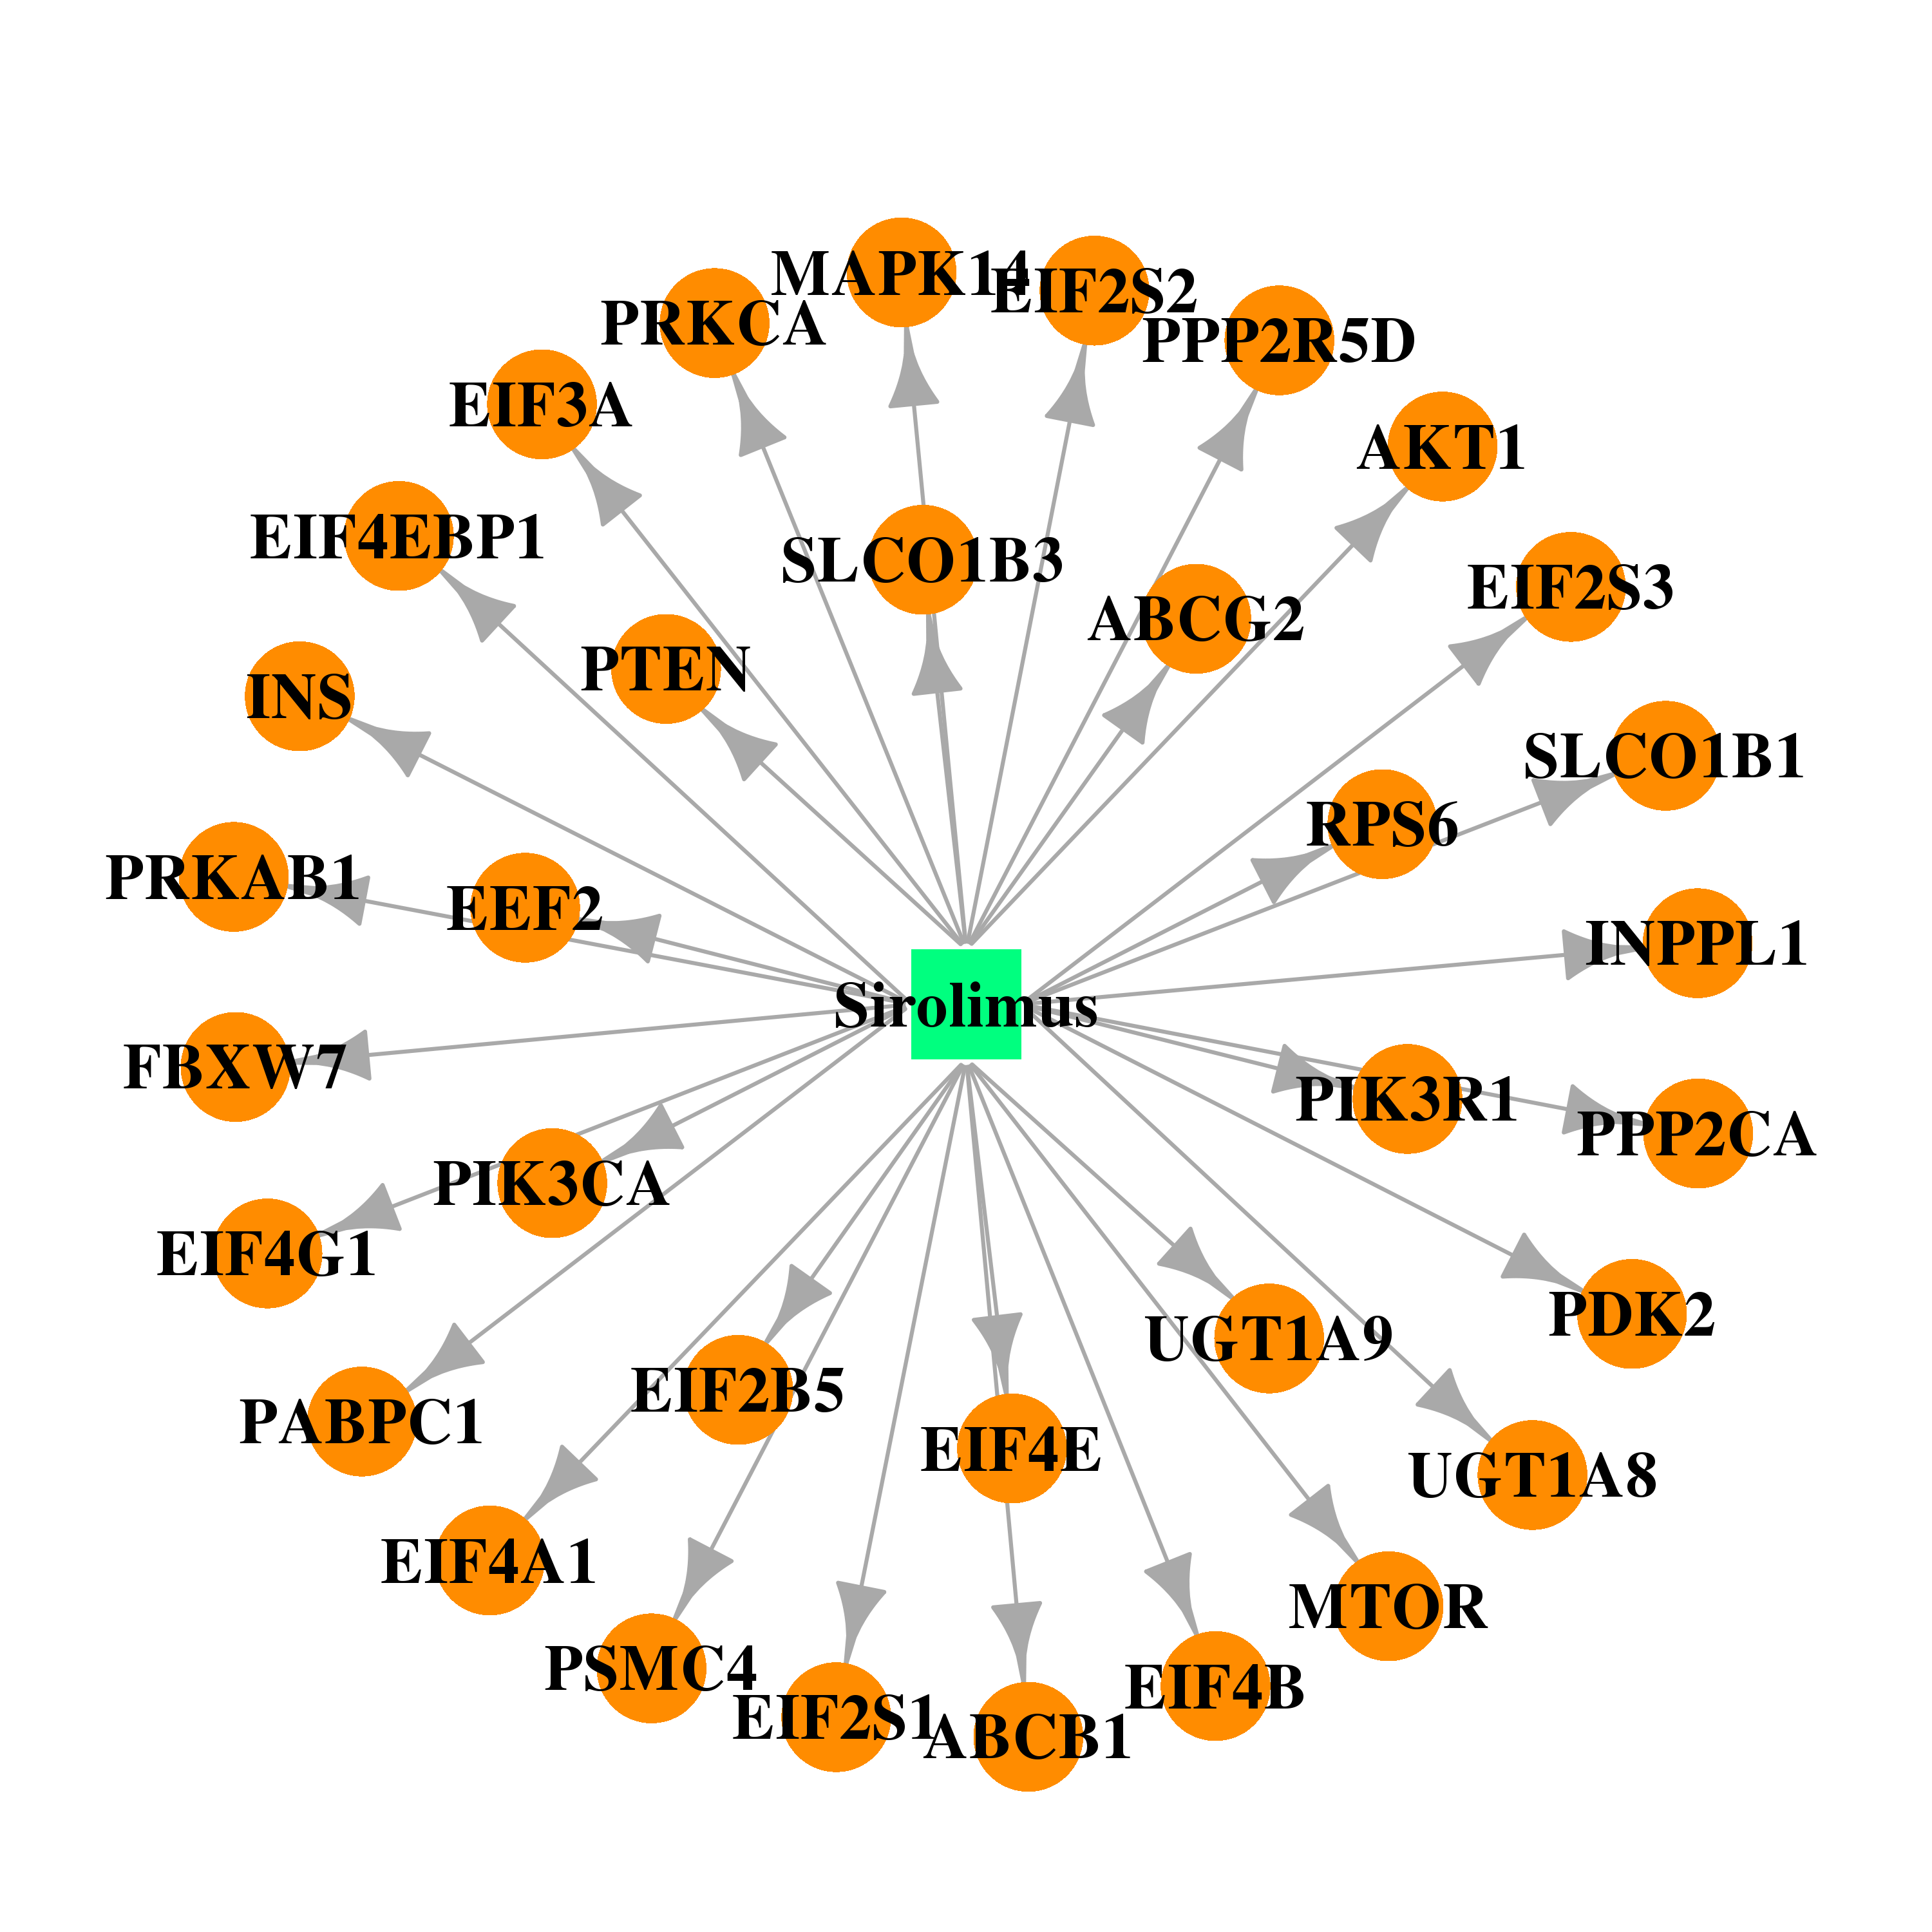 | 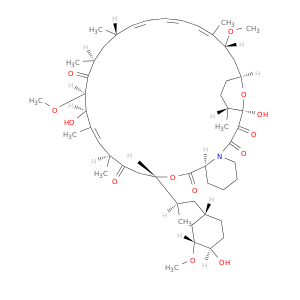 |
| Top |
| Cross referenced IDs for INPPL1 |
| * We obtained these cross-references from Uniprot database. It covers 150 different DBs, 18 categories. http://www.uniprot.org/help/cross_references_section |
: Open all cross reference information
|
Copyright © 2016-Present - The Univsersity of Texas Health Science Center at Houston @ |