|
||||||||||||||||||||||||||||||||||||||||||||||||||||||||||||||||||||||||||||||||||||||||||||||||||||||||||||||||||||||||||||||||||||||||||||||||||||||||||||||||||||||||||||||||||||||||||||||||||||||||||||||||||||||||||||||||||||||||||||||||||||||||||||||||||||||||||||||||||||||||||||||||||||||||||||||||||||||||||
| |
| Phenotypic Information (metabolism pathway, cancer, disease, phenome) |
| |
| |
| Gene-Gene Network Information: Co-Expression Network, Interacting Genes & KEGG |
| |
|


| Gene Summary for EIF3E |
| Basic gene info. | Gene symbol | EIF3E |
| Gene name | eukaryotic translation initiation factor 3, subunit E | |
| Synonyms | EIF3-P48|EIF3S6|INT6|eIF3-p46 | |
| Cytomap | UCSC genome browser: 8q22-q23 | |
| Genomic location | chr8 :109213971-109260959 | |
| Type of gene | protein-coding | |
| RefGenes | NM_001568.2, | |
| Ensembl id | ENSG00000104408 | |
| Description | eIF-3 p48eukaryotic translation initiation factor 3 subunit 6eukaryotic translation initiation factor 3 subunit Eeukaryotic translation initiation factor 3, subunit 6 (48kD)eukaryotic translation initiation factor 3, subunit 6 48kDamammary tumor-asso | |
| Modification date | 20141222 | |
| dbXrefs | MIM : 602210 | |
| HGNC : HGNC | ||
| Ensembl : ENSG00000104408 | ||
| HPRD : 03734 | ||
| Vega : OTTHUMG00000164858 | ||
| Protein | UniProt: P60228 go to UniProt's Cross Reference DB Table | |
| Expression | CleanEX: HS_EIF3E | |
| BioGPS: 3646 | ||
| Gene Expression Atlas: ENSG00000104408 | ||
| The Human Protein Atlas: ENSG00000104408 | ||
| Pathway | NCI Pathway Interaction Database: EIF3E | |
| KEGG: EIF3E | ||
| REACTOME: EIF3E | ||
| ConsensusPathDB | ||
| Pathway Commons: EIF3E | ||
| Metabolism | MetaCyc: EIF3E | |
| HUMANCyc: EIF3E | ||
| Regulation | Ensembl's Regulation: ENSG00000104408 | |
| miRBase: chr8 :109,213,971-109,260,959 | ||
| TargetScan: NM_001568 | ||
| cisRED: ENSG00000104408 | ||
| Context | iHOP: EIF3E | |
| cancer metabolism search in PubMed: EIF3E | ||
| UCL Cancer Institute: EIF3E | ||
| Assigned class in ccmGDB | A - This gene has a literature evidence and it belongs to cancer gene. | |
| References showing role of EIF3E in cancer cell metabolism | 1. Cen B, Xiong Y, Song JH, Mahajan S, DuPont R, et al. (2014) The Pim-1 protein kinase is an important regulator of MET receptor tyrosine kinase levels and signaling. Mol Cell Biol 34: 2517-2532. doi: 10.1128/MCB.00147-14. pmid: 4054323. go to article 2. Martineau Y, Wang X, Alain T, Petroulakis E, Shahbazian D, et al. (2014) Control of Paip1-eukayrotic translation initiation factor 3 interaction by amino acids through S6 kinase. Mol Cell Biol 34: 1046-1053. doi: 10.1128/MCB.01079-13. pmid: 3958023. go to article 3. Yuan Y, Zhang Y, Yao S, Shi H, Huang X, et al. (2014) The translation initiation factor eIF3i up-regulates vascular endothelial growth factor A, accelerates cell proliferation, and promotes angiogenesis in embryonic development and tumorigenesis. J Biol Chem 289: 28310-28323. doi: 10.1074/jbc.M114.571356. pmid: 4192485. go to article | |
| Top |
| Phenotypic Information for EIF3E(metabolism pathway, cancer, disease, phenome) |
| Cancer | CGAP: EIF3E |
| Familial Cancer Database: EIF3E | |
| * This gene is included in those cancer gene databases. |
|
|
|
|
|
| . | ||||||||||||||||||||||||||||||||||||||||||||||||||||||||||||||||||||||||||||||||||||||||||||||||||||||||||||||||||||||||||||||||||||||||||||||||||||||||||||||||||||||||||||||||||||||||||||||||||||||||||||||||||||||||||||||||||||||||||||||||||||||||||||||||||||||||||||||||||||||||||||||||||||||||||||||||||||
Oncogene 1 | Significant driver gene in | |||||||||||||||||||||||||||||||||||||||||||||||||||||||||||||||||||||||||||||||||||||||||||||||||||||||||||||||||||||||||||||||||||||||||||||||||||||||||||||||||||||||||||||||||||||||||||||||||||||||||||||||||||||||||||||||||||||||||||||||||||||||||||||||||||||||||||||||||||||||||||||||||||||||||||||||||||||||||
| cf) number; DB name 1 Oncogene; http://nar.oxfordjournals.org/content/35/suppl_1/D721.long, 2 Tumor Suppressor gene; https://bioinfo.uth.edu/TSGene/, 3 Cancer Gene Census; http://www.nature.com/nrc/journal/v4/n3/abs/nrc1299.html, 4 CancerGenes; http://nar.oxfordjournals.org/content/35/suppl_1/D721.long, 5 Network of Cancer Gene; http://ncg.kcl.ac.uk/index.php, 1Therapeutic Vulnerabilities in Cancer; http://cbio.mskcc.org/cancergenomics/statius/ |
| REACTOME_METABOLISM_OF_PROTEINS | |
| OMIM | 602210; gene. |
| Orphanet | |
| Disease | KEGG Disease: EIF3E |
| MedGen: EIF3E (Human Medical Genetics with Condition) | |
| ClinVar: EIF3E | |
| Phenotype | MGI: EIF3E (International Mouse Phenotyping Consortium) |
| PhenomicDB: EIF3E | |
| Mutations for EIF3E |
| * Under tables are showing count per each tissue to give us broad intuition about tissue specific mutation patterns.You can go to the detailed page for each mutation database's web site. |
| - Statistics for Tissue and Mutation type | Top |
 |
| - For Inter-chromosomal Variations |
| * Inter-chromosomal variantions includes 'interchromosomal amplicon to amplicon', 'interchromosomal amplicon to non-amplified dna', 'interchromosomal insertion', 'Interchromosomal unknown type'. |
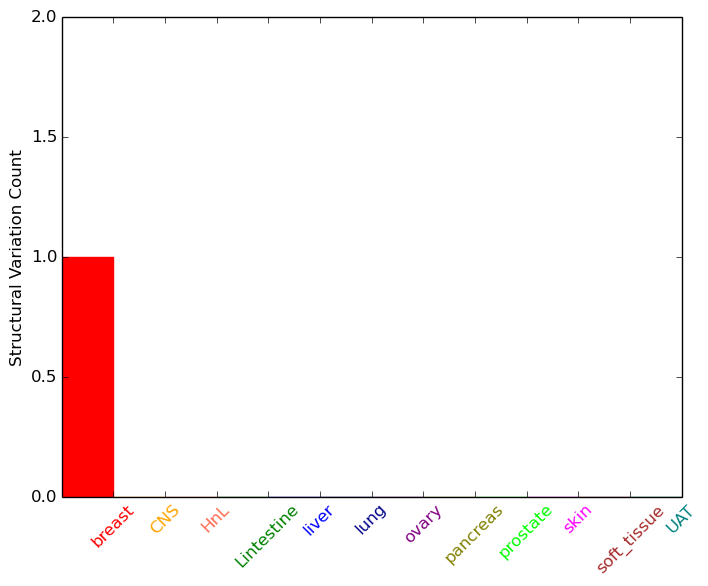 |
| - For Intra-chromosomal Variations |
| * Intra-chromosomal variantions includes 'intrachromosomal amplicon to amplicon', 'intrachromosomal amplicon to non-amplified dna', 'intrachromosomal deletion', 'intrachromosomal fold-back inversion', 'intrachromosomal inversion', 'intrachromosomal tandem duplication', 'Intrachromosomal unknown type', 'intrachromosomal with inverted orientation', 'intrachromosomal with non-inverted orientation'. |
 |
| Sample | Symbol_a | Chr_a | Start_a | End_a | Symbol_b | Chr_b | Start_b | End_b |
| ovary | EIF3E | chr8 | 109241051 | 109241071 | EIF3E | chr8 | 109241866 | 109241886 |
| ovary | EIF3E | chr8 | 109260140 | 109260160 | chr8 | 109296582 | 109296602 |
| cf) Tissue number; Tissue name (1;Breast, 2;Central_nervous_system, 3;Haematopoietic_and_lymphoid_tissue, 4;Large_intestine, 5;Liver, 6;Lung, 7;Ovary, 8;Pancreas, 9;Prostate, 10;Skin, 11;Soft_tissue, 12;Upper_aerodigestive_tract) |
| * From mRNA Sanger sequences, Chitars2.0 arranged chimeric transcripts. This table shows EIF3E related fusion information. |
| ID | Head Gene | Tail Gene | Accession | Gene_a | qStart_a | qEnd_a | Chromosome_a | tStart_a | tEnd_a | Gene_a | qStart_a | qEnd_a | Chromosome_a | tStart_a | tEnd_a |
| DA000478 | EIF3E | 1 | 129 | 8 | 109254115 | 109260942 | GTSE1 | 128 | 525 | 22 | 46693275 | 46704453 | |
| BF799939 | EIF3E | 17 | 272 | 8 | 109228642 | 109240524 | PRSS23 | 264 | 662 | 11 | 86519299 | 86519699 | |
| Top |
| Mutation type/ Tissue ID | brca | cns | cerv | endome | haematopo | kidn | Lintest | liver | lung | ns | ovary | pancre | prost | skin | stoma | thyro | urina | |||
| Total # sample | 2 | 1 | ||||||||||||||||||
| GAIN (# sample) | 1 | 1 | ||||||||||||||||||
| LOSS (# sample) | 1 |
| cf) Tissue ID; Tissue type (1; Breast, 2; Central_nervous_system, 3; Cervix, 4; Endometrium, 5; Haematopoietic_and_lymphoid_tissue, 6; Kidney, 7; Large_intestine, 8; Liver, 9; Lung, 10; NS, 11; Ovary, 12; Pancreas, 13; Prostate, 14; Skin, 15; Stomach, 16; Thyroid, 17; Urinary_tract) |
| Top |
|
 |
| Top |
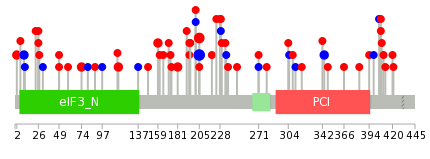
| Stat. for Non-Synonymous SNVs (# total SNVs=57) | (# total SNVs=16) |
 |  |
(# total SNVs=2) | (# total SNVs=2) |
 |  |
| Top |
| * When you move the cursor on each content, you can see more deailed mutation information on the Tooltip. Those are primary_site,primary_histology,mutation(aa),pubmedID. |
| GRCh37 position | Mutation(aa) | Unique sampleID count |
| chr8:109240603-109240603 | p.L205L | 6 |
| chr8:109240604-109240604 | p.L205P | 5 |
| chr8:109215229-109215229 | p.Q428* | 3 |
| chr8:109241421-109241421 | p.P159T | 2 |
| chr8:109260927-109260927 | p.A2V | 2 |
| chr8:109248412-109248412 | p.D115G | 2 |
| chr8:109241355-109241355 | p.N181D | 2 |
| chr8:109260856-109260856 | p.L26I | 2 |
| chr8:109226865-109226865 | p.F344F | 2 |
| chr8:109252288-109252288 | p.R74S | 2 |
| Top |
|
 |
| Point Mutation/ Tissue ID | 1 | 2 | 3 | 4 | 5 | 6 | 7 | 8 | 9 | 10 | 11 | 12 | 13 | 14 | 15 | 16 | 17 | 18 | 19 | 20 |
| # sample | 2 | 3 | 3 | 17 | 1 | 2 | 1 | 1 | 6 | 6 | 4 | 2 | 2 | 7 | ||||||
| # mutation | 2 | 3 | 3 | 8 | 1 | 2 | 1 | 1 | 6 | 7 | 4 | 2 | 2 | 11 | ||||||
| nonsynonymous SNV | 1 | 2 | 6 | 1 | 2 | 1 | 4 | 6 | 4 | 1 | 1 | 10 | ||||||||
| synonymous SNV | 2 | 2 | 1 | 2 | 1 | 2 | 1 | 1 | 1 | 1 |
| cf) Tissue ID; Tissue type (1; BLCA[Bladder Urothelial Carcinoma], 2; BRCA[Breast invasive carcinoma], 3; CESC[Cervical squamous cell carcinoma and endocervical adenocarcinoma], 4; COAD[Colon adenocarcinoma], 5; GBM[Glioblastoma multiforme], 6; Glioma Low Grade, 7; HNSC[Head and Neck squamous cell carcinoma], 8; KICH[Kidney Chromophobe], 9; KIRC[Kidney renal clear cell carcinoma], 10; KIRP[Kidney renal papillary cell carcinoma], 11; LAML[Acute Myeloid Leukemia], 12; LUAD[Lung adenocarcinoma], 13; LUSC[Lung squamous cell carcinoma], 14; OV[Ovarian serous cystadenocarcinoma ], 15; PAAD[Pancreatic adenocarcinoma], 16; PRAD[Prostate adenocarcinoma], 17; SKCM[Skin Cutaneous Melanoma], 18:STAD[Stomach adenocarcinoma], 19:THCA[Thyroid carcinoma], 20:UCEC[Uterine Corpus Endometrial Carcinoma]) |
| Top |
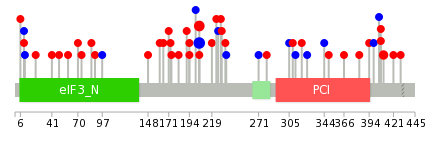
| * We represented just top 10 SNVs. When you move the cursor on each content, you can see more deailed mutation information on the Tooltip. Those are primary_site, primary_histology, mutation(aa), pubmedID. |
| Genomic Position | Mutation(aa) | Unique sampleID count |
| chr8:109240603 | p.L205L | 6 |
| chr8:109240604 | p.L205P | 5 |
| chr8:109260902 | p.I10I | 2 |
| chr8:109215282 | p.S410N | 2 |
| chr8:109240547 | p.I405I | 1 |
| chr8:109215290 | p.D230N | 1 |
| chr8:109241385 | p.T161A | 1 |
| chr8:109254111 | p.S399S | 1 |
| chr8:109228656 | p.R229C | 1 |
| chr8:109240563 | p.A148S | 1 |
| * Copy number data were extracted from TCGA using R package TCGA-Assembler. The URLs of all public data files on TCGA DCC data server were gathered on Jan-05-2015. Function ProcessCNAData in TCGA-Assembler package was used to obtain gene-level copy number value which is calculated as the average copy number of the genomic region of a gene. |
 |
| cf) Tissue ID[Tissue type]: BLCA[Bladder Urothelial Carcinoma], BRCA[Breast invasive carcinoma], CESC[Cervical squamous cell carcinoma and endocervical adenocarcinoma], COAD[Colon adenocarcinoma], GBM[Glioblastoma multiforme], Glioma Low Grade, HNSC[Head and Neck squamous cell carcinoma], KICH[Kidney Chromophobe], KIRC[Kidney renal clear cell carcinoma], KIRP[Kidney renal papillary cell carcinoma], LAML[Acute Myeloid Leukemia], LUAD[Lung adenocarcinoma], LUSC[Lung squamous cell carcinoma], OV[Ovarian serous cystadenocarcinoma ], PAAD[Pancreatic adenocarcinoma], PRAD[Prostate adenocarcinoma], SKCM[Skin Cutaneous Melanoma], STAD[Stomach adenocarcinoma], THCA[Thyroid carcinoma], UCEC[Uterine Corpus Endometrial Carcinoma] |
| Top |
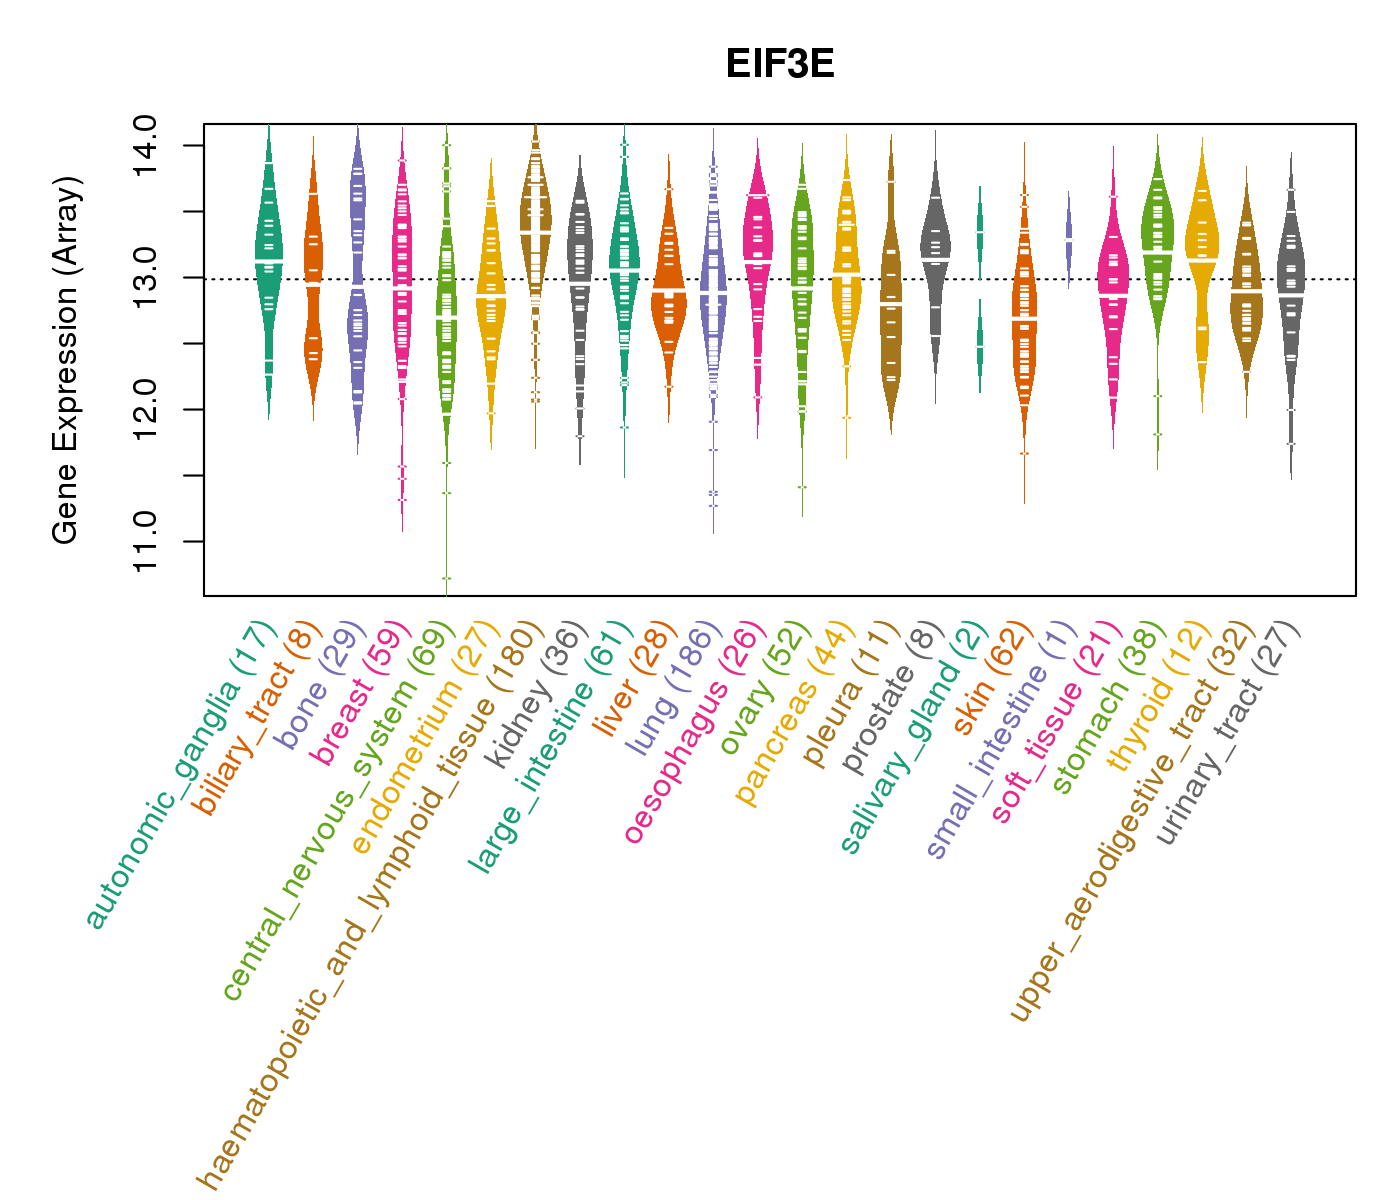
| Gene Expression for EIF3E |
| * CCLE gene expression data were extracted from CCLE_Expression_Entrez_2012-10-18.res: Gene-centric RMA-normalized mRNA expression data. |
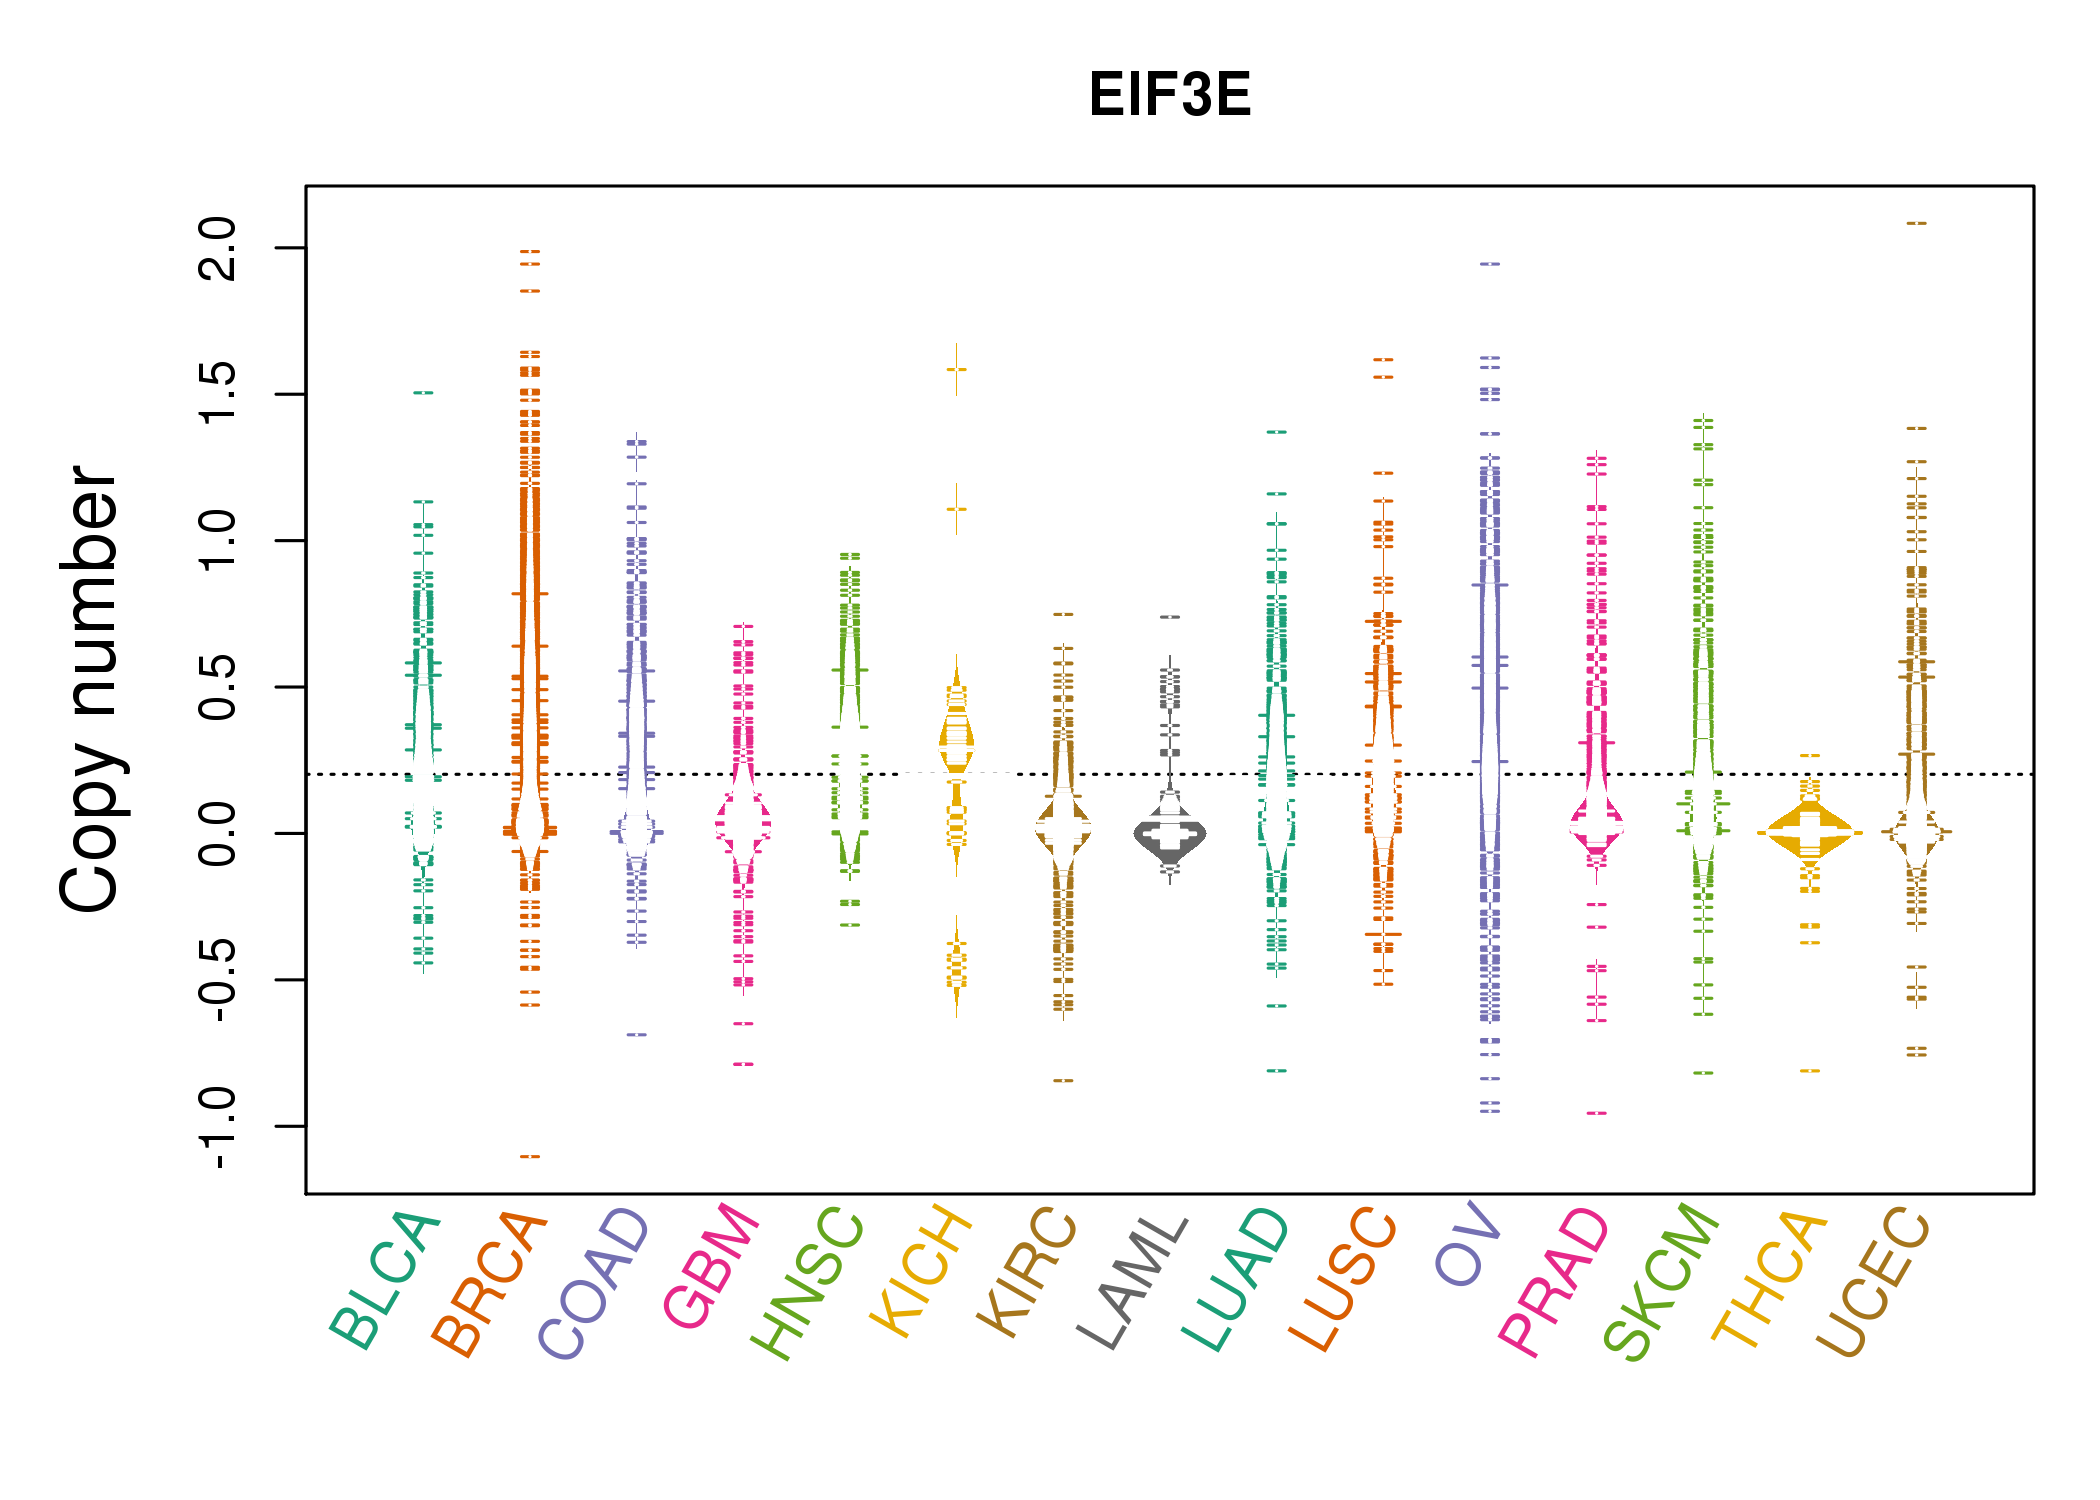
 |
| * Normalized gene expression data of RNASeqV2 was extracted from TCGA using R package TCGA-Assembler. The URLs of all public data files on TCGA DCC data server were gathered at Jan-05-2015. Only eight cancer types have enough normal control samples for differential expression analysis. (t test, adjusted p<0.05 (using Benjamini-Hochberg FDR)) |
 |
| Top |
| * This plots show the correlation between CNV and gene expression. |
: Open all plots for all cancer types
 |
|
 |
|


| Top |
| Gene-Gene Network Information |
| * Co-Expression network figures were drawn using R package igraph. Only the top 20 genes with the highest correlations were shown. Red circle: input gene, orange circle: cell metabolism gene, sky circle: other gene |
: Open all plots for all cancer types
 |
|
| C8orf59,CHMP4C,DCAF13,EIF3E,ENY2,LOC442454,MRPL15, MTERF3,NUDCD1,PABPC1,PABPC3,PTDSS1,RPL30,RPL7, SLC25A32,TATDN1,EMC2,UBE2V2,UQCRB,WDYHV1,ZFAND1 | CCNB1IP1,EIF2A,EIF2S3,EIF3E,EIF3L,EIF3M,LTA4H, NAP1L1,PABPC1,PMPCB,RPL15,RPL22,RPL7,RPS3A, RSL1D1,RSL24D1,TAF1D,TATDN1,TIMM9,TOMM20,ZNF277 |
 |
|
| ANKRD46,AZIN1,NDUFAF6,C8orf59,COPS5,DCAF13,DPY19L4, E2F5,EBAG9,EIF3E,EIF3H,MED30,MRPL13,NSMCE2, PABPC1,RPL30,RPL8,TATDN1,EMC2,WDYHV1,ZFAND1 | BOD1,BTF3,C11orf57,DPH5,EEF1A1P9,EIF3E,POLR2M___GCOM1, ICE2,RPL10,RPL10A,RPL14,RPL15,RPL34,RPL5, RPS15A,RSL1D1,TIMM9,TMEM182,UTP23,ZFAND1,ZNF614 |

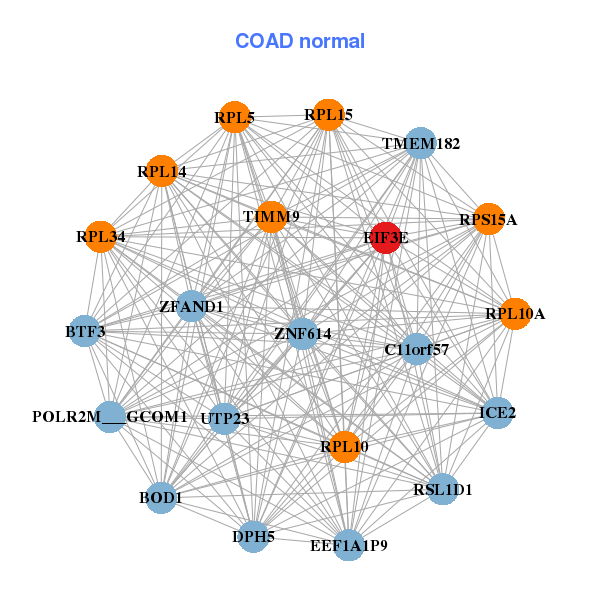
| * Co-Expression network figures were drawn using R package igraph. Only the top 20 genes with the highest correlations were shown. Red circle: input gene, orange circle: cell metabolism gene, sky circle: other gene |
: Open all plots for all cancer types
| Top |
: Open all interacting genes' information including KEGG pathway for all interacting genes from DAVID
| Top |
| Pharmacological Information for EIF3E |
| There's no related Drug. |
| Top |
| Cross referenced IDs for EIF3E |
| * We obtained these cross-references from Uniprot database. It covers 150 different DBs, 18 categories. http://www.uniprot.org/help/cross_references_section |
: Open all cross reference information
|
Copyright © 2016-Present - The Univsersity of Texas Health Science Center at Houston @ |