|
||||||||||||||||||||
| |
| Phenotypic Information (metabolism pathway, cancer, disease, phenome) |
| |
| |
| Gene-Gene Network Information: Co-Expression Network, Interacting Genes & KEGG |
| |
|


| Gene Summary for STT3A |
| Basic gene info. | Gene symbol | STT3A |
| Gene name | STT3A, subunit of the oligosaccharyltransferase complex (catalytic) | |
| Synonyms | ITM1|STT3-A|TMC | |
| Cytomap | UCSC genome browser: 11q23.3 | |
| Genomic location | chr11 :125462738-125491280 | |
| Type of gene | protein-coding | |
| RefGenes | NM_001278503.1, NM_001278504.1,NM_152713.4, | |
| Ensembl id | ENSG00000134910 | |
| Description | B5STT3, subunit of the oligosaccharyltransferase complex, homolog ASTT3A, cataylic subunit of the oligosaccharyltransferase complexdolichyl-diphosphooligosaccharide protein glycotransferasedolichyl-diphosphooligosaccharide--protein glycosyltransferase | |
| Modification date | 20141219 | |
| dbXrefs | MIM : 601134 | |
| HGNC : HGNC | ||
| Ensembl : ENSG00000134910 | ||
| HPRD : 03086 | ||
| Vega : OTTHUMG00000165852 | ||
| Protein | UniProt: go to UniProt's Cross Reference DB Table | |
| Expression | CleanEX: HS_STT3A | |
| BioGPS: 3703 | ||
| Gene Expression Atlas: ENSG00000134910 | ||
| The Human Protein Atlas: ENSG00000134910 | ||
| Pathway | NCI Pathway Interaction Database: STT3A | |
| KEGG: STT3A | ||
| REACTOME: STT3A | ||
| ConsensusPathDB | ||
| Pathway Commons: STT3A | ||
| Metabolism | MetaCyc: STT3A | |
| HUMANCyc: STT3A | ||
| Regulation | Ensembl's Regulation: ENSG00000134910 | |
| miRBase: chr11 :125,462,738-125,491,280 | ||
| TargetScan: NM_001278503 | ||
| cisRED: ENSG00000134910 | ||
| Context | iHOP: STT3A | |
| cancer metabolism search in PubMed: STT3A | ||
| UCL Cancer Institute: STT3A | ||
| Assigned class in ccmGDB | C | |
| Top |
| Phenotypic Information for STT3A(metabolism pathway, cancer, disease, phenome) |
| Cancer | CGAP: STT3A |
| Familial Cancer Database: STT3A | |
| * This gene is included in those cancer gene databases. |
|
|
|
|
|
|
| ||||||||||||||
Oncogene 1 | Significant driver gene in | |||||||||||||||||||
| cf) number; DB name 1 Oncogene; http://nar.oxfordjournals.org/content/35/suppl_1/D721.long, 2 Tumor Suppressor gene; https://bioinfo.uth.edu/TSGene/, 3 Cancer Gene Census; http://www.nature.com/nrc/journal/v4/n3/abs/nrc1299.html, 4 CancerGenes; http://nar.oxfordjournals.org/content/35/suppl_1/D721.long, 5 Network of Cancer Gene; http://ncg.kcl.ac.uk/index.php, 1Therapeutic Vulnerabilities in Cancer; http://cbio.mskcc.org/cancergenomics/statius/ |
| REACTOME_METABOLISM_OF_PROTEINS | |
| OMIM | |
| Orphanet | |
| Disease | KEGG Disease: STT3A |
| MedGen: STT3A (Human Medical Genetics with Condition) | |
| ClinVar: STT3A | |
| Phenotype | MGI: STT3A (International Mouse Phenotyping Consortium) |
| PhenomicDB: STT3A | |
| Mutations for STT3A |
| * Under tables are showing count per each tissue to give us broad intuition about tissue specific mutation patterns.You can go to the detailed page for each mutation database's web site. |
| There's no structural variation information in COSMIC data for this gene. |
| * From mRNA Sanger sequences, Chitars2.0 arranged chimeric transcripts. This table shows STT3A related fusion information. |
| ID | Head Gene | Tail Gene | Accession | Gene_a | qStart_a | qEnd_a | Chromosome_a | tStart_a | tEnd_a | Gene_a | qStart_a | qEnd_a | Chromosome_a | tStart_a | tEnd_a |
| EC545946 | STT3A | 1 | 66 | 11 | 125488308 | 125488374 | CKB | 59 | 103 | 14 | 103986331 | 103986376 | |
| AU139929 | STT3A | 1 | 287 | 11 | 125462749 | 125472235 | LIPG | 280 | 654 | 18 | 47091715 | 47095841 | |
| BE696961 | STT3A | 17 | 88 | 11 | 125462999 | 125463073 | GJA1 | 81 | 187 | 6 | 121769334 | 121769440 | |
| CN404588 | STT3A | 1 | 270 | 11 | 125463926 | 125464195 | LRRC47 | 268 | 609 | 1 | 3696902 | 3697243 | |
| BE837748 | STT3A | 52 | 194 | 11 | 125474050 | 125475574 | UBQLN4 | 183 | 499 | 1 | 156013163 | 156013479 | |
| BF803158 | STT3A | 22 | 292 | 11 | 125490436 | 125490703 | PTPN23 | 273 | 433 | 3 | 47450292 | 47450452 | |
| AW366596 | CARKD | 278 | 338 | 13 | 111290474 | 111290534 | STT3A | 339 | 462 | 11 | 125474095 | 125475599 | |
| AW366584 | CARKD | 245 | 305 | 13 | 111290474 | 111290534 | STT3A | 306 | 429 | 11 | 125474095 | 125475599 | |
| Top |
| There's no copy number variation information in COSMIC data for this gene. |
| Top |
|
 |
| Top |
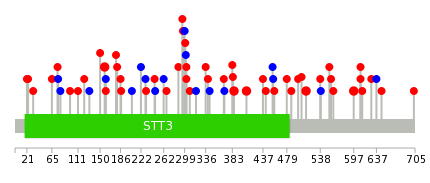
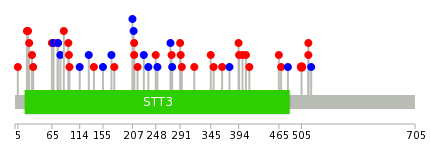
| Stat. for Non-Synonymous SNVs (# total SNVs=46) | (# total SNVs=10) |
 |  |
(# total SNVs=1) | (# total SNVs=0) |
 |
| Top |
| * When you move the cursor on each content, you can see more deailed mutation information on the Tooltip. Those are primary_site,primary_histology,mutation(aa),pubmedID. |
| GRCh37 position | Mutation(aa) | Unique sampleID count |
| chr11:125474106-125474106 | p.I158V | 2 |
| chr11:125488267-125488267 | p.? | 2 |
| chr11:125488282-125488282 | p.L597I | 2 |
| chr11:125481361-125481361 | p.R386W | 2 |
| chr11:125483055-125483055 | p.R513C | 2 |
| chr11:125482500-125482500 | p.L408P | 2 |
| chr11:125466960-125466960 | p.S32Y | 1 |
| chr11:125478126-125478126 | p.S301S | 1 |
| chr11:125484329-125484329 | p.? | 1 |
| chr11:125479493-125479493 | p.? | 1 |
| Top |
|
 |
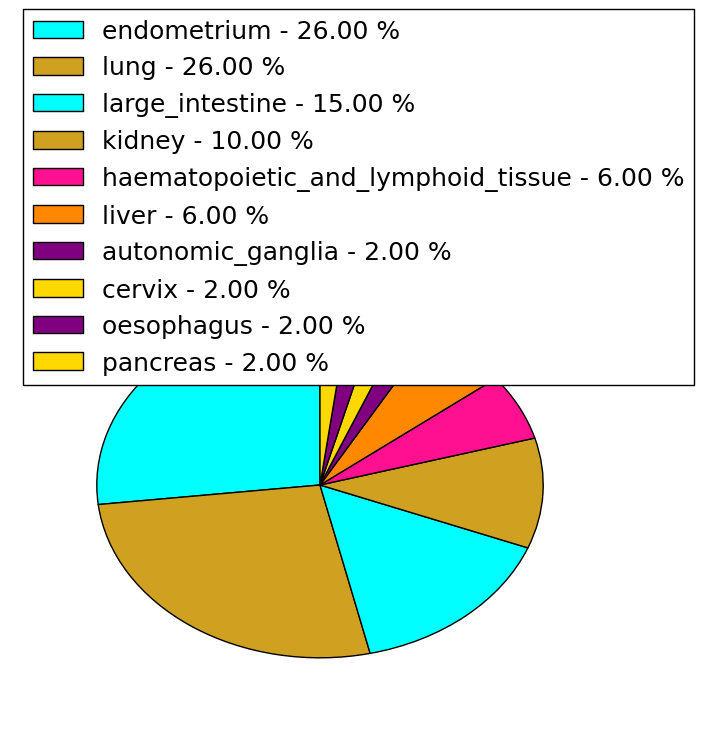
| Point Mutation/ Tissue ID | 1 | 2 | 3 | 4 | 5 | 6 | 7 | 8 | 9 | 10 | 11 | 12 | 13 | 14 | 15 | 16 | 17 | 18 | 19 | 20 |
| # sample | 1 | 1 | 4 | 1 | 3 | 8 | 4 | 1 | 6 | 6 | 2 | 10 | ||||||||
| # mutation | 1 | 1 | 4 | 1 | 3 | 11 | 4 | 1 | 6 | 6 | 2 | 13 | ||||||||
| nonsynonymous SNV | 1 | 1 | 4 | 3 | 8 | 2 | 1 | 1 | 5 | 1 | 10 | |||||||||
| synonymous SNV | 1 | 3 | 2 | 5 | 1 | 1 | 3 |
| cf) Tissue ID; Tissue type (1; BLCA[Bladder Urothelial Carcinoma], 2; BRCA[Breast invasive carcinoma], 3; CESC[Cervical squamous cell carcinoma and endocervical adenocarcinoma], 4; COAD[Colon adenocarcinoma], 5; GBM[Glioblastoma multiforme], 6; Glioma Low Grade, 7; HNSC[Head and Neck squamous cell carcinoma], 8; KICH[Kidney Chromophobe], 9; KIRC[Kidney renal clear cell carcinoma], 10; KIRP[Kidney renal papillary cell carcinoma], 11; LAML[Acute Myeloid Leukemia], 12; LUAD[Lung adenocarcinoma], 13; LUSC[Lung squamous cell carcinoma], 14; OV[Ovarian serous cystadenocarcinoma ], 15; PAAD[Pancreatic adenocarcinoma], 16; PRAD[Prostate adenocarcinoma], 17; SKCM[Skin Cutaneous Melanoma], 18:STAD[Stomach adenocarcinoma], 19:THCA[Thyroid carcinoma], 20:UCEC[Uterine Corpus Endometrial Carcinoma]) |
| Top |
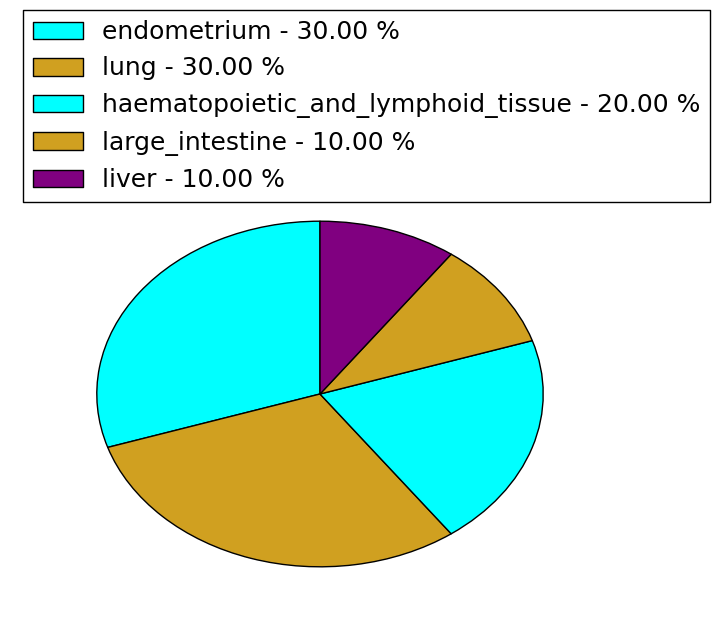
| * We represented just top 10 SNVs. When you move the cursor on each content, you can see more deailed mutation information on the Tooltip. Those are primary_site, primary_histology, mutation(aa), pubmedID. |
| Genomic Position | Mutation(aa) | Unique sampleID count |
| chr11:125488282 | p.L505I,STT3A | 2 |
| chr11:125466960 | p.R75Q,STT3A | 1 |
| chr11:125481355 | p.H175Y,STT3A | 1 |
| chr11:125475575 | p.L316P,STT3A | 1 |
| chr11:125483032 | p.E522E,STT3A | 1 |
| chr11:125478128 | p.A76A,STT3A | 1 |
| chr11:125472242 | p.F207F,STT3A | 1 |
| chr11:125481361 | p.R345H,STT3A | 1 |
| chr11:125475577 | p.L80L,STT3A | 1 |
| chr11:125484098 | p.S209S,STT3A | 1 |
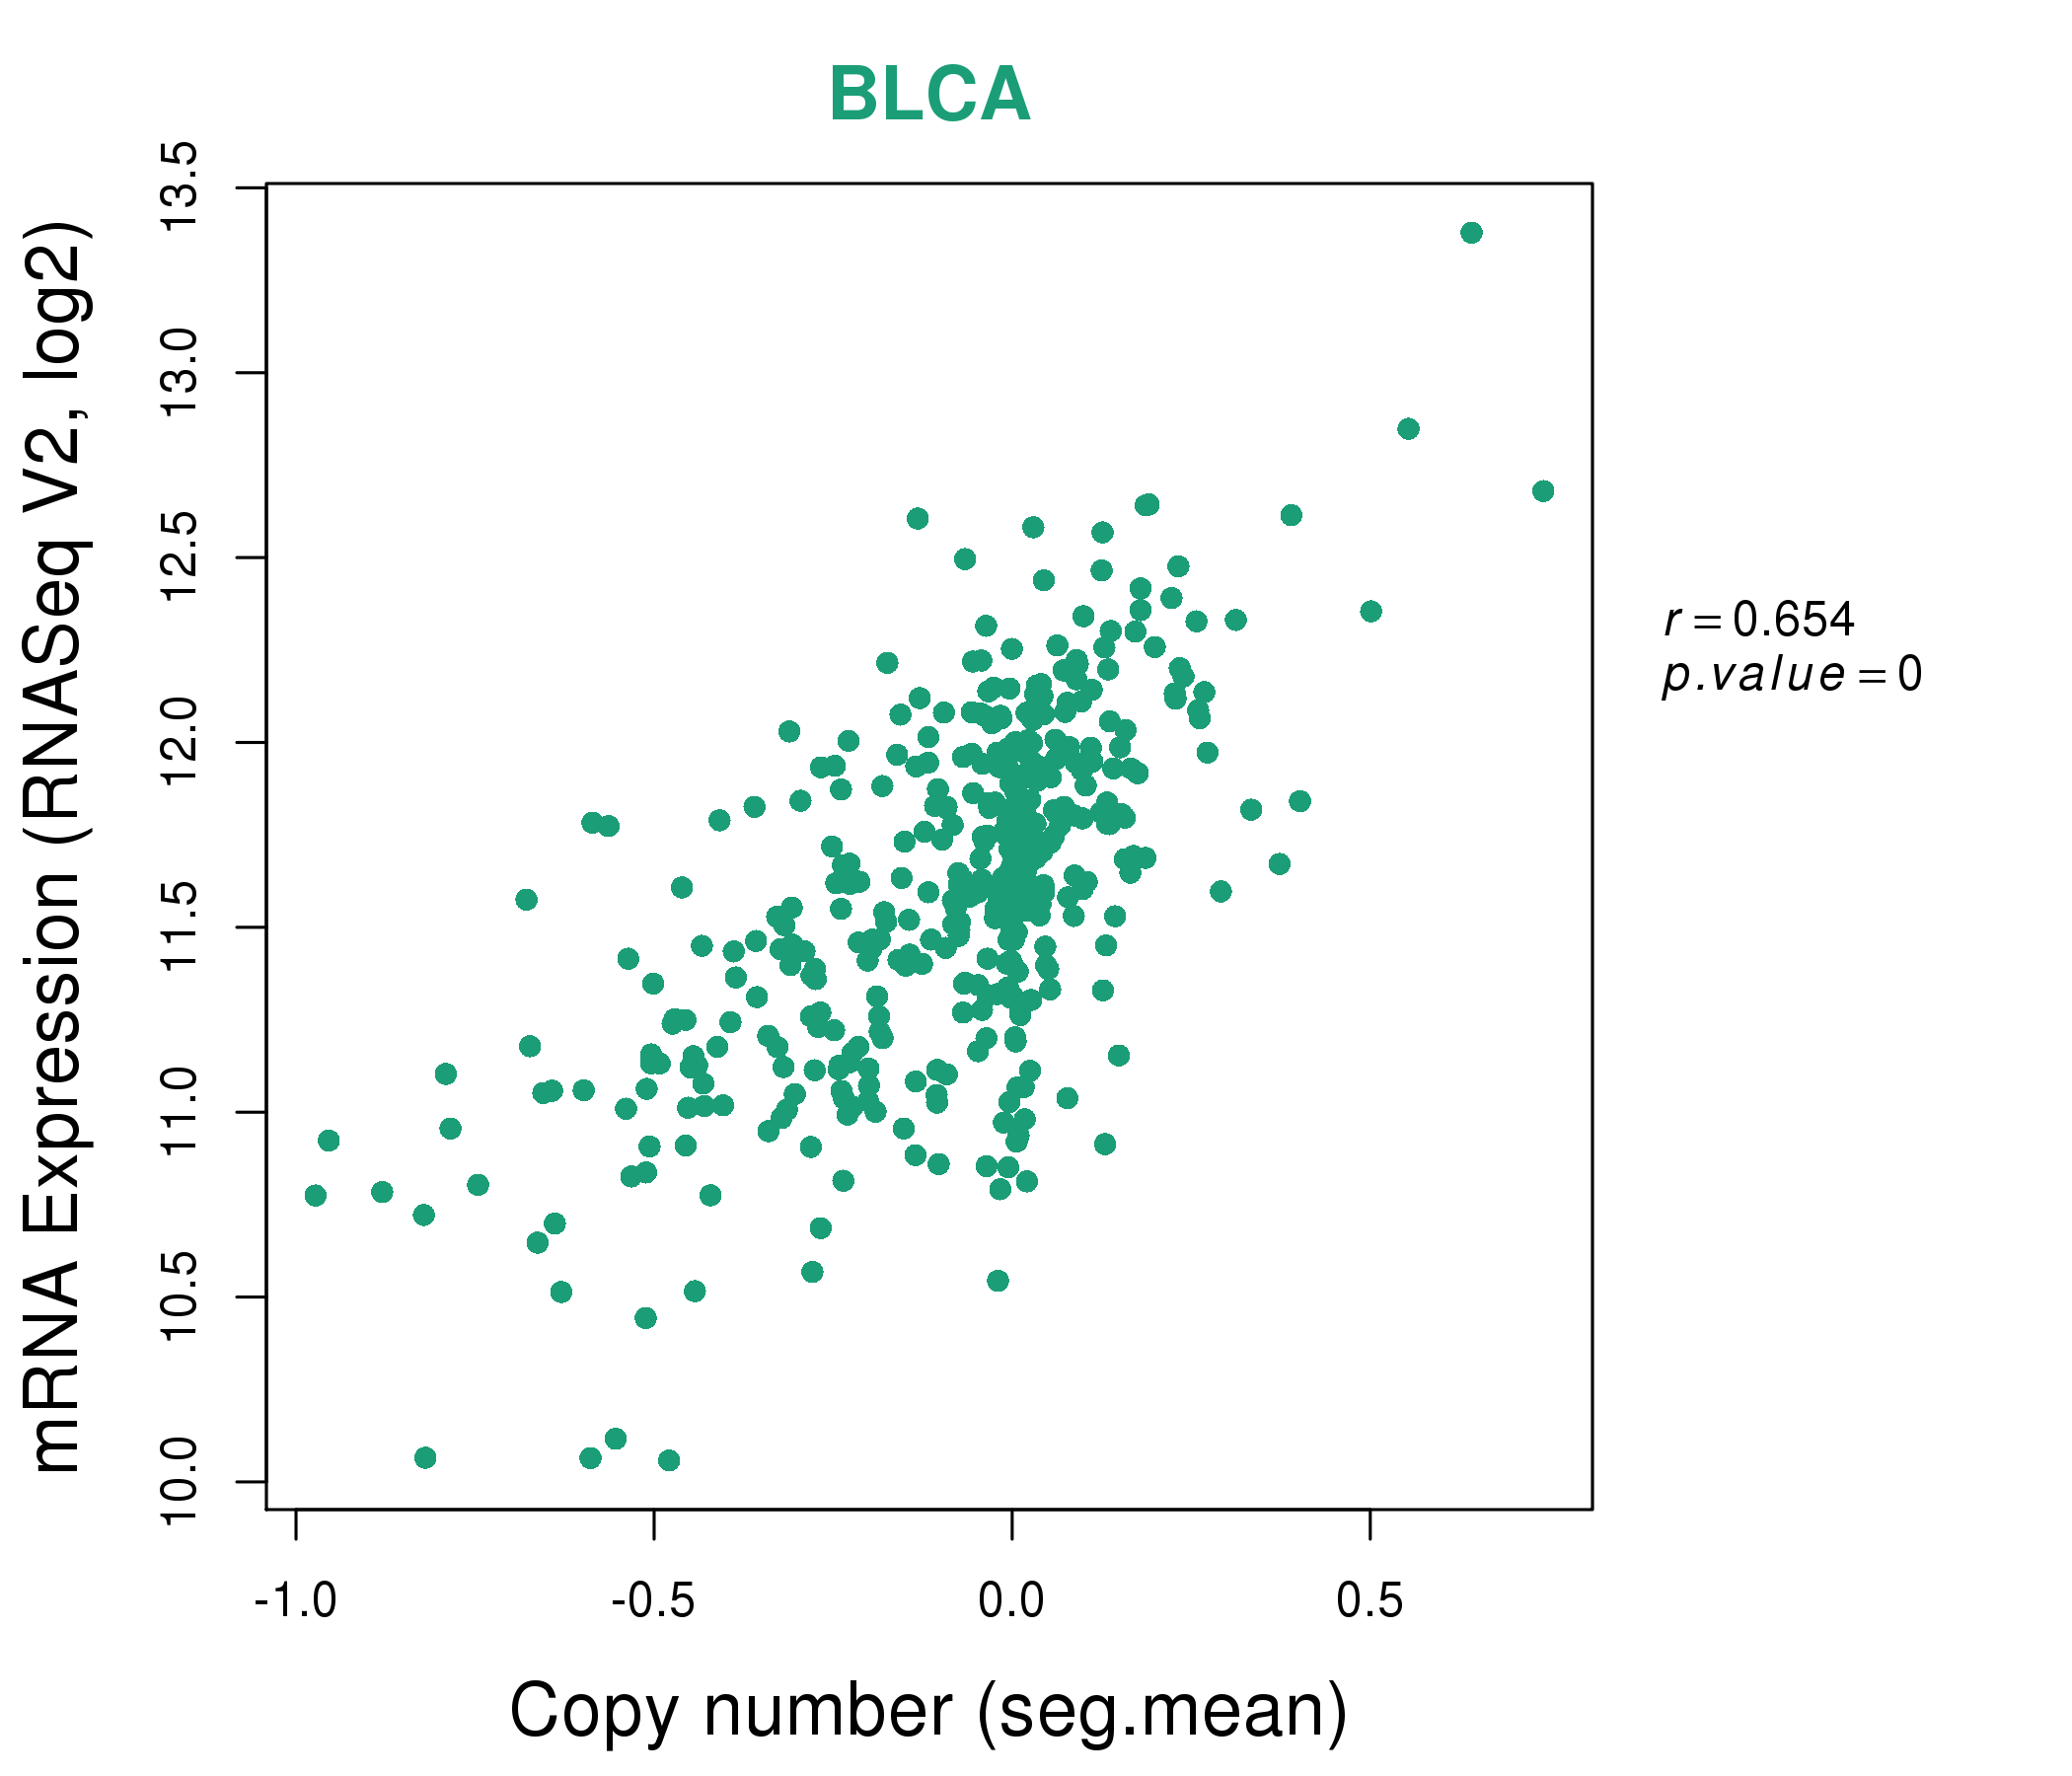
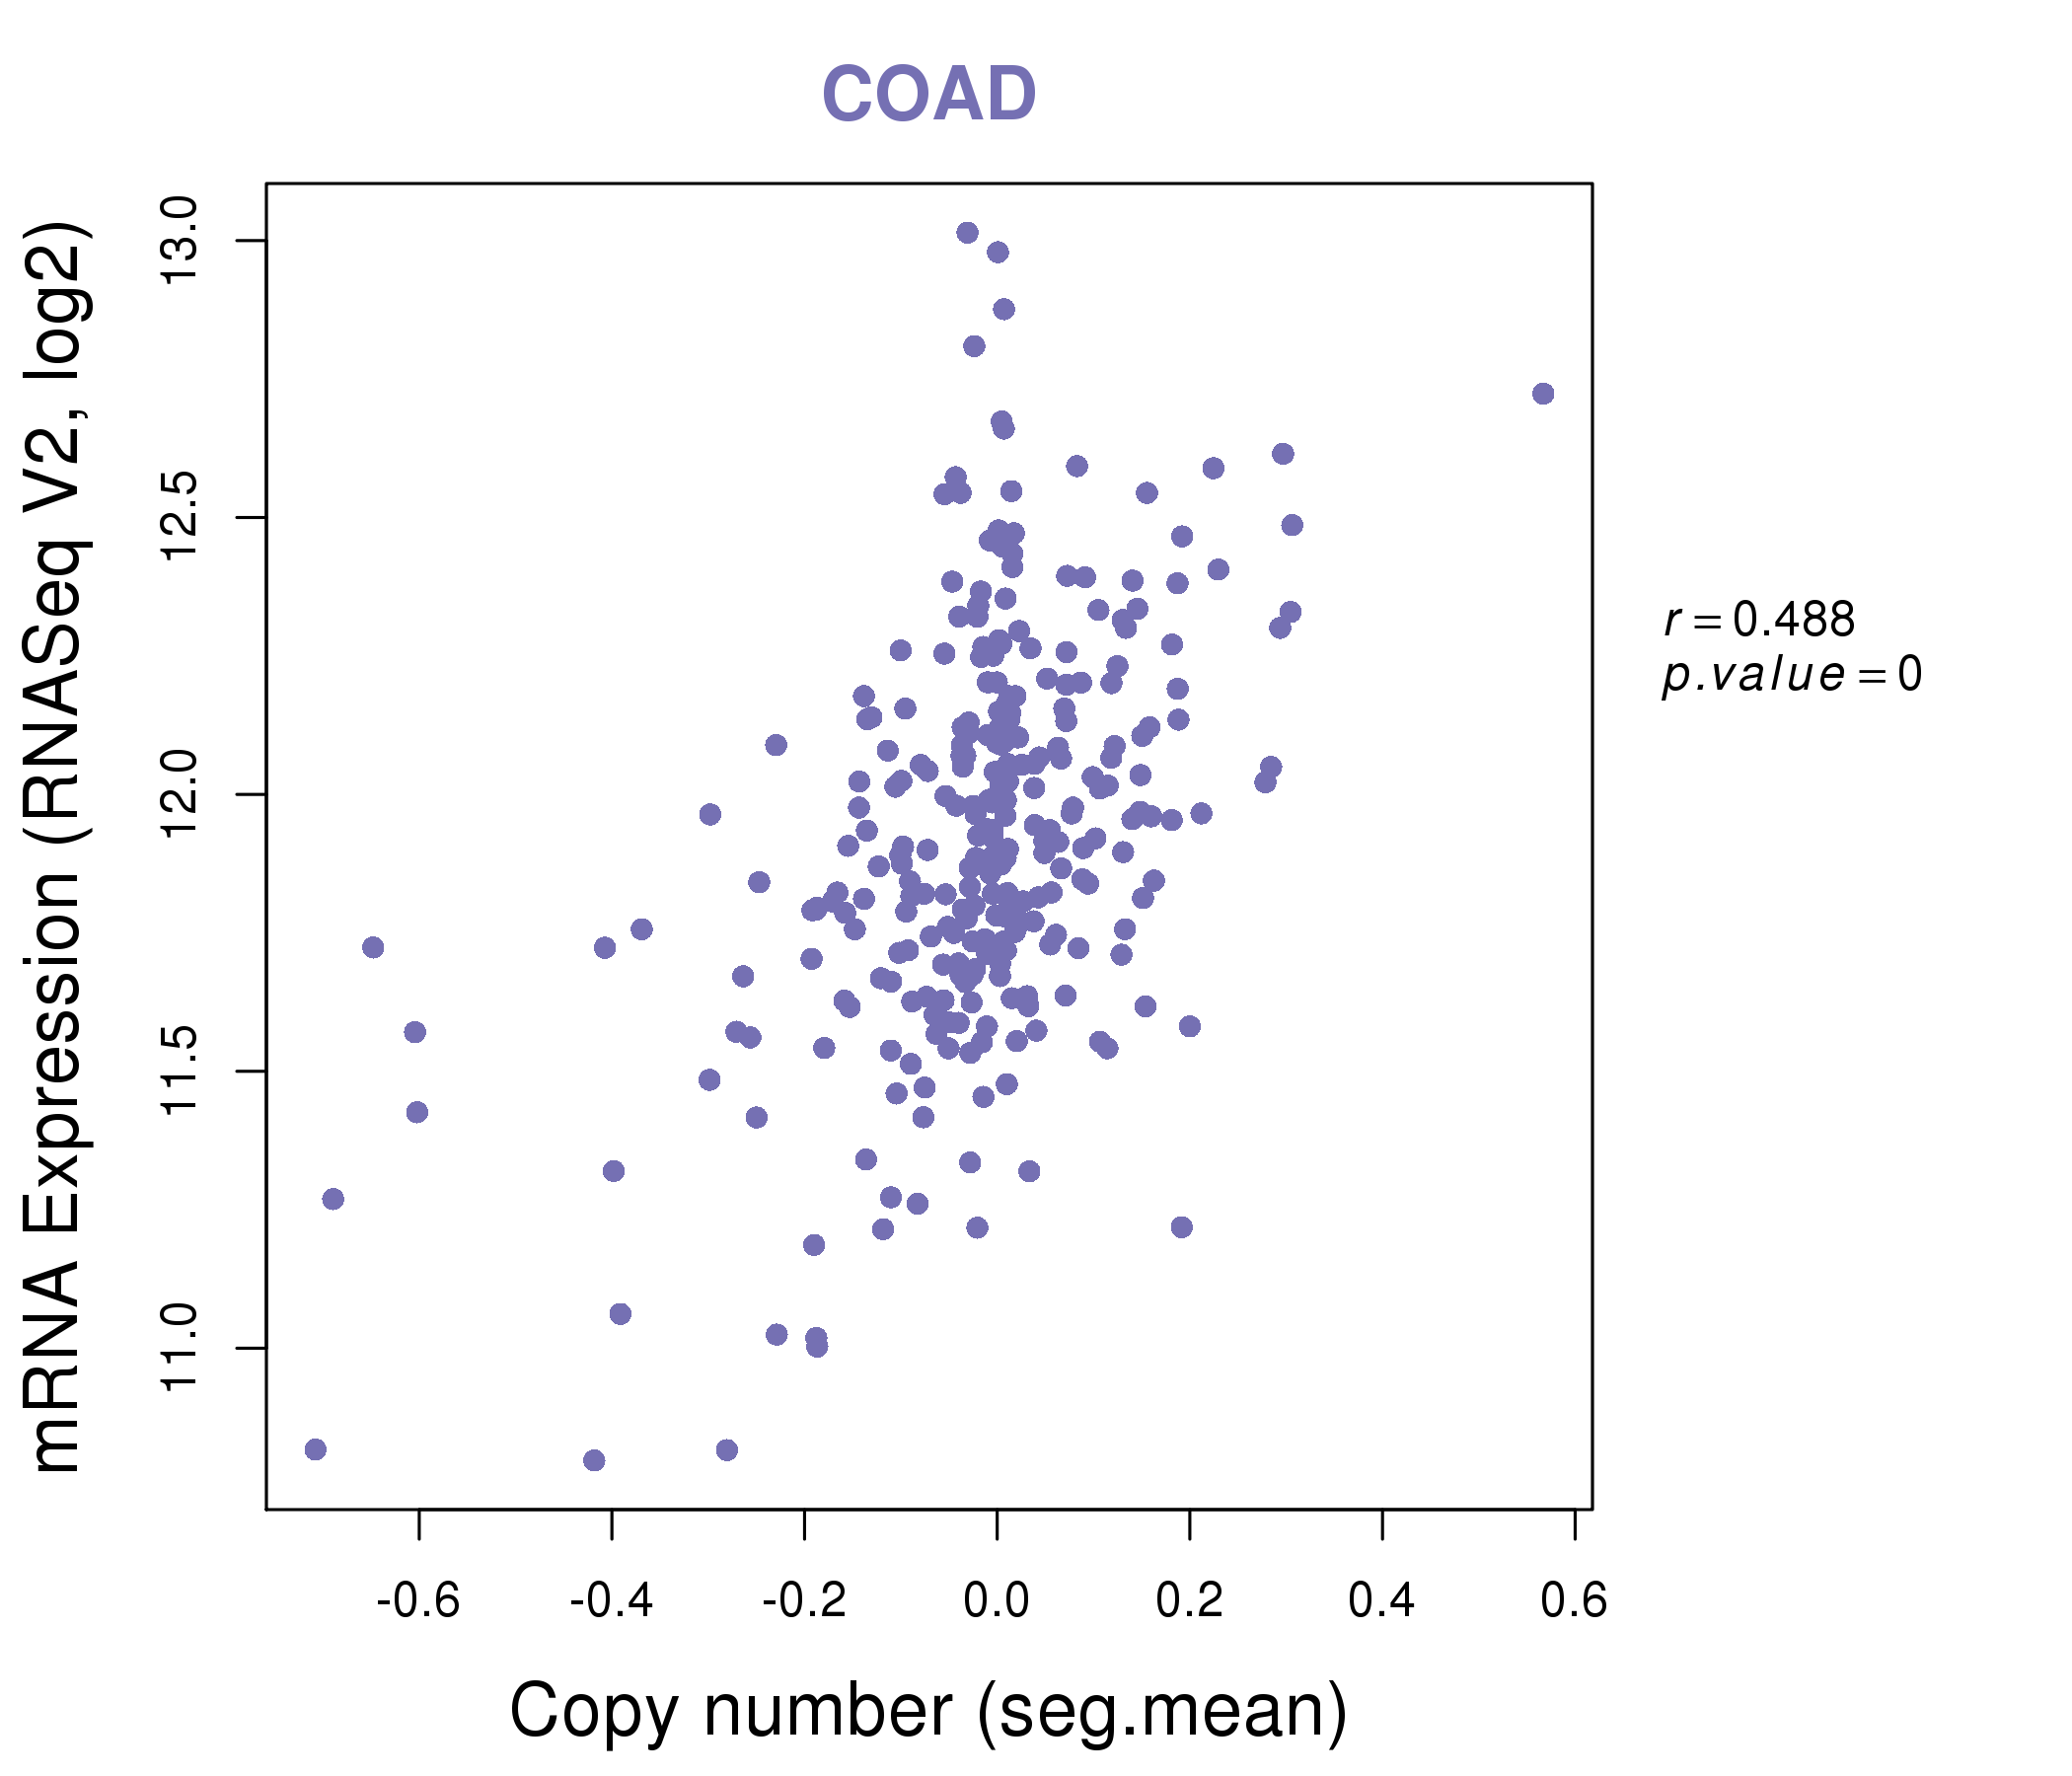
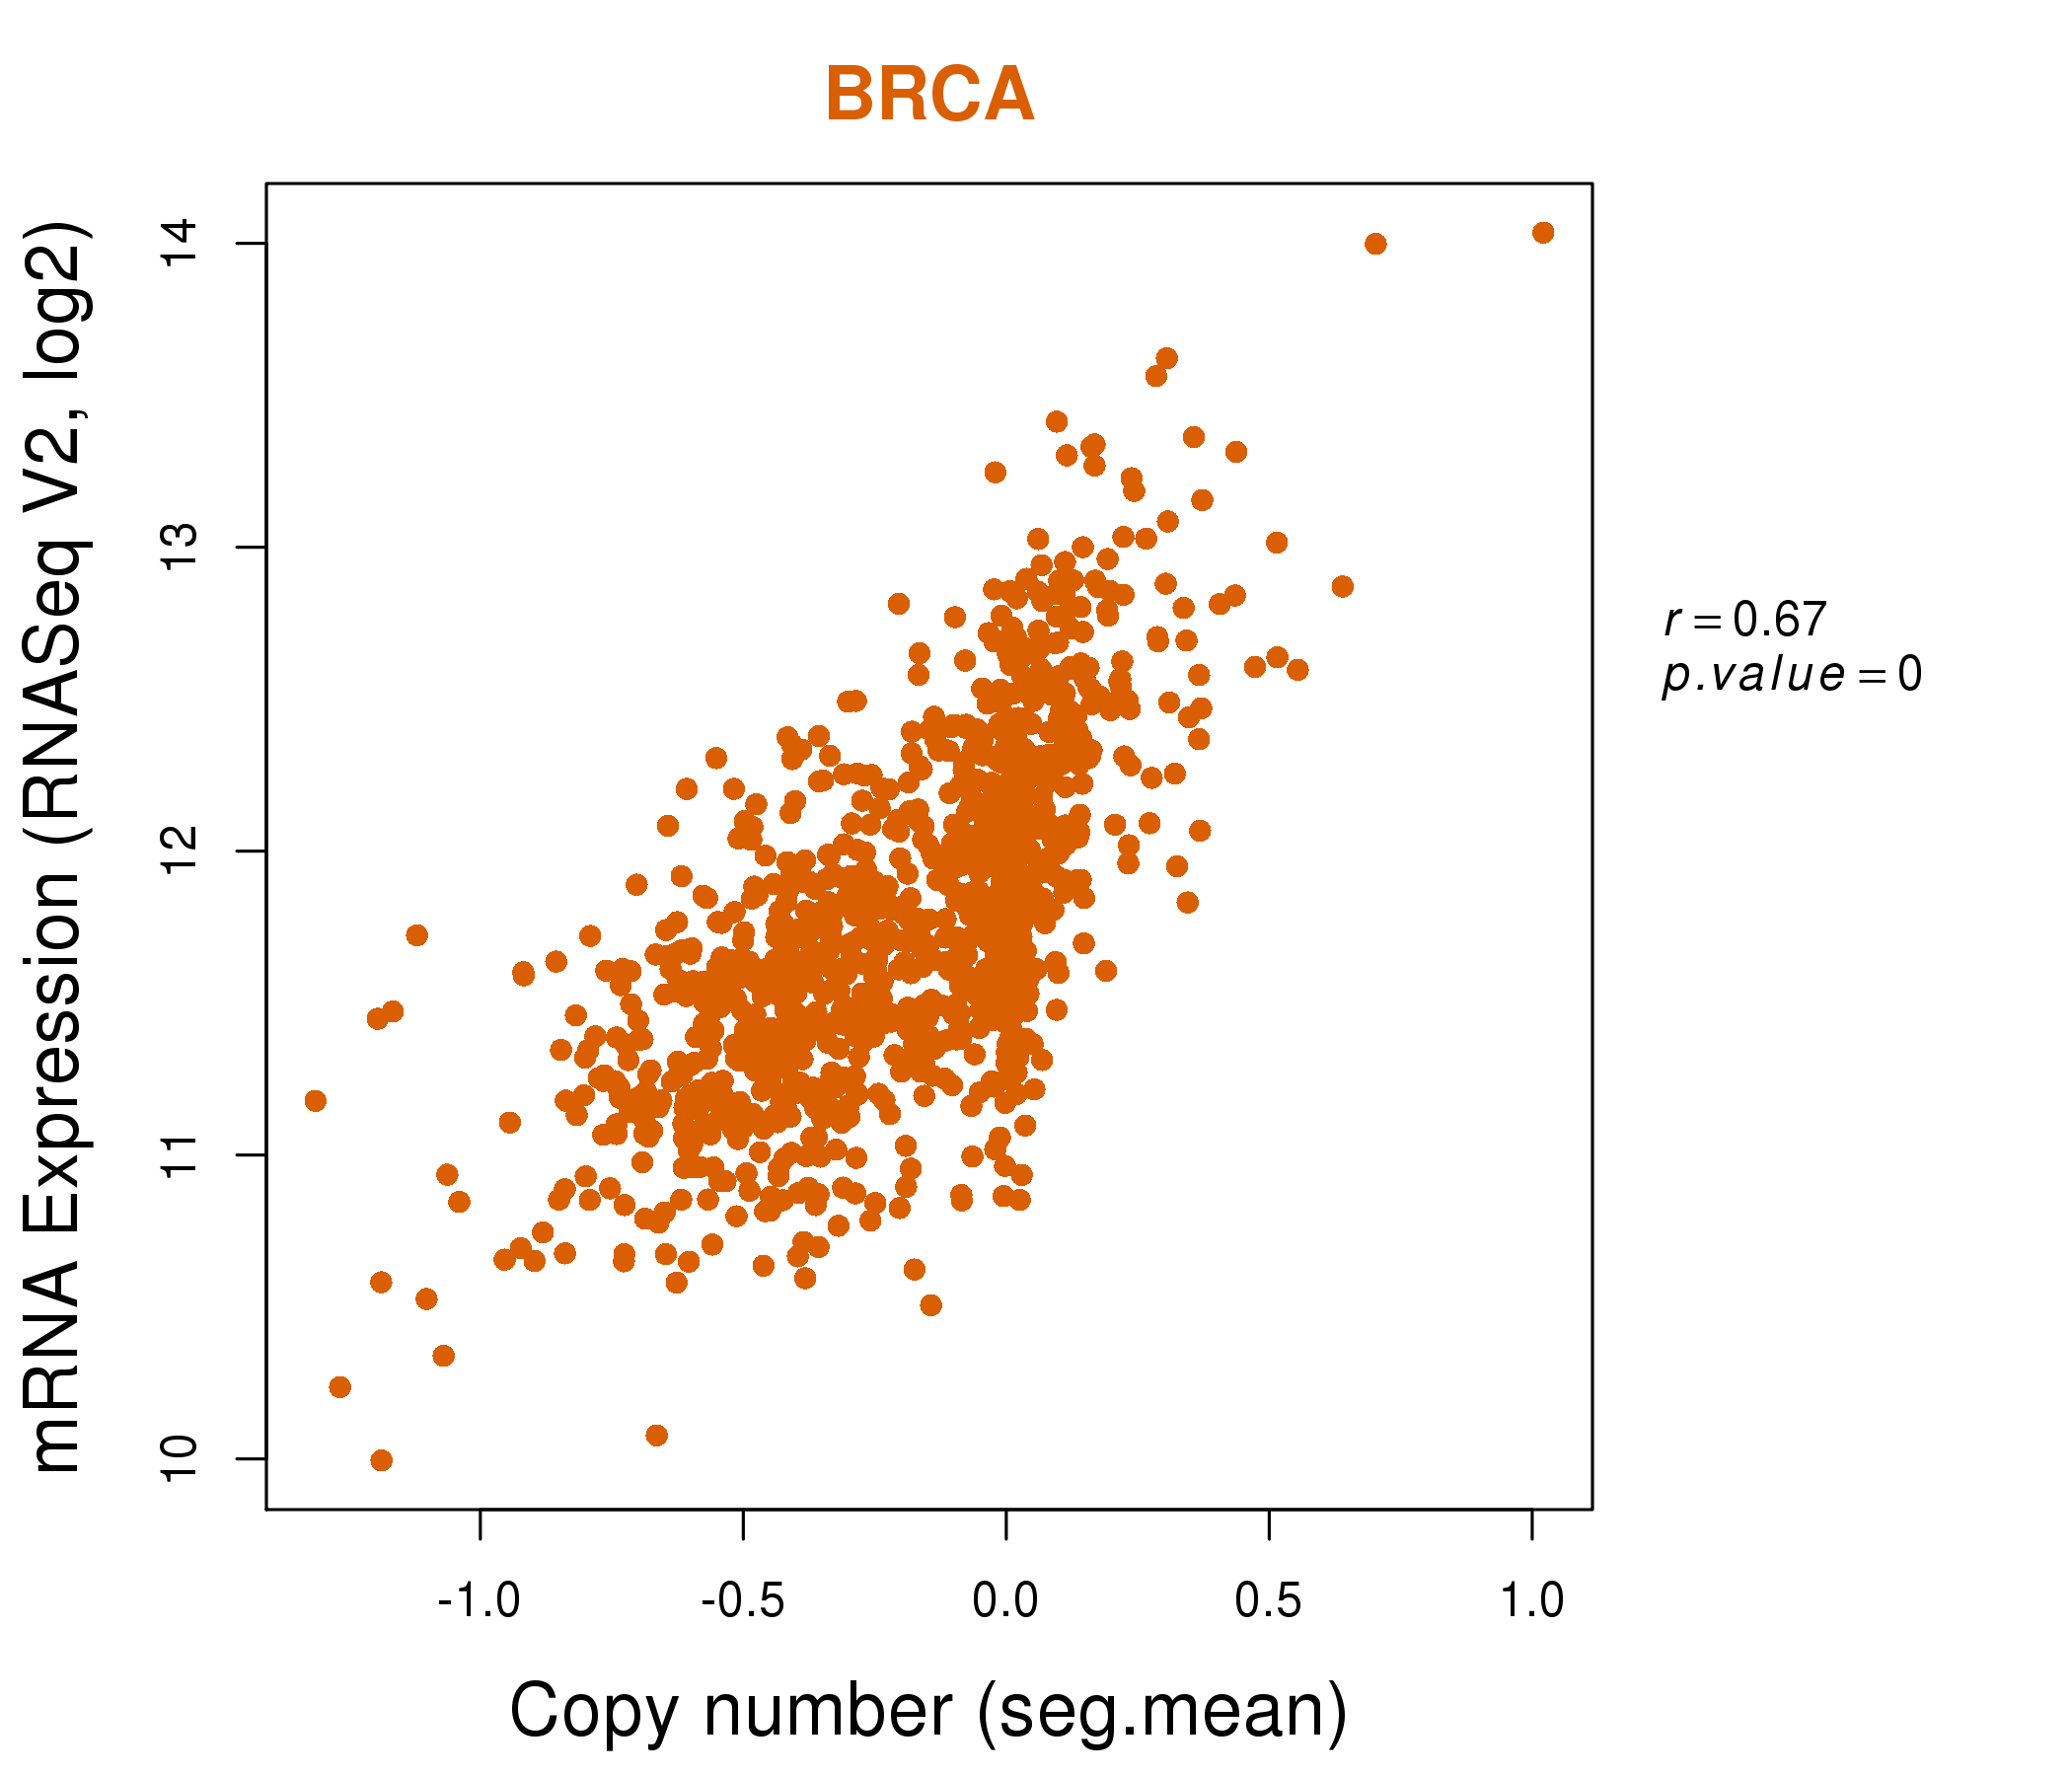
| * Copy number data were extracted from TCGA using R package TCGA-Assembler. The URLs of all public data files on TCGA DCC data server were gathered on Jan-05-2015. Function ProcessCNAData in TCGA-Assembler package was used to obtain gene-level copy number value which is calculated as the average copy number of the genomic region of a gene. |
 |
| cf) Tissue ID[Tissue type]: BLCA[Bladder Urothelial Carcinoma], BRCA[Breast invasive carcinoma], CESC[Cervical squamous cell carcinoma and endocervical adenocarcinoma], COAD[Colon adenocarcinoma], GBM[Glioblastoma multiforme], Glioma Low Grade, HNSC[Head and Neck squamous cell carcinoma], KICH[Kidney Chromophobe], KIRC[Kidney renal clear cell carcinoma], KIRP[Kidney renal papillary cell carcinoma], LAML[Acute Myeloid Leukemia], LUAD[Lung adenocarcinoma], LUSC[Lung squamous cell carcinoma], OV[Ovarian serous cystadenocarcinoma ], PAAD[Pancreatic adenocarcinoma], PRAD[Prostate adenocarcinoma], SKCM[Skin Cutaneous Melanoma], STAD[Stomach adenocarcinoma], THCA[Thyroid carcinoma], UCEC[Uterine Corpus Endometrial Carcinoma] |
| Top |
| Gene Expression for STT3A |
| * CCLE gene expression data were extracted from CCLE_Expression_Entrez_2012-10-18.res: Gene-centric RMA-normalized mRNA expression data. |
 |
| * Normalized gene expression data of RNASeqV2 was extracted from TCGA using R package TCGA-Assembler. The URLs of all public data files on TCGA DCC data server were gathered at Jan-05-2015. Only eight cancer types have enough normal control samples for differential expression analysis. (t test, adjusted p<0.05 (using Benjamini-Hochberg FDR)) |
 |
| Top |
| * This plots show the correlation between CNV and gene expression. |
: Open all plots for all cancer types
 |
|
 |
|

| Top |
| Gene-Gene Network Information |
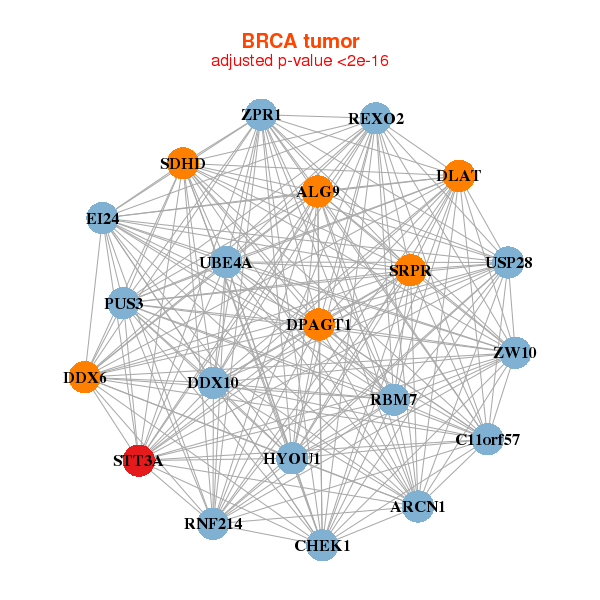
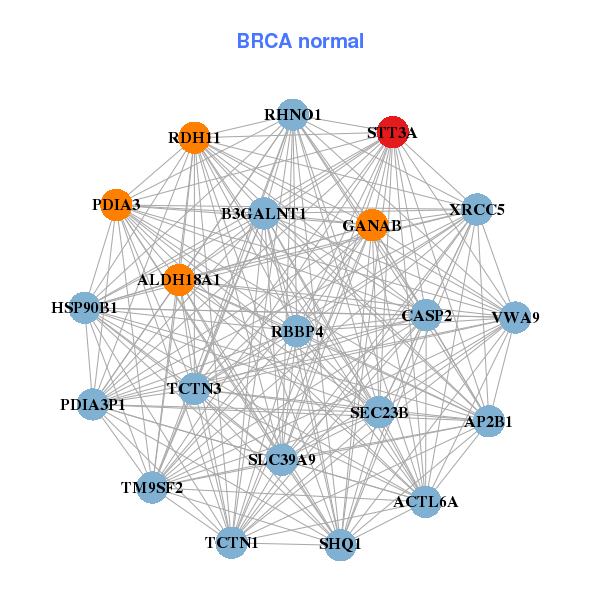
| * Co-Expression network figures were drawn using R package igraph. Only the top 20 genes with the highest correlations were shown. Red circle: input gene, orange circle: cell metabolism gene, sky circle: other gene |
: Open all plots for all cancer types
 |
|
| ALG9,ARCN1,C11orf57,CHEK1,DDX10,DDX6,DLAT, DPAGT1,EI24,HYOU1,PUS3,RBM7,REXO2,RNF214, SDHD,SRPR,STT3A,UBE4A,USP28,ZPR1,ZW10 | ACTL6A,ALDH18A1,AP2B1,B3GALNT1,RHNO1,VWA9,CASP2, GANAB,HSP90B1,PDIA3,PDIA3P1,RBBP4,RDH11,SEC23B, SHQ1,SLC39A9,STT3A,TCTN1,TCTN3,TM9SF2,XRCC5 |
 |
|
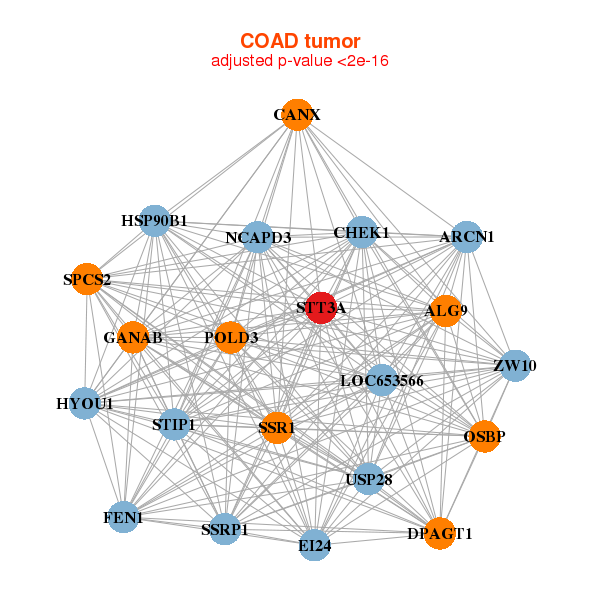
| ALG9,ARCN1,CANX,CHEK1,DPAGT1,EI24,FEN1, GANAB,HSP90B1,HYOU1,LOC653566,NCAPD3,OSBP,POLD3, SPCS2,SSR1,SSRP1,STIP1,STT3A,USP28,ZW10 | ASCC3,ATAD2,BUB1B,CAPRIN1,DPAGT1,DTL,HSP90B1, HYOU1,LMNB1,MESDC2,MTHFD1,PDIA4,RPN2,RRM1, SCFD2,SEC61A1,SND1,SSRP1,STT3A,STT3B,UGGT1 |
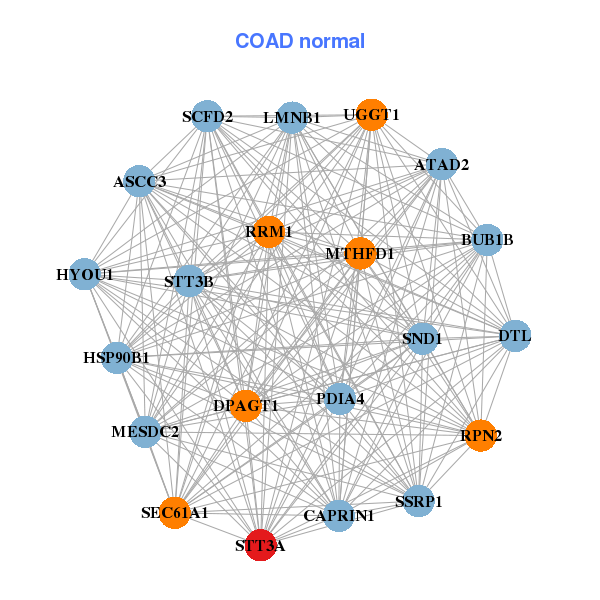
| * Co-Expression network figures were drawn using R package igraph. Only the top 20 genes with the highest correlations were shown. Red circle: input gene, orange circle: cell metabolism gene, sky circle: other gene |
: Open all plots for all cancer types
| Top |
: Open all interacting genes' information including KEGG pathway for all interacting genes from DAVID
| Top |
| Pharmacological Information for STT3A |
| There's no related Drug. |
| Top |
| Cross referenced IDs for STT3A |
| * We obtained these cross-references from Uniprot database. It covers 150 different DBs, 18 categories. http://www.uniprot.org/help/cross_references_section |
: Open all cross reference information
|
Copyright © 2016-Present - The Univsersity of Texas Health Science Center at Houston @ |