|
|||||||||||||||||||||||||||||||||||||||||||||||||||||||||||||||||||||||||||||||||||||||||||||||||||||||||||||||||||||||||||||||||||||||||||||||||||||||||||||||||||||||||||||||||||||||||||||||||||||||||||||||||||||||||||||||||||||||||||||||||||||||||||||||||||||||||||||||||||||||||||||||||||||||||||||||||||||||||||||||||||||||||||||||||||||||||||||||||||||||||||
| |
| Phenotypic Information (metabolism pathway, cancer, disease, phenome) |
| |
| |
| Gene-Gene Network Information: Co-Expression Network, Interacting Genes & KEGG |
| |
|


| Gene Summary for ITPA |
| Basic gene info. | Gene symbol | ITPA |
| Gene name | inosine triphosphatase (nucleoside triphosphate pyrophosphatase) | |
| Synonyms | C20orf37|HLC14-06-P|dJ794I6.3 | |
| Cytomap | UCSC genome browser: 20p | |
| Genomic location | chr20 :3190055-3204506 | |
| Type of gene | protein-coding | |
| RefGenes | NM_001267623.1, NM_033453.3,NM_181493.2,NR_052000.1,NR_052001.1, NR_052002.1, | |
| Ensembl id | ENSG00000125877 | |
| Description | ITPaseNTPaseinosine triphosphatase-Ainosine triphosphate pyrophosphataseinosine triphosphate pyrophosphohydrolasenon-canonical purine NTP pyrophosphatasenon-standard purine NTP pyrophosphatasenucleoside-triphosphate diphosphataseputative oncogene | |
| Modification date | 20141207 | |
| dbXrefs | MIM : 147520 | |
| HGNC : HGNC | ||
| Ensembl : ENSG00000125877 | ||
| HPRD : 08856 | ||
| Vega : OTTHUMG00000031738 | ||
| Protein | UniProt: Q9BY32 go to UniProt's Cross Reference DB Table | |
| Expression | CleanEX: HS_ITPA | |
| BioGPS: 3704 | ||
| Gene Expression Atlas: ENSG00000125877 | ||
| The Human Protein Atlas: ENSG00000125877 | ||
| Pathway | NCI Pathway Interaction Database: ITPA | |
| KEGG: ITPA | ||
| REACTOME: ITPA | ||
| ConsensusPathDB | ||
| Pathway Commons: ITPA | ||
| Metabolism | MetaCyc: ITPA | |
| HUMANCyc: ITPA | ||
| Regulation | Ensembl's Regulation: ENSG00000125877 | |
| miRBase: chr20 :3,190,055-3,204,506 | ||
| TargetScan: NM_001267623 | ||
| cisRED: ENSG00000125877 | ||
| Context | iHOP: ITPA | |
| cancer metabolism search in PubMed: ITPA | ||
| UCL Cancer Institute: ITPA | ||
| Assigned class in ccmGDB | B - This gene belongs to cancer gene. | |
| Top |
| Phenotypic Information for ITPA(metabolism pathway, cancer, disease, phenome) |
| Cancer | CGAP: ITPA |
| Familial Cancer Database: ITPA | |
| * This gene is included in those cancer gene databases. |
|
|
|
|
|
| . | |||||||||||||||||||||||||||||||||||||||||||||||||||||||||||||||||||||||||||||||||||||||||||||||||||||||||||||||||||||||||||||||||||||||||||||||||||||||||||||||||||||||||||||||||||||||||||||||||||||||||||||||||||||||||||||||||||||||||||||||||||||||||||||||||||||||||||||||||||||||||||||||||||||||||||||||||||||||||||||||||||||||||||||||||||||||||||||||||||||
Oncogene 1 | Significant driver gene in | ||||||||||||||||||||||||||||||||||||||||||||||||||||||||||||||||||||||||||||||||||||||||||||||||||||||||||||||||||||||||||||||||||||||||||||||||||||||||||||||||||||||||||||||||||||||||||||||||||||||||||||||||||||||||||||||||||||||||||||||||||||||||||||||||||||||||||||||||||||||||||||||||||||||||||||||||||||||||||||||||||||||||||||||||||||||||||||||||||||||||||
| cf) number; DB name 1 Oncogene; http://nar.oxfordjournals.org/content/35/suppl_1/D721.long, 2 Tumor Suppressor gene; https://bioinfo.uth.edu/TSGene/, 3 Cancer Gene Census; http://www.nature.com/nrc/journal/v4/n3/abs/nrc1299.html, 4 CancerGenes; http://nar.oxfordjournals.org/content/35/suppl_1/D721.long, 5 Network of Cancer Gene; http://ncg.kcl.ac.uk/index.php, 1Therapeutic Vulnerabilities in Cancer; http://cbio.mskcc.org/cancergenomics/statius/ |
| KEGG_PURINE_METABOLISM KEGG_PYRIMIDINE_METABOLISM KEGG_DRUG_METABOLISM_OTHER_ENZYMES | |
| OMIM | 147520; gene. 147520; gene. 613850; phenotype. 613850; phenotype. |
| Orphanet | 284113; Susceptibility to adverse reaction due to mercaptopurine. 284113; Susceptibility to adverse reaction due to mercaptopurine. 319684; Inosine triphosphatase deficiency. 319684; Inosine triphosphatase deficiency. |
| Disease | KEGG Disease: ITPA |
| MedGen: ITPA (Human Medical Genetics with Condition) | |
| ClinVar: ITPA | |
| Phenotype | MGI: ITPA (International Mouse Phenotyping Consortium) |
| PhenomicDB: ITPA | |
| Mutations for ITPA |
| * Under tables are showing count per each tissue to give us broad intuition about tissue specific mutation patterns.You can go to the detailed page for each mutation database's web site. |
| There's no structural variation information in COSMIC data for this gene. |
| * From mRNA Sanger sequences, Chitars2.0 arranged chimeric transcripts. This table shows ITPA related fusion information. |
| ID | Head Gene | Tail Gene | Accession | Gene_a | qStart_a | qEnd_a | Chromosome_a | tStart_a | tEnd_a | Gene_a | qStart_a | qEnd_a | Chromosome_a | tStart_a | tEnd_a |
| BM545059 | ITPA | 184 | 218 | 20 | 3204225 | 3204259 | ITPA | 218 | 656 | 20 | 3190175 | 3199279 | |
| Top |
| Mutation type/ Tissue ID | brca | cns | cerv | endome | haematopo | kidn | Lintest | liver | lung | ns | ovary | pancre | prost | skin | stoma | thyro | urina | |||
| Total # sample | 1 | |||||||||||||||||||
| GAIN (# sample) | 1 | |||||||||||||||||||
| LOSS (# sample) |
| cf) Tissue ID; Tissue type (1; Breast, 2; Central_nervous_system, 3; Cervix, 4; Endometrium, 5; Haematopoietic_and_lymphoid_tissue, 6; Kidney, 7; Large_intestine, 8; Liver, 9; Lung, 10; NS, 11; Ovary, 12; Pancreas, 13; Prostate, 14; Skin, 15; Stomach, 16; Thyroid, 17; Urinary_tract) |
| Top |
|
 |
| Top |
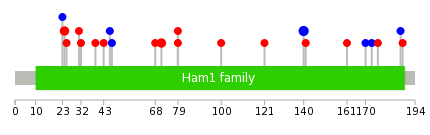
| Stat. for Non-Synonymous SNVs (# total SNVs=16) | (# total SNVs=4) |
 |  |
(# total SNVs=0) | (# total SNVs=0) |
| Top |
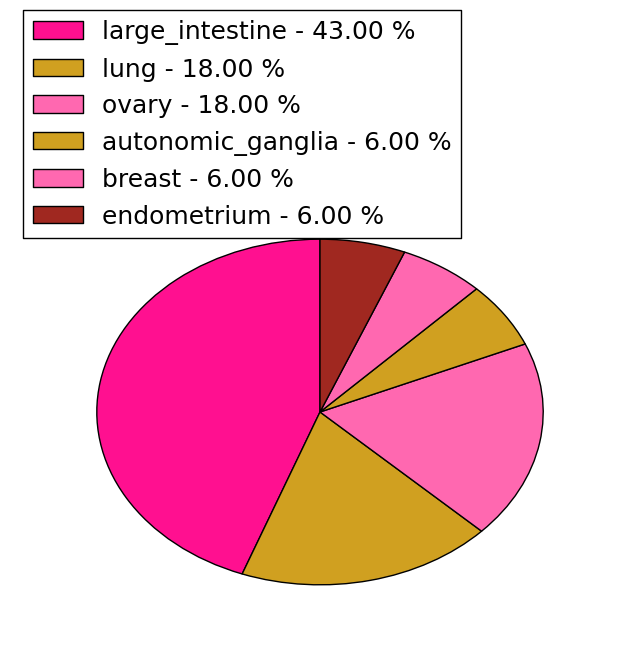
| * When you move the cursor on each content, you can see more deailed mutation information on the Tooltip. Those are primary_site,primary_histology,mutation(aa),pubmedID. |
| GRCh37 position | Mutation(aa) | Unique sampleID count |
| chr20:3202495-3202495 | p.I140I | 3 |
| chr20:3194652-3194652 | p.E71K | 2 |
| chr20:3194676-3194676 | p.A79T | 2 |
| chr20:3193818-3193818 | p.V24I | 2 |
| chr20:3193968-3193968 | p.P43L | 1 |
| chr20:3202556-3202556 | p.E161K | 1 |
| chr20:3193978-3193978 | p.Q46Q | 1 |
| chr20:3204033-3204033 | p.A170A | 1 |
| chr20:3193981-3193981 | p.G47G | 1 |
| chr20:3204042-3204042 | p.N173N | 1 |
| Top |
|
 |
| Point Mutation/ Tissue ID | 1 | 2 | 3 | 4 | 5 | 6 | 7 | 8 | 9 | 10 | 11 | 12 | 13 | 14 | 15 | 16 | 17 | 18 | 19 | 20 |
| # sample | 5 | 2 | 1 | 1 | 3 | 2 | 1 | |||||||||||||
| # mutation | 5 | 2 | 1 | 1 | 2 | 2 | 1 | |||||||||||||
| nonsynonymous SNV | 4 | 2 | 1 | 1 | 1 | |||||||||||||||
| synonymous SNV | 1 | 2 | 2 |
| cf) Tissue ID; Tissue type (1; BLCA[Bladder Urothelial Carcinoma], 2; BRCA[Breast invasive carcinoma], 3; CESC[Cervical squamous cell carcinoma and endocervical adenocarcinoma], 4; COAD[Colon adenocarcinoma], 5; GBM[Glioblastoma multiforme], 6; Glioma Low Grade, 7; HNSC[Head and Neck squamous cell carcinoma], 8; KICH[Kidney Chromophobe], 9; KIRC[Kidney renal clear cell carcinoma], 10; KIRP[Kidney renal papillary cell carcinoma], 11; LAML[Acute Myeloid Leukemia], 12; LUAD[Lung adenocarcinoma], 13; LUSC[Lung squamous cell carcinoma], 14; OV[Ovarian serous cystadenocarcinoma ], 15; PAAD[Pancreatic adenocarcinoma], 16; PRAD[Prostate adenocarcinoma], 17; SKCM[Skin Cutaneous Melanoma], 18:STAD[Stomach adenocarcinoma], 19:THCA[Thyroid carcinoma], 20:UCEC[Uterine Corpus Endometrial Carcinoma]) |
| Top |
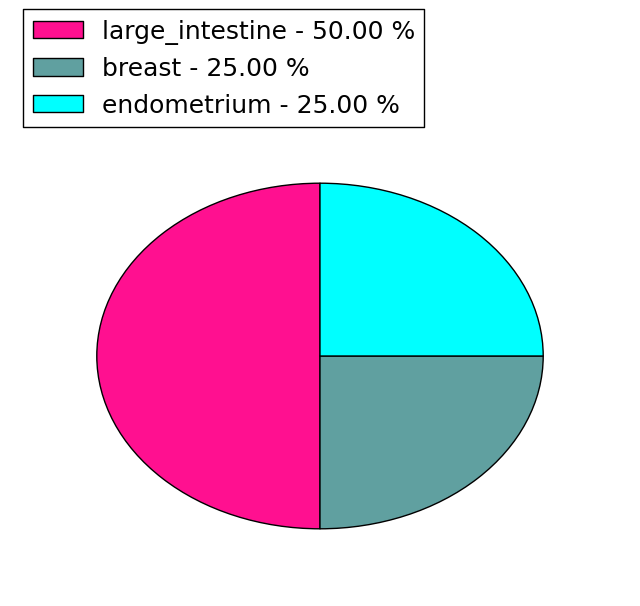
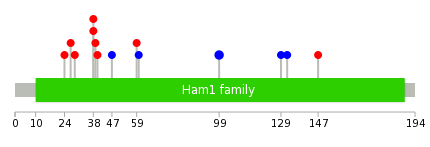
| * We represented just top 10 SNVs. When you move the cursor on each content, you can see more deailed mutation information on the Tooltip. Those are primary_site, primary_histology, mutation(aa), pubmedID. |
| Genomic Position | Mutation(aa) | Unique sampleID count |
| chr20:3194676 | p.A38T,ITPA | 2 |
| chr20:3202495 | p.I99I,ITPA | 2 |
| chr20:3199166 | p.V24I,ITPA | 1 |
| chr20:3199170 | p.K39N,ITPA | 1 |
| chr20:3204033 | p.I40M,ITPA | 1 |
| chr20:3193818 | p.G47G,ITPA | 1 |
| chr20:3204042 | p.V27M,ITPA | 1 |
| chr20:3193865 | p.V29F,ITPA | 1 |
| chr20:3204085 | p.L59R,ITPA | 1 |
| chr20:3193868 | p.H60H,ITPA | 1 |
| * Copy number data were extracted from TCGA using R package TCGA-Assembler. The URLs of all public data files on TCGA DCC data server were gathered on Jan-05-2015. Function ProcessCNAData in TCGA-Assembler package was used to obtain gene-level copy number value which is calculated as the average copy number of the genomic region of a gene. |
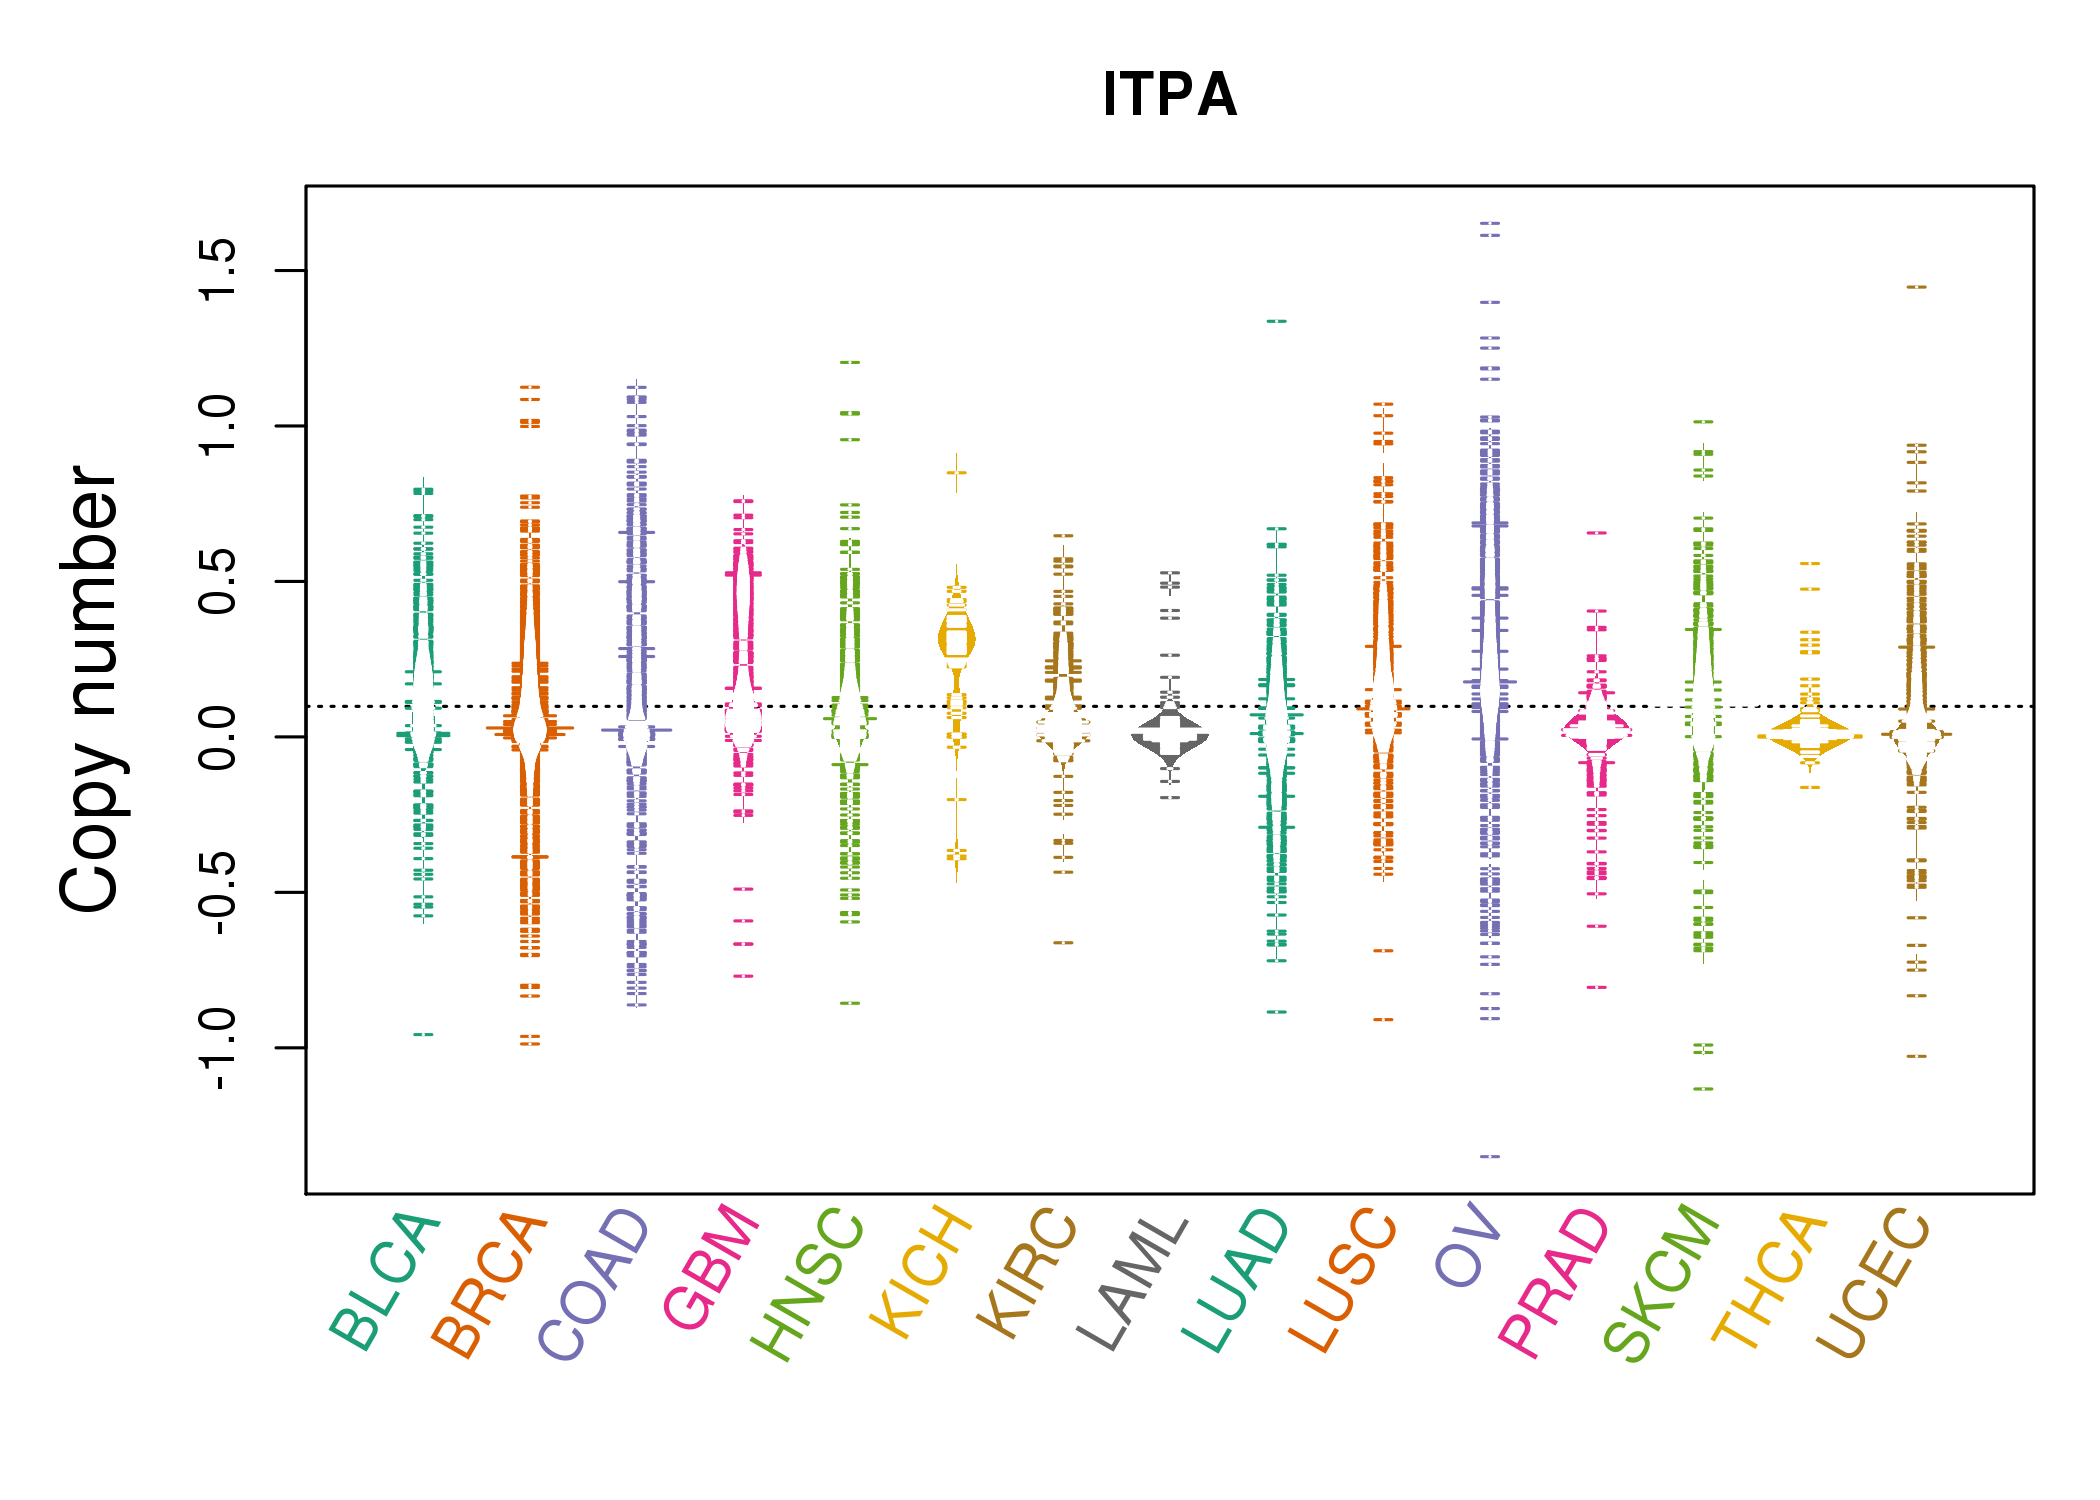 |
| cf) Tissue ID[Tissue type]: BLCA[Bladder Urothelial Carcinoma], BRCA[Breast invasive carcinoma], CESC[Cervical squamous cell carcinoma and endocervical adenocarcinoma], COAD[Colon adenocarcinoma], GBM[Glioblastoma multiforme], Glioma Low Grade, HNSC[Head and Neck squamous cell carcinoma], KICH[Kidney Chromophobe], KIRC[Kidney renal clear cell carcinoma], KIRP[Kidney renal papillary cell carcinoma], LAML[Acute Myeloid Leukemia], LUAD[Lung adenocarcinoma], LUSC[Lung squamous cell carcinoma], OV[Ovarian serous cystadenocarcinoma ], PAAD[Pancreatic adenocarcinoma], PRAD[Prostate adenocarcinoma], SKCM[Skin Cutaneous Melanoma], STAD[Stomach adenocarcinoma], THCA[Thyroid carcinoma], UCEC[Uterine Corpus Endometrial Carcinoma] |
| Top |
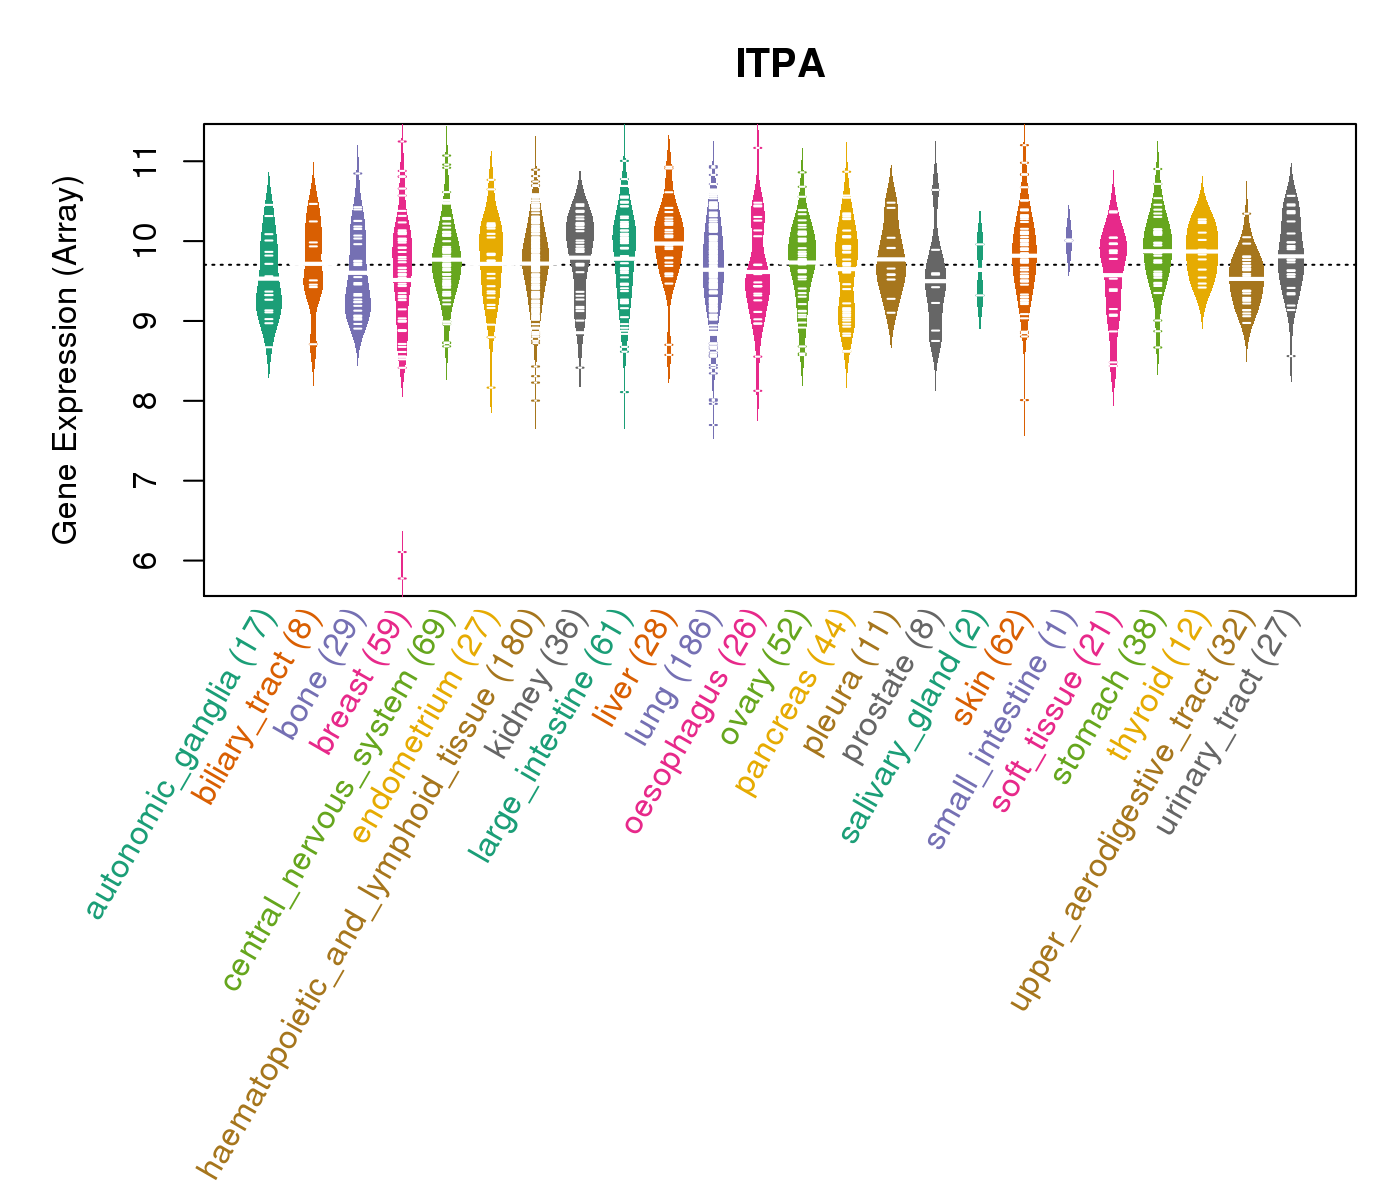
| Gene Expression for ITPA |
| * CCLE gene expression data were extracted from CCLE_Expression_Entrez_2012-10-18.res: Gene-centric RMA-normalized mRNA expression data. |
 |
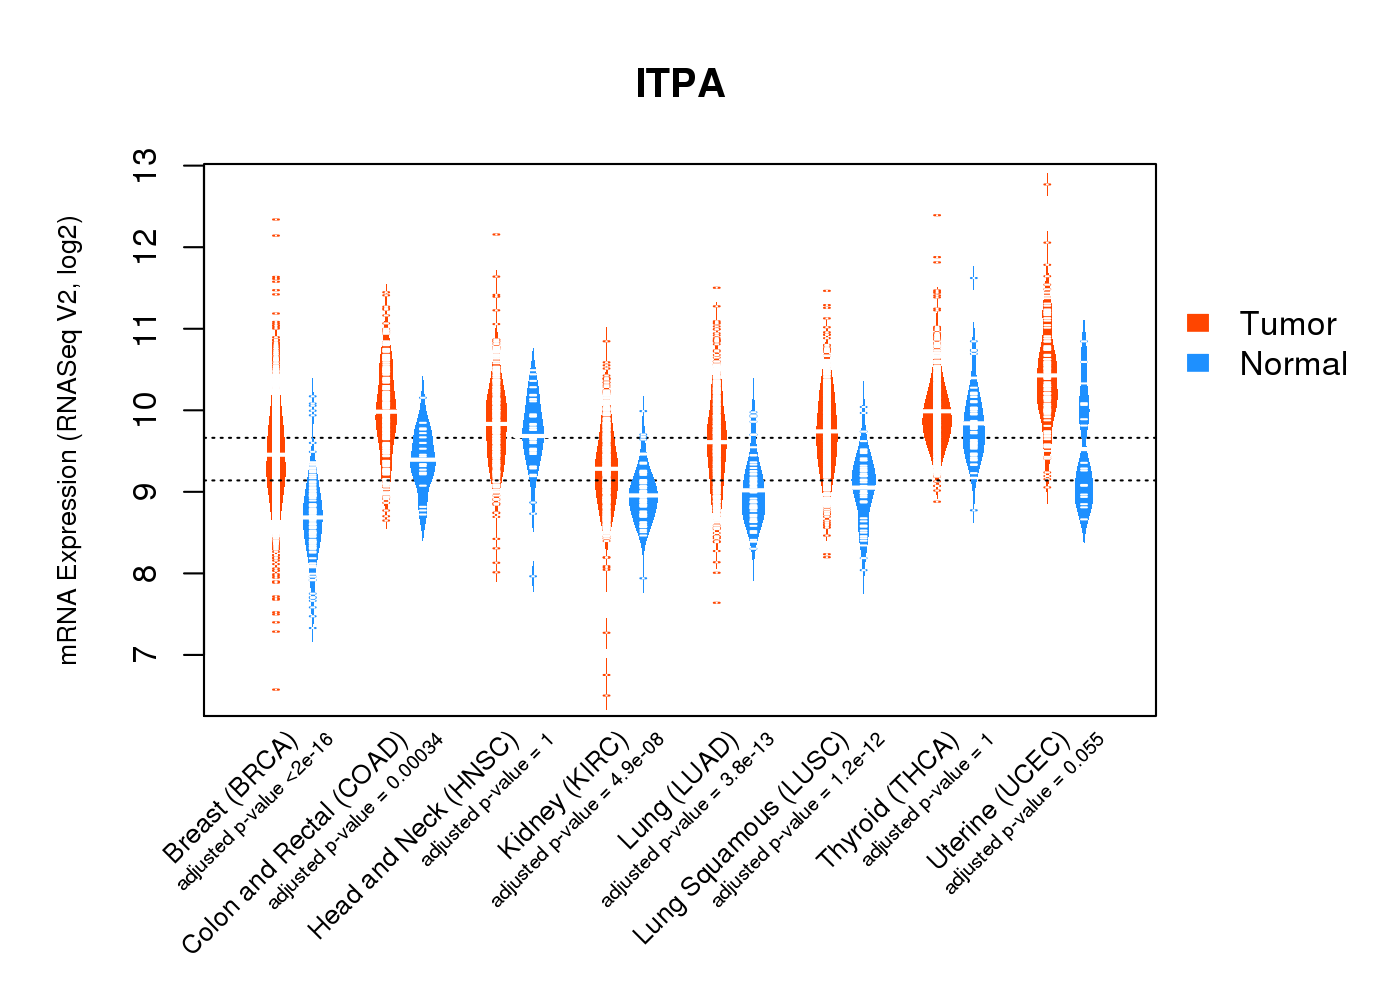
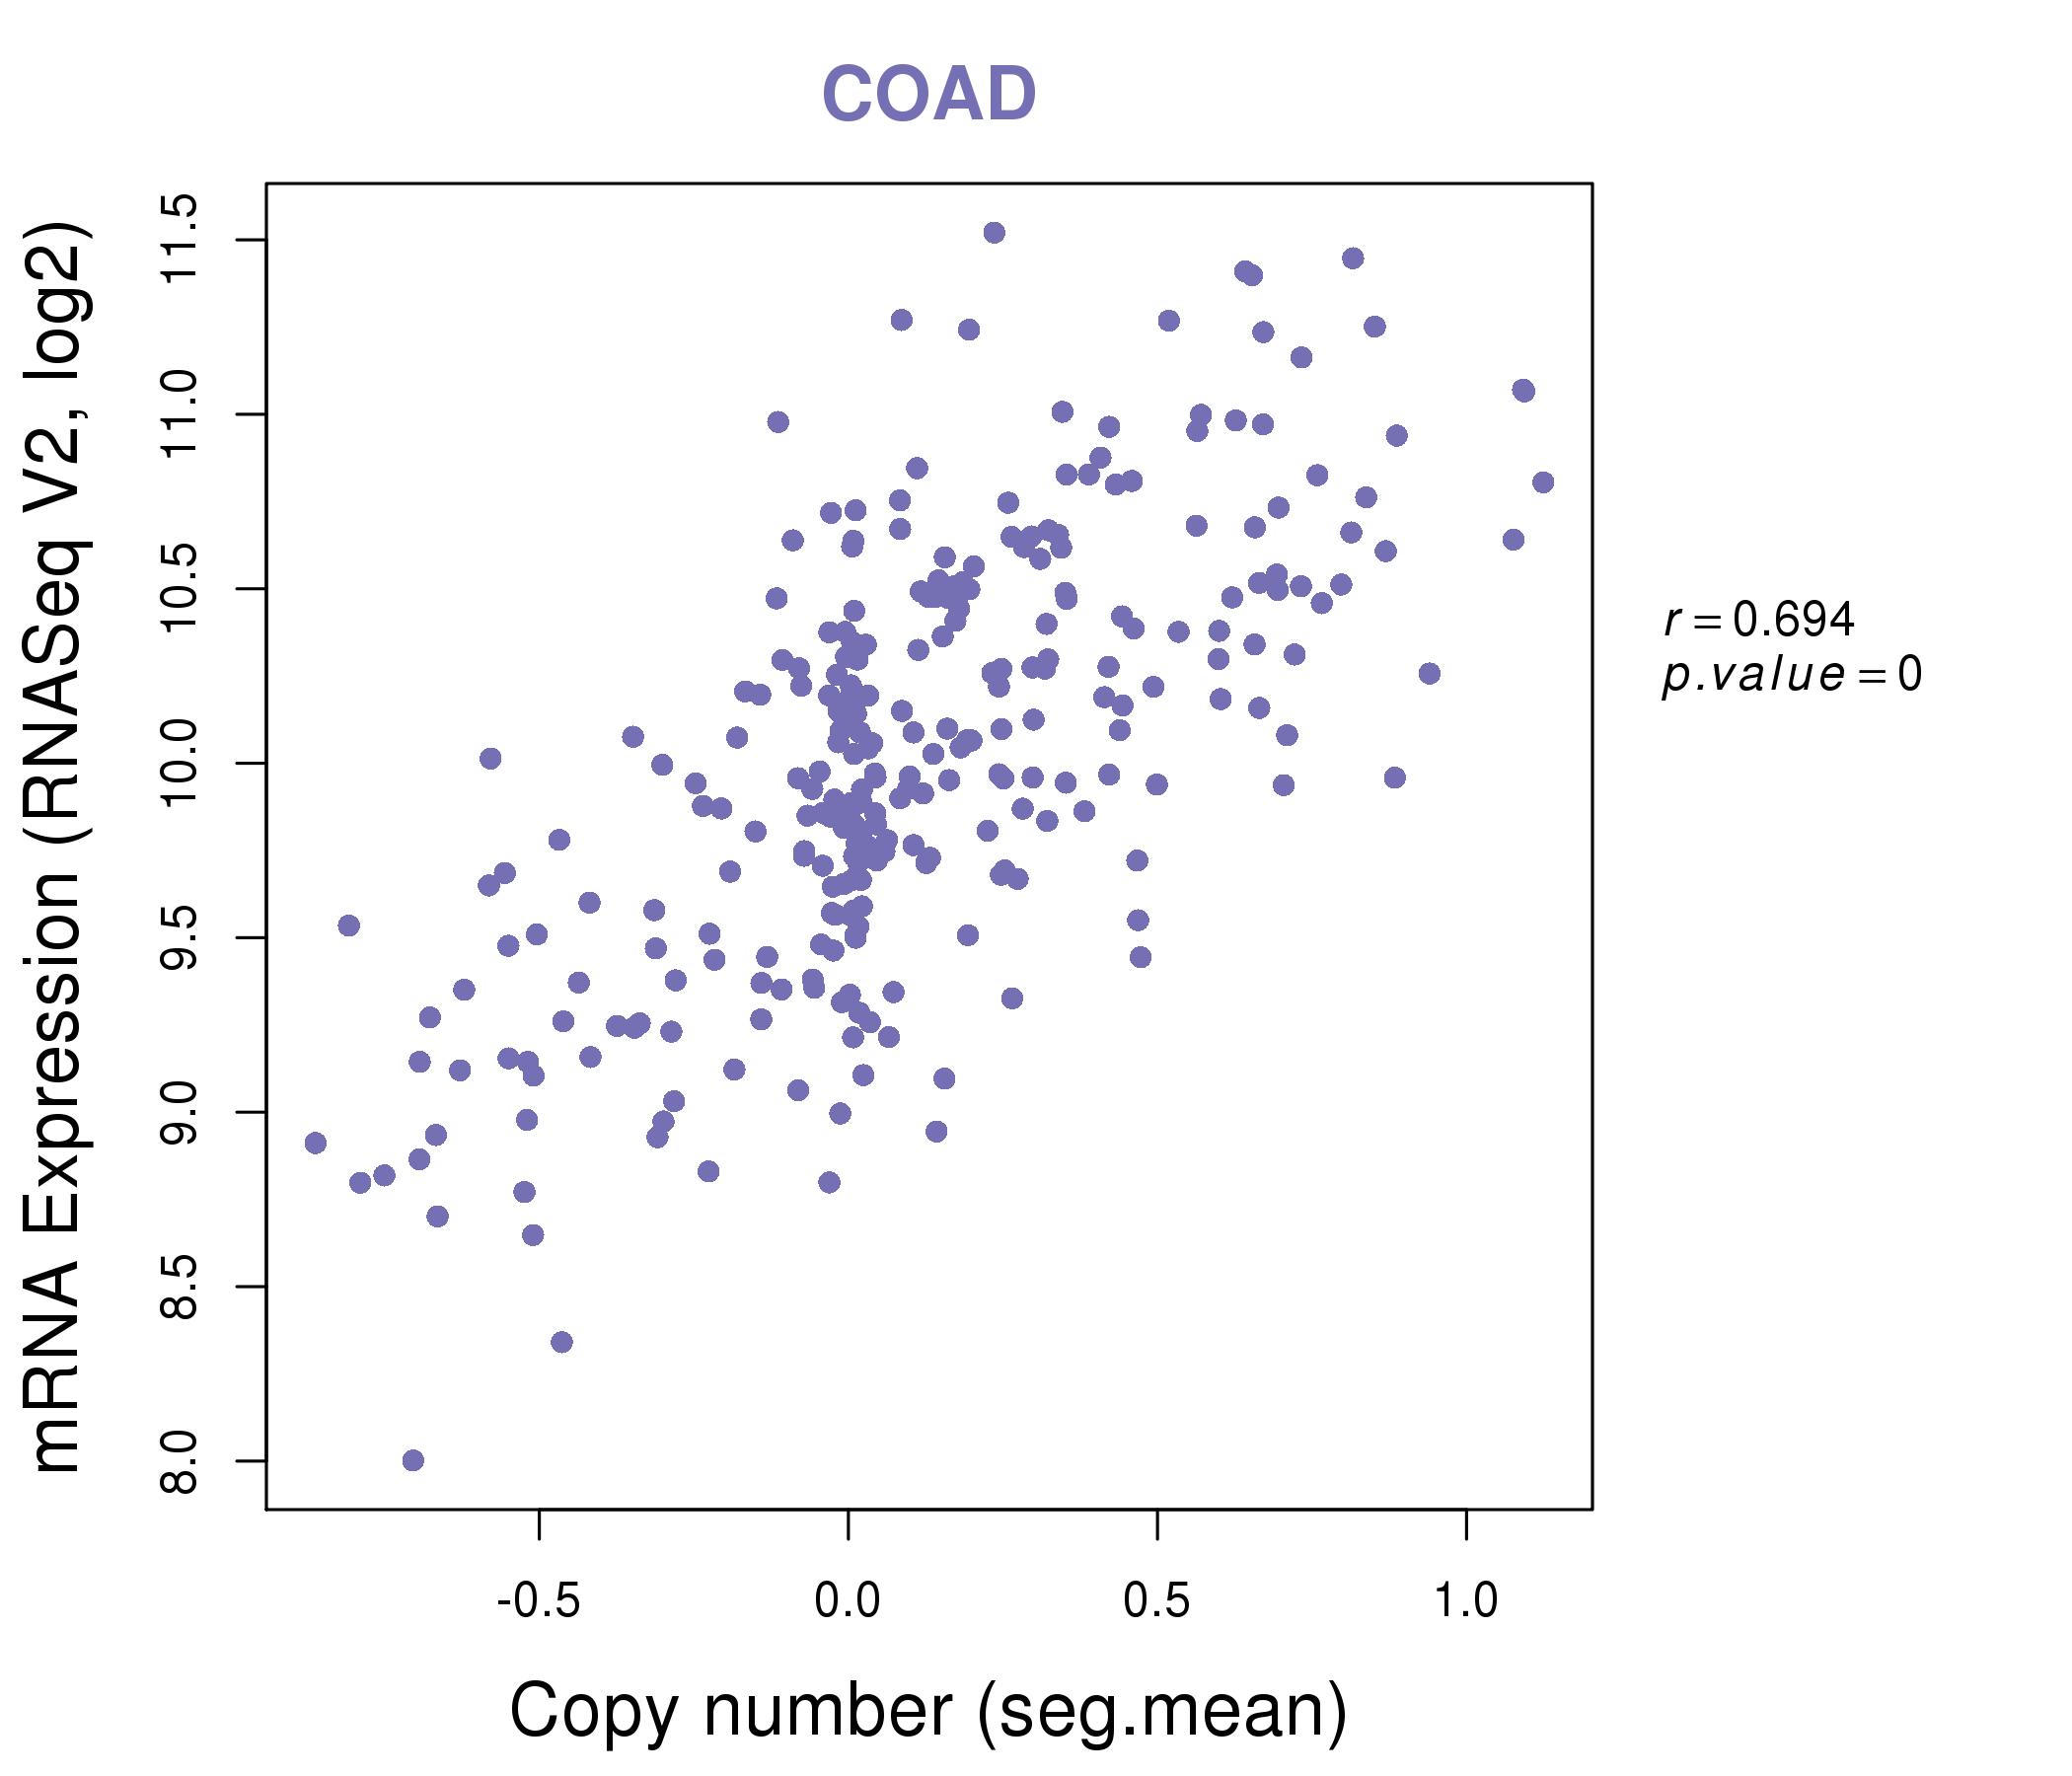
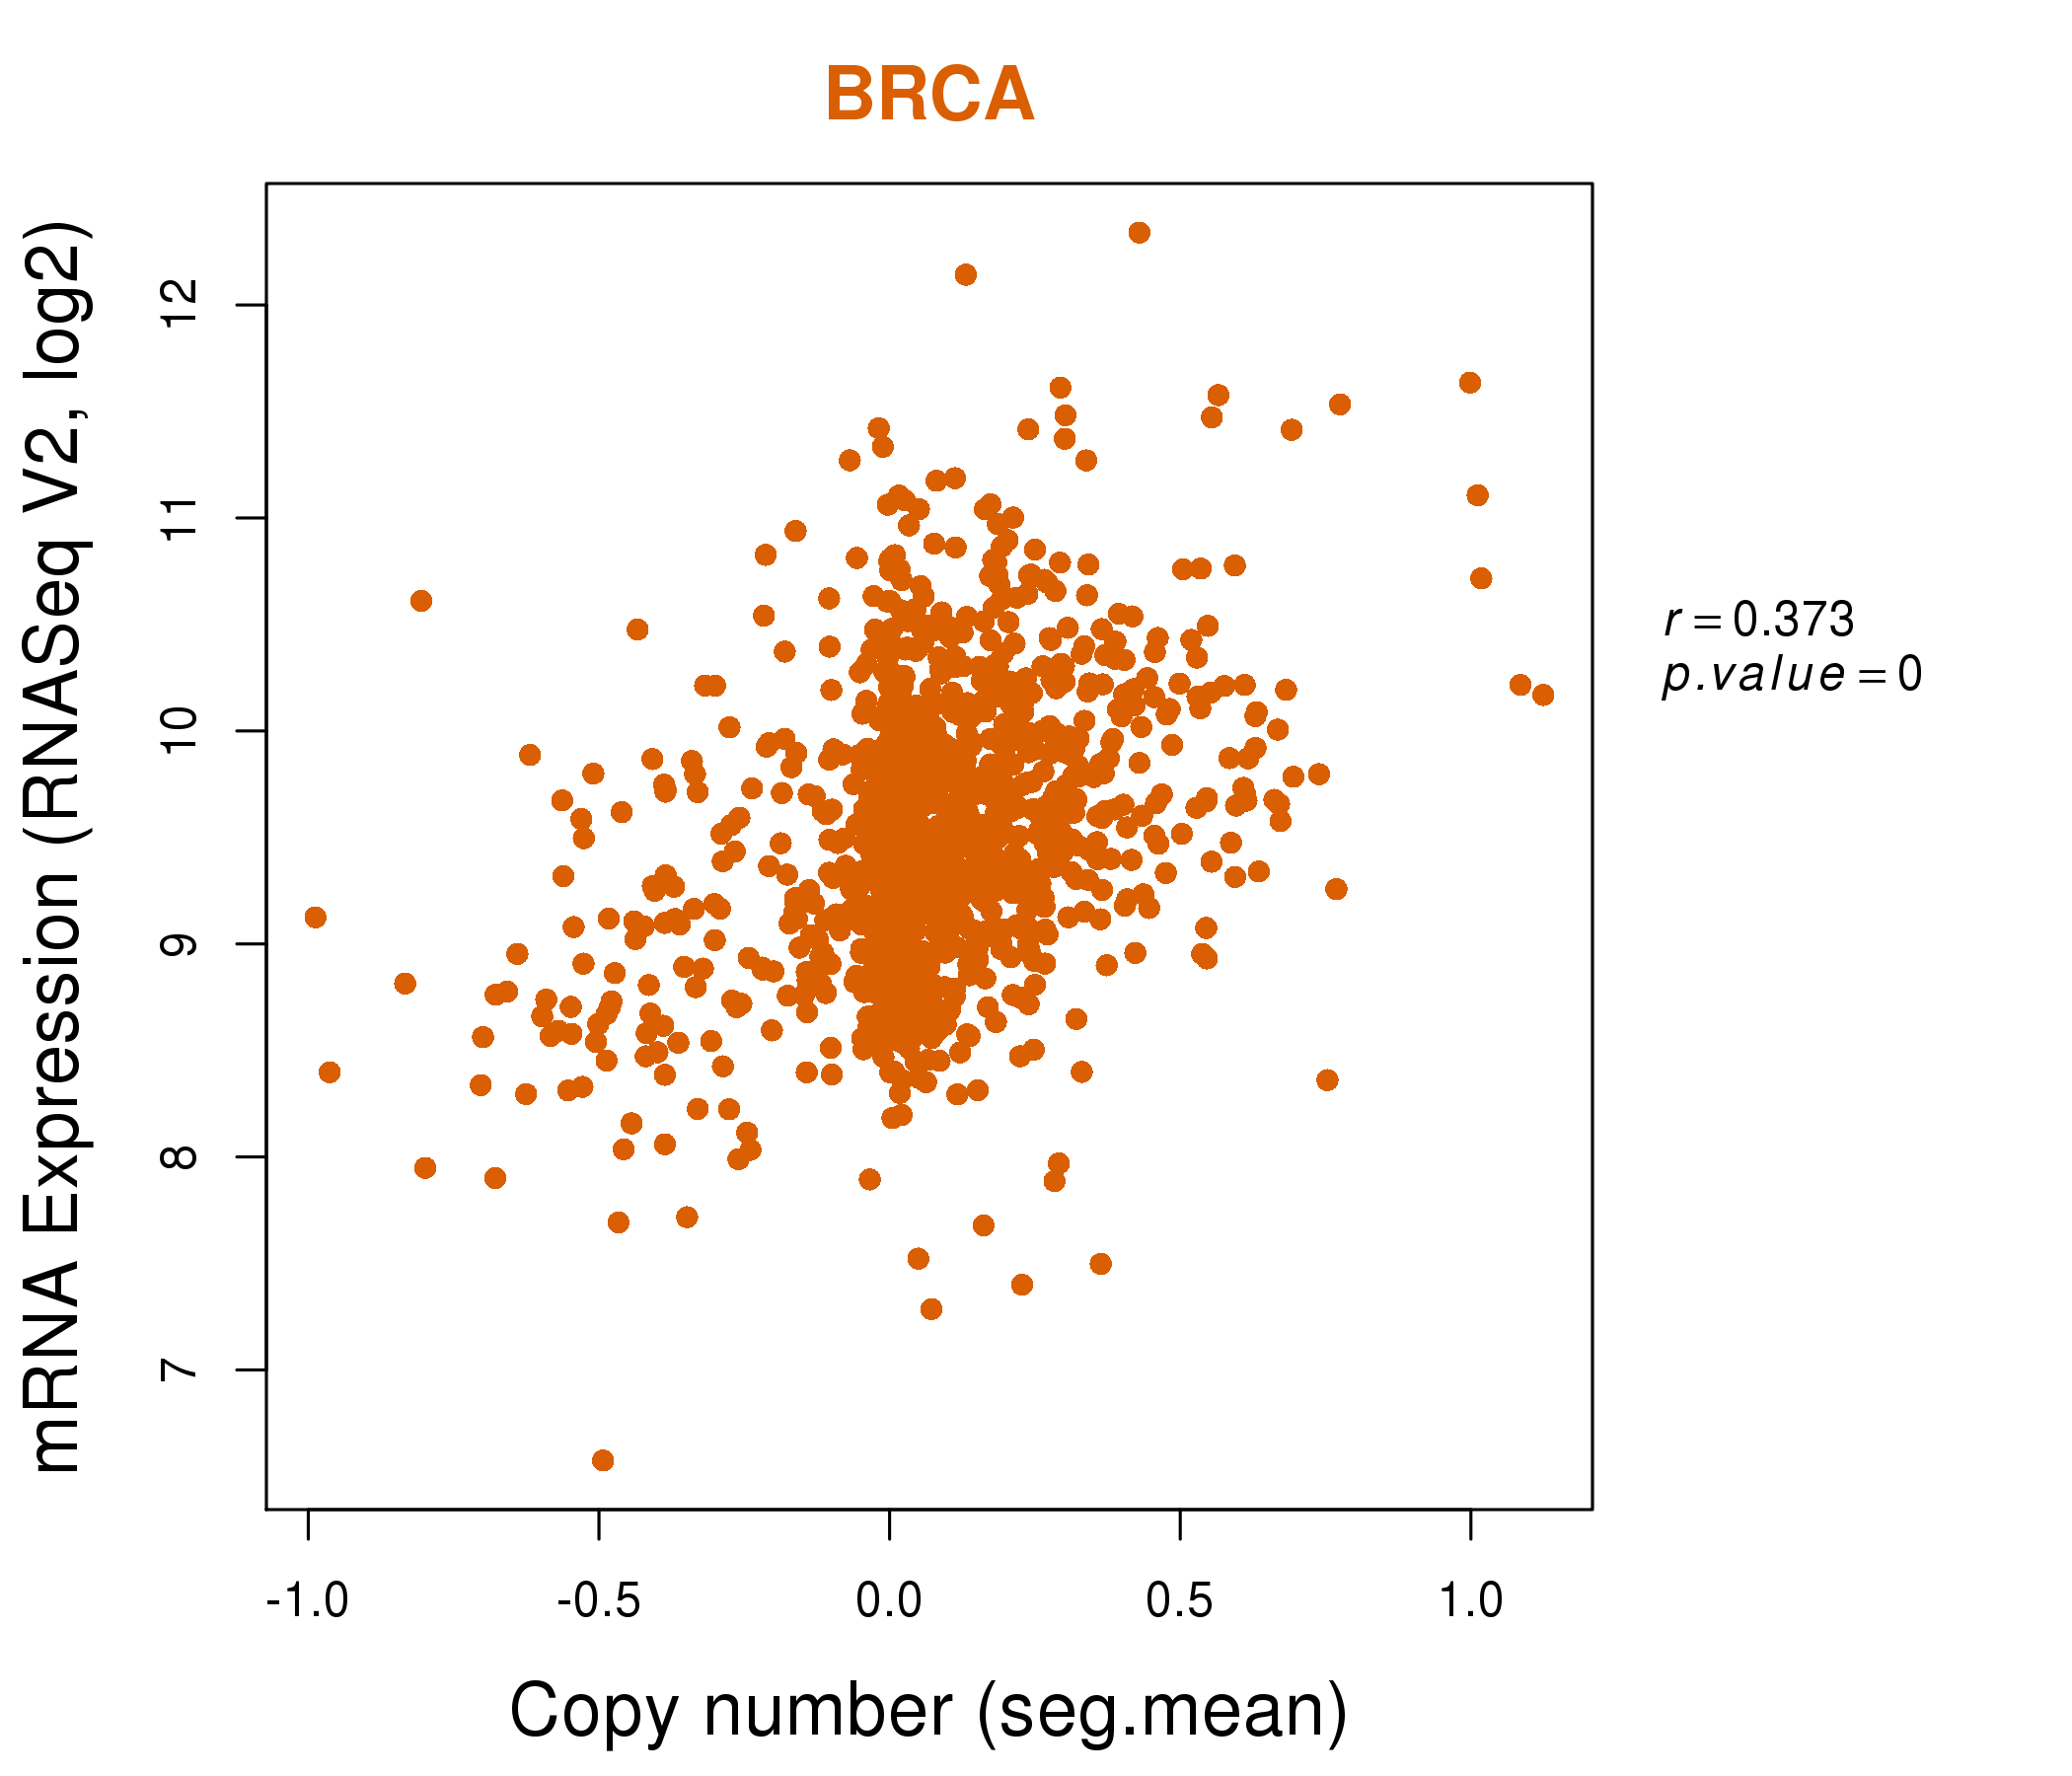
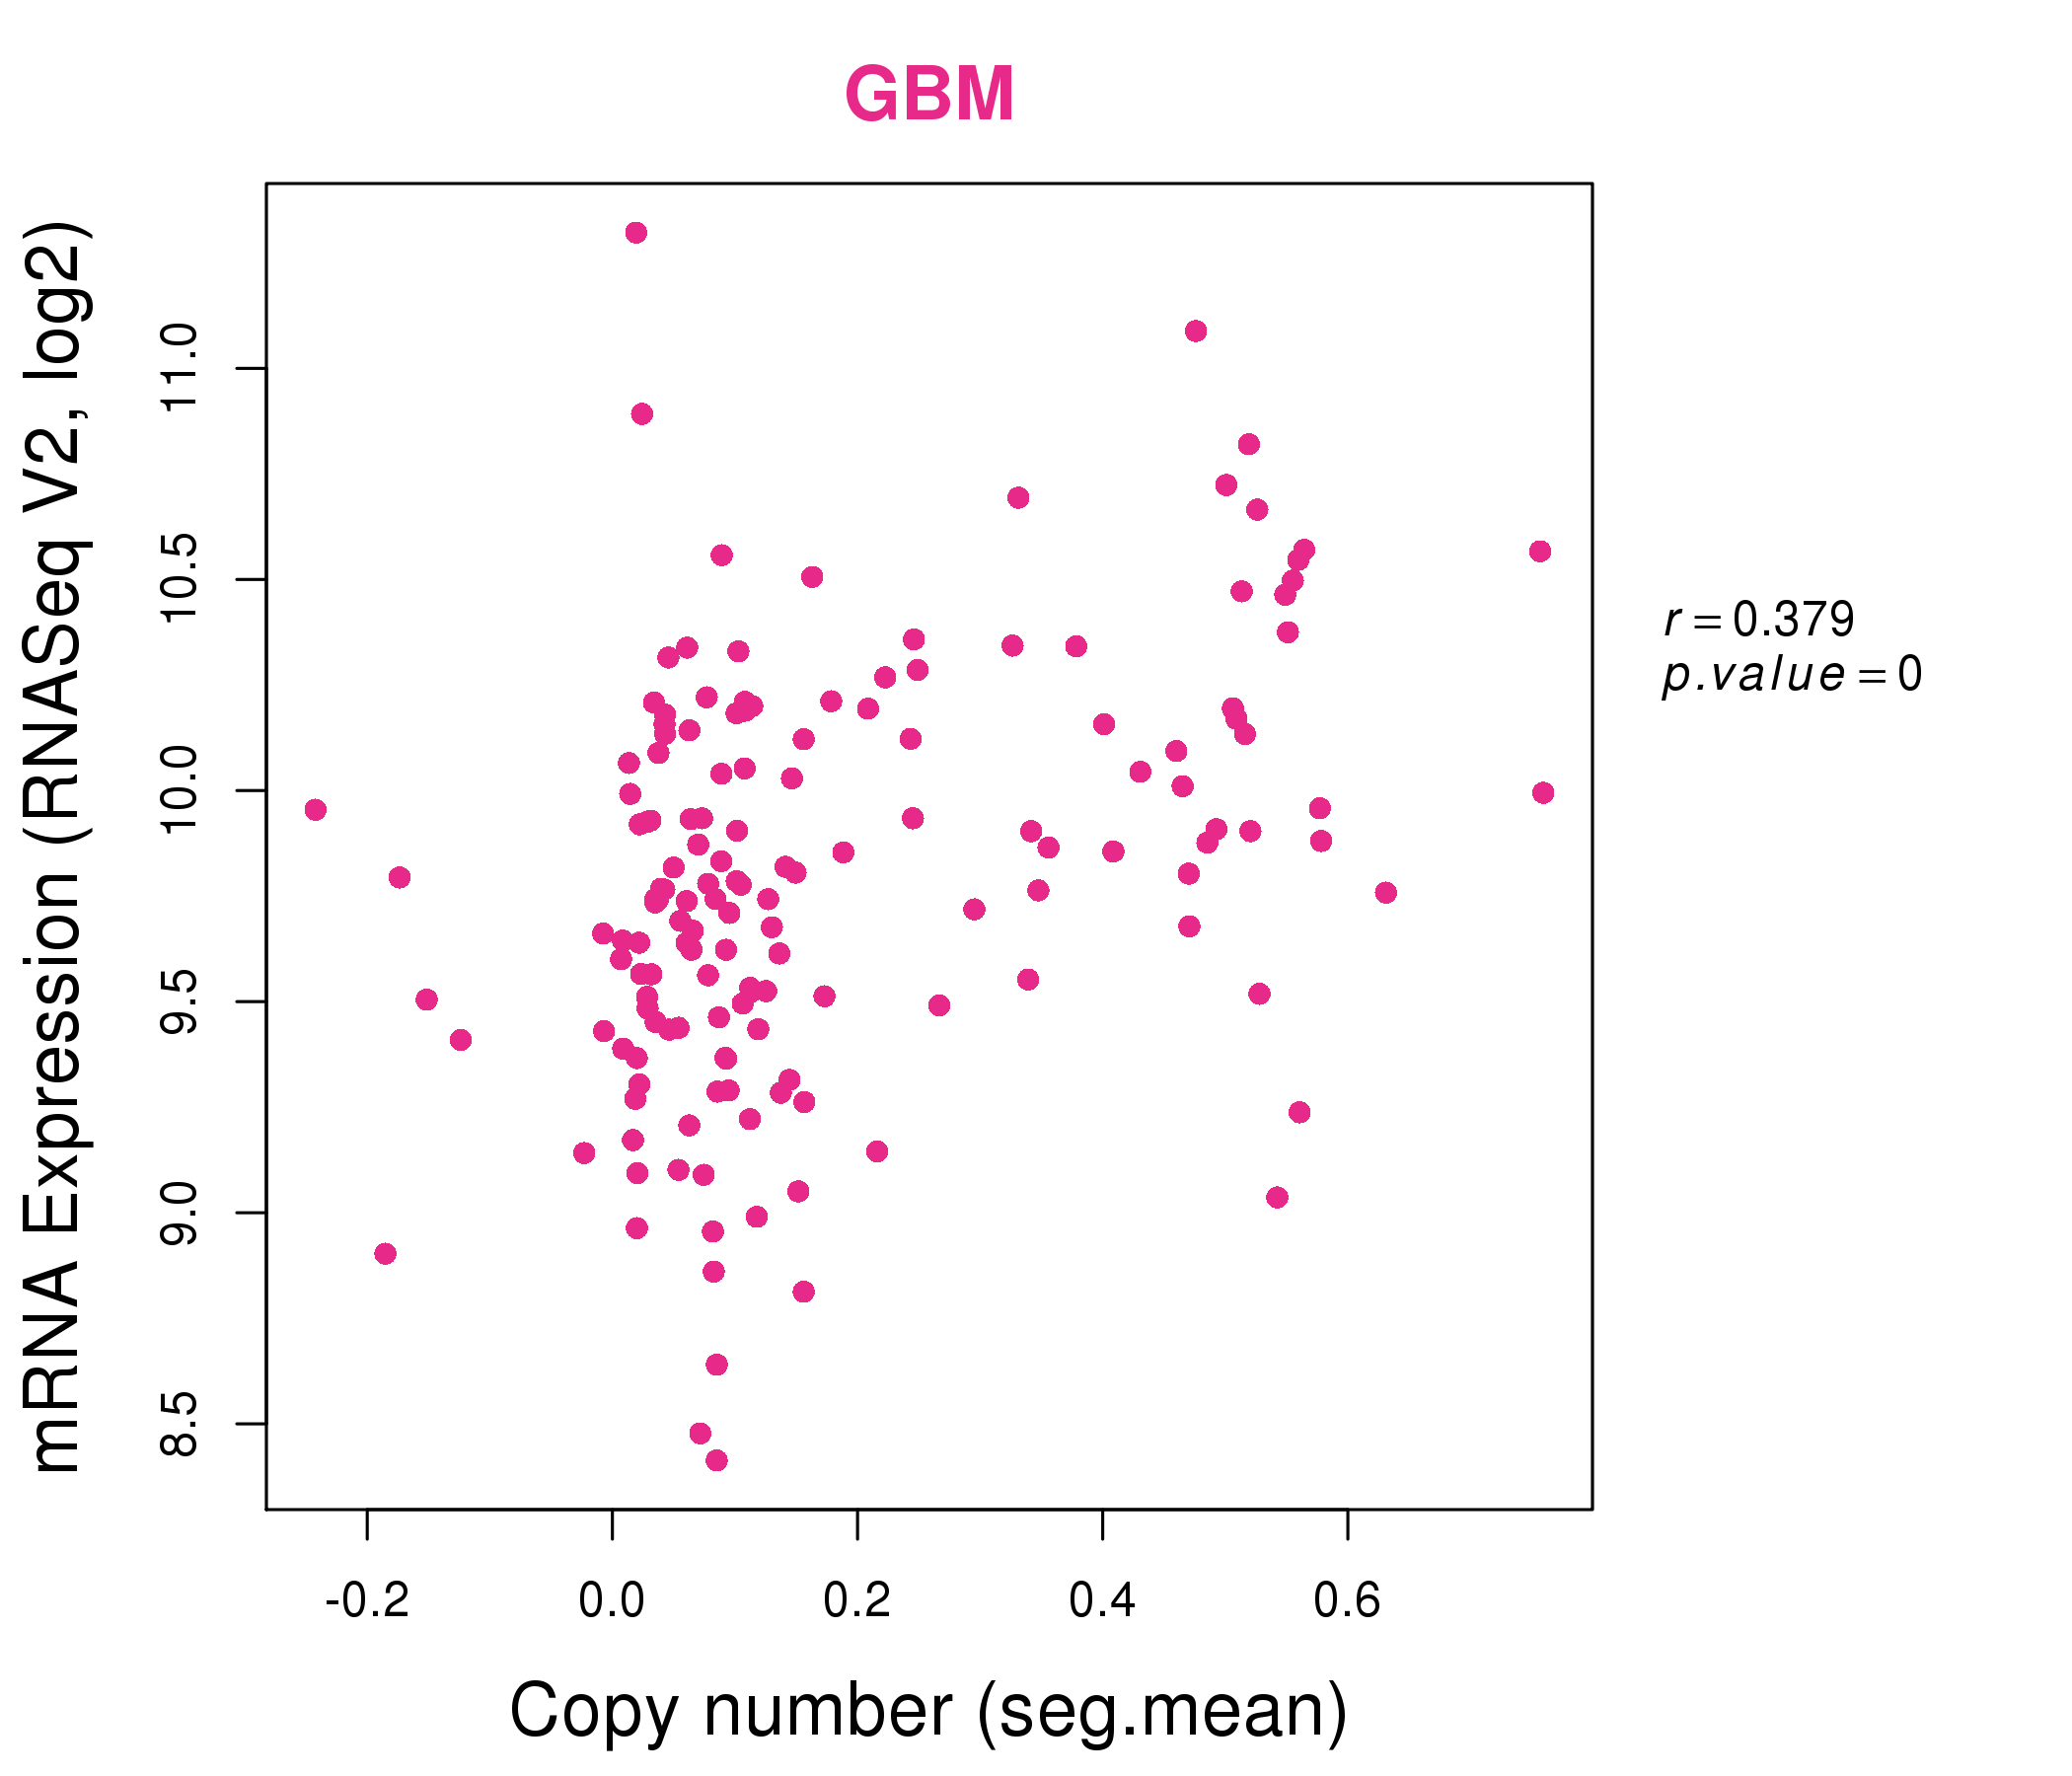
| * Normalized gene expression data of RNASeqV2 was extracted from TCGA using R package TCGA-Assembler. The URLs of all public data files on TCGA DCC data server were gathered at Jan-05-2015. Only eight cancer types have enough normal control samples for differential expression analysis. (t test, adjusted p<0.05 (using Benjamini-Hochberg FDR)) |
 |
| Top |
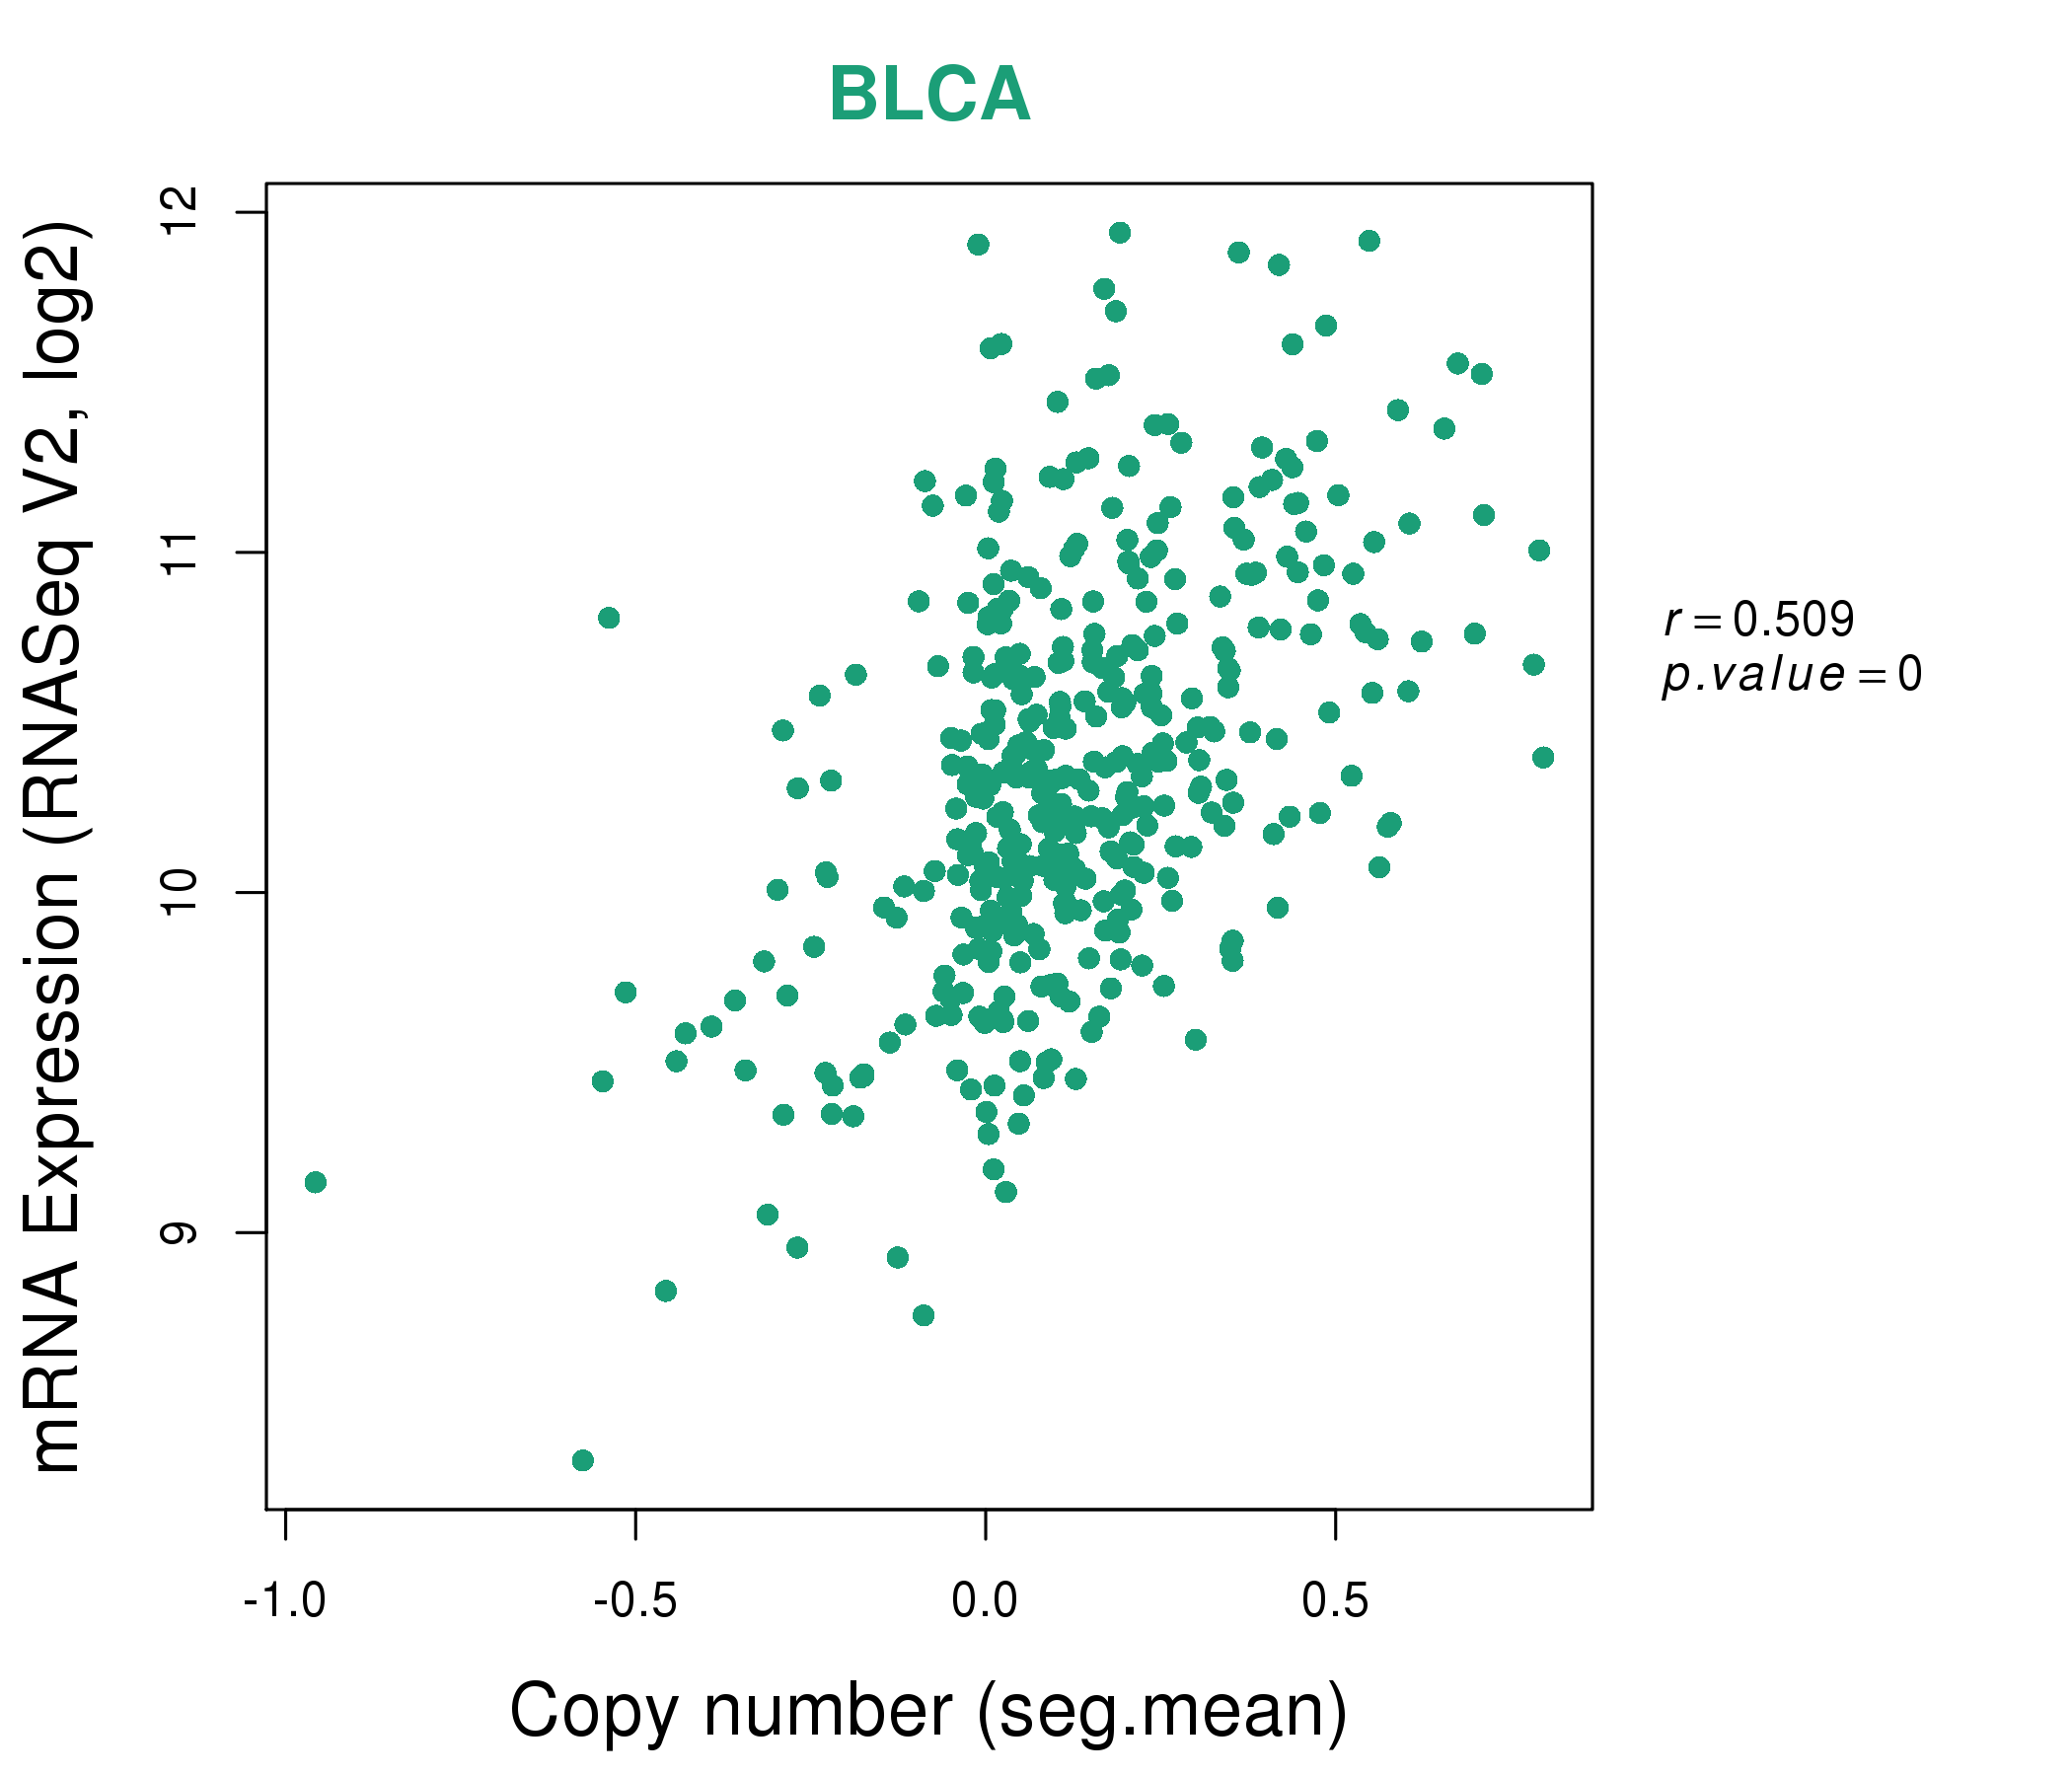
| * This plots show the correlation between CNV and gene expression. |
: Open all plots for all cancer types
 |
|
 |
|
| Top |
| Gene-Gene Network Information |
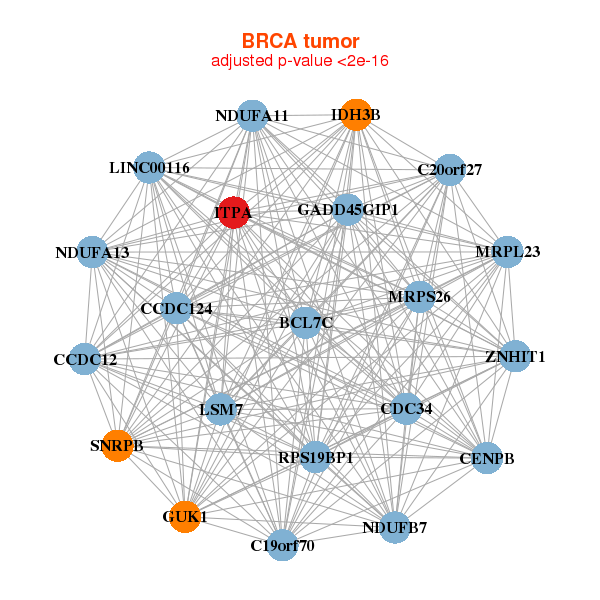
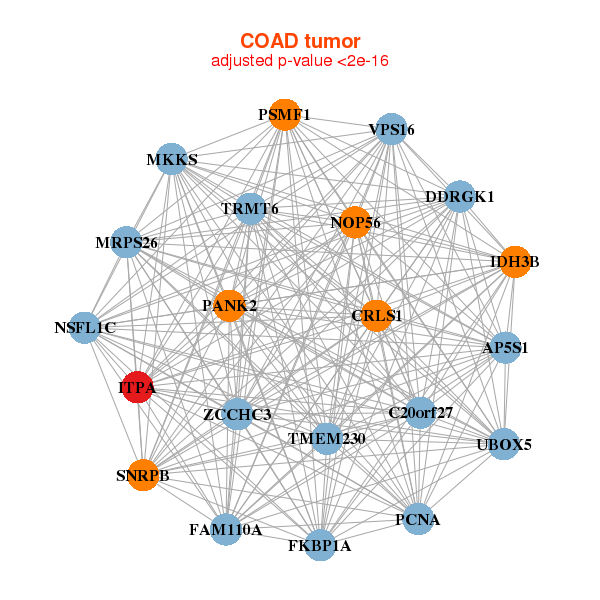
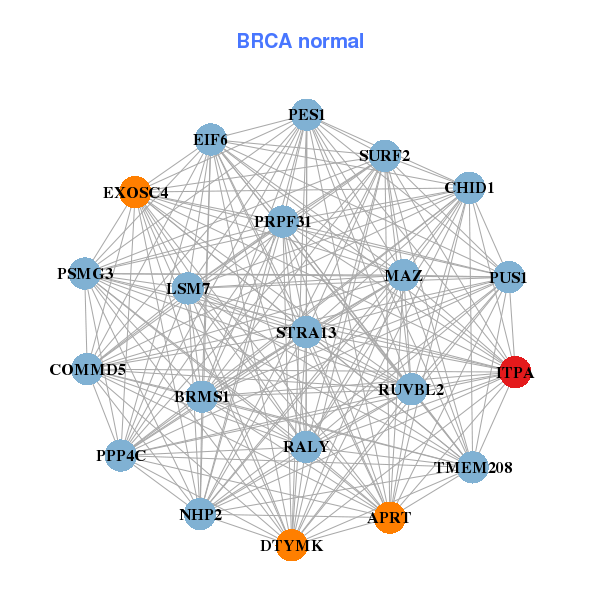
| * Co-Expression network figures were drawn using R package igraph. Only the top 20 genes with the highest correlations were shown. Red circle: input gene, orange circle: cell metabolism gene, sky circle: other gene |
: Open all plots for all cancer types
 |
| ||||
| BCL7C,C19orf70,C20orf27,CCDC12,CCDC124,CDC34,CENPB, GADD45GIP1,GUK1,IDH3B,ITPA,LSM7,MRPL23,MRPS26, LINC00116,NDUFA11,NDUFA13,NDUFB7,RPS19BP1,SNRPB,ZNHIT1 | APRT,BRMS1,CHID1,COMMD5,DTYMK,EIF6,EXOSC4, ITPA,LSM7,MAZ,NHP2,PES1,PPP4C,PRPF31, PSMG3,PUS1,RALY,RUVBL2,STRA13,SURF2,TMEM208 | ||||
 |
| ||||
| C20orf27,AP5S1,TMEM230,CRLS1,DDRGK1,FAM110A,FKBP1A, IDH3B,ITPA,MKKS,MRPS26,NOP56,NSFL1C,PANK2, PCNA,PSMF1,SNRPB,TRMT6,UBOX5,VPS16,ZCCHC3 | ABT1,AHCY,APTX,BID,C16orf91,CDC123,COA4, CYC1,DCTPP1,ITPA,LSM7,MRPS12,MTFP1,POP5, PSMG3,SF3B5,SNRPB,TARBP2,TIMM13,PAM16,TMX2 |
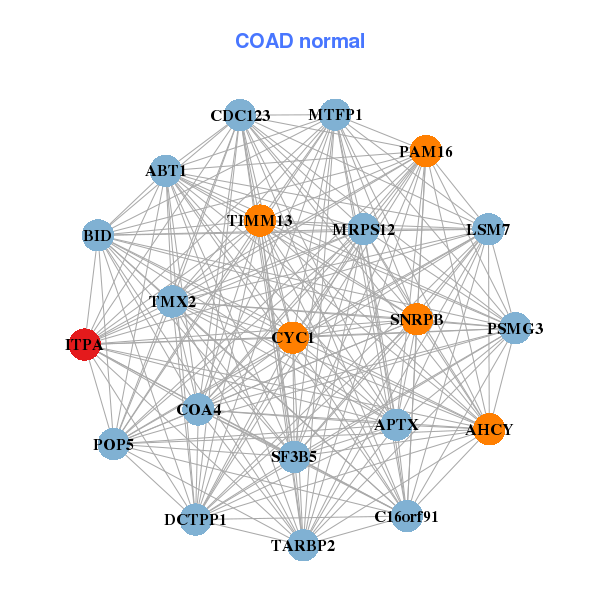
| * Co-Expression network figures were drawn using R package igraph. Only the top 20 genes with the highest correlations were shown. Red circle: input gene, orange circle: cell metabolism gene, sky circle: other gene |
: Open all plots for all cancer types
| Top |
: Open all interacting genes' information including KEGG pathway for all interacting genes from DAVID
| Top |
| Pharmacological Information for ITPA |
| DB Category | DB Name | DB's ID and Url link |
| Organism-specific databases | PharmGKB | PA29973; -. |
| Organism-specific databases | PharmGKB | PA29973; -. |
| Organism-specific databases | CTD | 3704; -. |
| Organism-specific databases | CTD | 3704; -. |
| * Gene Centered Interaction Network. |
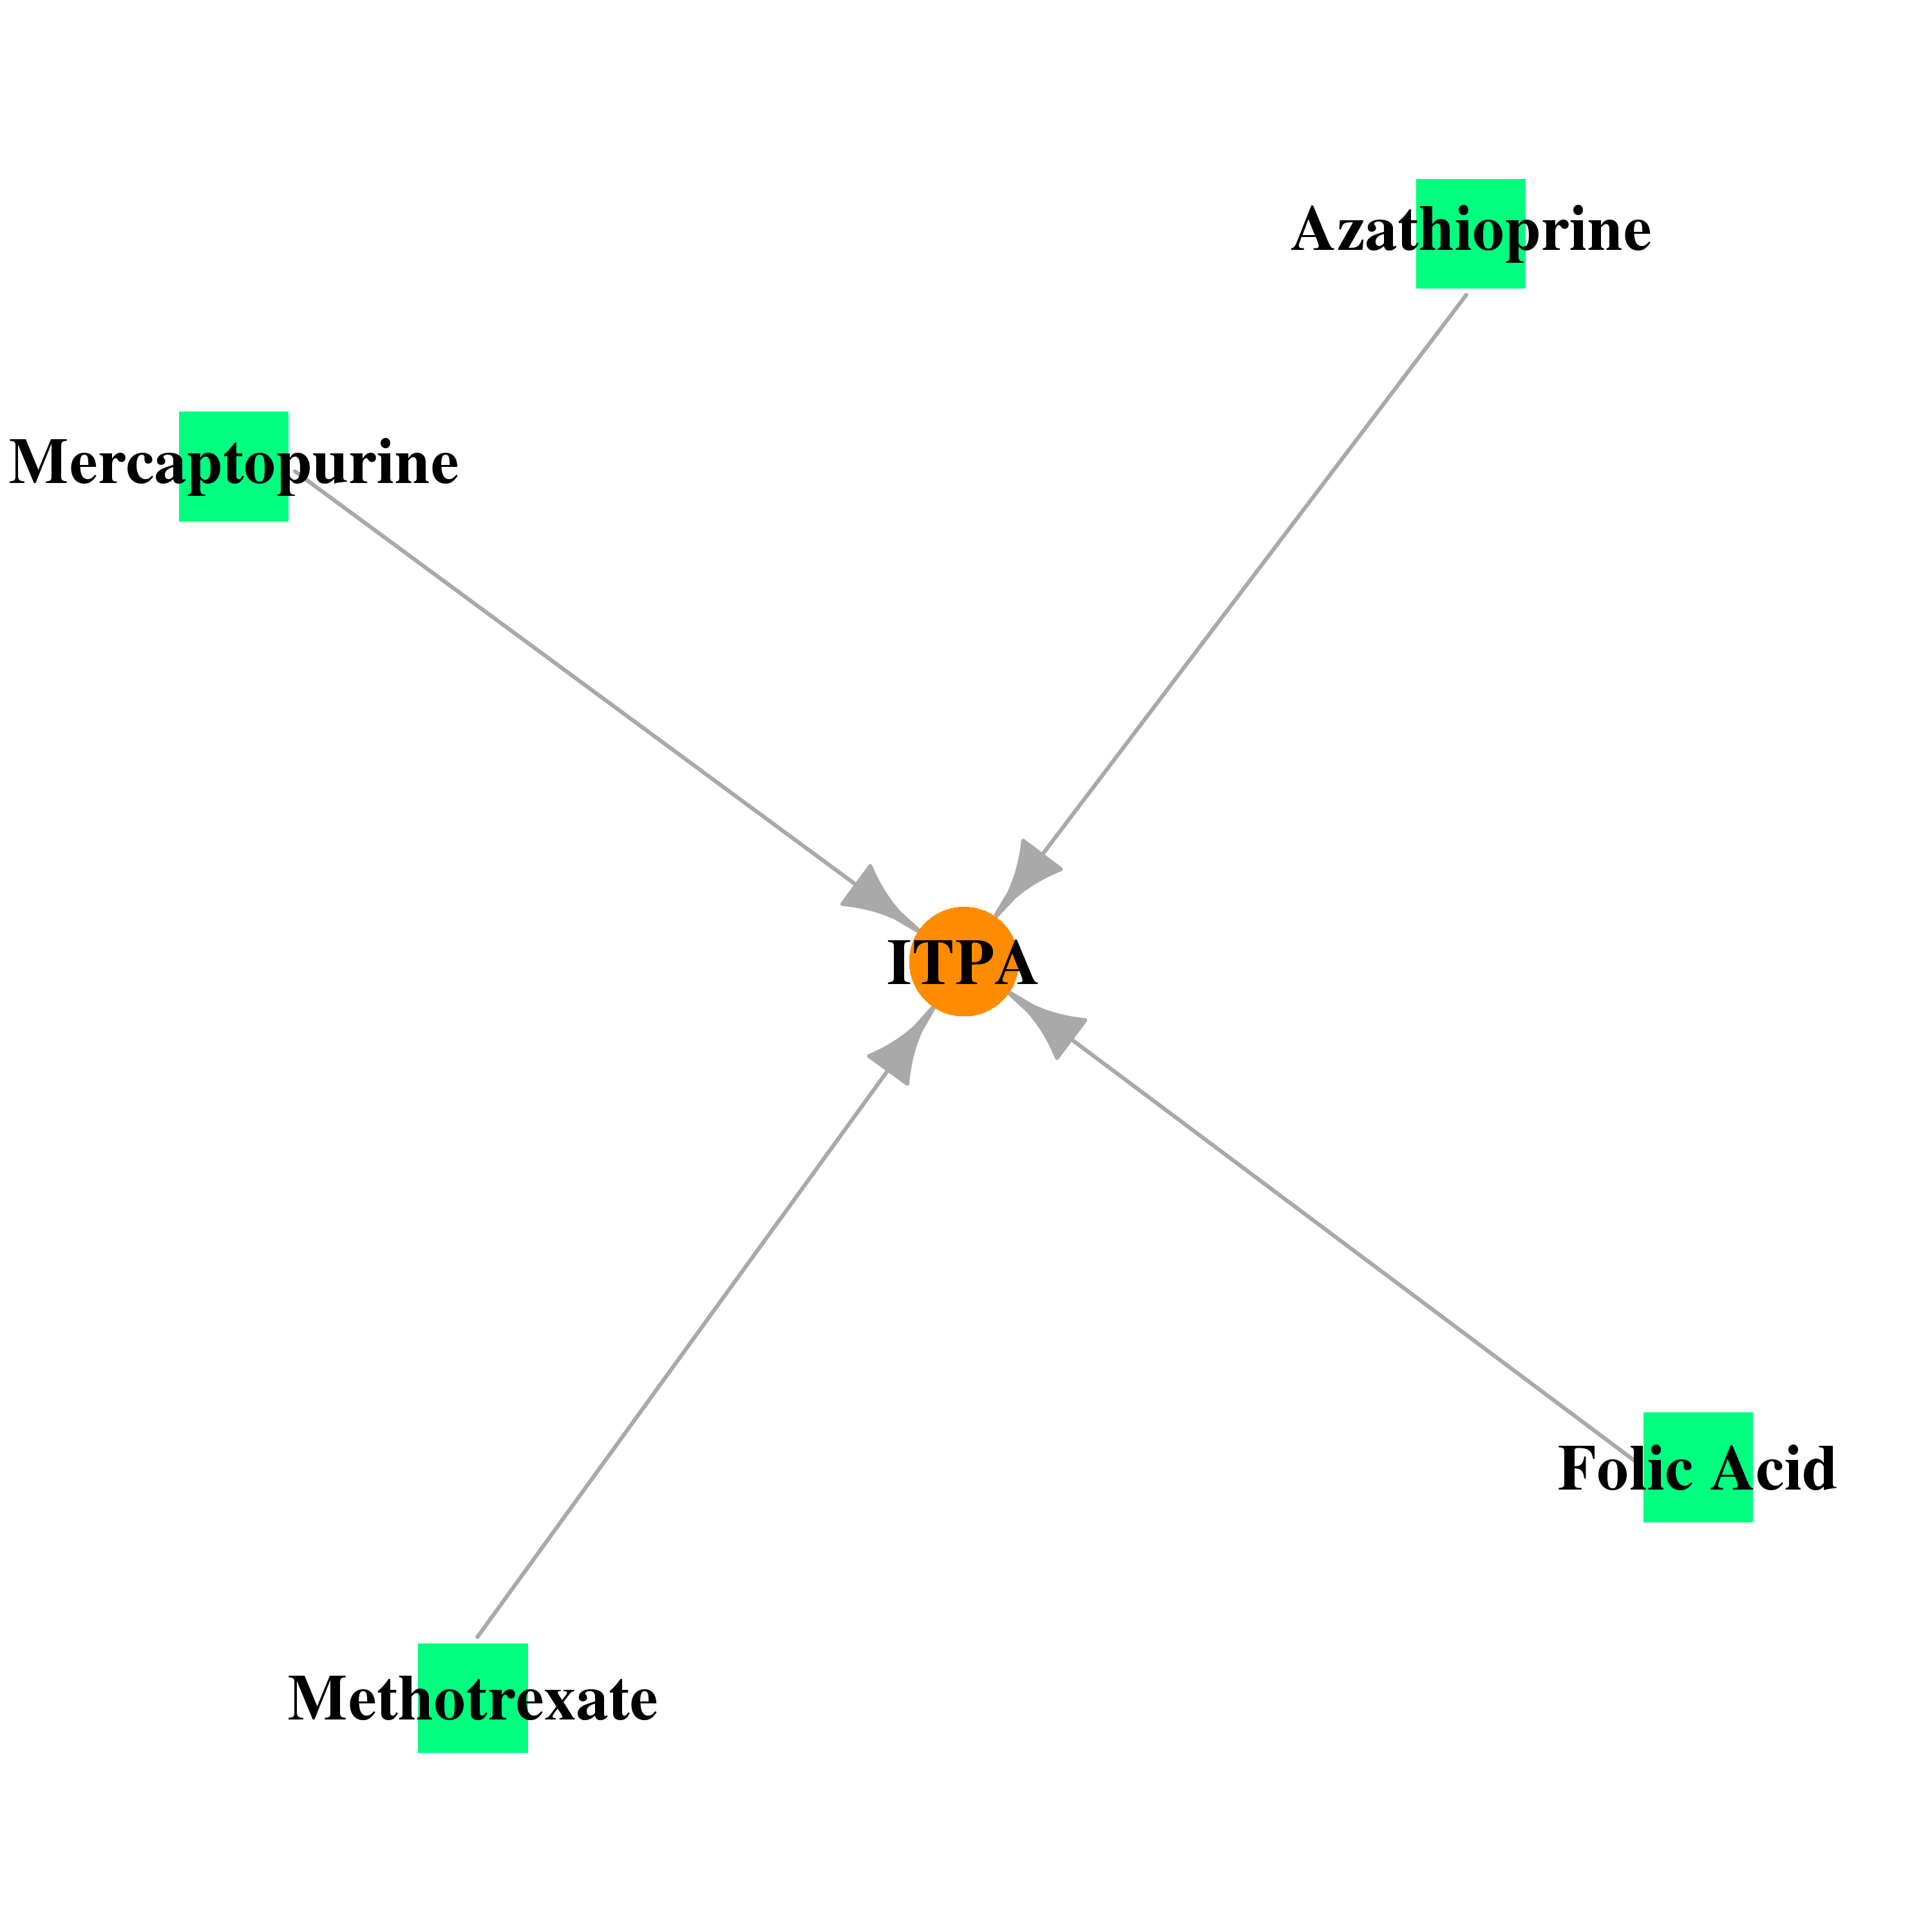 |
| * Drug Centered Interaction Network. |
| DrugBank ID | Target Name | Drug Groups | Generic Name | Drug Centered Network | Drug Structure |
| DB01033 | inosine triphosphatase (nucleoside triphosphate pyrophosphatase) | approved | Mercaptopurine | 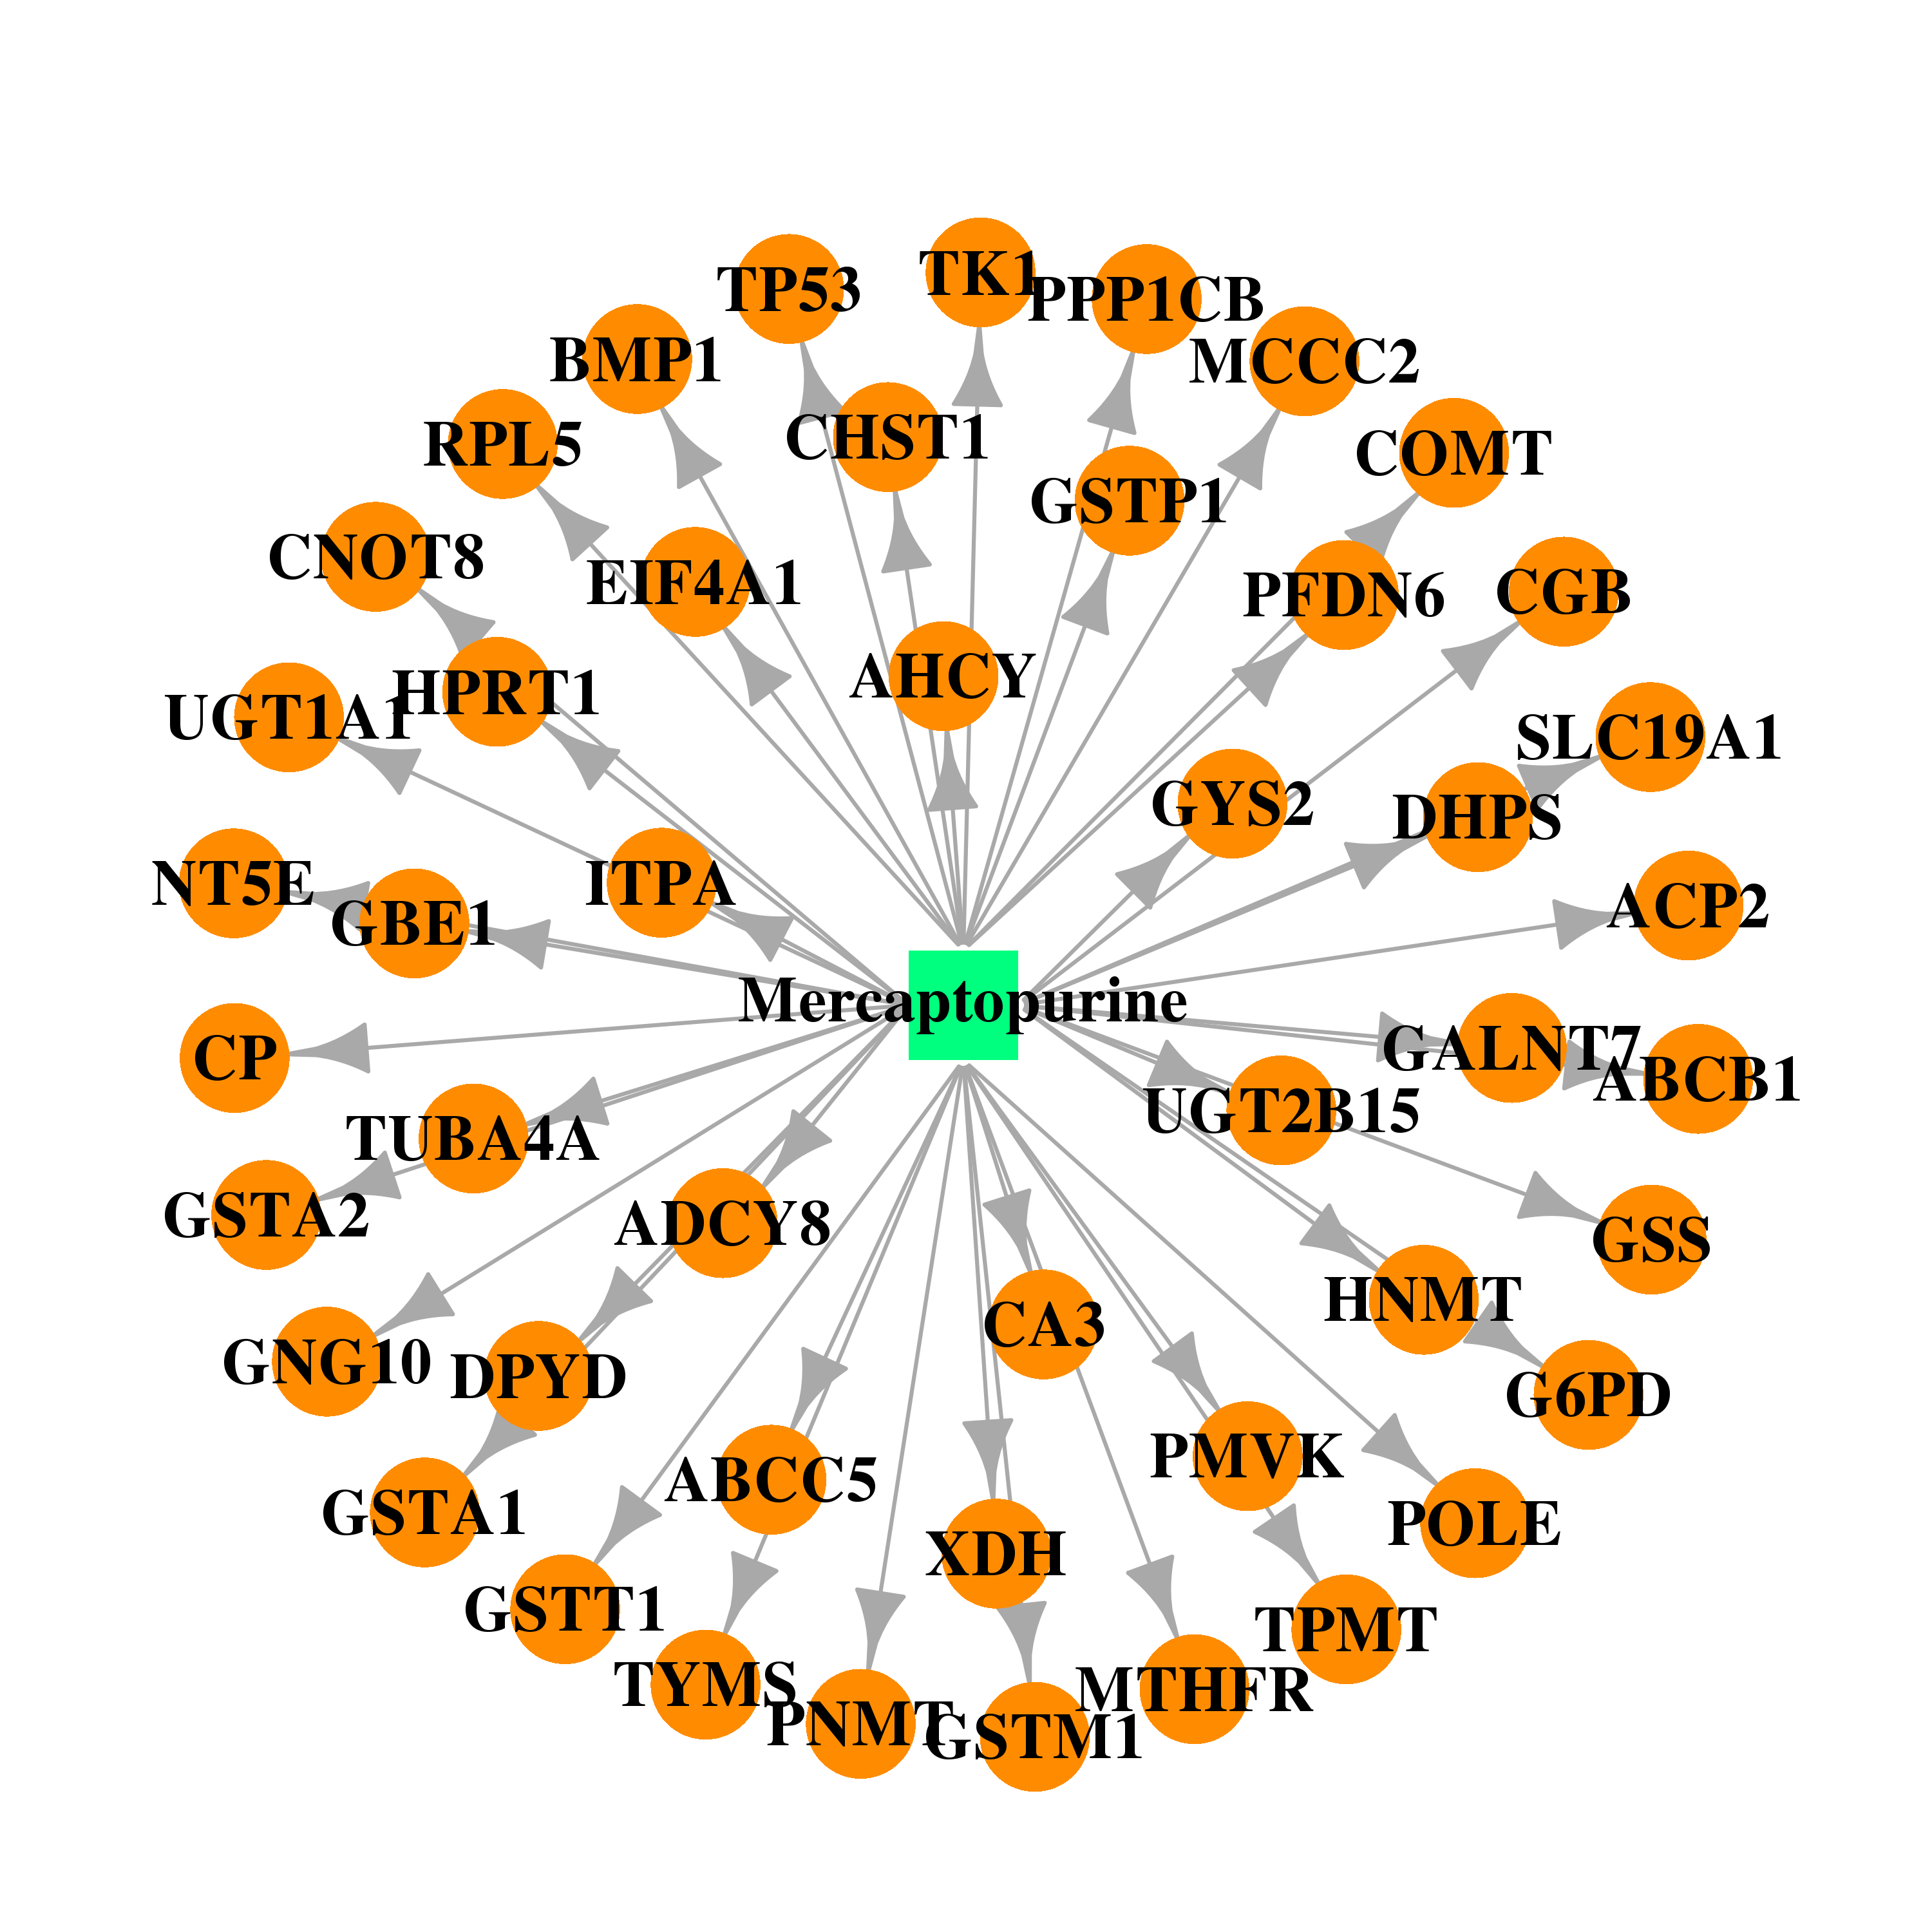 | 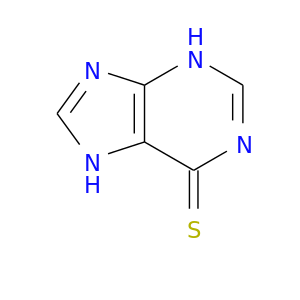 |
| DB00563 | inosine triphosphatase (nucleoside triphosphate pyrophosphatase) | approved | Methotrexate |  |  |
| DB00993 | inosine triphosphatase (nucleoside triphosphate pyrophosphatase) | approved | Azathioprine |  |  |
| DB00158 | inosine triphosphatase (nucleoside triphosphate pyrophosphatase) | approved; nutraceutical | Folic Acid | 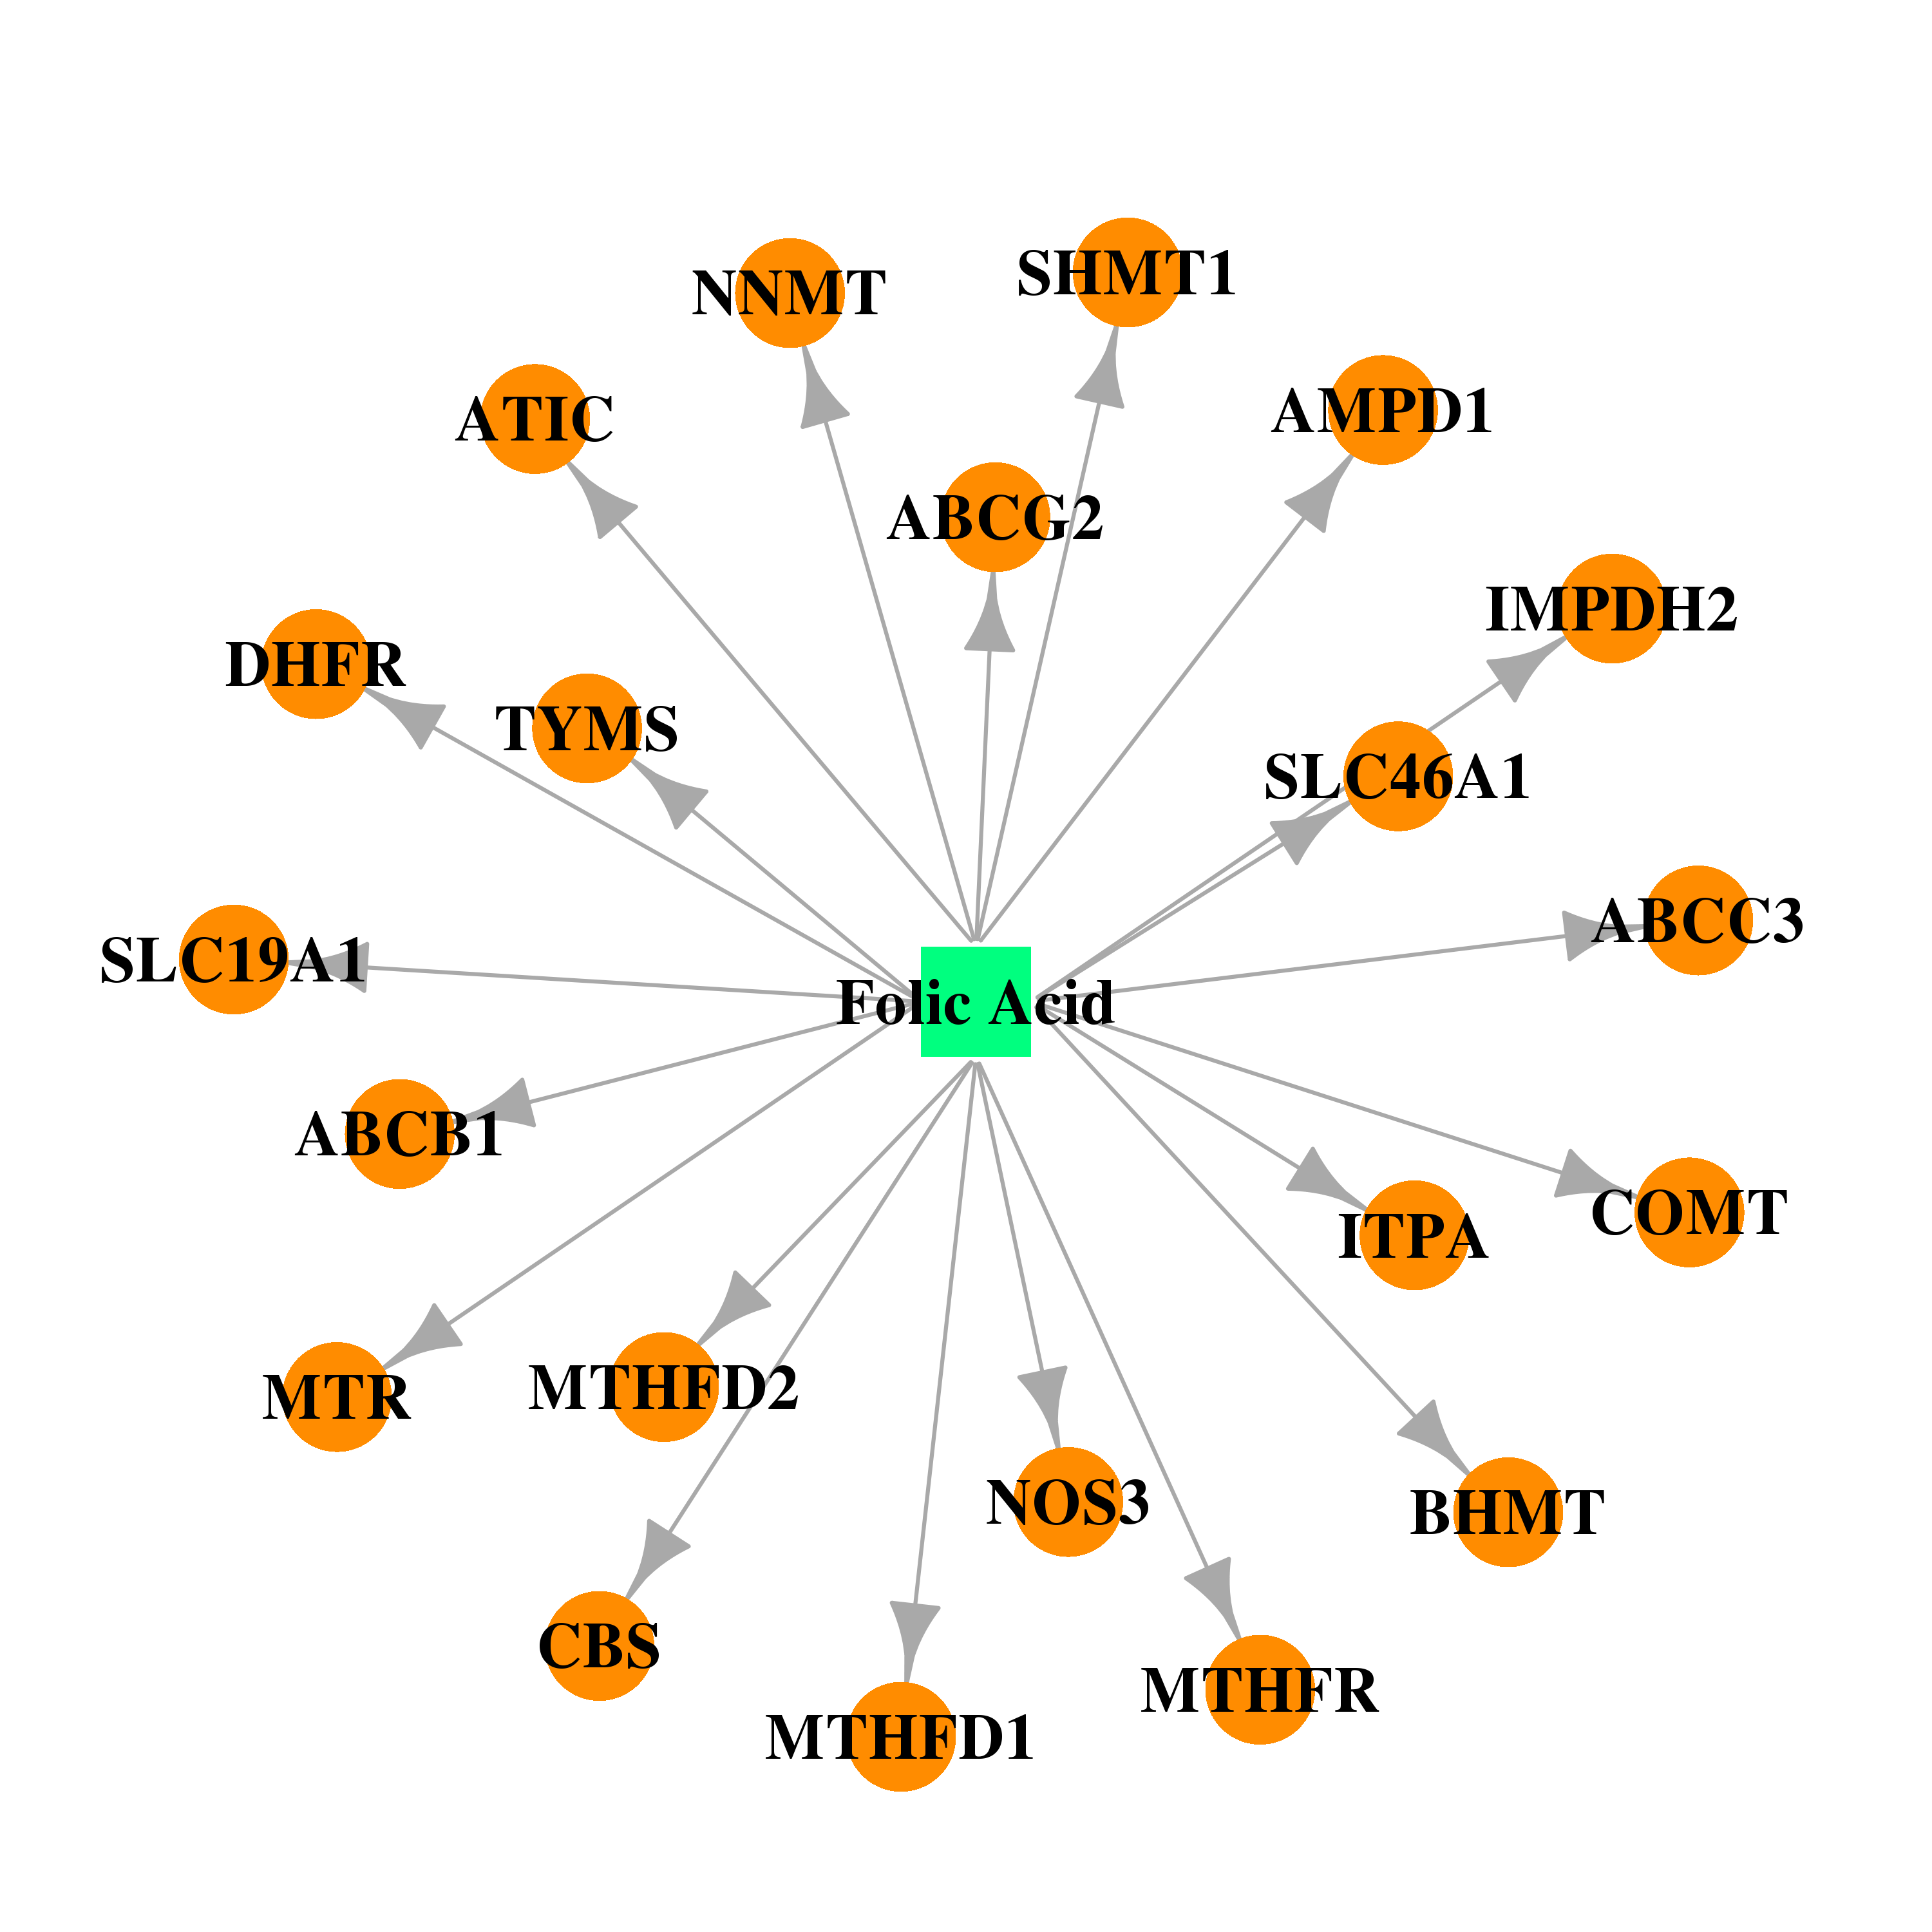 | 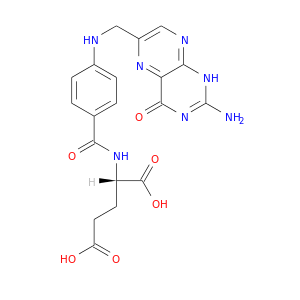 |
| Top |
| Cross referenced IDs for ITPA |
| * We obtained these cross-references from Uniprot database. It covers 150 different DBs, 18 categories. http://www.uniprot.org/help/cross_references_section |
: Open all cross reference information
|
Copyright © 2016-Present - The Univsersity of Texas Health Science Center at Houston @ |