|
||||||||||||||||||||||||||||||||||||||||||||||||||||||||||||||||||||||||||||||||||||||||||||||||||||||||||||||||||||||||||||||||||||||||||||||||||||||||||||||||||||||||||||||||||||||||||||||||||||||||||||||||||||||||||||||||||||||||||||||||||||||||||||||||||||||||||||||||||||||||||||||||||||||||||||||||||||||||||||||||||||||||||||||||||||||||||||||||||||||||
| |
| Phenotypic Information (metabolism pathway, cancer, disease, phenome) |
| |
| |
| Gene-Gene Network Information: Co-Expression Network, Interacting Genes & KEGG |
| |
|


| Gene Summary for ITPKA |
| Basic gene info. | Gene symbol | ITPKA |
| Gene name | inositol-trisphosphate 3-kinase A | |
| Synonyms | IP3-3KA|IP3KA | |
| Cytomap | UCSC genome browser: 15q15.1 | |
| Genomic location | chr15 :41786055-41795757 | |
| Type of gene | protein-coding | |
| RefGenes | NM_002220.2, | |
| Ensembl id | ENSG00000137825 | |
| Description | IP3 3-kinase AIP3K Ainositol 1,4,5-trisphosphate 3-kinase AinsP 3-kinase A | |
| Modification date | 20141222 | |
| dbXrefs | MIM : 147521 | |
| HGNC : HGNC | ||
| Ensembl : ENSG00000137825 | ||
| HPRD : 00941 | ||
| Vega : OTTHUMG00000130343 | ||
| Protein | UniProt: P23677 go to UniProt's Cross Reference DB Table | |
| Expression | CleanEX: HS_ITPKA | |
| BioGPS: 3706 | ||
| Gene Expression Atlas: ENSG00000137825 | ||
| The Human Protein Atlas: ENSG00000137825 | ||
| Pathway | NCI Pathway Interaction Database: ITPKA | |
| KEGG: ITPKA | ||
| REACTOME: ITPKA | ||
| ConsensusPathDB | ||
| Pathway Commons: ITPKA | ||
| Metabolism | MetaCyc: ITPKA | |
| HUMANCyc: ITPKA | ||
| Regulation | Ensembl's Regulation: ENSG00000137825 | |
| miRBase: chr15 :41,786,055-41,795,757 | ||
| TargetScan: NM_002220 | ||
| cisRED: ENSG00000137825 | ||
| Context | iHOP: ITPKA | |
| cancer metabolism search in PubMed: ITPKA | ||
| UCL Cancer Institute: ITPKA | ||
| Assigned class in ccmGDB | A - This gene has a literature evidence and it belongs to cancer gene. | |
| References showing role of ITPKA in cancer cell metabolism | 1. Hoofd C, Devreker F, Deneubourg L, Deleu S, Nguyen TM, et al. (2012) A specific increase in inositol 1,4,5-trisphosphate 3-kinase B expression upon differentiation of human embryonic stem cells. Cell Signal 24: 1461-1470. doi: 10.1016/j.cellsig.2012.03.006. go to article | |
| Top |
| Phenotypic Information for ITPKA(metabolism pathway, cancer, disease, phenome) |
| Cancer | CGAP: ITPKA |
| Familial Cancer Database: ITPKA | |
| * This gene is included in those cancer gene databases. |
|
|
|
|
|
|
| ||||||||||||||||||||||||||||||||||||||||||||||||||||||||||||||||||||||||||||||||||||||||||||||||||||||||||||||||||||||||||||||||||||||||||||||||||||||||||||||||||||||||||||||||||||||||||||||||||||||||||||||||||||||||||||||||||||||||||||||||||||||||||||||||||||||||||||||||||||||||||||||||||||||||||||||||||||||||||||||||||||||||||||||||||||||||||||||||||
Oncogene 1 | Significant driver gene in | |||||||||||||||||||||||||||||||||||||||||||||||||||||||||||||||||||||||||||||||||||||||||||||||||||||||||||||||||||||||||||||||||||||||||||||||||||||||||||||||||||||||||||||||||||||||||||||||||||||||||||||||||||||||||||||||||||||||||||||||||||||||||||||||||||||||||||||||||||||||||||||||||||||||||||||||||||||||||||||||||||||||||||||||||||||||||||||||||||||||
| cf) number; DB name 1 Oncogene; http://nar.oxfordjournals.org/content/35/suppl_1/D721.long, 2 Tumor Suppressor gene; https://bioinfo.uth.edu/TSGene/, 3 Cancer Gene Census; http://www.nature.com/nrc/journal/v4/n3/abs/nrc1299.html, 4 CancerGenes; http://nar.oxfordjournals.org/content/35/suppl_1/D721.long, 5 Network of Cancer Gene; http://ncg.kcl.ac.uk/index.php, 1Therapeutic Vulnerabilities in Cancer; http://cbio.mskcc.org/cancergenomics/statius/ |
| KEGG_INOSITOL_PHOSPHATE_METABOLISM | |
| OMIM | 147521; gene. |
| Orphanet | |
| Disease | KEGG Disease: ITPKA |
| MedGen: ITPKA (Human Medical Genetics with Condition) | |
| ClinVar: ITPKA | |
| Phenotype | MGI: ITPKA (International Mouse Phenotyping Consortium) |
| PhenomicDB: ITPKA | |
| Mutations for ITPKA |
| * Under tables are showing count per each tissue to give us broad intuition about tissue specific mutation patterns.You can go to the detailed page for each mutation database's web site. |
| There's no structural variation information in COSMIC data for this gene. |
| * From mRNA Sanger sequences, Chitars2.0 arranged chimeric transcripts. This table shows ITPKA related fusion information. |
| ID | Head Gene | Tail Gene | Accession | Gene_a | qStart_a | qEnd_a | Chromosome_a | tStart_a | tEnd_a | Gene_a | qStart_a | qEnd_a | Chromosome_a | tStart_a | tEnd_a |
| BE175234 | ITPKA | 1 | 87 | 15 | 41788813 | 41788899 | ITPKA | 84 | 175 | 15 | 41788907 | 41788998 | |
| Top |
| Mutation type/ Tissue ID | brca | cns | cerv | endome | haematopo | kidn | Lintest | liver | lung | ns | ovary | pancre | prost | skin | stoma | thyro | urina | |||
| Total # sample | 1 | |||||||||||||||||||
| GAIN (# sample) | ||||||||||||||||||||
| LOSS (# sample) | 1 |
| cf) Tissue ID; Tissue type (1; Breast, 2; Central_nervous_system, 3; Cervix, 4; Endometrium, 5; Haematopoietic_and_lymphoid_tissue, 6; Kidney, 7; Large_intestine, 8; Liver, 9; Lung, 10; NS, 11; Ovary, 12; Pancreas, 13; Prostate, 14; Skin, 15; Stomach, 16; Thyroid, 17; Urinary_tract) |
| Top |
|
 |
| Top |
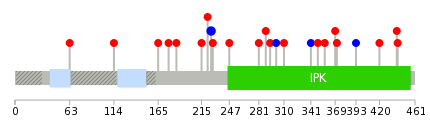
| Stat. for Non-Synonymous SNVs (# total SNVs=16) | (# total SNVs=2) |
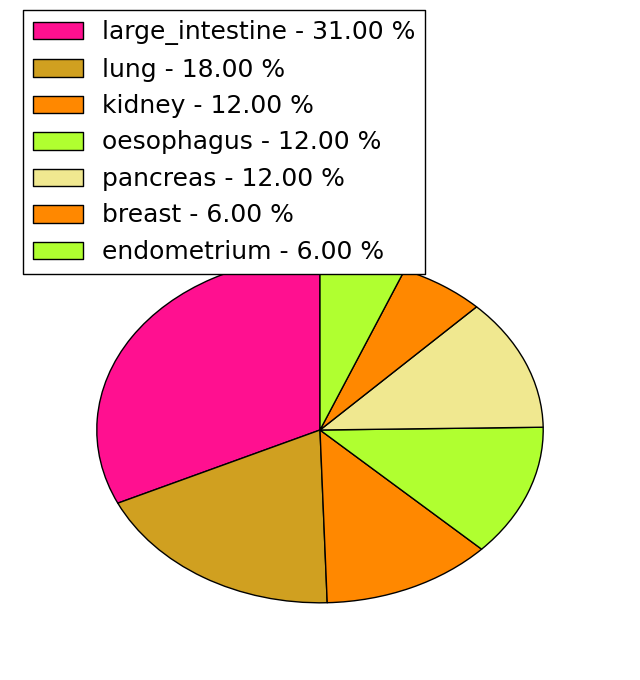 | 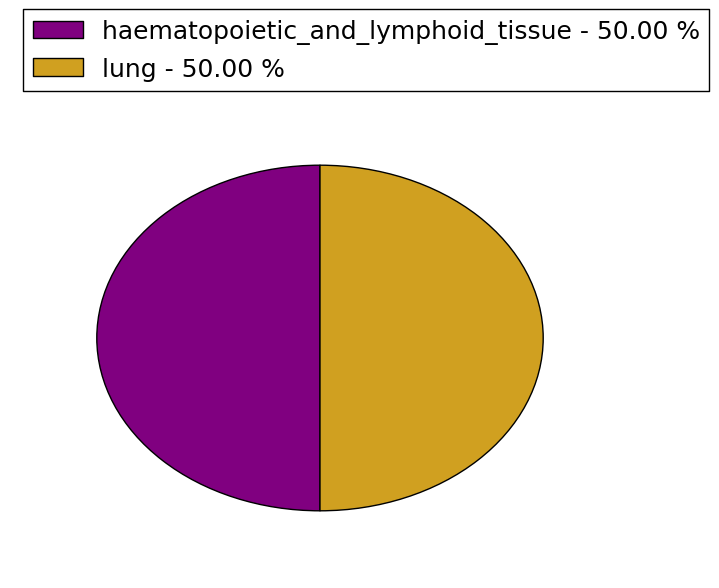 |
(# total SNVs=1) | (# total SNVs=1) |
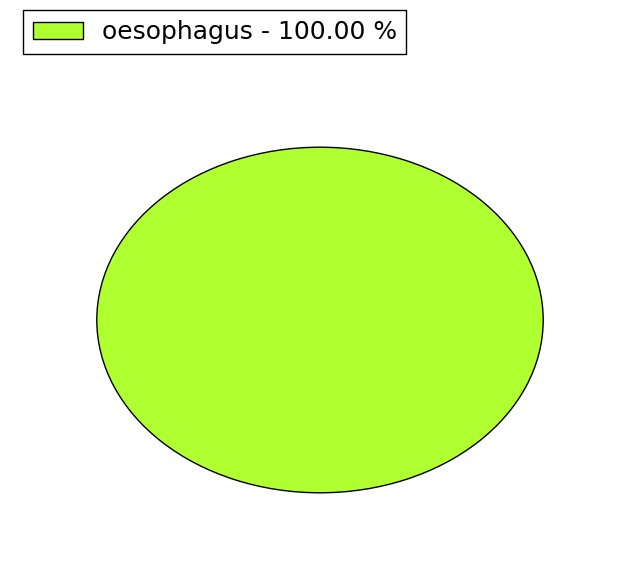 |  |
| Top |
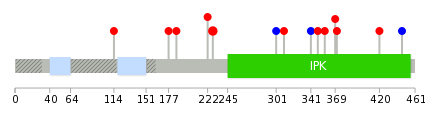
| * When you move the cursor on each content, you can see more deailed mutation information on the Tooltip. Those are primary_site,primary_histology,mutation(aa),pubmedID. |
| GRCh37 position | Mutation(aa) | Unique sampleID count |
| chr15:41793924-41793924 | p.A226A | 2 |
| chr15:41793664-41793664 | p.N165H | 1 |
| chr15:41794272-41794272 | p.A294V | 1 |
| chr15:41795237-41795237 | p.T420I | 1 |
| chr15:41793700-41793700 | p.P177S | 1 |
| chr15:41794294-41794294 | p.T301T | 1 |
| chr15:41795296-41795296 | p.R440C | 1 |
| chr15:41793728-41793728 | p.Y186F | 1 |
| chr15:41794319-41794319 | p.V310I | 1 |
| chr15:41795299-41795299 | p.E441K | 1 |
| Top |
|
 |
| Point Mutation/ Tissue ID | 1 | 2 | 3 | 4 | 5 | 6 | 7 | 8 | 9 | 10 | 11 | 12 | 13 | 14 | 15 | 16 | 17 | 18 | 19 | 20 |
| # sample | 2 | 1 | 1 | 2 | 2 | 3 | 1 | 1 | 2 | |||||||||||
| # mutation | 2 | 1 | 1 | 2 | 2 | 3 | 1 | 1 | 2 | |||||||||||
| nonsynonymous SNV | 2 | 1 | 1 | 1 | 2 | 2 | 1 | 1 | 1 | |||||||||||
| synonymous SNV | 1 | 1 | 1 |
| cf) Tissue ID; Tissue type (1; BLCA[Bladder Urothelial Carcinoma], 2; BRCA[Breast invasive carcinoma], 3; CESC[Cervical squamous cell carcinoma and endocervical adenocarcinoma], 4; COAD[Colon adenocarcinoma], 5; GBM[Glioblastoma multiforme], 6; Glioma Low Grade, 7; HNSC[Head and Neck squamous cell carcinoma], 8; KICH[Kidney Chromophobe], 9; KIRC[Kidney renal clear cell carcinoma], 10; KIRP[Kidney renal papillary cell carcinoma], 11; LAML[Acute Myeloid Leukemia], 12; LUAD[Lung adenocarcinoma], 13; LUSC[Lung squamous cell carcinoma], 14; OV[Ovarian serous cystadenocarcinoma ], 15; PAAD[Pancreatic adenocarcinoma], 16; PRAD[Prostate adenocarcinoma], 17; SKCM[Skin Cutaneous Melanoma], 18:STAD[Stomach adenocarcinoma], 19:THCA[Thyroid carcinoma], 20:UCEC[Uterine Corpus Endometrial Carcinoma]) |
| Top |
| * We represented just top 10 SNVs. When you move the cursor on each content, you can see more deailed mutation information on the Tooltip. Those are primary_site, primary_histology, mutation(aa), pubmedID. |
| Genomic Position | Mutation(aa) | Unique sampleID count |
| chr15:41793928 | p.R228C | 2 |
| chr15:41794294 | p.V310I | 1 |
| chr15:41794319 | p.S341S | 1 |
| chr15:41794614 | p.T349M | 1 |
| chr15:41794637 | p.R357C | 1 |
| chr15:41794660 | p.V369A | 1 |
| chr15:41794697 | p.R371T | 1 |
| chr15:41786466 | p.T420I | 1 |
| chr15:41794987 | p.L446L | 1 |
| chr15:41793700 | p.L114P | 1 |
| * Copy number data were extracted from TCGA using R package TCGA-Assembler. The URLs of all public data files on TCGA DCC data server were gathered on Jan-05-2015. Function ProcessCNAData in TCGA-Assembler package was used to obtain gene-level copy number value which is calculated as the average copy number of the genomic region of a gene. |
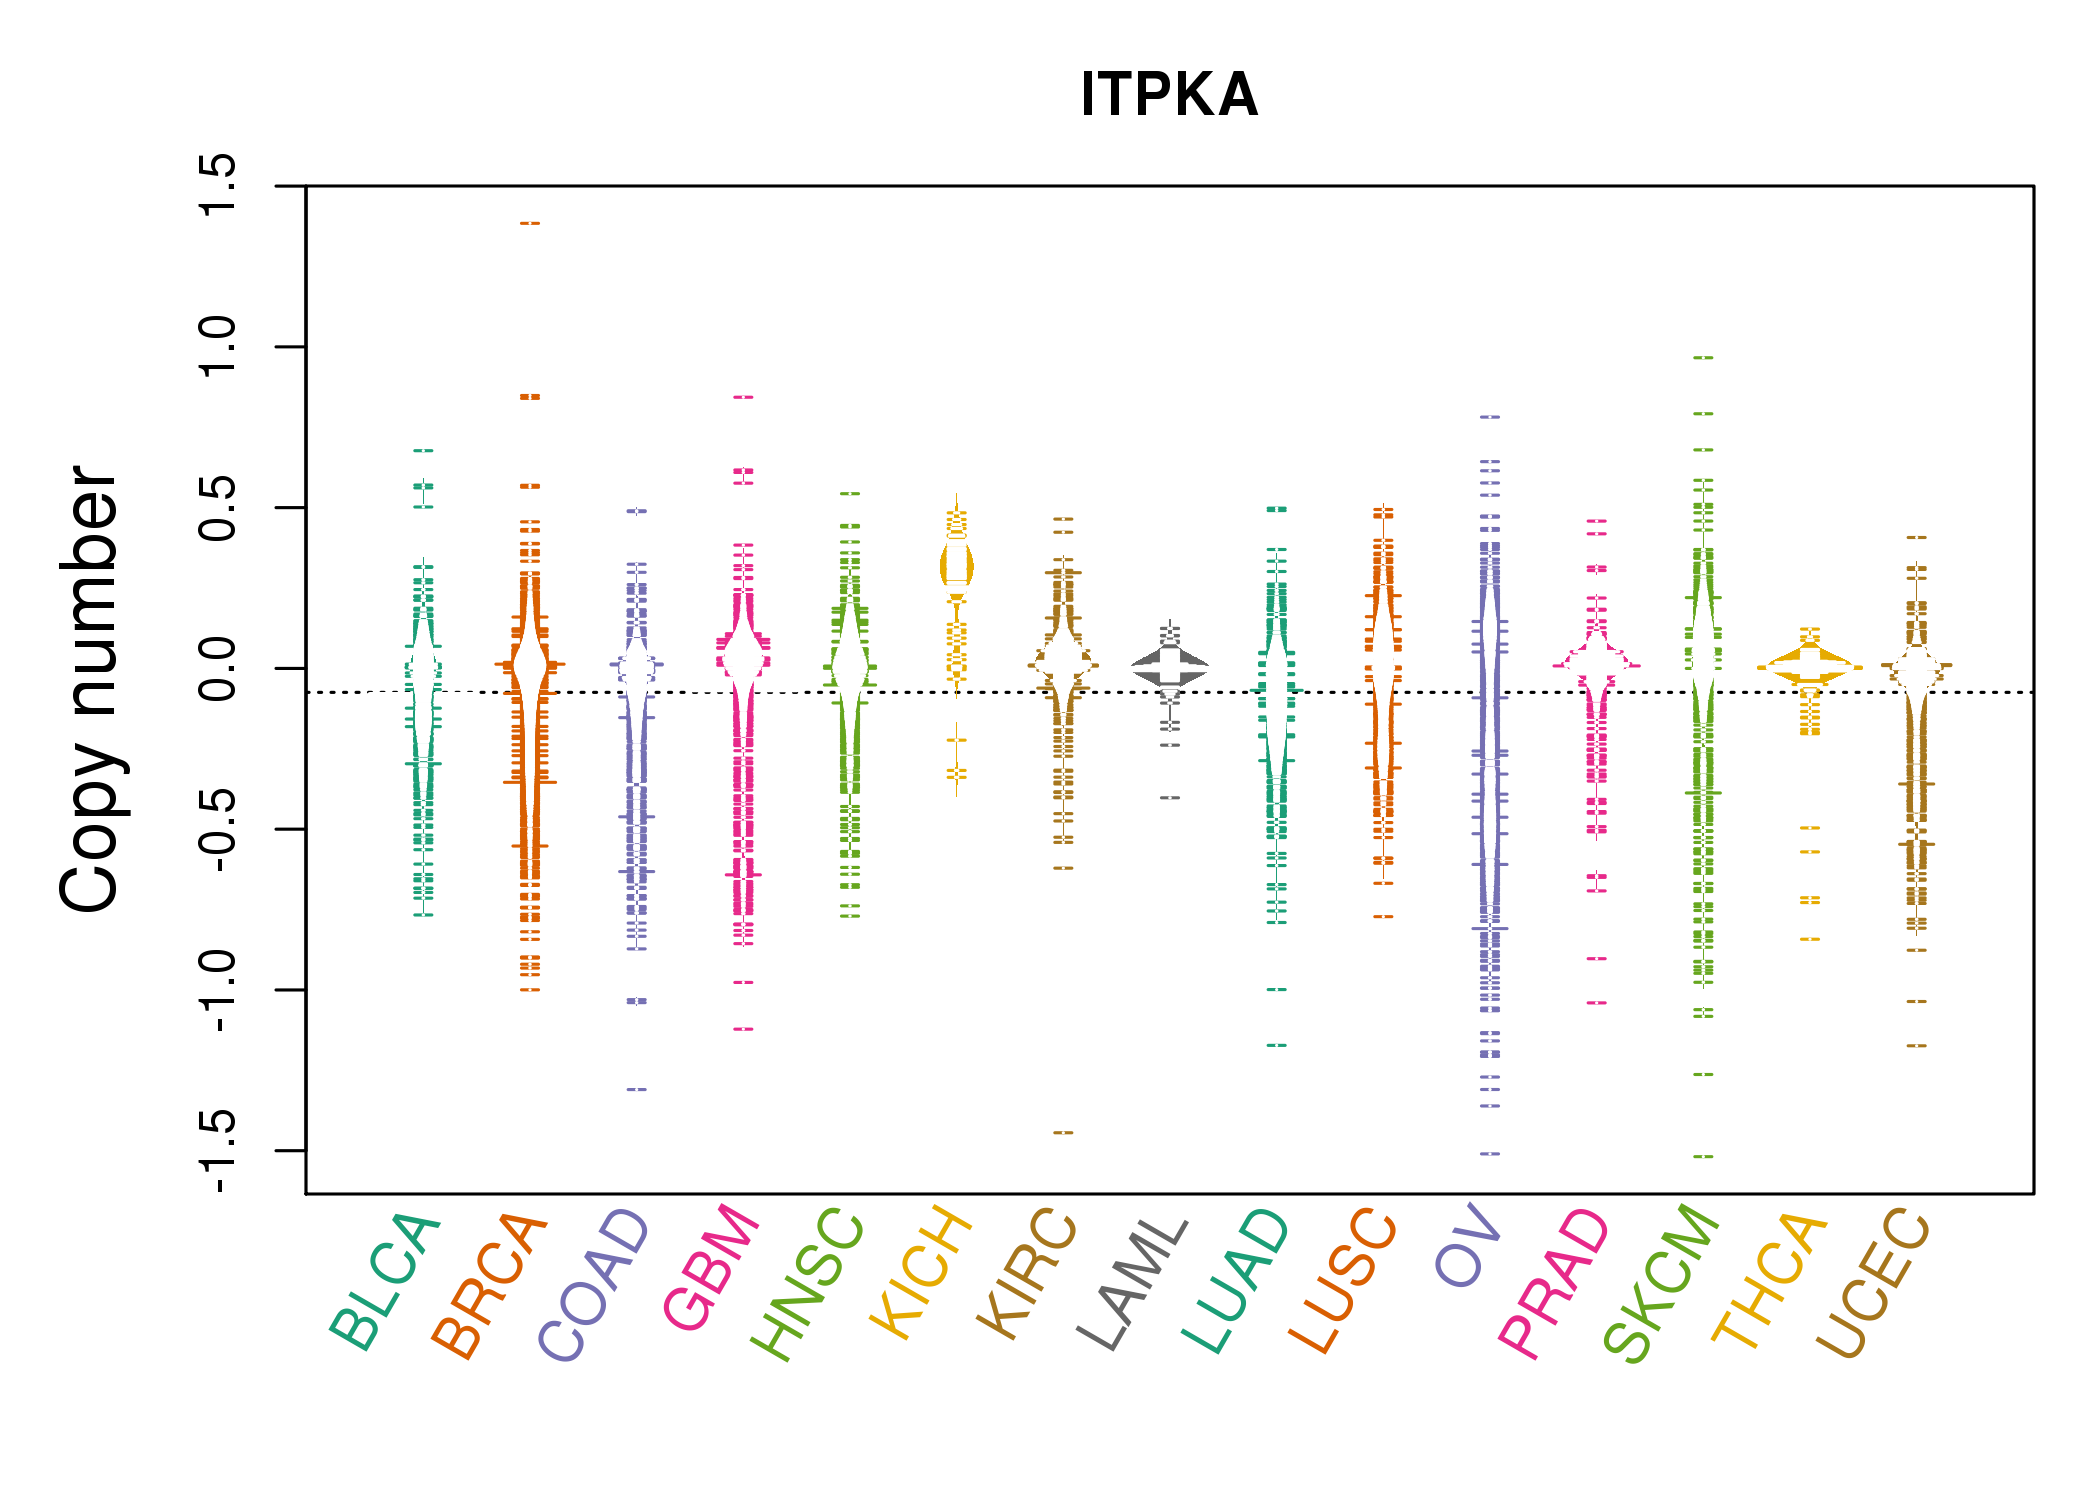 |
| cf) Tissue ID[Tissue type]: BLCA[Bladder Urothelial Carcinoma], BRCA[Breast invasive carcinoma], CESC[Cervical squamous cell carcinoma and endocervical adenocarcinoma], COAD[Colon adenocarcinoma], GBM[Glioblastoma multiforme], Glioma Low Grade, HNSC[Head and Neck squamous cell carcinoma], KICH[Kidney Chromophobe], KIRC[Kidney renal clear cell carcinoma], KIRP[Kidney renal papillary cell carcinoma], LAML[Acute Myeloid Leukemia], LUAD[Lung adenocarcinoma], LUSC[Lung squamous cell carcinoma], OV[Ovarian serous cystadenocarcinoma ], PAAD[Pancreatic adenocarcinoma], PRAD[Prostate adenocarcinoma], SKCM[Skin Cutaneous Melanoma], STAD[Stomach adenocarcinoma], THCA[Thyroid carcinoma], UCEC[Uterine Corpus Endometrial Carcinoma] |
| Top |
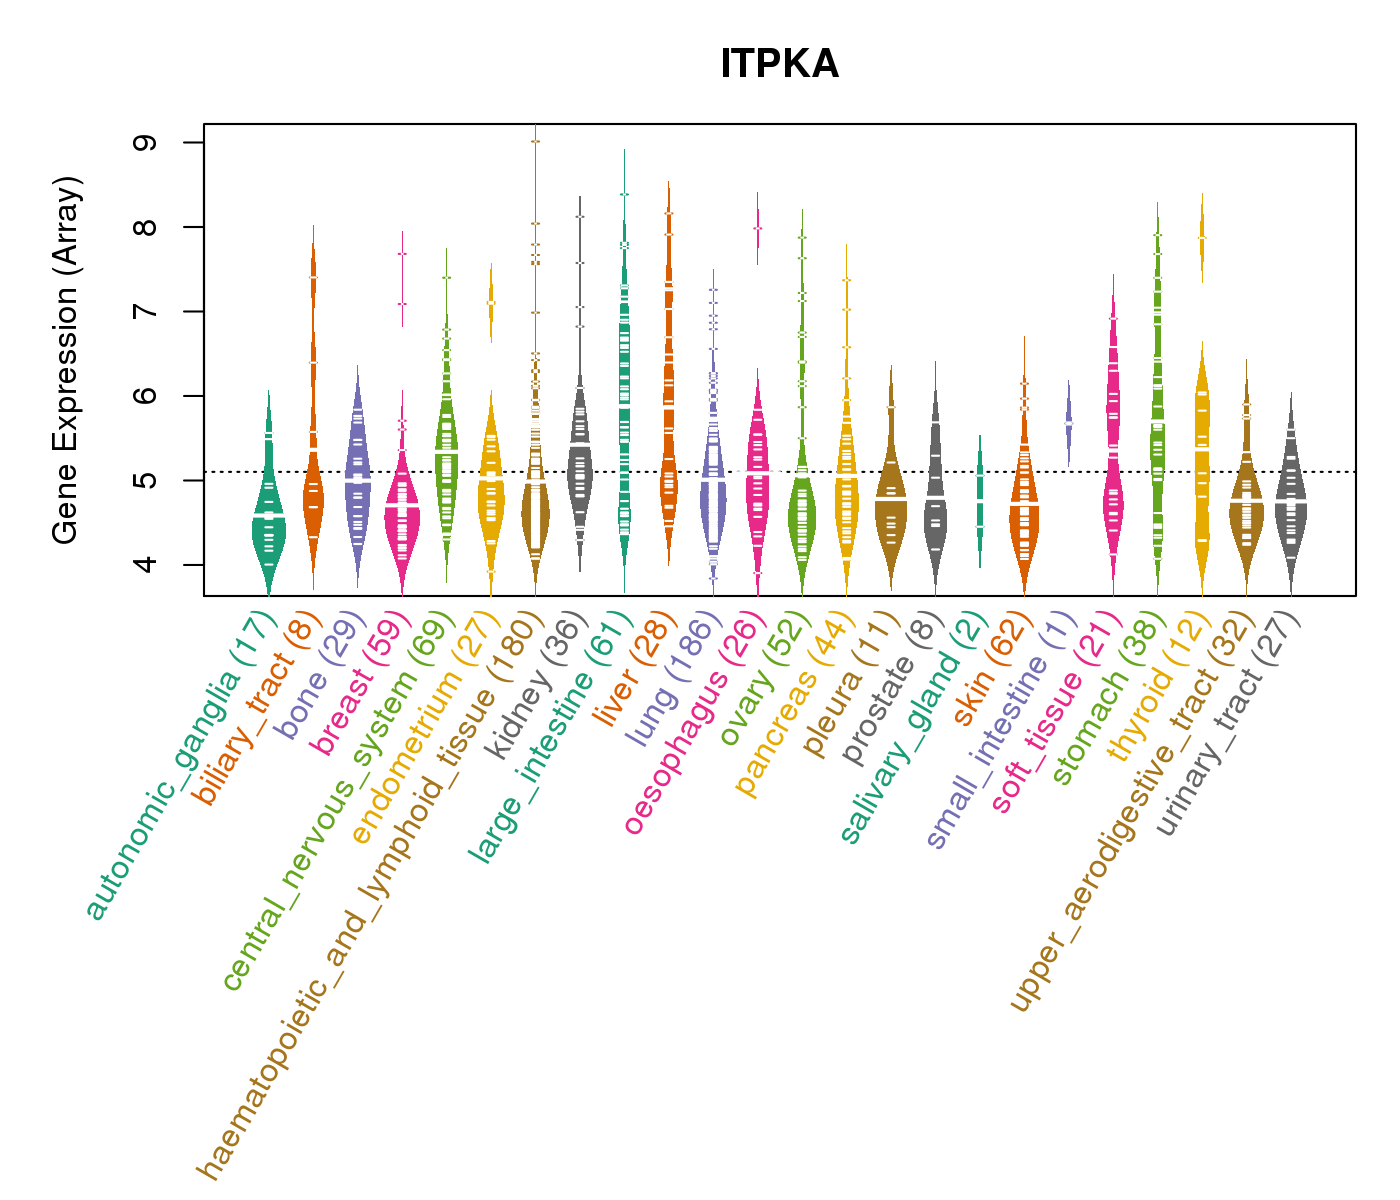
| Gene Expression for ITPKA |
| * CCLE gene expression data were extracted from CCLE_Expression_Entrez_2012-10-18.res: Gene-centric RMA-normalized mRNA expression data. |
 |
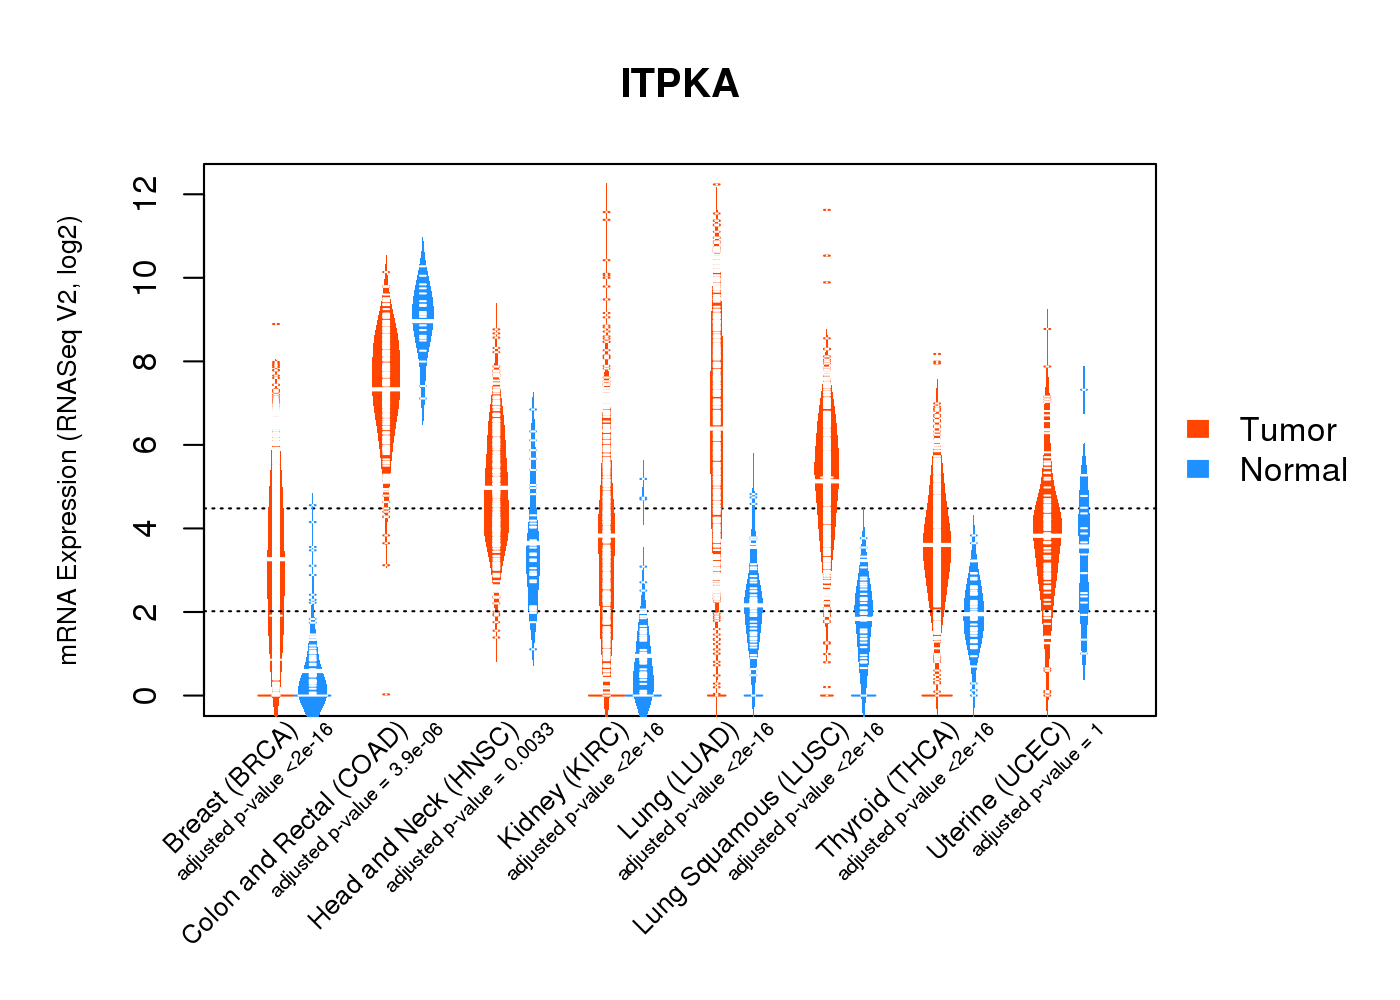
| * Normalized gene expression data of RNASeqV2 was extracted from TCGA using R package TCGA-Assembler. The URLs of all public data files on TCGA DCC data server were gathered at Jan-05-2015. Only eight cancer types have enough normal control samples for differential expression analysis. (t test, adjusted p<0.05 (using Benjamini-Hochberg FDR)) |
 |
| Top |
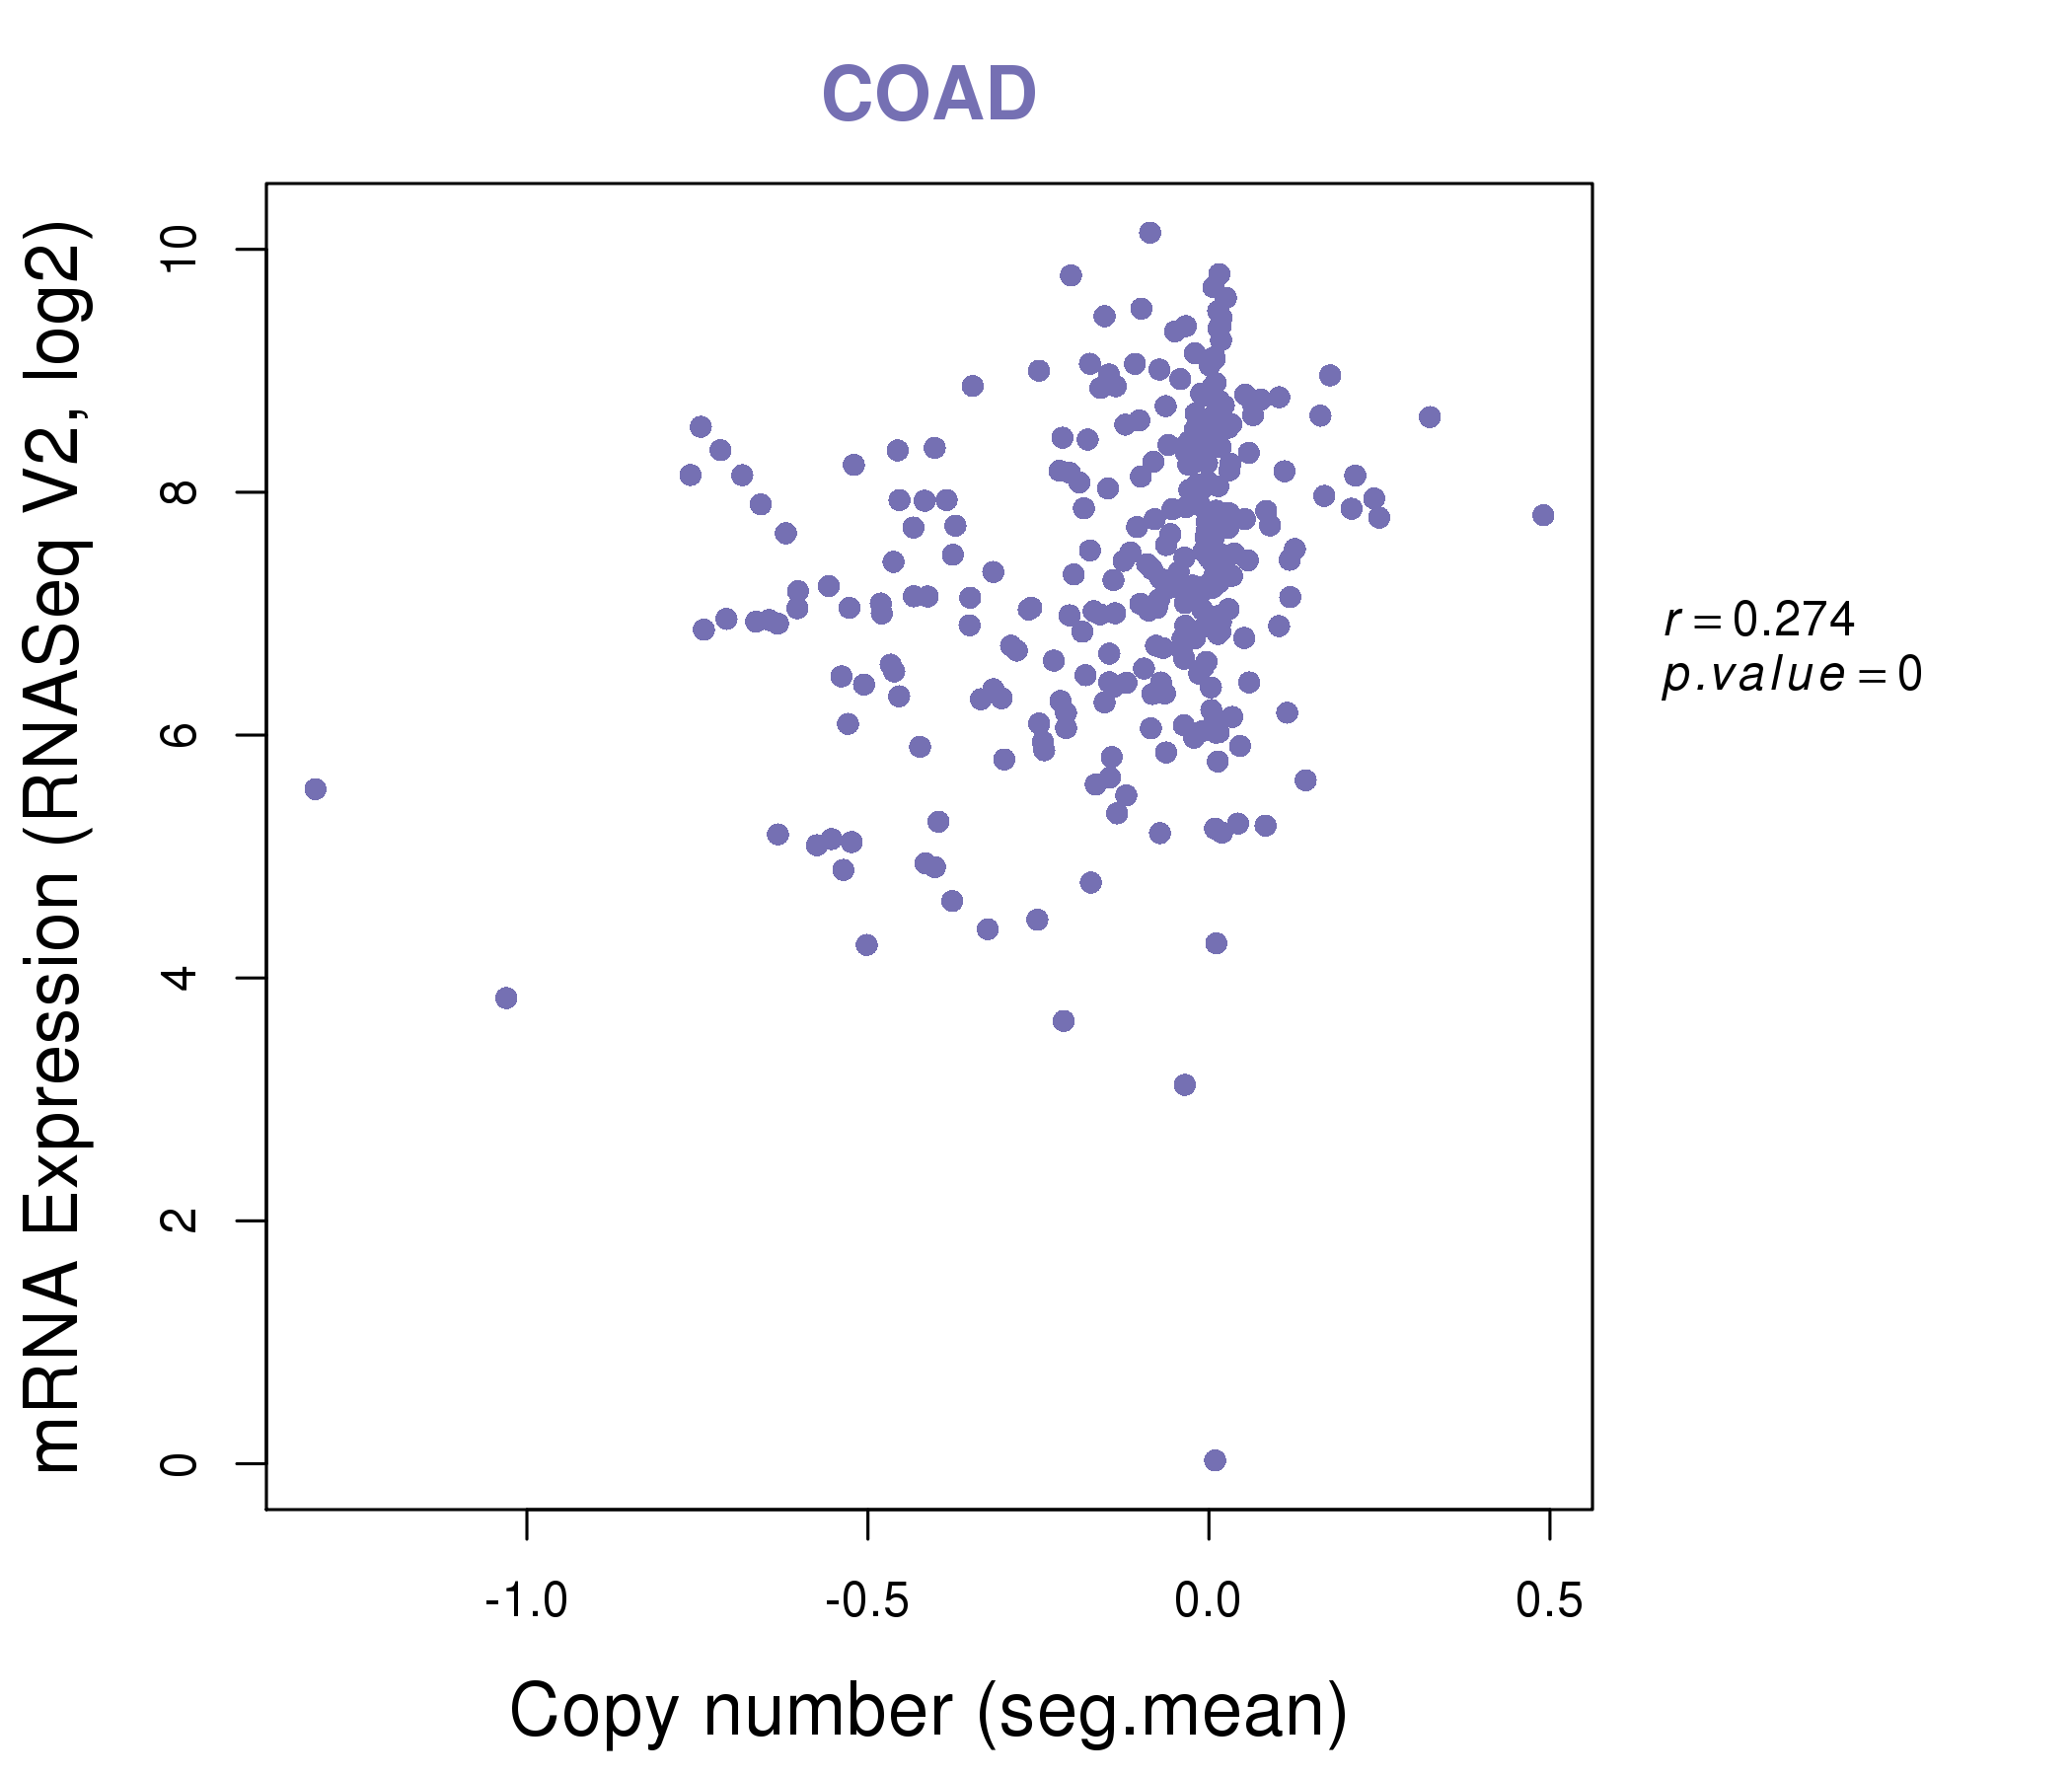
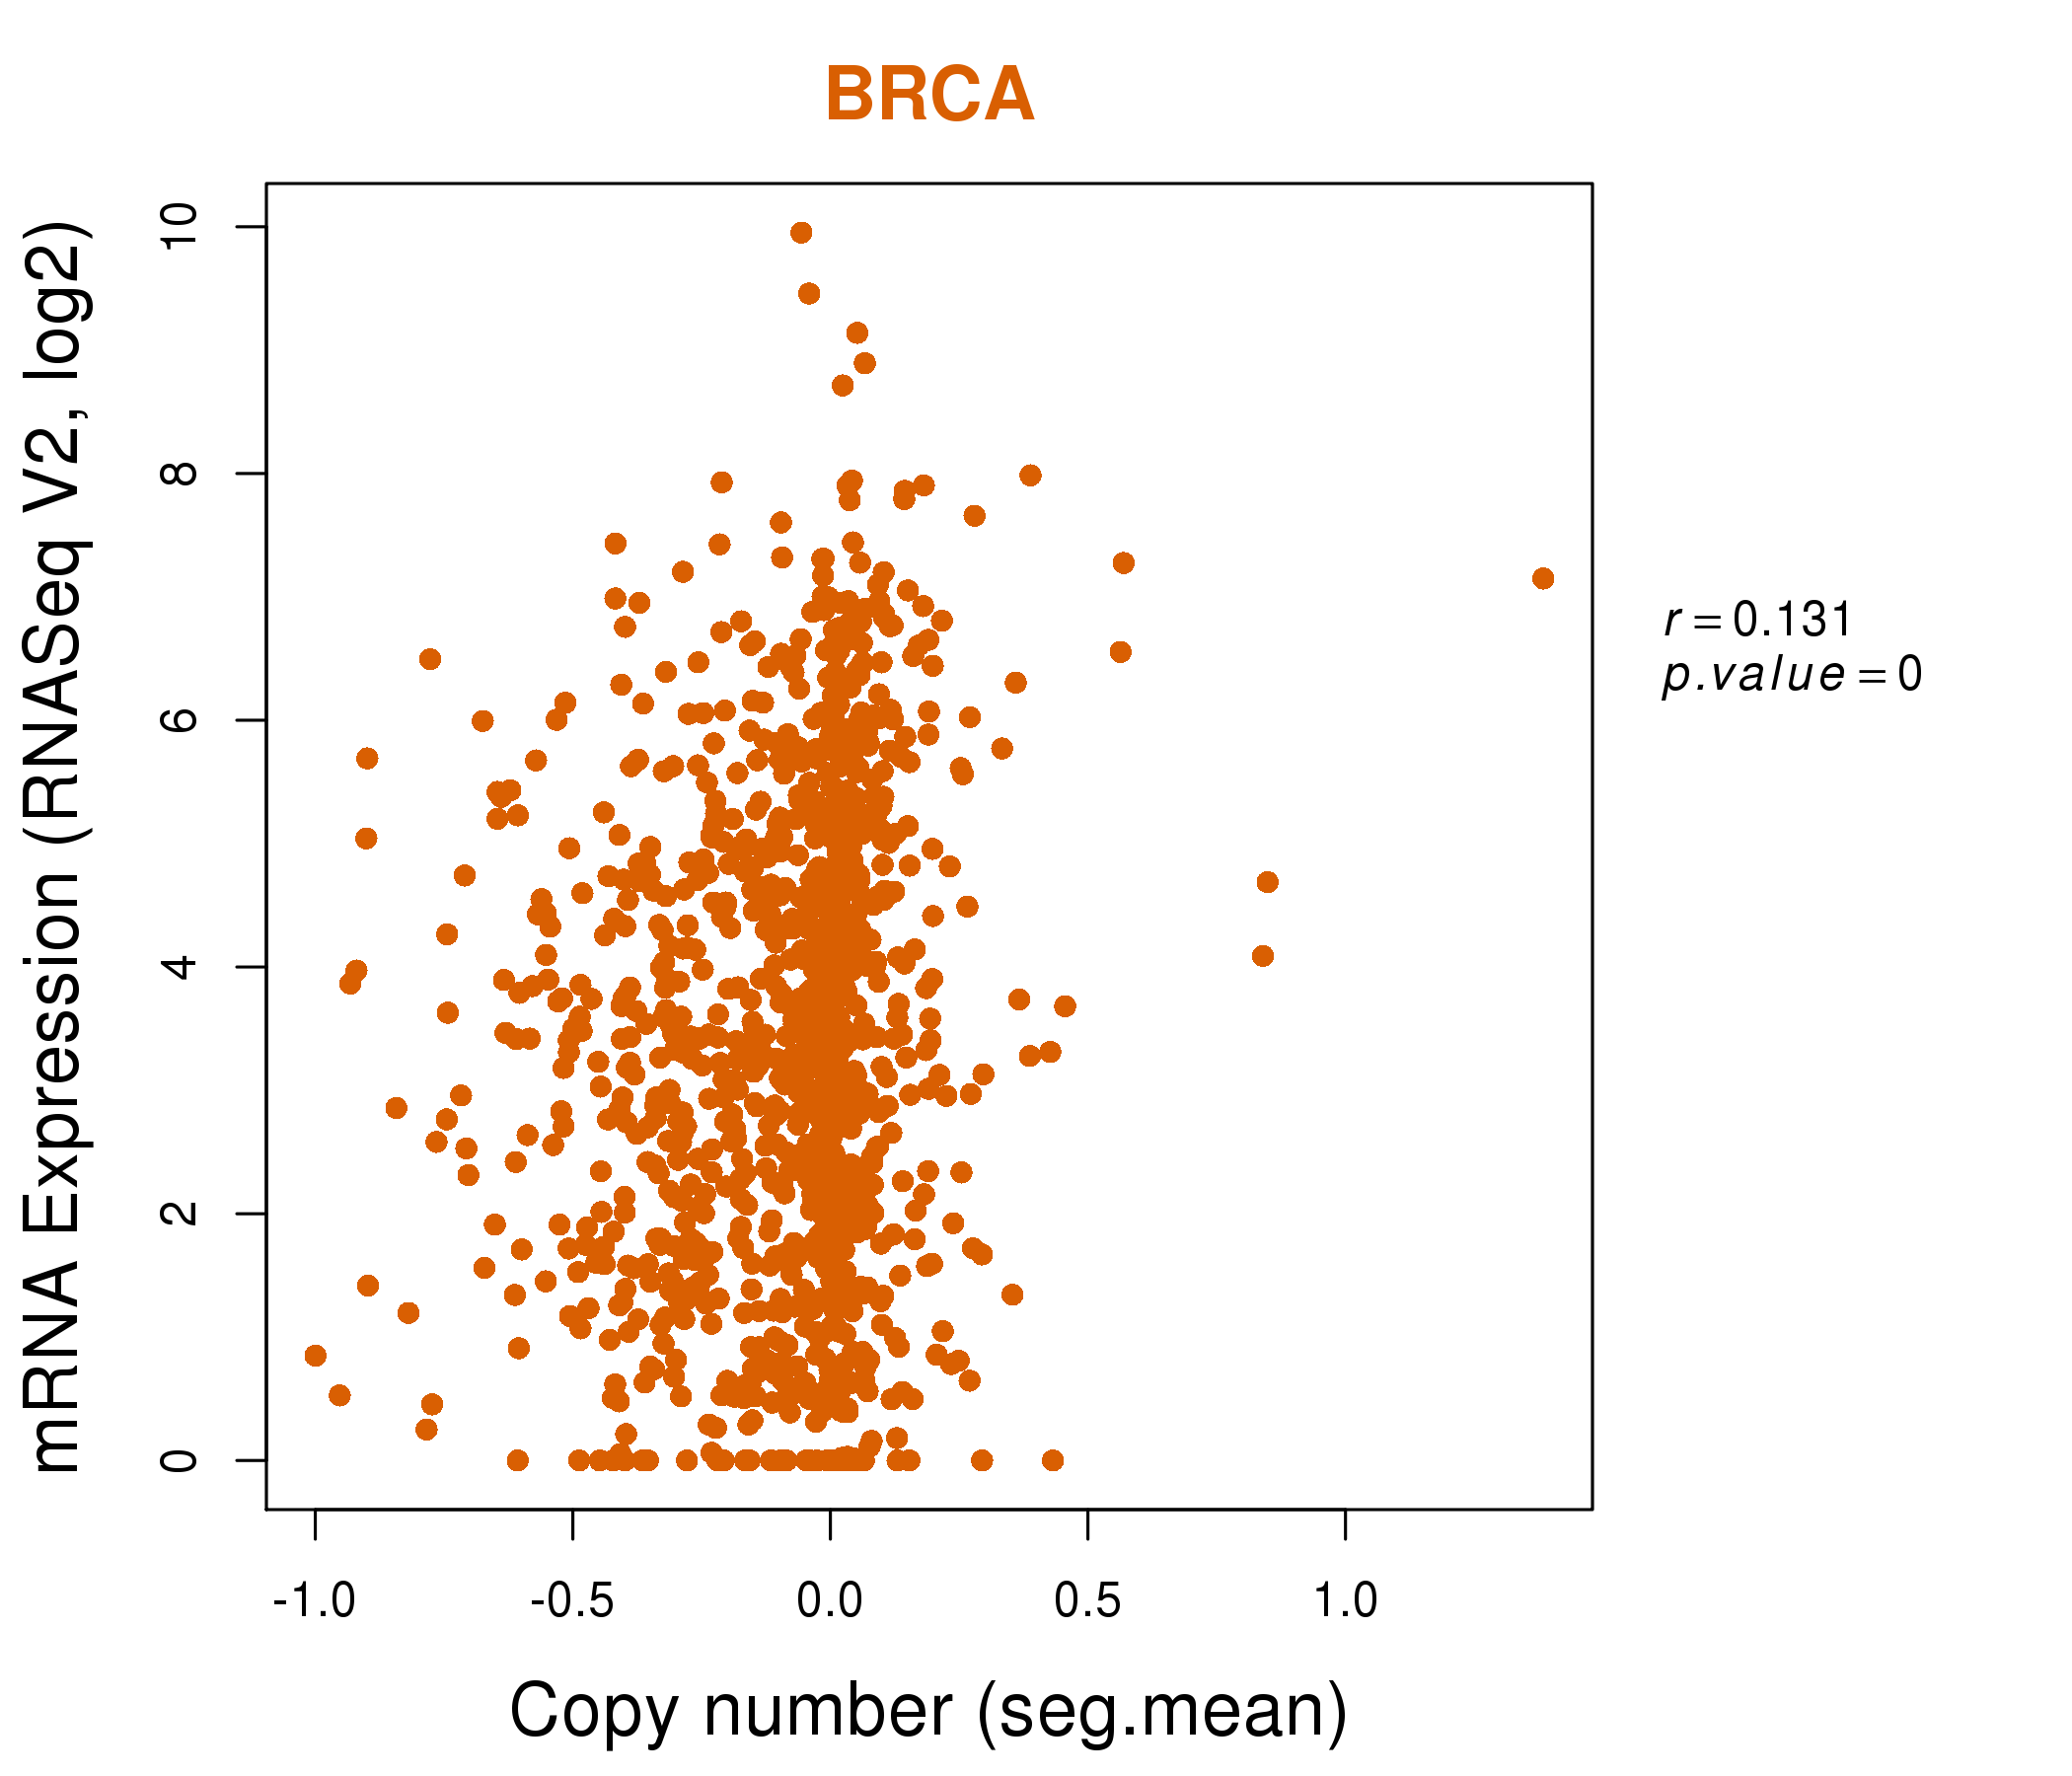
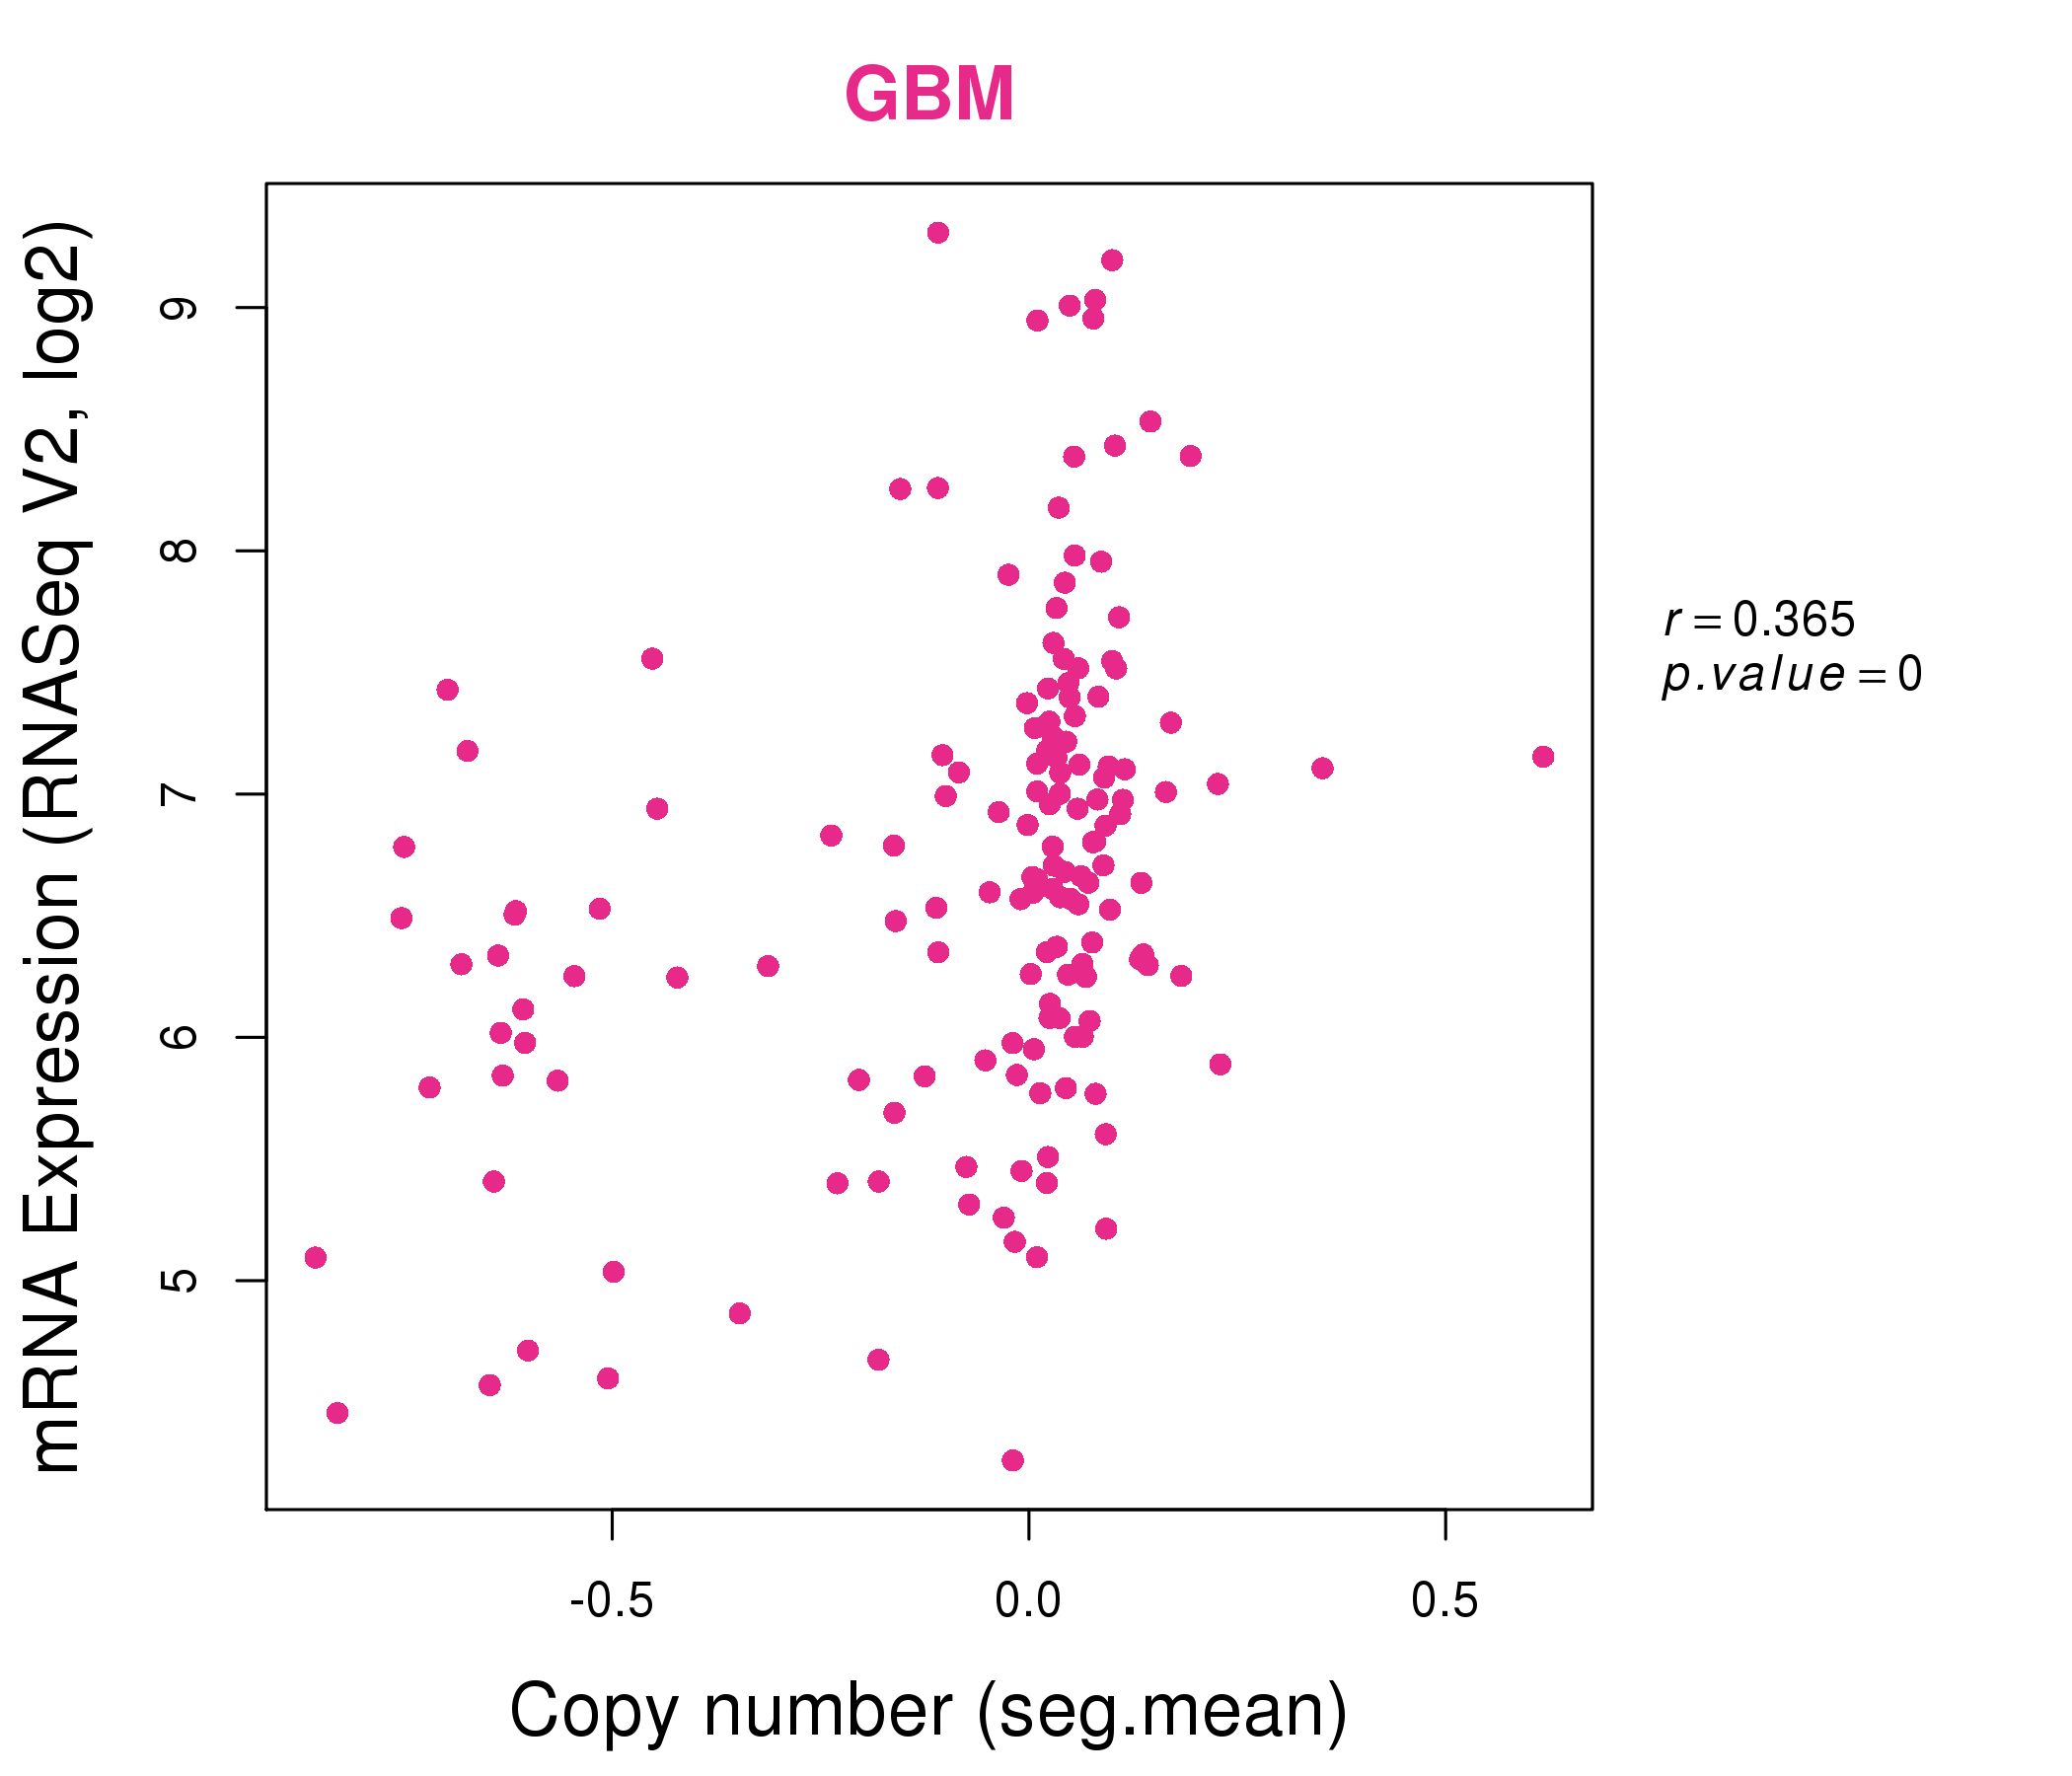
| * This plots show the correlation between CNV and gene expression. |
: Open all plots for all cancer types
 |
|
 |
|
| Top |
| Gene-Gene Network Information |
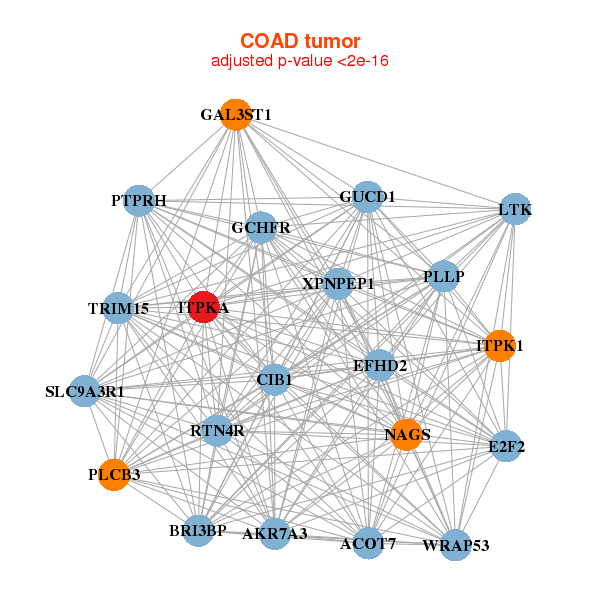
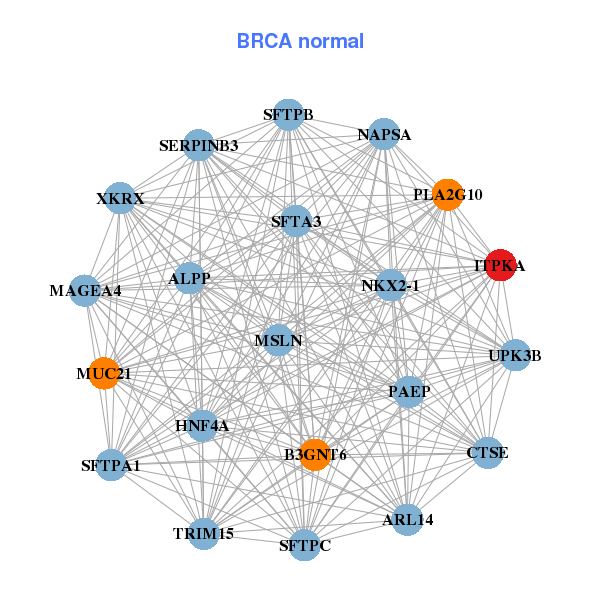
| * Co-Expression network figures were drawn using R package igraph. Only the top 20 genes with the highest correlations were shown. Red circle: input gene, orange circle: cell metabolism gene, sky circle: other gene |
: Open all plots for all cancer types
 |
| ||||
| BAG1,BLVRB,C15orf59,LINC00313,CRYM,EGFL7,ENTPD8, MZT2B,FAM195A,GPX4,HEXIM2,ITPKA,LOC113230,MAB21L2, P2RX4,PISD,SIGIRR,SIL1,SLC6A19,TMEM205,TSPAN1 | ALPP,ARL14,B3GNT6,CTSE,HNF4A,ITPKA,MAGEA4, MSLN,MUC21,NAPSA,NKX2-1,PAEP,PLA2G10,SERPINB3, SFTA3,SFTPA1,SFTPB,SFTPC,TRIM15,UPK3B,XKRX | ||||
 |
| ||||
| ACOT7,AKR7A3,BRI3BP,GUCD1,CIB1,E2F2,EFHD2, GAL3ST1,GCHFR,ITPK1,ITPKA,LTK,NAGS,PLCB3, PLLP,PTPRH,RTN4R,SLC9A3R1,TRIM15,WRAP53,XPNPEP1 | ACVR1B,C1orf210,CDKN2B,CTSD,EPN1,GPN2,IL17RE, ITPKA,KIAA1522,MGAT4B,NAAA,OAF,PIGS,PRKCZ, SLC26A6,SPINT1,SPIRE2,TMC4,VILL,VIPR1,VSIG10 |
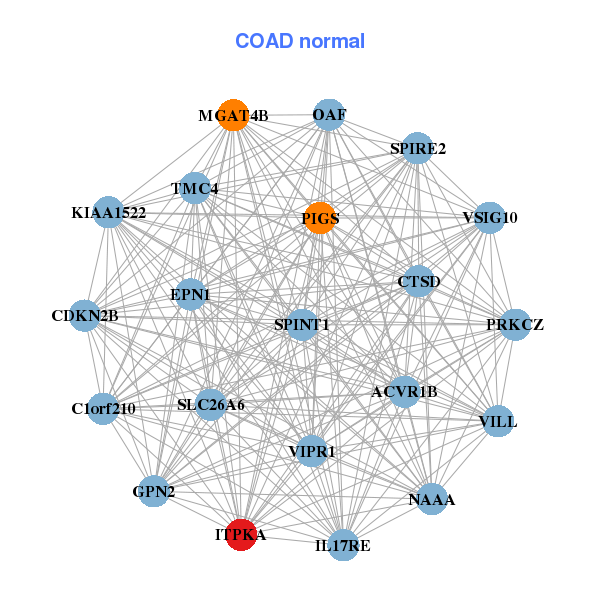
| * Co-Expression network figures were drawn using R package igraph. Only the top 20 genes with the highest correlations were shown. Red circle: input gene, orange circle: cell metabolism gene, sky circle: other gene |
: Open all plots for all cancer types
| Top |
: Open all interacting genes' information including KEGG pathway for all interacting genes from DAVID
| Top |
| Pharmacological Information for ITPKA |
| DB Category | DB Name | DB's ID and Url link |
| Chemistry | BindingDB | P23677; -. |
| Organism-specific databases | PharmGKB | PA29975; -. |
| Organism-specific databases | CTD | 3706; -. |
| * Gene Centered Interaction Network. |
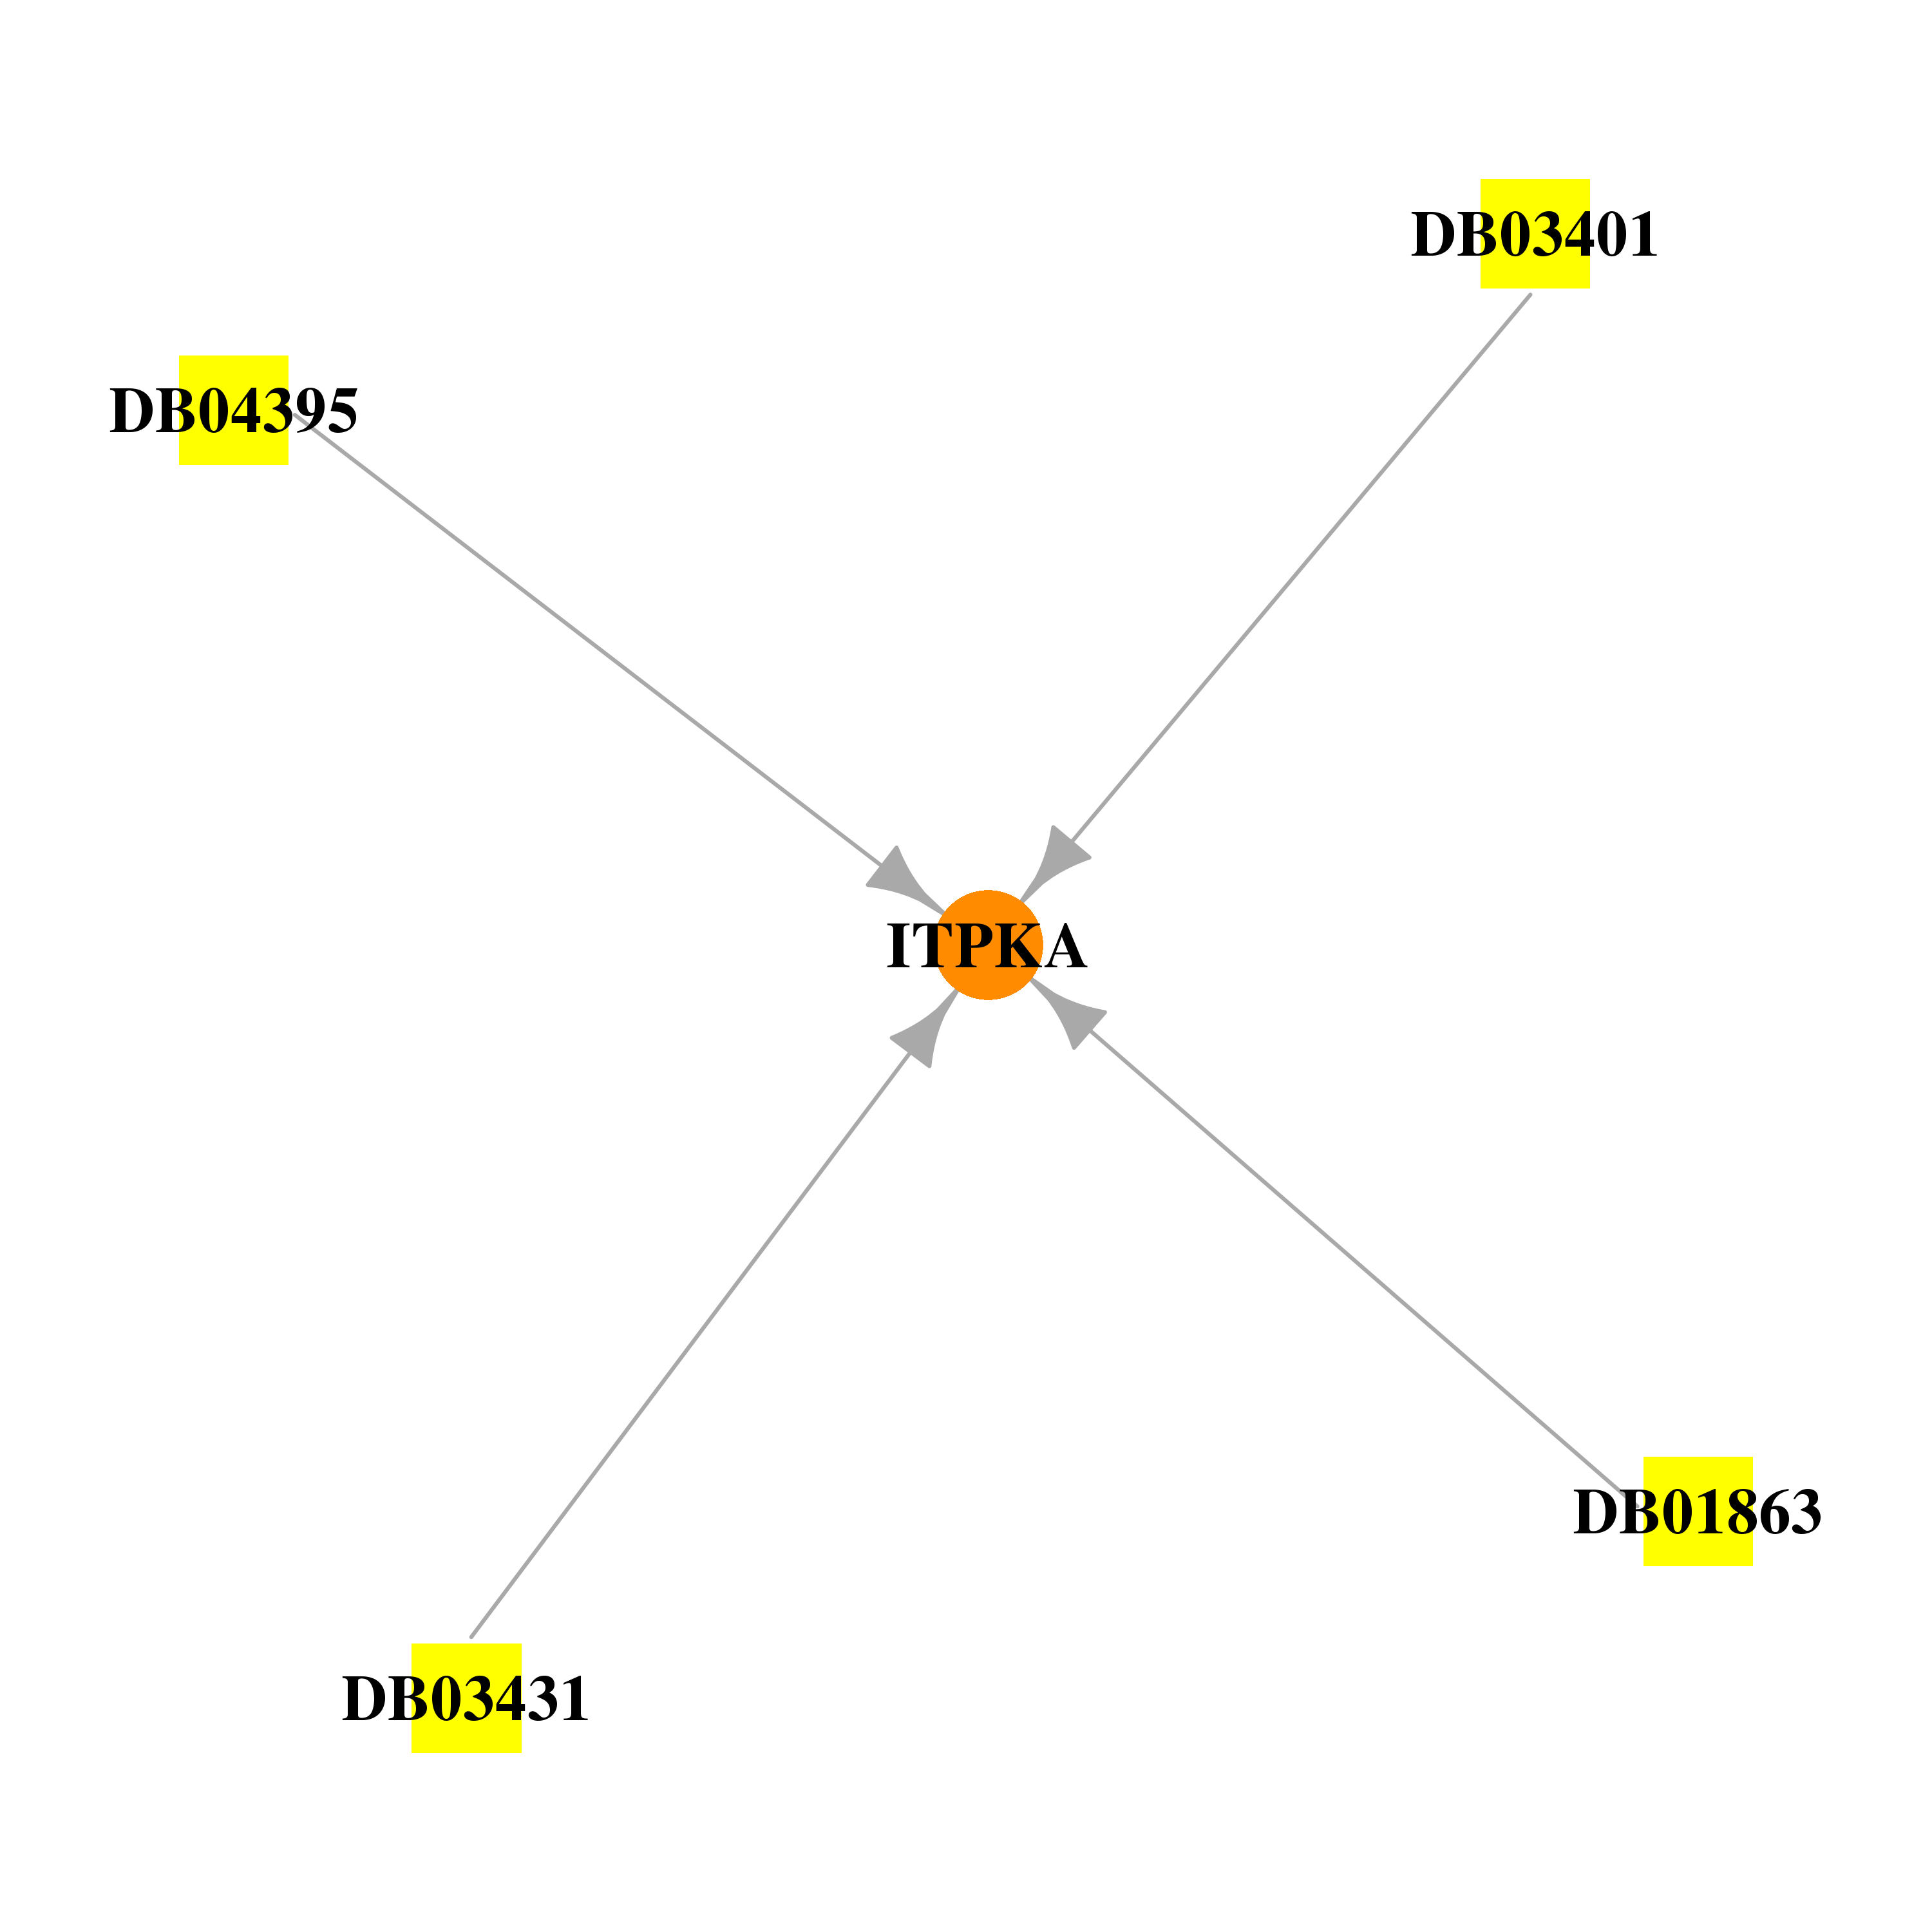 |
| * Drug Centered Interaction Network. |
| DrugBank ID | Target Name | Drug Groups | Generic Name | Drug Centered Network | Drug Structure |
| DB01863 | inositol-trisphosphate 3-kinase A | experimental | Inositol 1,3,4,5-Tetrakisphosphate | 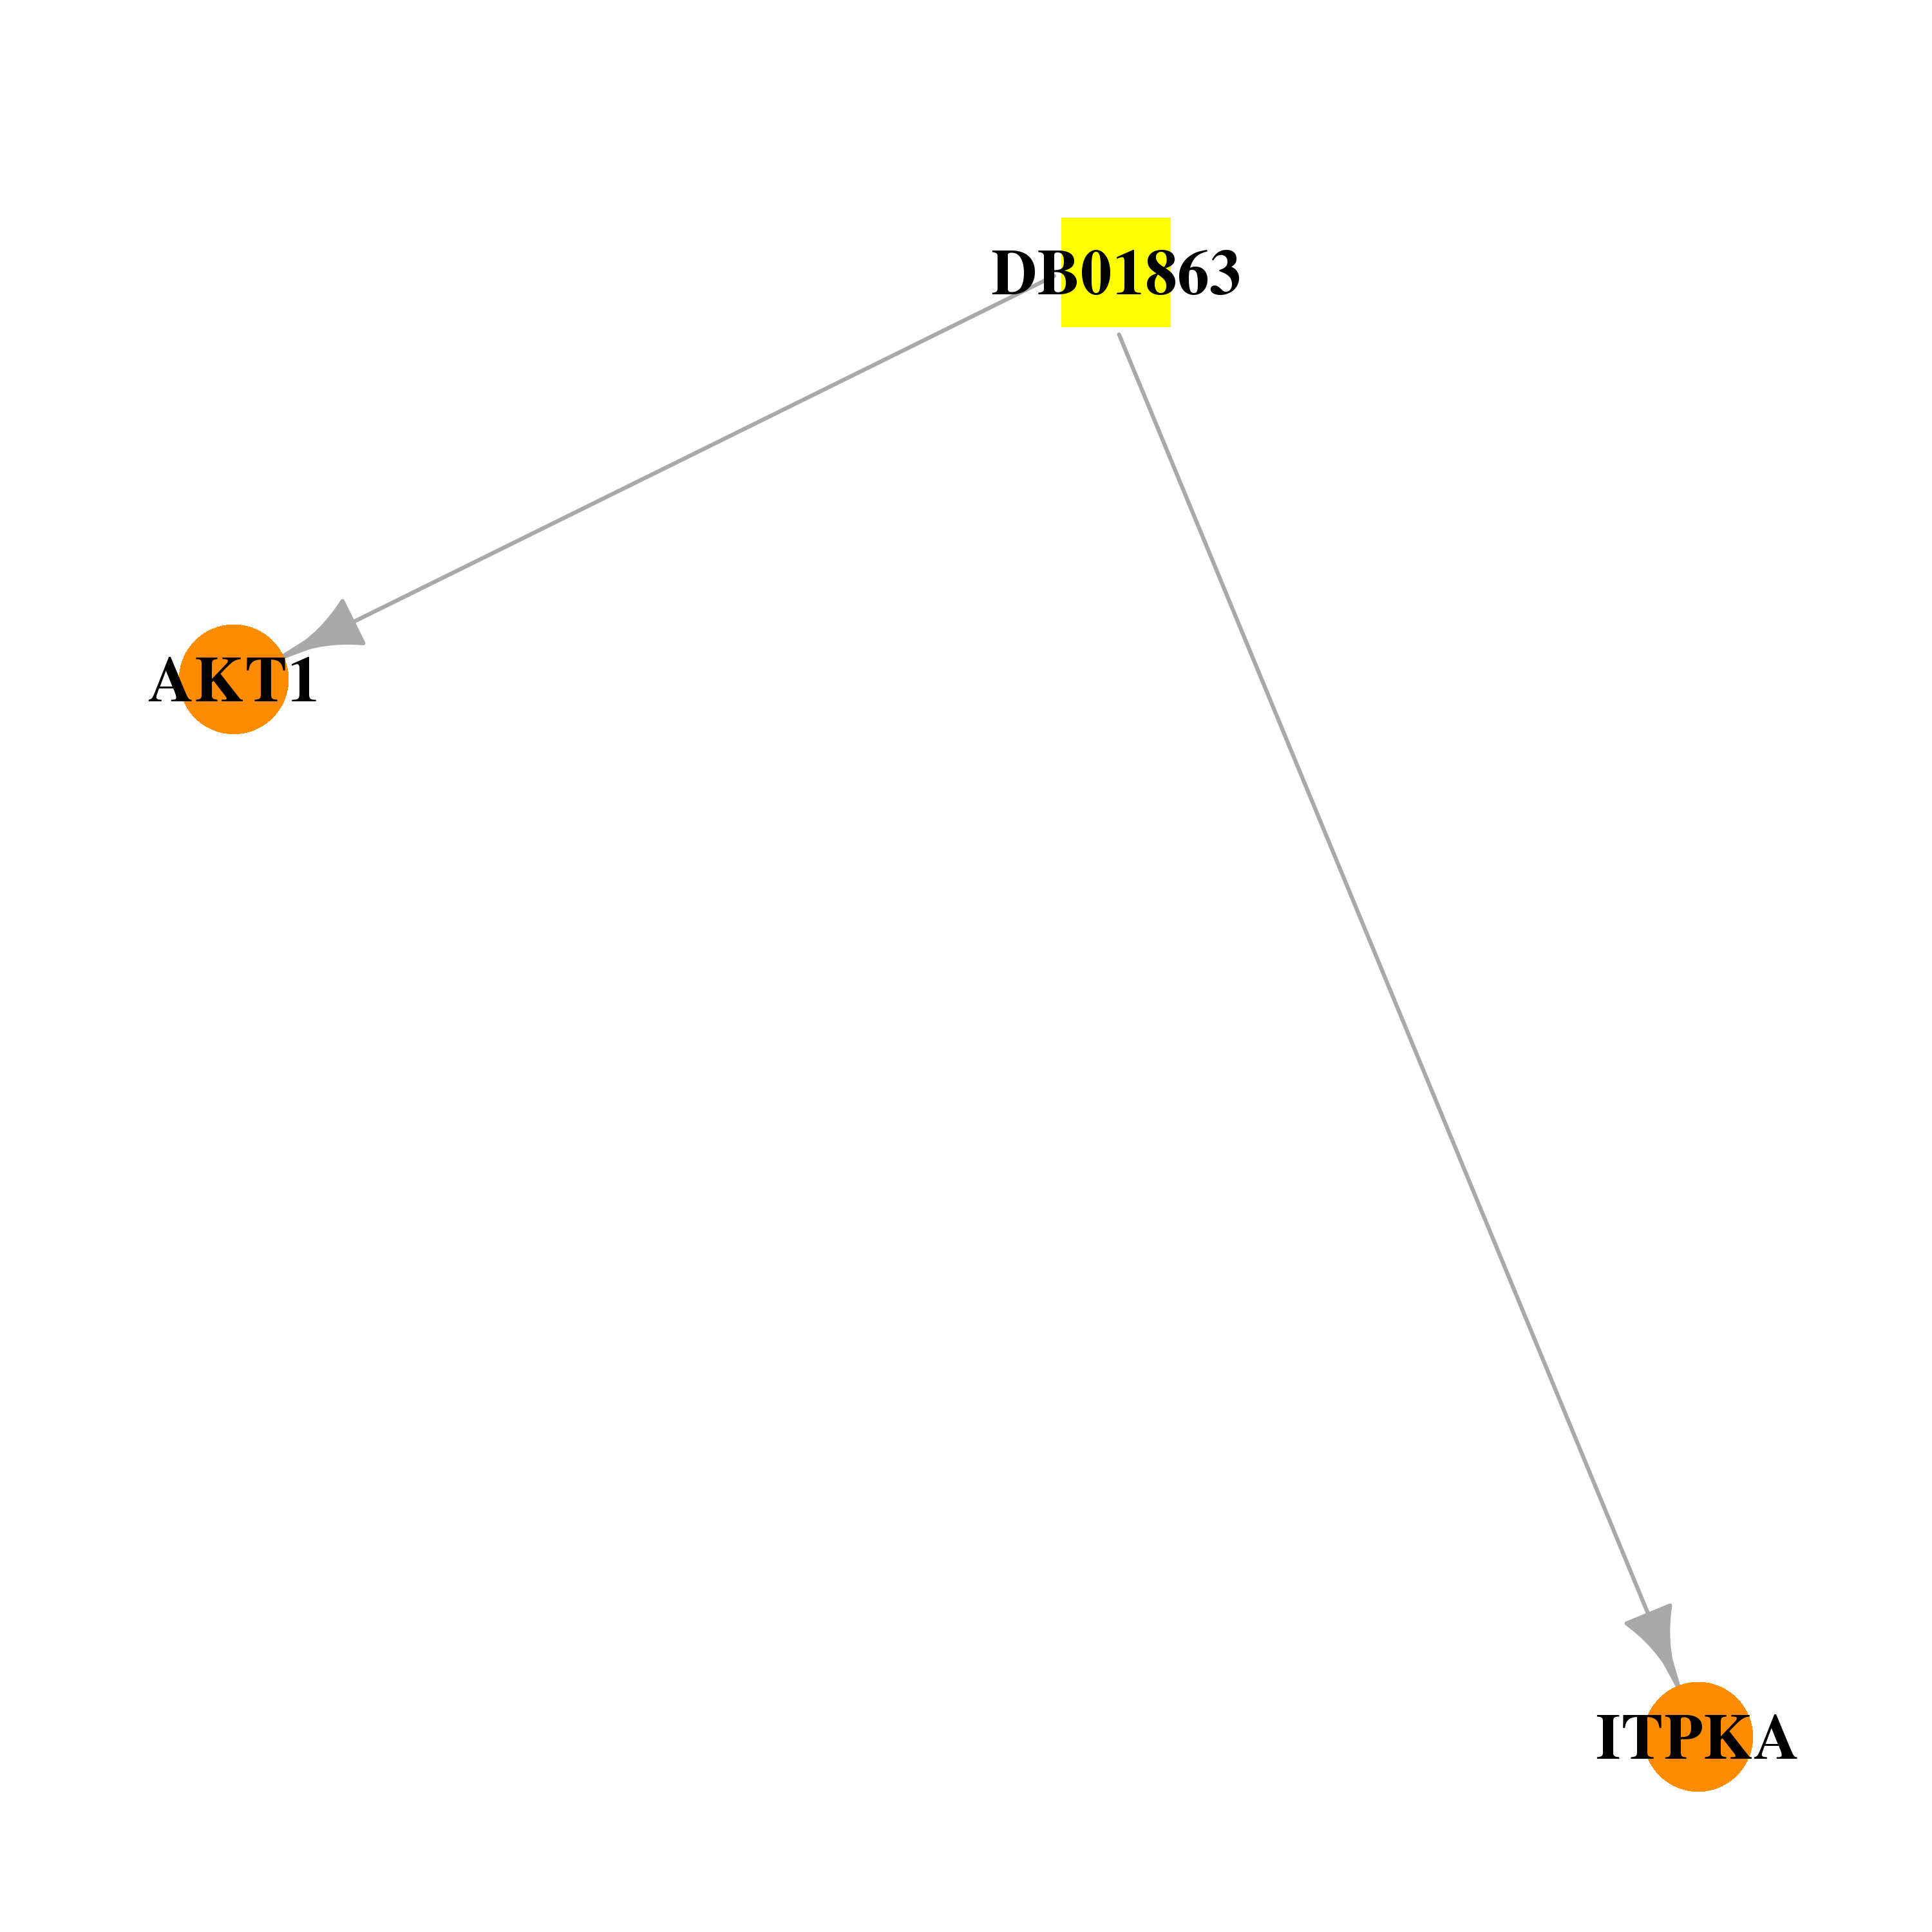 | 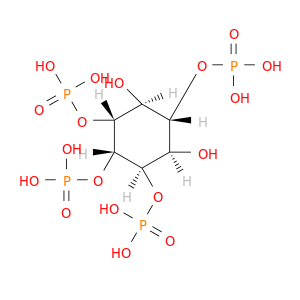 |
| DB03401 | inositol-trisphosphate 3-kinase A | experimental | D-Myo-Inositol-1,4,5-Triphosphate | 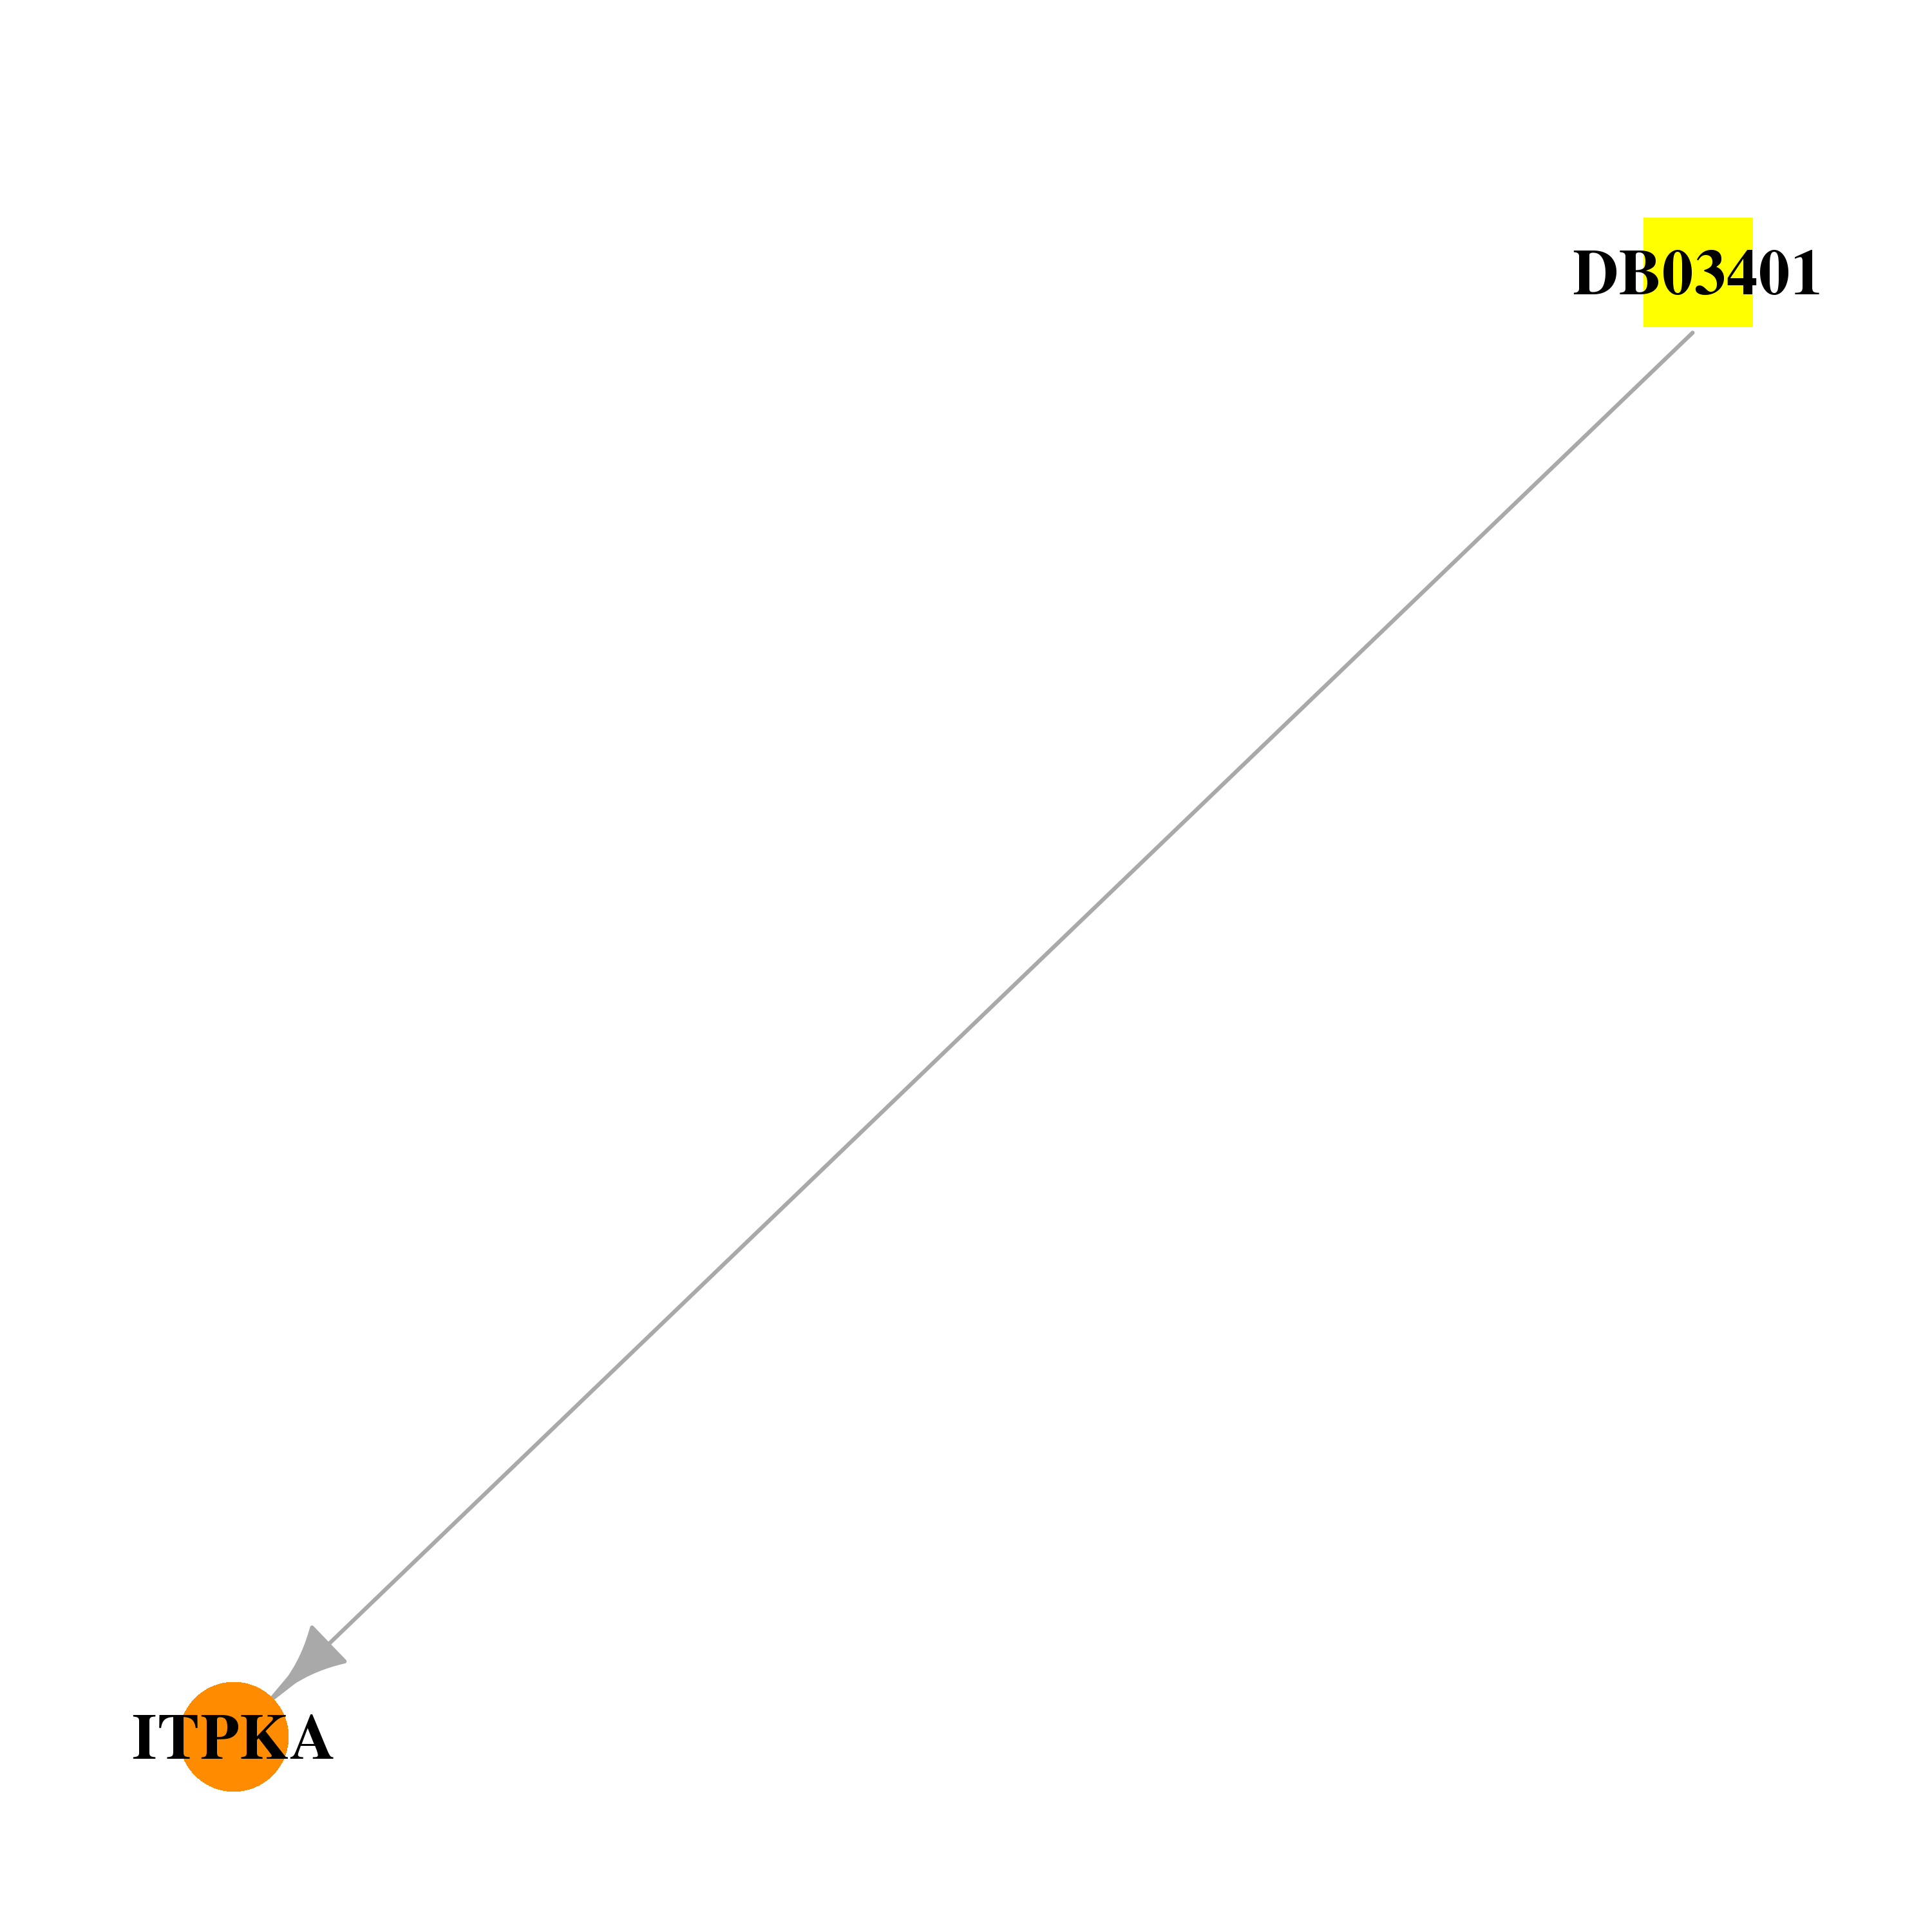 | 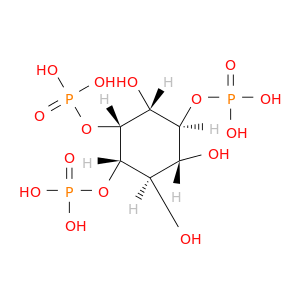 |
| DB03431 | inositol-trisphosphate 3-kinase A | experimental | Adenosine-5'-Diphosphate | 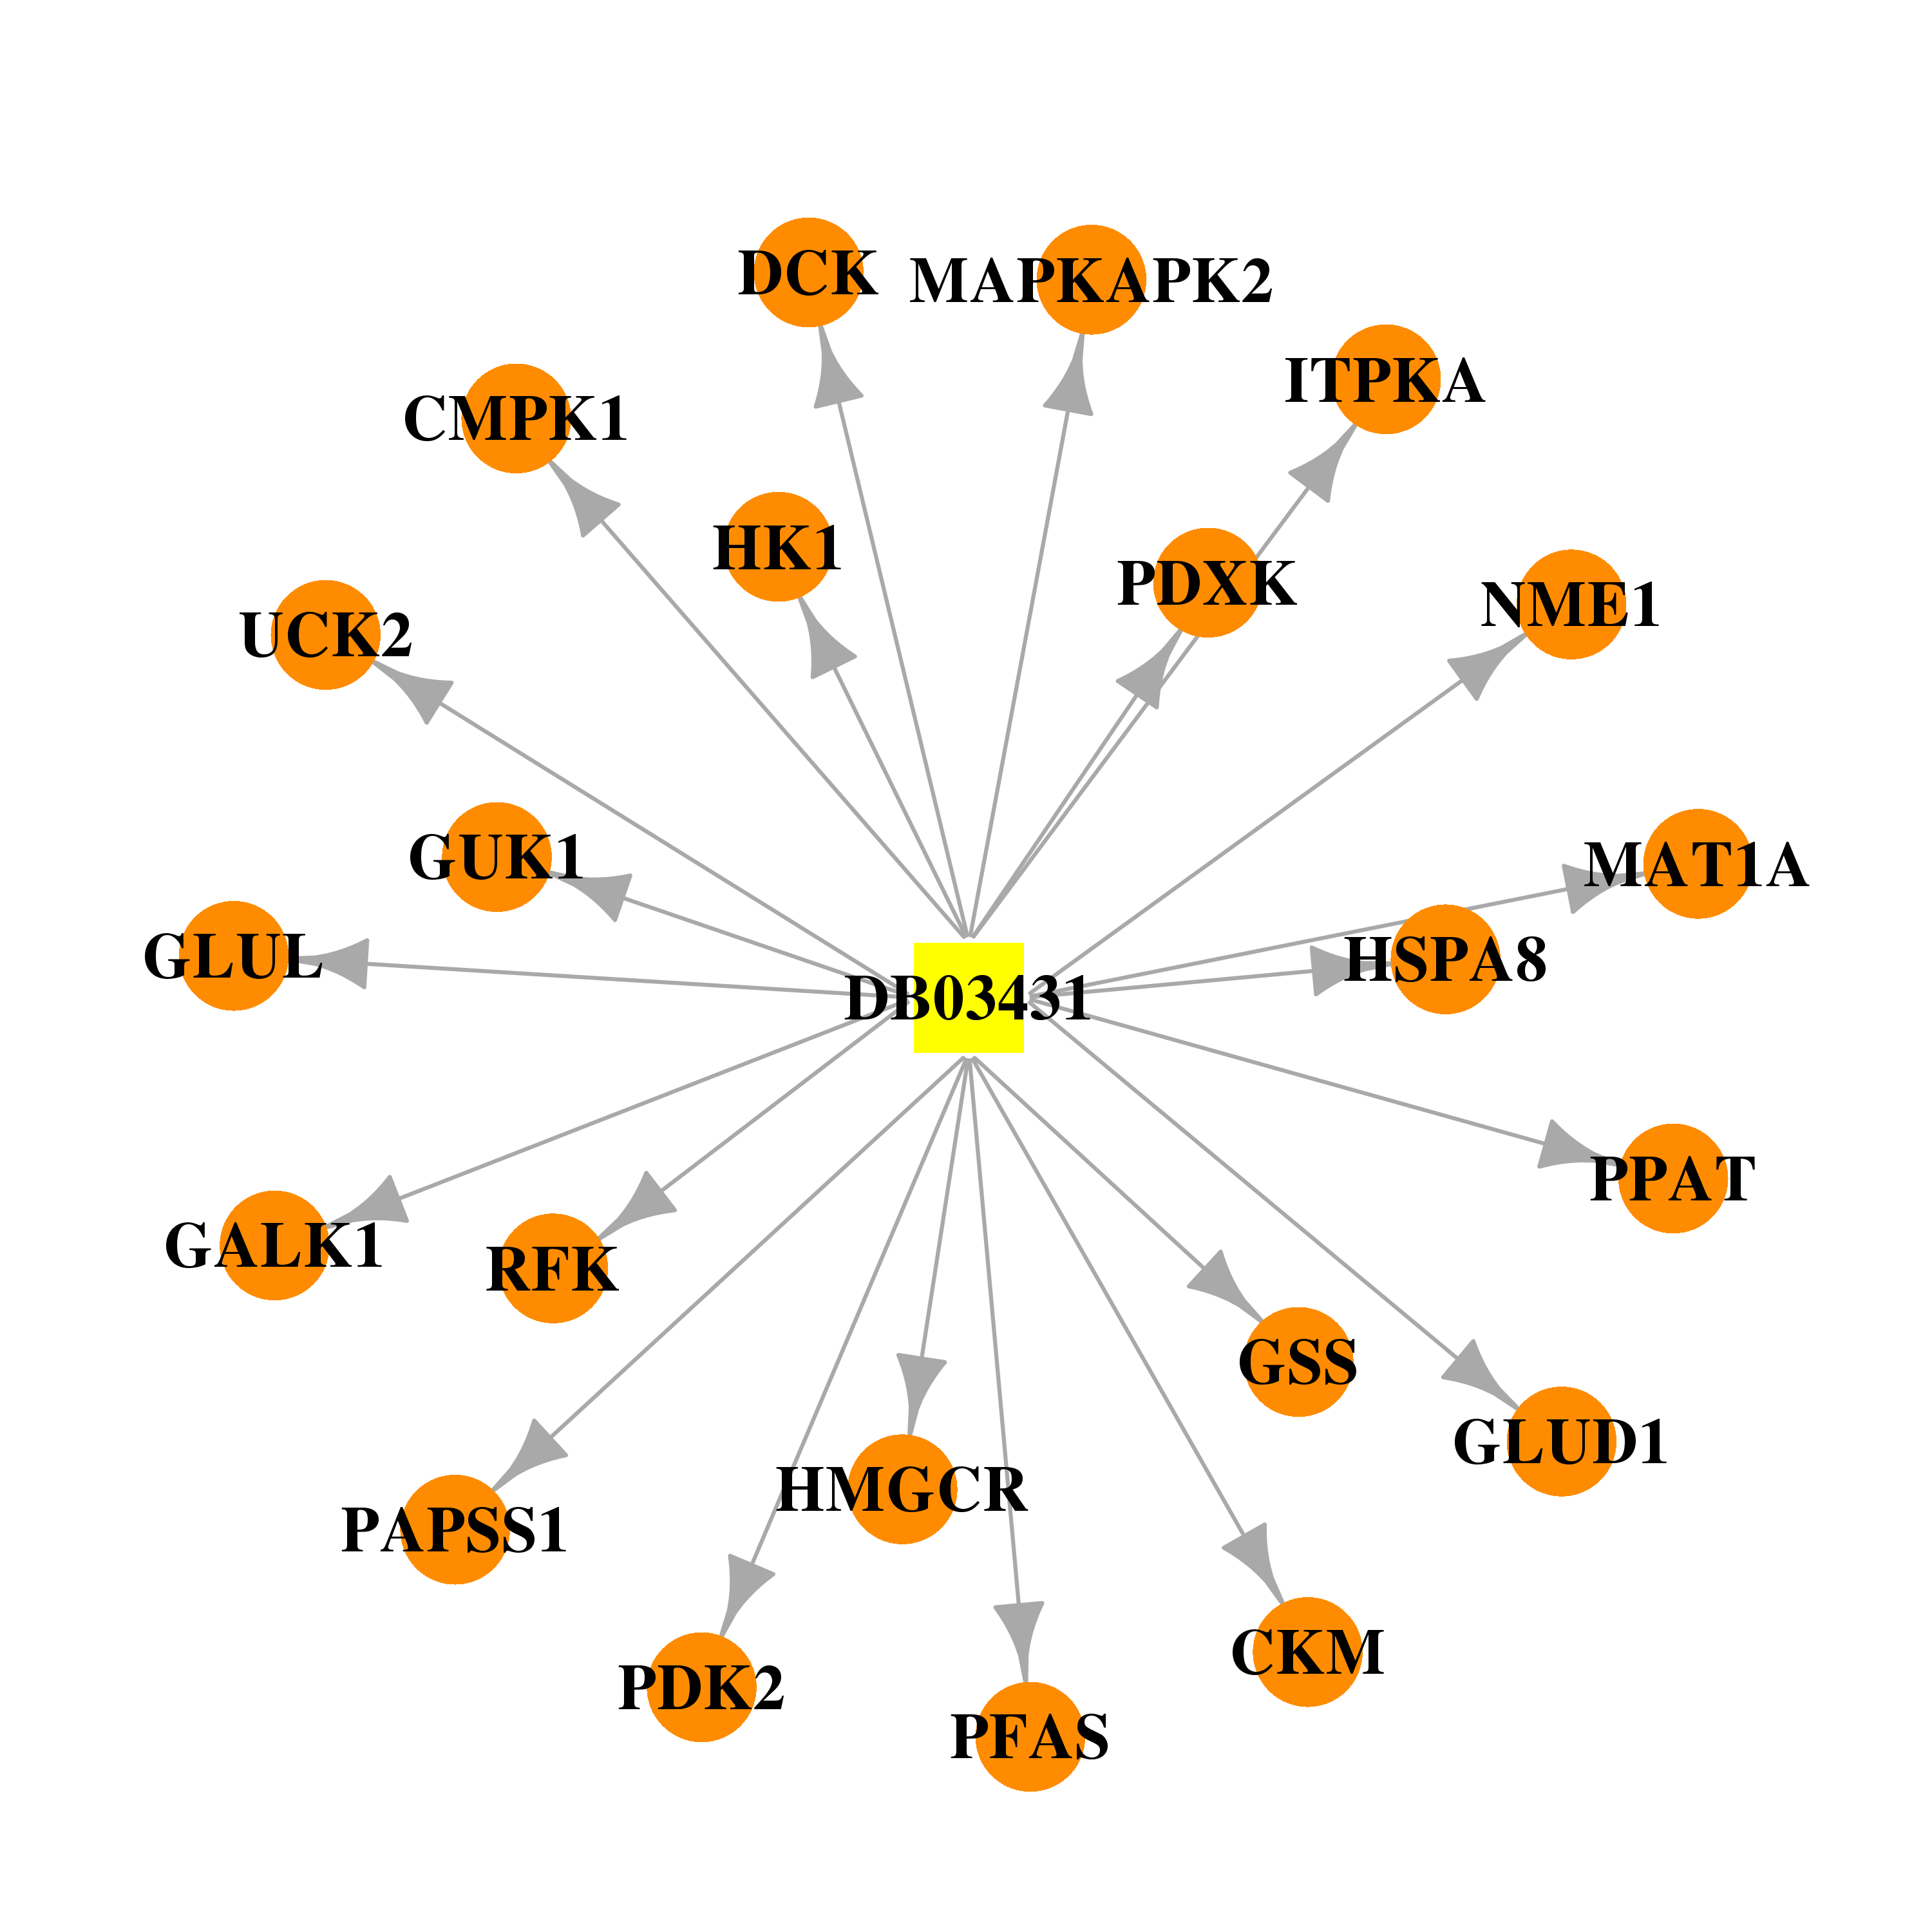 | 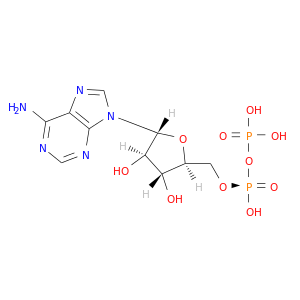 |
| DB04395 | inositol-trisphosphate 3-kinase A | experimental | Phosphoaminophosphonic Acid-Adenylate Ester | 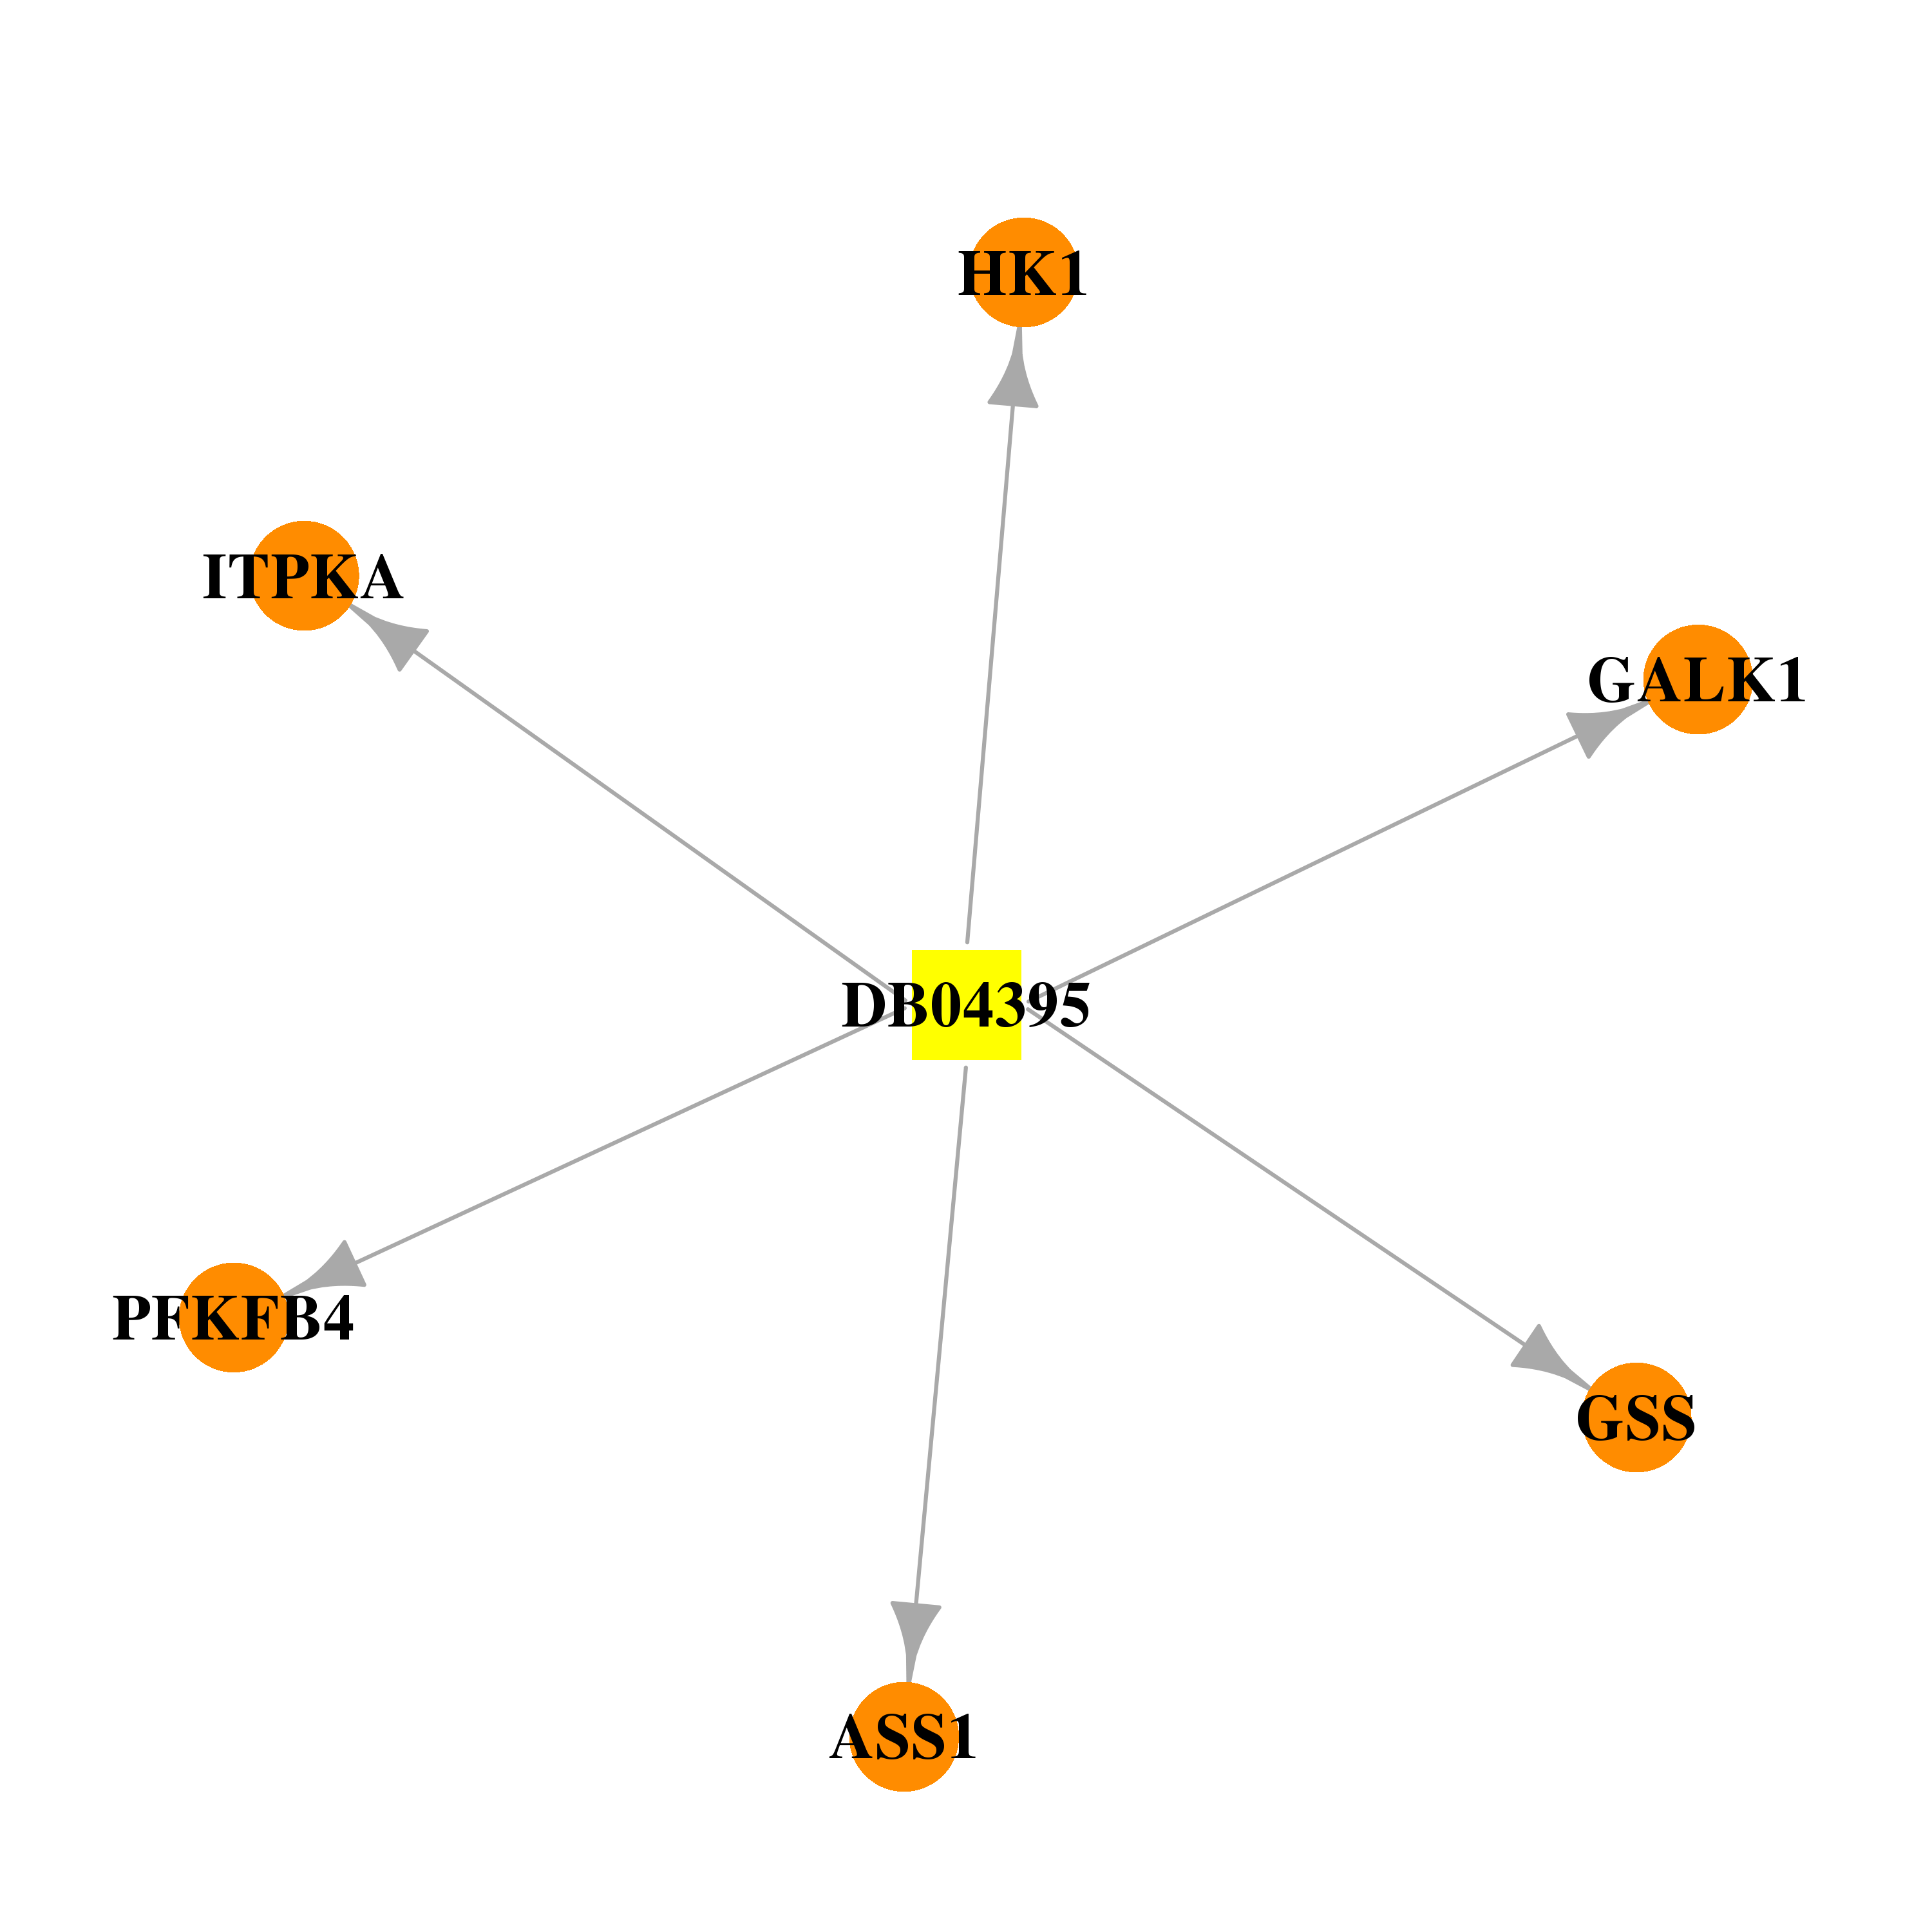 | 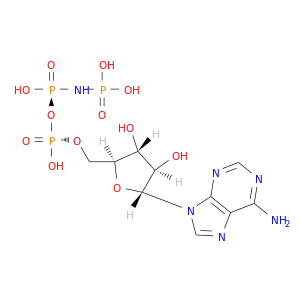 |
| Top |
| Cross referenced IDs for ITPKA |
| * We obtained these cross-references from Uniprot database. It covers 150 different DBs, 18 categories. http://www.uniprot.org/help/cross_references_section |
: Open all cross reference information
|
Copyright © 2016-Present - The Univsersity of Texas Health Science Center at Houston @ |