|
||||||||||||||||||||||||||||||||||||||||||||||||||||||||||||||||||||||||||||||||||||||||||||||||||||||||||||||||||||||||||||||||||||||||||||||||||||||||||||||||||||||||||||||||||||||||||||||||||||||||||||||||||||||||||||||||||||||||||||||||||||||||||||||||||||||||||||||||||||||||||||||||||||||||||||||||||||||||||
| |
| Phenotypic Information (metabolism pathway, cancer, disease, phenome) |
| |
| |
| Gene-Gene Network Information: Co-Expression Network, Interacting Genes & KEGG |
| |
|


| Gene Summary for ITPKB |
| Basic gene info. | Gene symbol | ITPKB |
| Gene name | inositol-trisphosphate 3-kinase B | |
| Synonyms | IP3-3KB|IP3K|IP3K-B|IP3KB|PIG37 | |
| Cytomap | UCSC genome browser: 1q42.13 | |
| Genomic location | chr1 :226819390-226926876 | |
| Type of gene | protein-coding | |
| RefGenes | NM_002221.3, | |
| Ensembl id | ENSG00000143772 | |
| Description | IP3 3-kinase BIP3K Binositol 1,4,5-trisphosphate 3-kinase BinsP 3-kinase Bproliferation-inducing protein 37 | |
| Modification date | 20141207 | |
| dbXrefs | MIM : 147522 | |
| HGNC : HGNC | ||
| Ensembl : ENSG00000143772 | ||
| HPRD : 00942 | ||
| Vega : OTTHUMG00000037582 | ||
| Protein | UniProt: P27987 go to UniProt's Cross Reference DB Table | |
| Expression | CleanEX: HS_ITPKB | |
| BioGPS: 3707 | ||
| Gene Expression Atlas: ENSG00000143772 | ||
| The Human Protein Atlas: ENSG00000143772 | ||
| Pathway | NCI Pathway Interaction Database: ITPKB | |
| KEGG: ITPKB | ||
| REACTOME: ITPKB | ||
| ConsensusPathDB | ||
| Pathway Commons: ITPKB | ||
| Metabolism | MetaCyc: ITPKB | |
| HUMANCyc: ITPKB | ||
| Regulation | Ensembl's Regulation: ENSG00000143772 | |
| miRBase: chr1 :226,819,390-226,926,876 | ||
| TargetScan: NM_002221 | ||
| cisRED: ENSG00000143772 | ||
| Context | iHOP: ITPKB | |
| cancer metabolism search in PubMed: ITPKB | ||
| UCL Cancer Institute: ITPKB | ||
| Assigned class in ccmGDB | A - This gene has a literature evidence and it belongs to cancer gene. | |
| References showing role of ITPKB in cancer cell metabolism | 1. Sumantran VN, Mishra P, Sudhakar N (2015) Microarray analysis of differentially expressed genes regulating lipid metabolism during melanoma progression. Indian J Biochem Biophys 52: 125-131. go to article 2. Hoofd C, Devreker F, Deneubourg L, Deleu S, Nguyen TM, et al. (2012) A specific increase in inositol 1,4,5-trisphosphate 3-kinase B expression upon differentiation of human embryonic stem cells. Cell Signal 24: 1461-1470. doi: 10.1016/j.cellsig.2012.03.006. go to article | |
| Top |
| Phenotypic Information for ITPKB(metabolism pathway, cancer, disease, phenome) |
| Cancer | CGAP: ITPKB |
| Familial Cancer Database: ITPKB | |
| * This gene is included in those cancer gene databases. |
|
|
|
|
|
|
| ||||||||||||||||||||||||||||||||||||||||||||||||||||||||||||||||||||||||||||||||||||||||||||||||||||||||||||||||||||||||||||||||||||||||||||||||||||||||||||||||||||||||||||||||||||||||||||||||||||||||||||||||||||||||||||||||||||||||||||||||||||||||||||||||||||||||||||||||||||||||||||||||||||||||||||||||||||
Oncogene 1 | Significant driver gene in DLBCL 6, | |||||||||||||||||||||||||||||||||||||||||||||||||||||||||||||||||||||||||||||||||||||||||||||||||||||||||||||||||||||||||||||||||||||||||||||||||||||||||||||||||||||||||||||||||||||||||||||||||||||||||||||||||||||||||||||||||||||||||||||||||||||||||||||||||||||||||||||||||||||||||||||||||||||||||||||||||||||||||
| cf) number; DB name 1 Oncogene; http://nar.oxfordjournals.org/content/35/suppl_1/D721.long, 2 Tumor Suppressor gene; https://bioinfo.uth.edu/TSGene/, 3 Cancer Gene Census; http://www.nature.com/nrc/journal/v4/n3/abs/nrc1299.html, 4 CancerGenes; http://nar.oxfordjournals.org/content/35/suppl_1/D721.long, 5 Network of Cancer Gene; http://ncg.kcl.ac.uk/index.php, 6 http://www.nature.com/nature/journal/v505/n7484/full/nature12912.html, 7Therapeutic Vulnerabilities in Cancer; http://cbio.mskcc.org/cancergenomics/statius/ |
| KEGG_INOSITOL_PHOSPHATE_METABOLISM | |
| OMIM | 147522; gene. |
| Orphanet | |
| Disease | KEGG Disease: ITPKB |
| MedGen: ITPKB (Human Medical Genetics with Condition) | |
| ClinVar: ITPKB | |
| Phenotype | MGI: ITPKB (International Mouse Phenotyping Consortium) |
| PhenomicDB: ITPKB | |
| Mutations for ITPKB |
| * Under tables are showing count per each tissue to give us broad intuition about tissue specific mutation patterns.You can go to the detailed page for each mutation database's web site. |
| - Statistics for Tissue and Mutation type | Top |
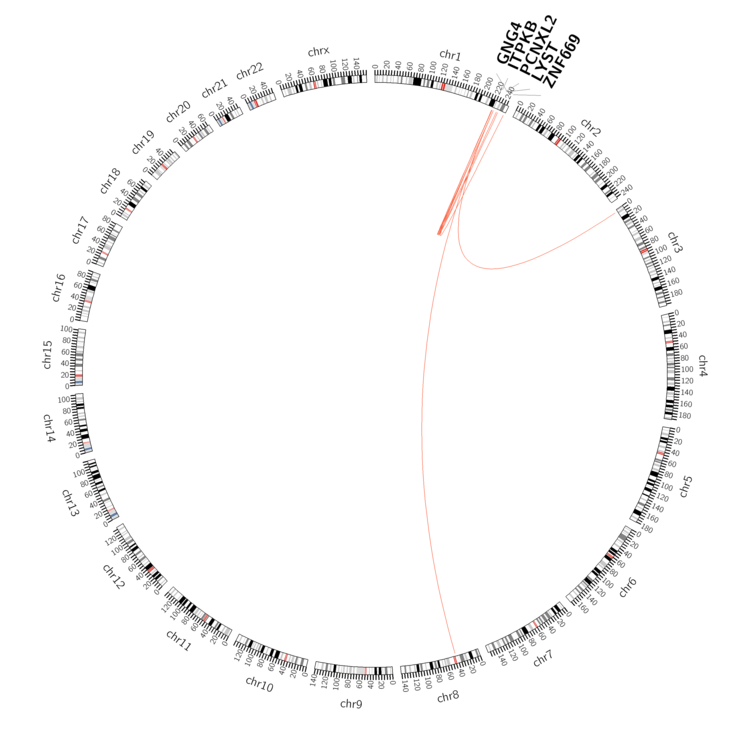 |
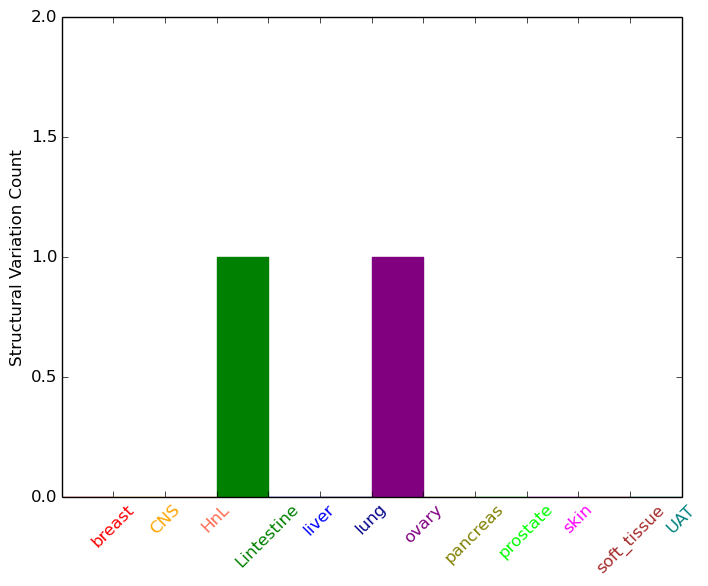
| - For Inter-chromosomal Variations |
| * Inter-chromosomal variantions includes 'interchromosomal amplicon to amplicon', 'interchromosomal amplicon to non-amplified dna', 'interchromosomal insertion', 'Interchromosomal unknown type'. |
 |
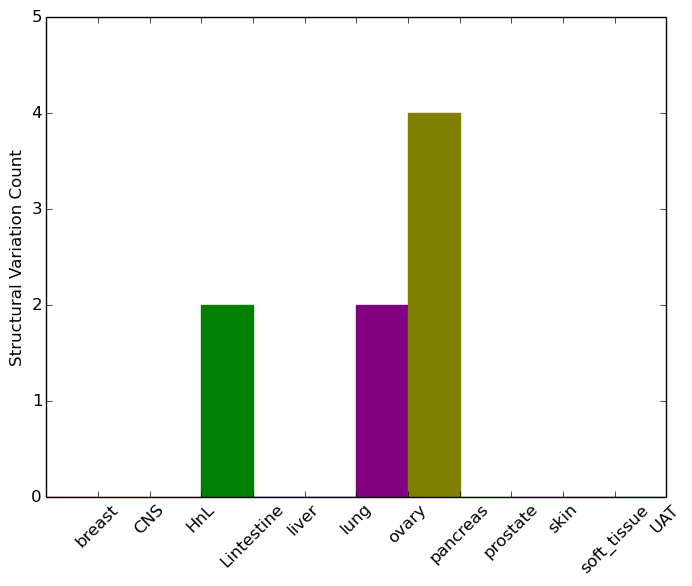
| - For Intra-chromosomal Variations |
| * Intra-chromosomal variantions includes 'intrachromosomal amplicon to amplicon', 'intrachromosomal amplicon to non-amplified dna', 'intrachromosomal deletion', 'intrachromosomal fold-back inversion', 'intrachromosomal inversion', 'intrachromosomal tandem duplication', 'Intrachromosomal unknown type', 'intrachromosomal with inverted orientation', 'intrachromosomal with non-inverted orientation'. |
 |
| Sample | Symbol_a | Chr_a | Start_a | End_a | Symbol_b | Chr_b | Start_b | End_b |
| large_intestine | ITPKB | chr1 | 226820468 | 226820468 | chr3 | 3746322 | 3746322 | |
| large_intestine | ITPKB | chr1 | 226878767 | 226878767 | LYST | chr1 | 235842628 | 235842628 |
| large_intestine | ITPKB | chr1 | 226878902 | 226878902 | GNG4 | chr1 | 235803414 | 235803414 |
| ovary | ITPKB | chr1 | 226897363 | 226897383 | chr8 | 42516363 | 42516383 | |
| ovary | ITPKB | chr1 | 226908328 | 226908348 | ITPKB | chr1 | 226909237 | 226909257 |
| ovary | ITPKB | chr1 | 226923887 | 226923907 | ZNF669 | chr1 | 247266415 | 247266435 |
| pancreas | ITPKB | chr1 | 226872505 | 226872705 | chr1 | 224179464 | 224179664 | |
| pancreas | ITPKB | chr1 | 226877643 | 226877663 | PCNXL2 | chr1 | 233195229 | 233195249 |
| pancreas | ITPKB | chr1 | 226891054 | 226891074 | chr1 | 223589077 | 223589097 | |
| pancreas | ITPKB | chr1 | 226924906 | 226924926 | ITPKB | chr1 | 226924971 | 226924991 |
| cf) Tissue number; Tissue name (1;Breast, 2;Central_nervous_system, 3;Haematopoietic_and_lymphoid_tissue, 4;Large_intestine, 5;Liver, 6;Lung, 7;Ovary, 8;Pancreas, 9;Prostate, 10;Skin, 11;Soft_tissue, 12;Upper_aerodigestive_tract) |
| * From mRNA Sanger sequences, Chitars2.0 arranged chimeric transcripts. This table shows ITPKB related fusion information. |
| ID | Head Gene | Tail Gene | Accession | Gene_a | qStart_a | qEnd_a | Chromosome_a | tStart_a | tEnd_a | Gene_a | qStart_a | qEnd_a | Chromosome_a | tStart_a | tEnd_a |
| BU155062 | ITPKB | 49 | 129 | 1 | 226819575 | 226819655 | ITPKB | 128 | 329 | 1 | 226819391 | 226819593 | |
| AW965410 | NFKB1 | 1 | 290 | 4 | 103500096 | 103504106 | ITPKB | 289 | 629 | 1 | 226819401 | 226819743 | |
| DB347287 | PNO1 | 1 | 423 | 2 | 68402659 | 68403089 | ITPKB | 420 | 506 | 1 | 226851529 | 226851615 | |
| BQ338653 | UNC80 | 15 | 106 | 2 | 210682535 | 210682626 | ITPKB | 96 | 296 | 1 | 226820241 | 226820442 | |
| BF734773 | KANSL3 | 15 | 127 | 2 | 97259164 | 97259279 | ITPKB | 124 | 179 | 1 | 226819390 | 226819445 | |
| Top |
| Mutation type/ Tissue ID | brca | cns | cerv | endome | haematopo | kidn | Lintest | liver | lung | ns | ovary | pancre | prost | skin | stoma | thyro | urina | |||
| Total # sample | 1 | |||||||||||||||||||
| GAIN (# sample) | 1 | |||||||||||||||||||
| LOSS (# sample) |
| cf) Tissue ID; Tissue type (1; Breast, 2; Central_nervous_system, 3; Cervix, 4; Endometrium, 5; Haematopoietic_and_lymphoid_tissue, 6; Kidney, 7; Large_intestine, 8; Liver, 9; Lung, 10; NS, 11; Ovary, 12; Pancreas, 13; Prostate, 14; Skin, 15; Stomach, 16; Thyroid, 17; Urinary_tract) |
| Top |
|
 |
| Top |
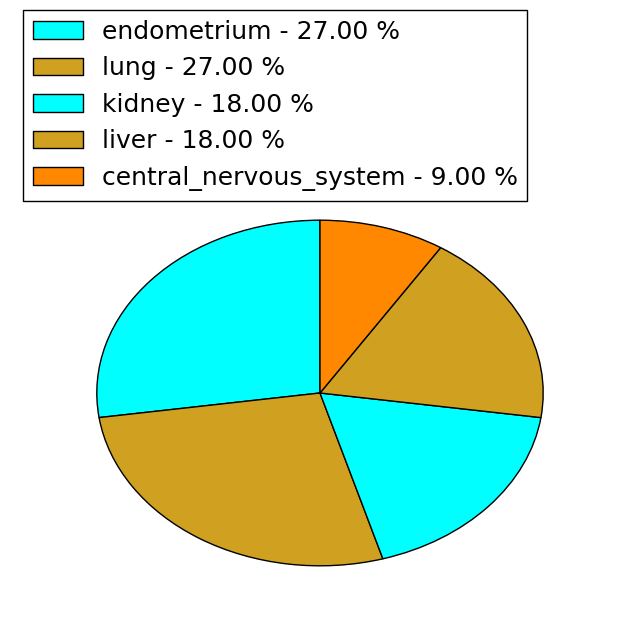
| Stat. for Non-Synonymous SNVs (# total SNVs=48) | (# total SNVs=11) |
 |  |
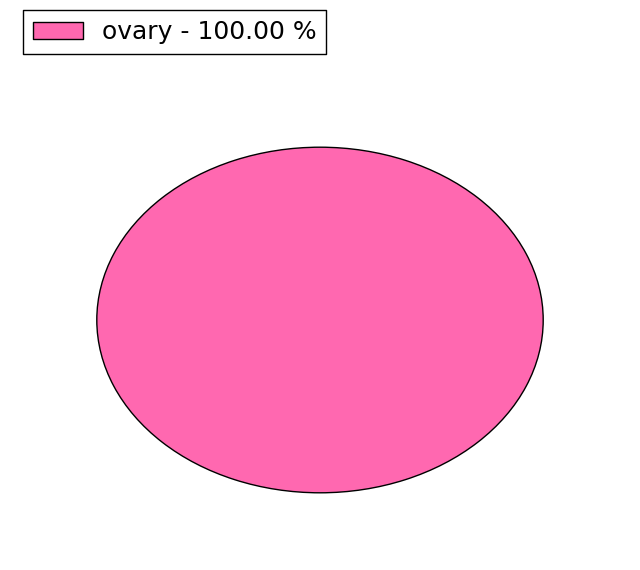
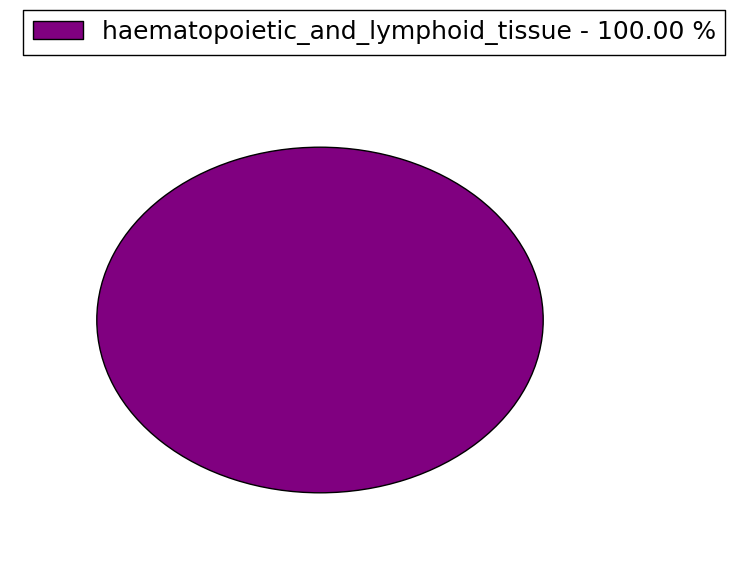
(# total SNVs=1) | (# total SNVs=1) |
 |  |
| Top |
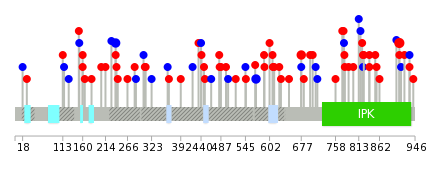
| * When you move the cursor on each content, you can see more deailed mutation information on the Tooltip. Those are primary_site,primary_histology,mutation(aa),pubmedID. |
| GRCh37 position | Mutation(aa) | Unique sampleID count |
| chr1:226822488-226822488 | p.T435A | 3 |
| chr1:226822561-226822561 | p.I410I | 2 |
| chr1:226923323-226923323 | p.E139K | 2 |
| chr1:226836376-226836376 | p.A203T | 2 |
| chr1:226825421-226825421 | p.R388* | 2 |
| chr1:226836430-226836430 | p.P185S | 2 |
| chr1:226827351-226827351 | p.D346D | 2 |
| chr1:226923335-226923335 | p.S135P | 2 |
| chr1:226827299-226827299 | p.E364K | 1 |
| chr1:226923286-226923286 | p.R151H | 1 |
| Top |
|
 |
| Point Mutation/ Tissue ID | 1 | 2 | 3 | 4 | 5 | 6 | 7 | 8 | 9 | 10 | 11 | 12 | 13 | 14 | 15 | 16 | 17 | 18 | 19 | 20 |
| # sample | 1 | 5 | 14 | 4 | 5 | 10 | 9 | 4 | 7 | 11 | 13 | |||||||||
| # mutation | 1 | 5 | 15 | 5 | 5 | 11 | 10 | 4 | 8 | 11 | 14 | |||||||||
| nonsynonymous SNV | 1 | 5 | 12 | 5 | 3 | 8 | 5 | 3 | 5 | 7 | 9 | |||||||||
| synonymous SNV | 3 | 2 | 3 | 5 | 1 | 3 | 4 | 5 |
| cf) Tissue ID; Tissue type (1; BLCA[Bladder Urothelial Carcinoma], 2; BRCA[Breast invasive carcinoma], 3; CESC[Cervical squamous cell carcinoma and endocervical adenocarcinoma], 4; COAD[Colon adenocarcinoma], 5; GBM[Glioblastoma multiforme], 6; Glioma Low Grade, 7; HNSC[Head and Neck squamous cell carcinoma], 8; KICH[Kidney Chromophobe], 9; KIRC[Kidney renal clear cell carcinoma], 10; KIRP[Kidney renal papillary cell carcinoma], 11; LAML[Acute Myeloid Leukemia], 12; LUAD[Lung adenocarcinoma], 13; LUSC[Lung squamous cell carcinoma], 14; OV[Ovarian serous cystadenocarcinoma ], 15; PAAD[Pancreatic adenocarcinoma], 16; PRAD[Prostate adenocarcinoma], 17; SKCM[Skin Cutaneous Melanoma], 18:STAD[Stomach adenocarcinoma], 19:THCA[Thyroid carcinoma], 20:UCEC[Uterine Corpus Endometrial Carcinoma]) |
| Top |
| * We represented just top 10 SNVs. When you move the cursor on each content, you can see more deailed mutation information on the Tooltip. Those are primary_site, primary_histology, mutation(aa), pubmedID. |
| Genomic Position | Mutation(aa) | Unique sampleID count |
| chr1:226822488 | p.T909A | 3 |
| chr1:226924446 | p.I570I | 2 |
| chr1:226923450 | p.A160S | 2 |
| chr1:226836376 | p.A677T | 2 |
| chr1:226924682 | p.P238P | 2 |
| chr1:226829634 | p.G214A | 1 |
| chr1:226923701 | p.E838G | 1 |
| chr1:226924779 | p.Y715Y | 1 |
| chr1:226835002 | p.S420S | 1 |
| chr1:226924069 | p.S204F | 1 |
| * Copy number data were extracted from TCGA using R package TCGA-Assembler. The URLs of all public data files on TCGA DCC data server were gathered on Jan-05-2015. Function ProcessCNAData in TCGA-Assembler package was used to obtain gene-level copy number value which is calculated as the average copy number of the genomic region of a gene. |
 |
| cf) Tissue ID[Tissue type]: BLCA[Bladder Urothelial Carcinoma], BRCA[Breast invasive carcinoma], CESC[Cervical squamous cell carcinoma and endocervical adenocarcinoma], COAD[Colon adenocarcinoma], GBM[Glioblastoma multiforme], Glioma Low Grade, HNSC[Head and Neck squamous cell carcinoma], KICH[Kidney Chromophobe], KIRC[Kidney renal clear cell carcinoma], KIRP[Kidney renal papillary cell carcinoma], LAML[Acute Myeloid Leukemia], LUAD[Lung adenocarcinoma], LUSC[Lung squamous cell carcinoma], OV[Ovarian serous cystadenocarcinoma ], PAAD[Pancreatic adenocarcinoma], PRAD[Prostate adenocarcinoma], SKCM[Skin Cutaneous Melanoma], STAD[Stomach adenocarcinoma], THCA[Thyroid carcinoma], UCEC[Uterine Corpus Endometrial Carcinoma] |
| Top |
| Gene Expression for ITPKB |
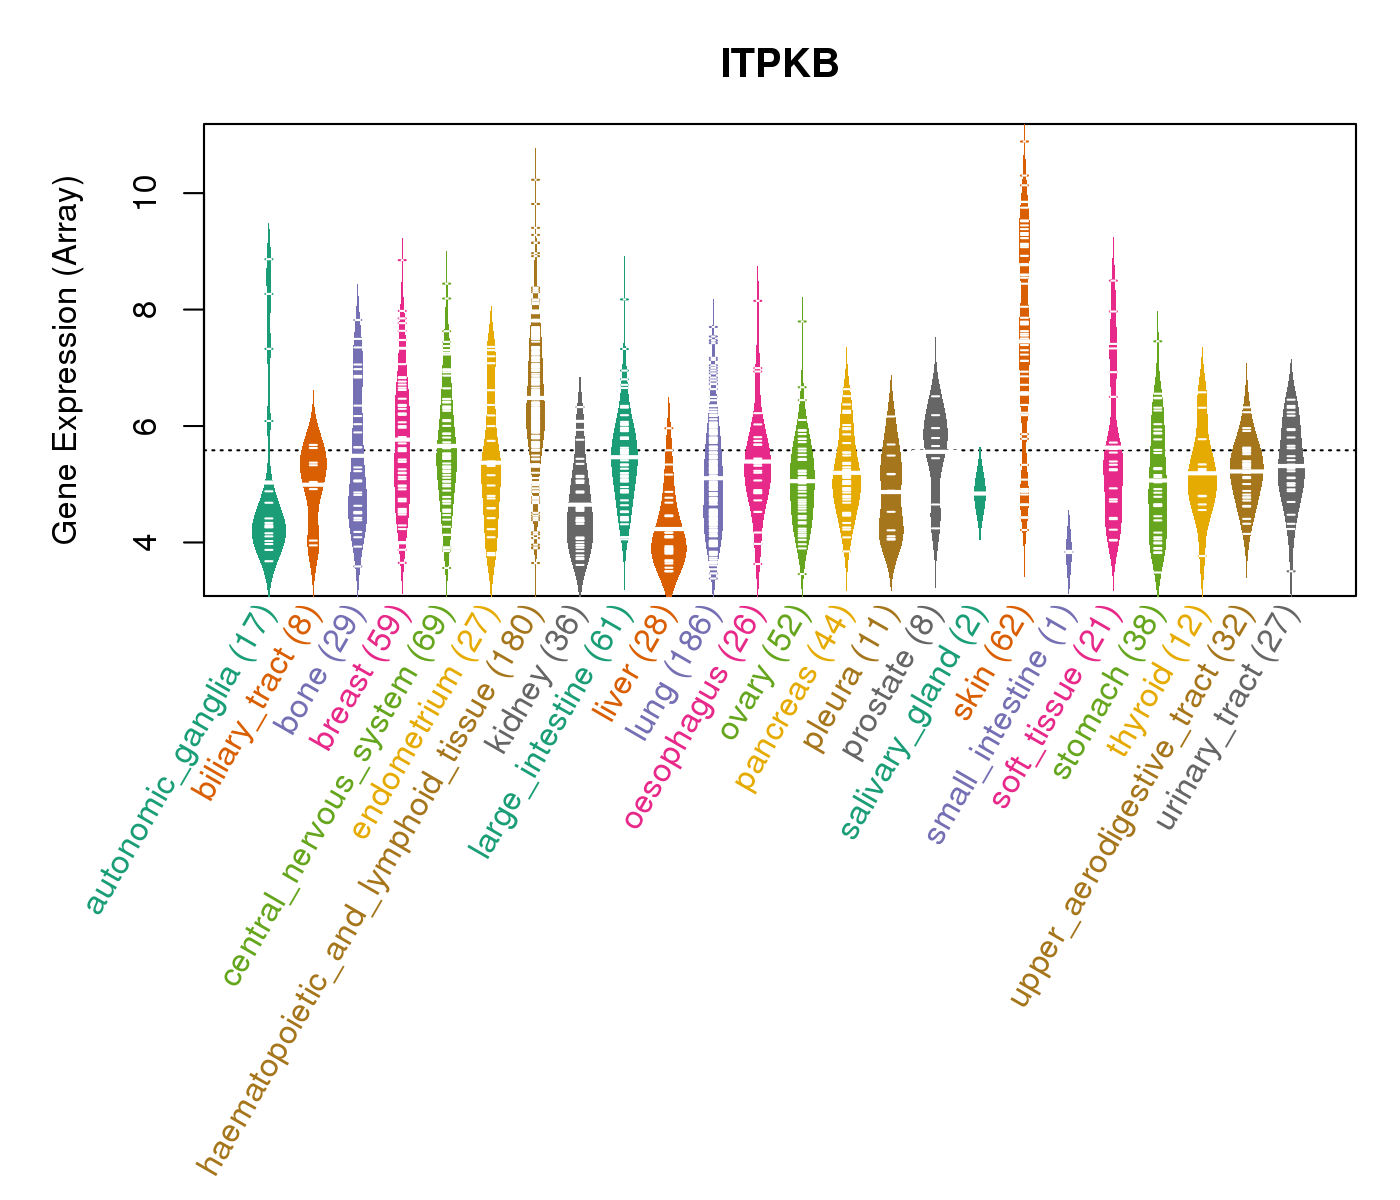
| * CCLE gene expression data were extracted from CCLE_Expression_Entrez_2012-10-18.res: Gene-centric RMA-normalized mRNA expression data. |
 |
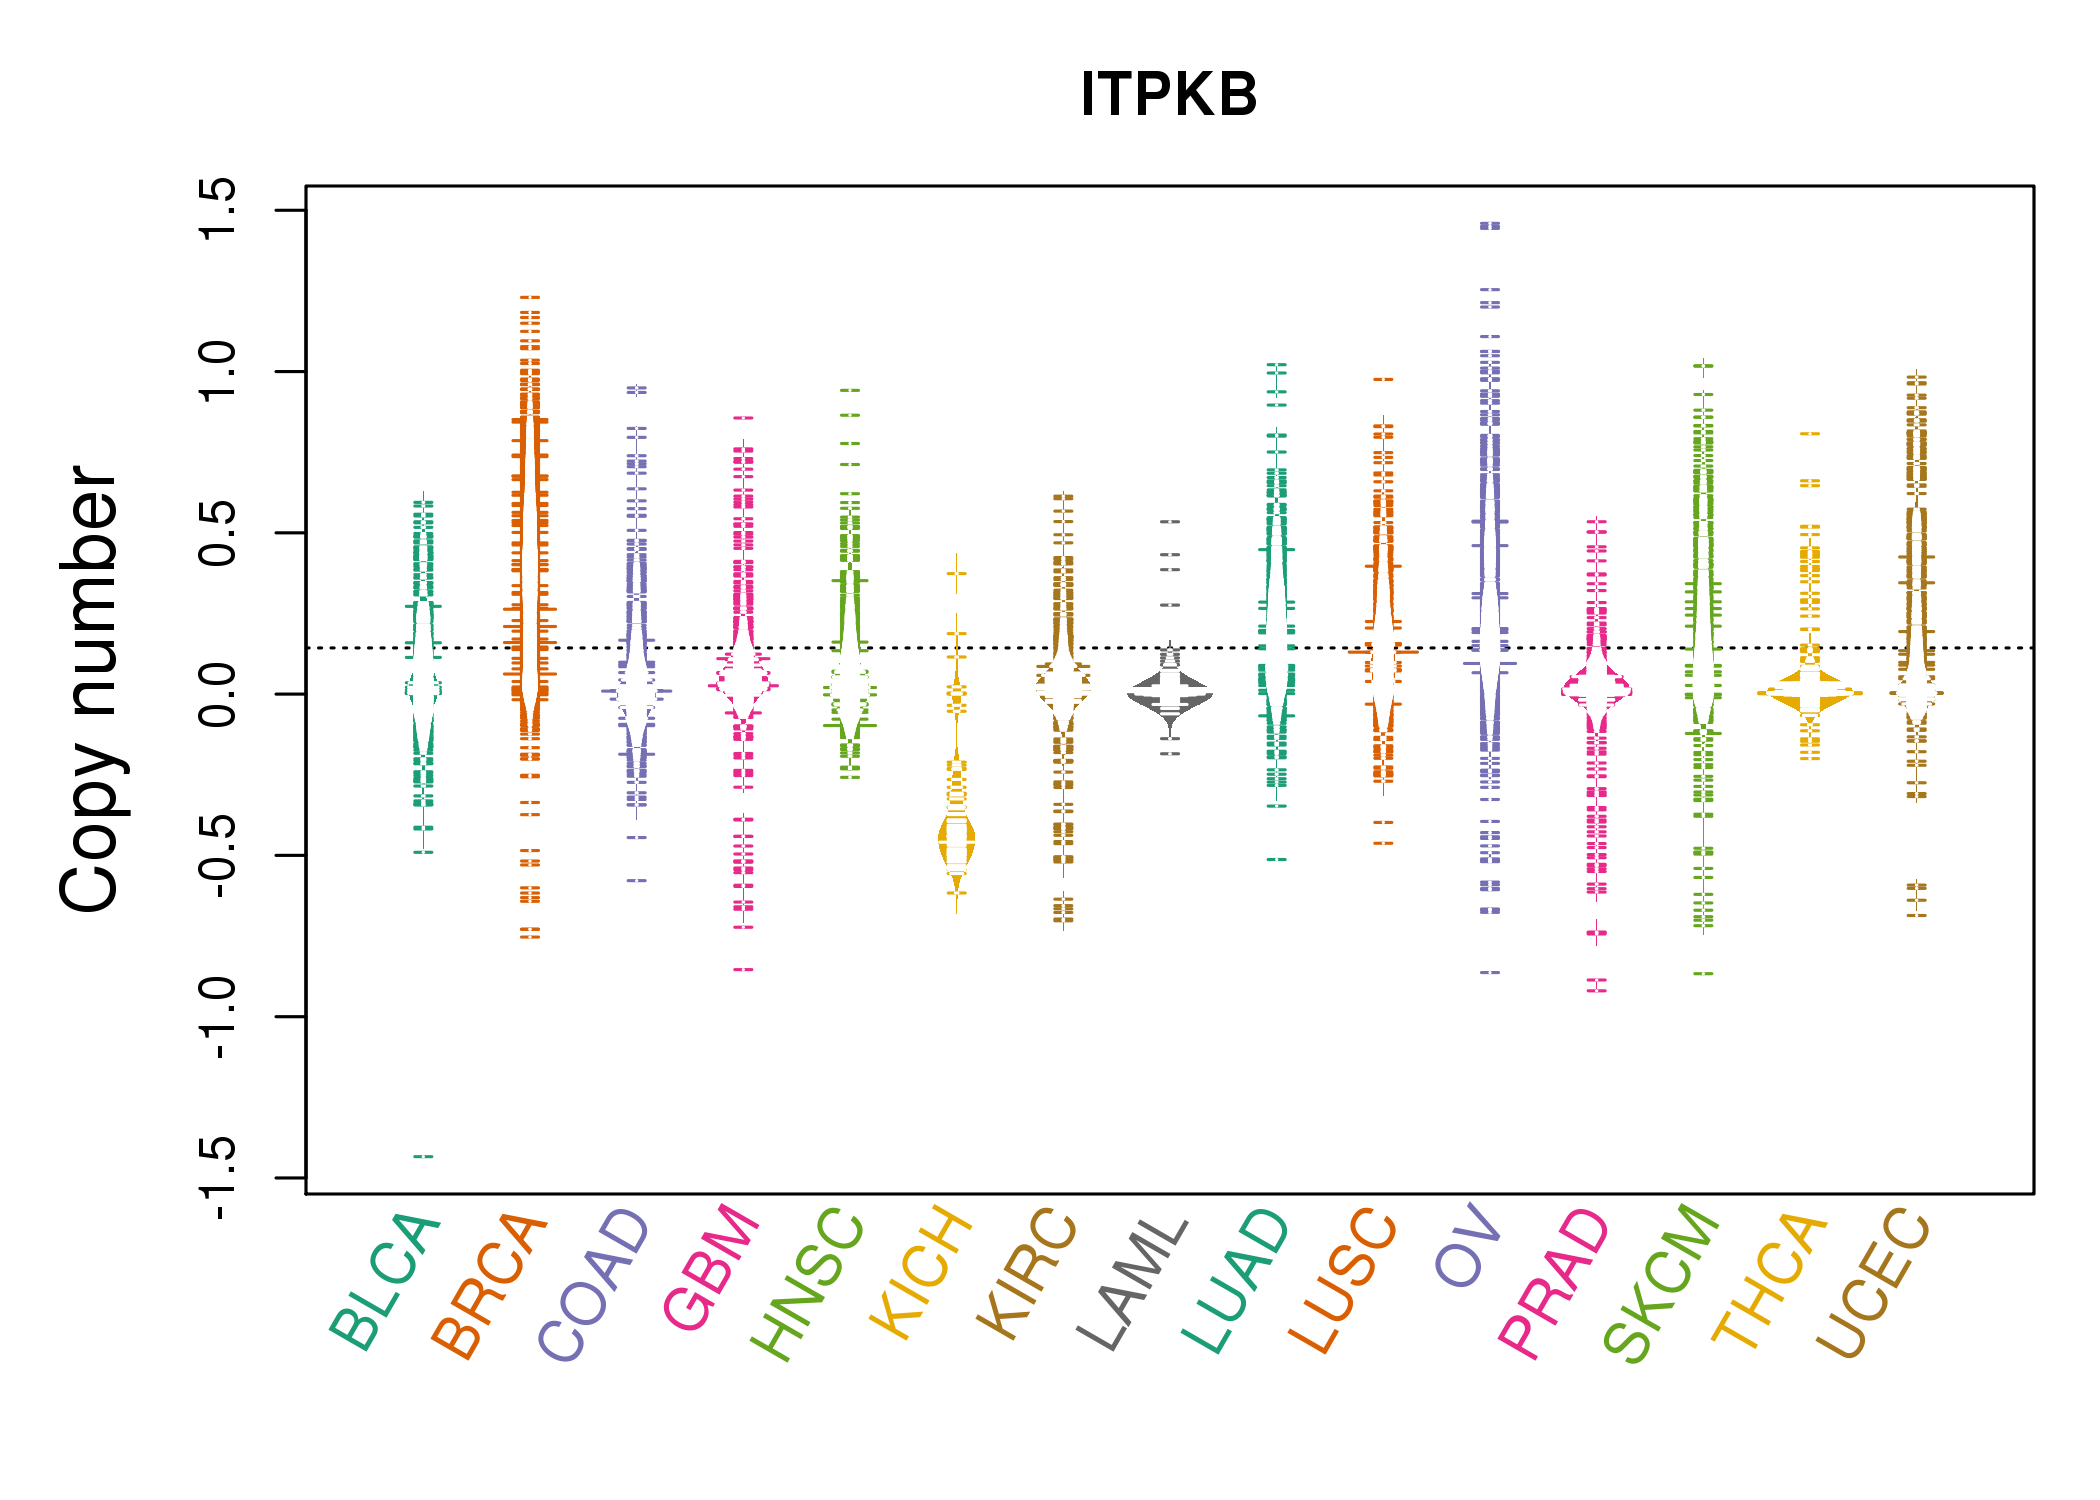
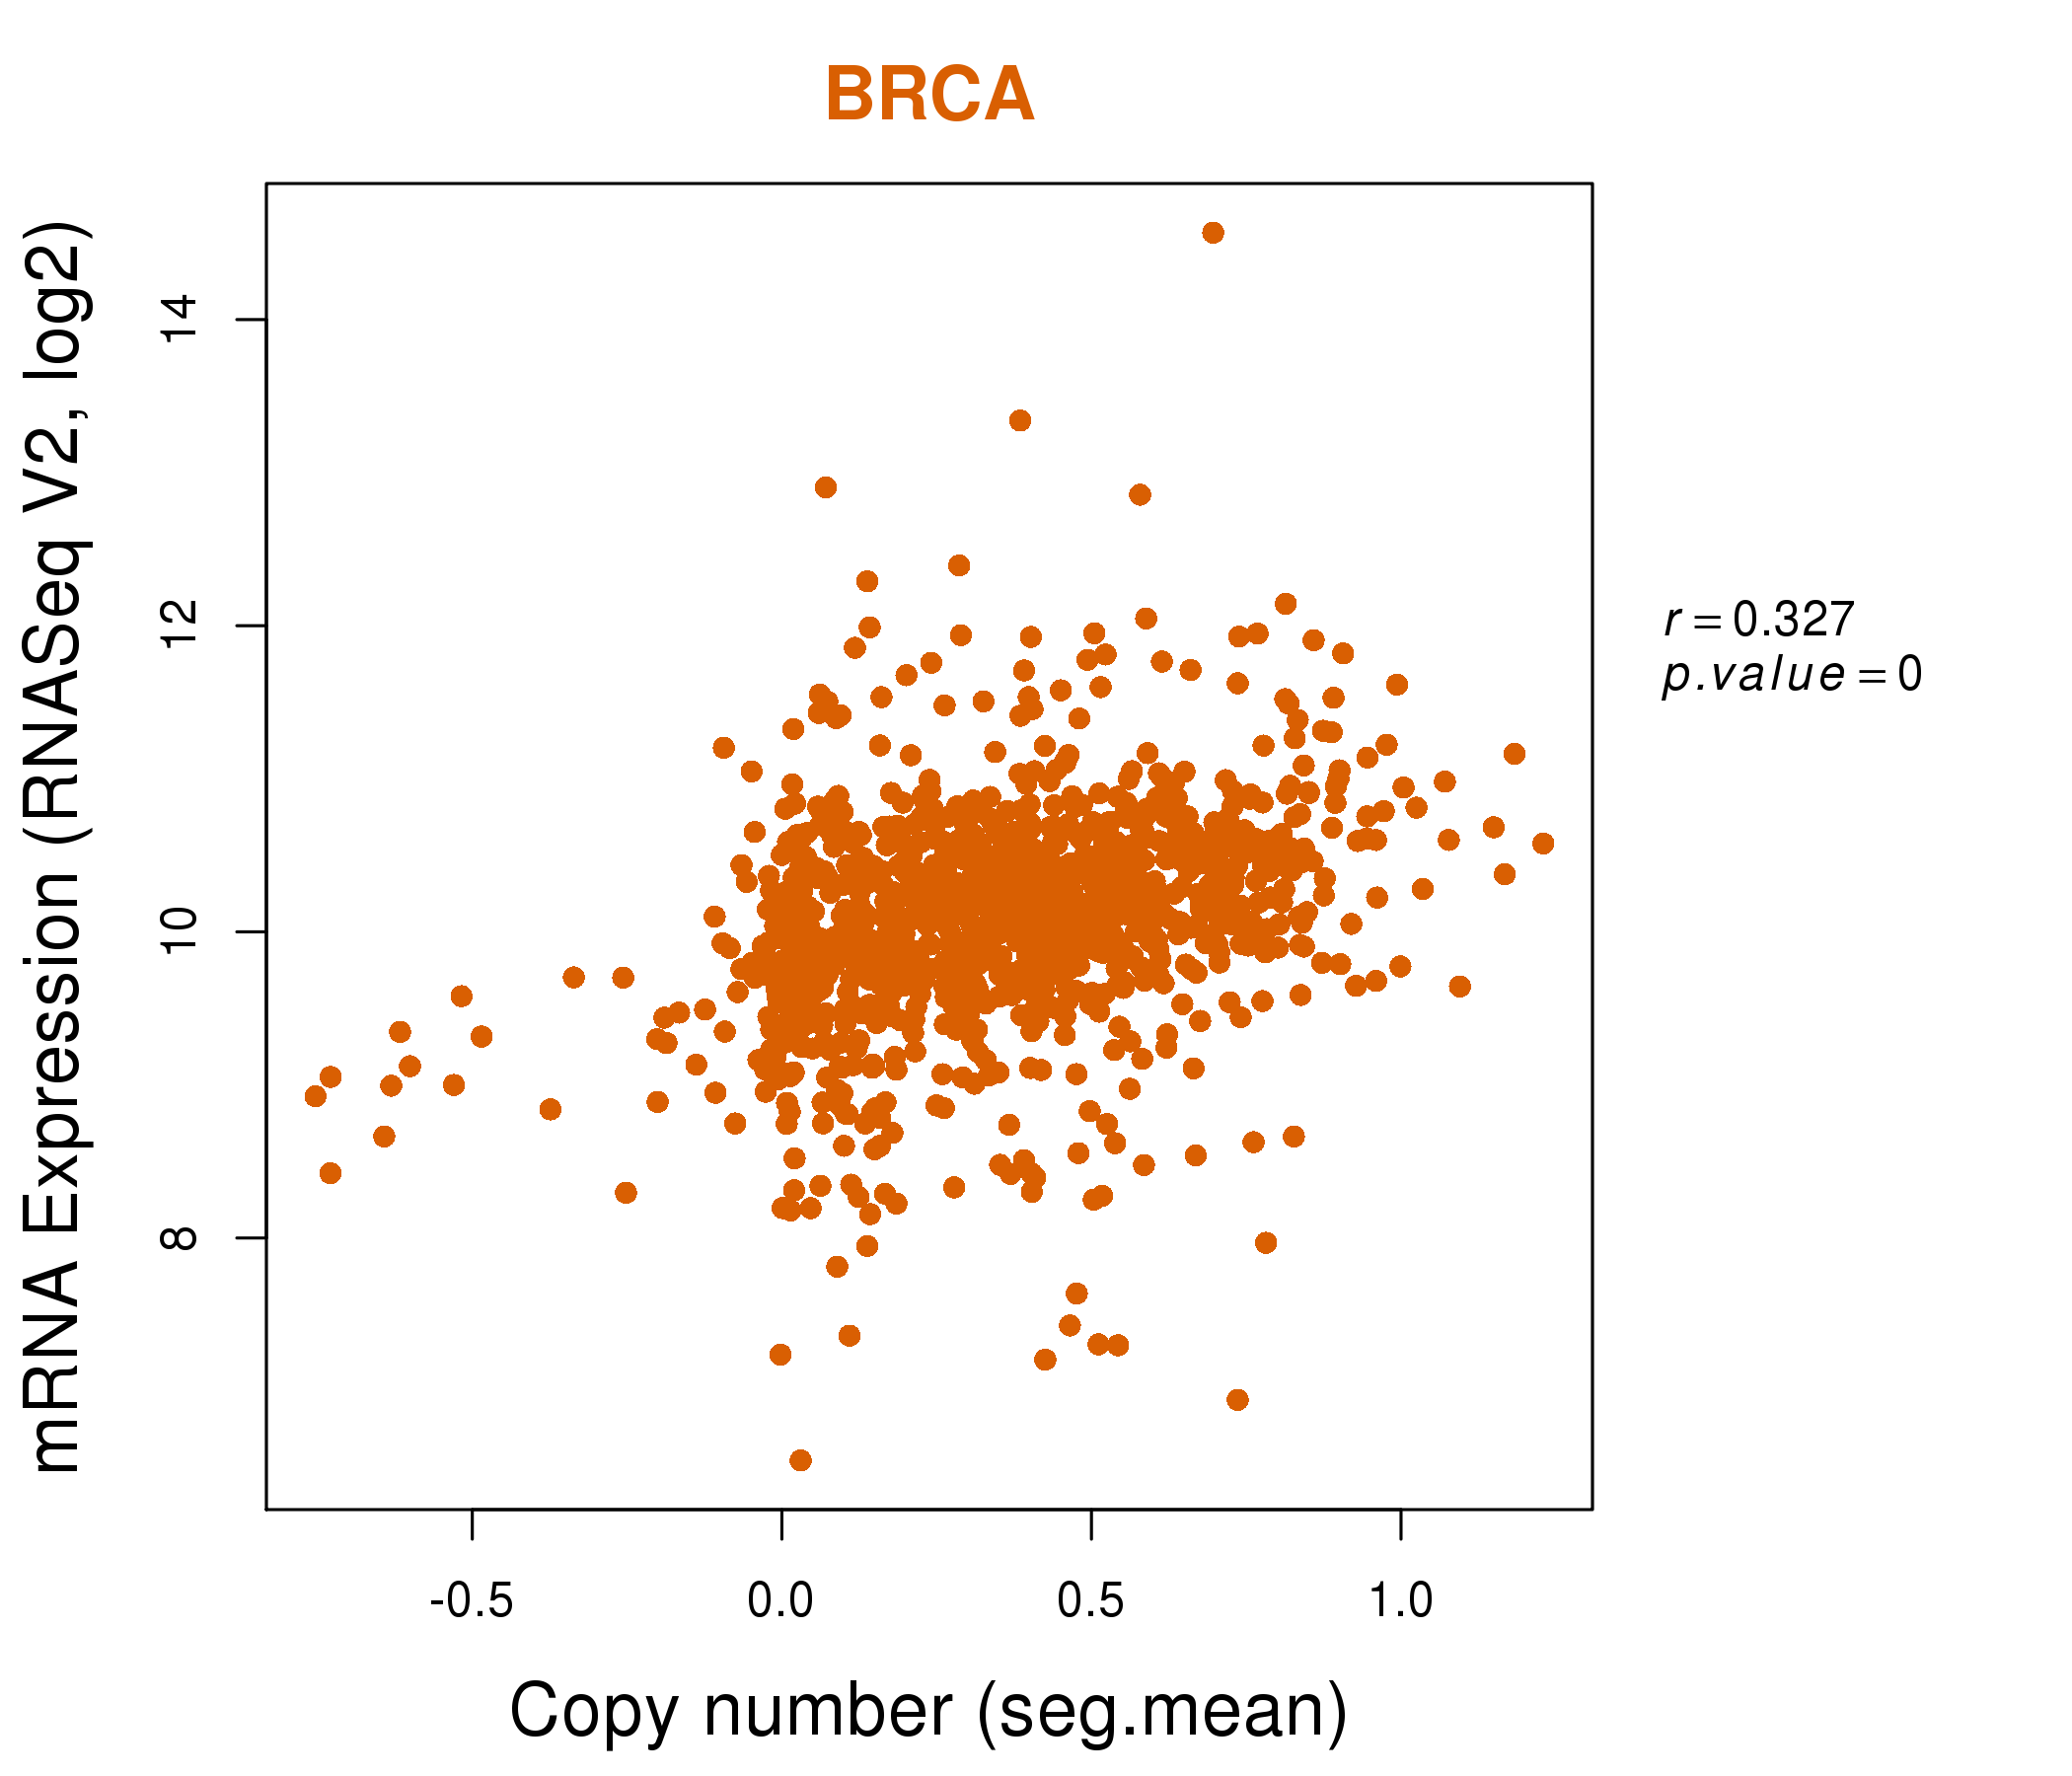
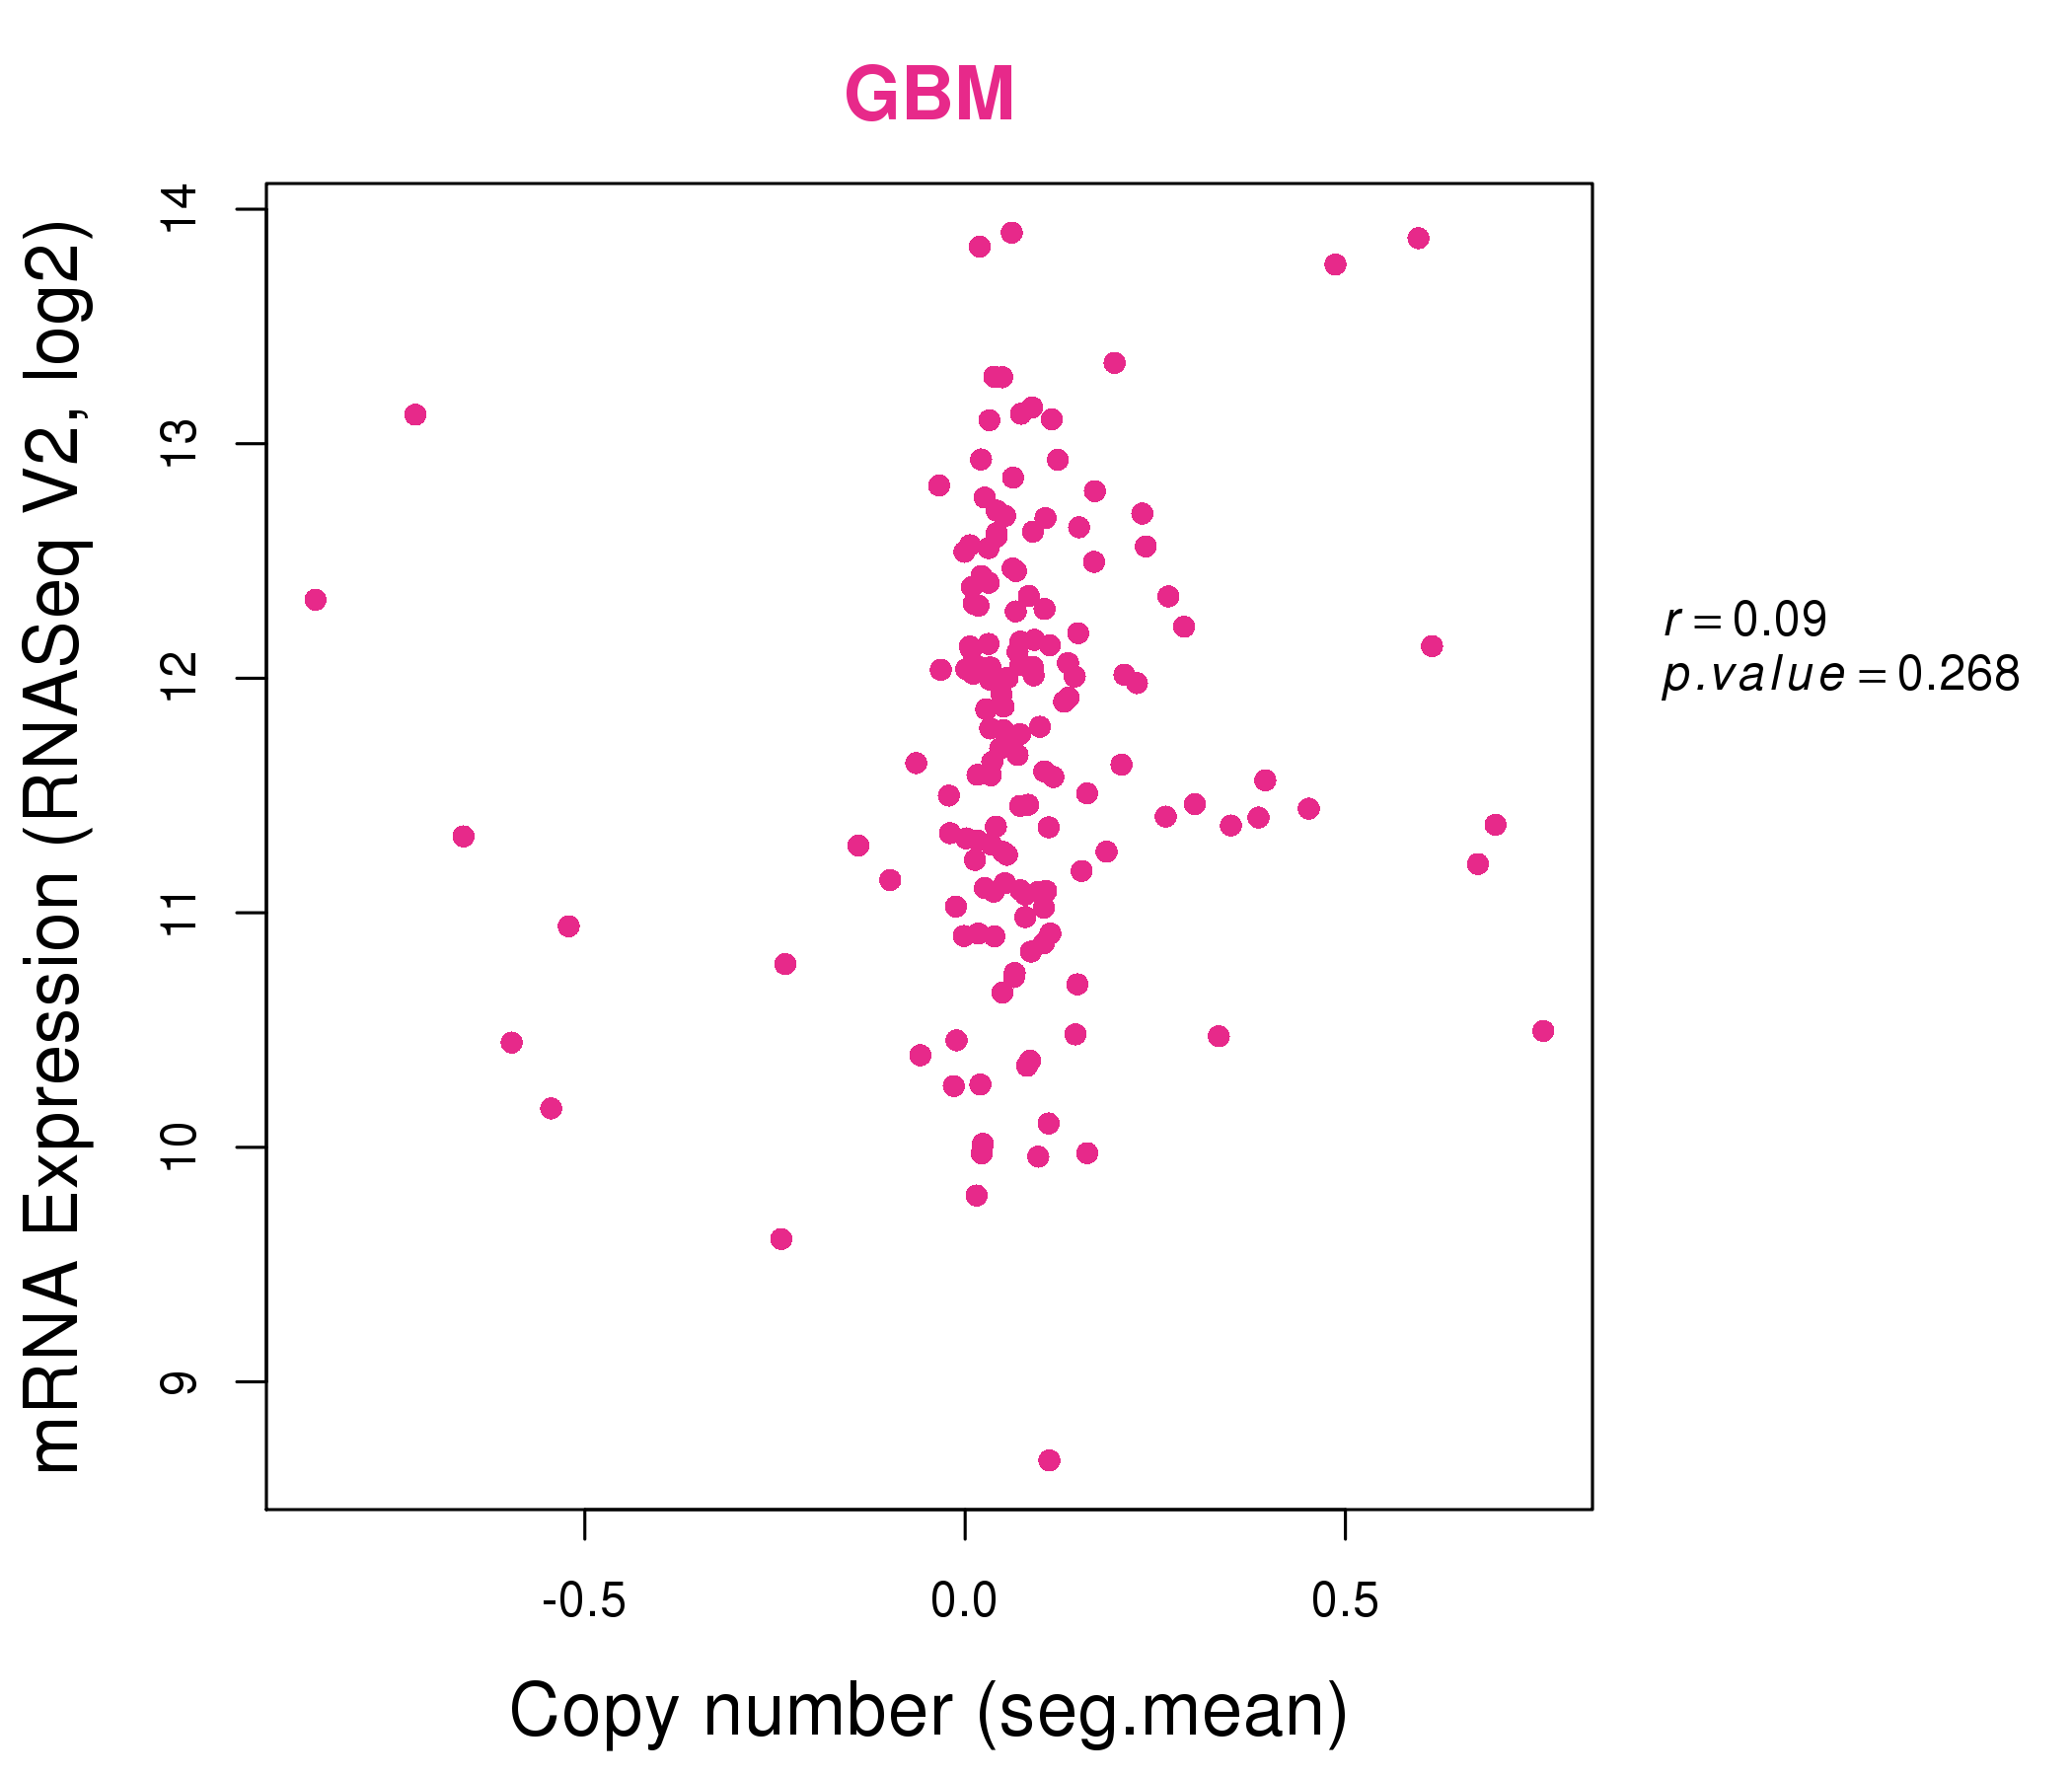
| * Normalized gene expression data of RNASeqV2 was extracted from TCGA using R package TCGA-Assembler. The URLs of all public data files on TCGA DCC data server were gathered at Jan-05-2015. Only eight cancer types have enough normal control samples for differential expression analysis. (t test, adjusted p<0.05 (using Benjamini-Hochberg FDR)) |
 |
| Top |
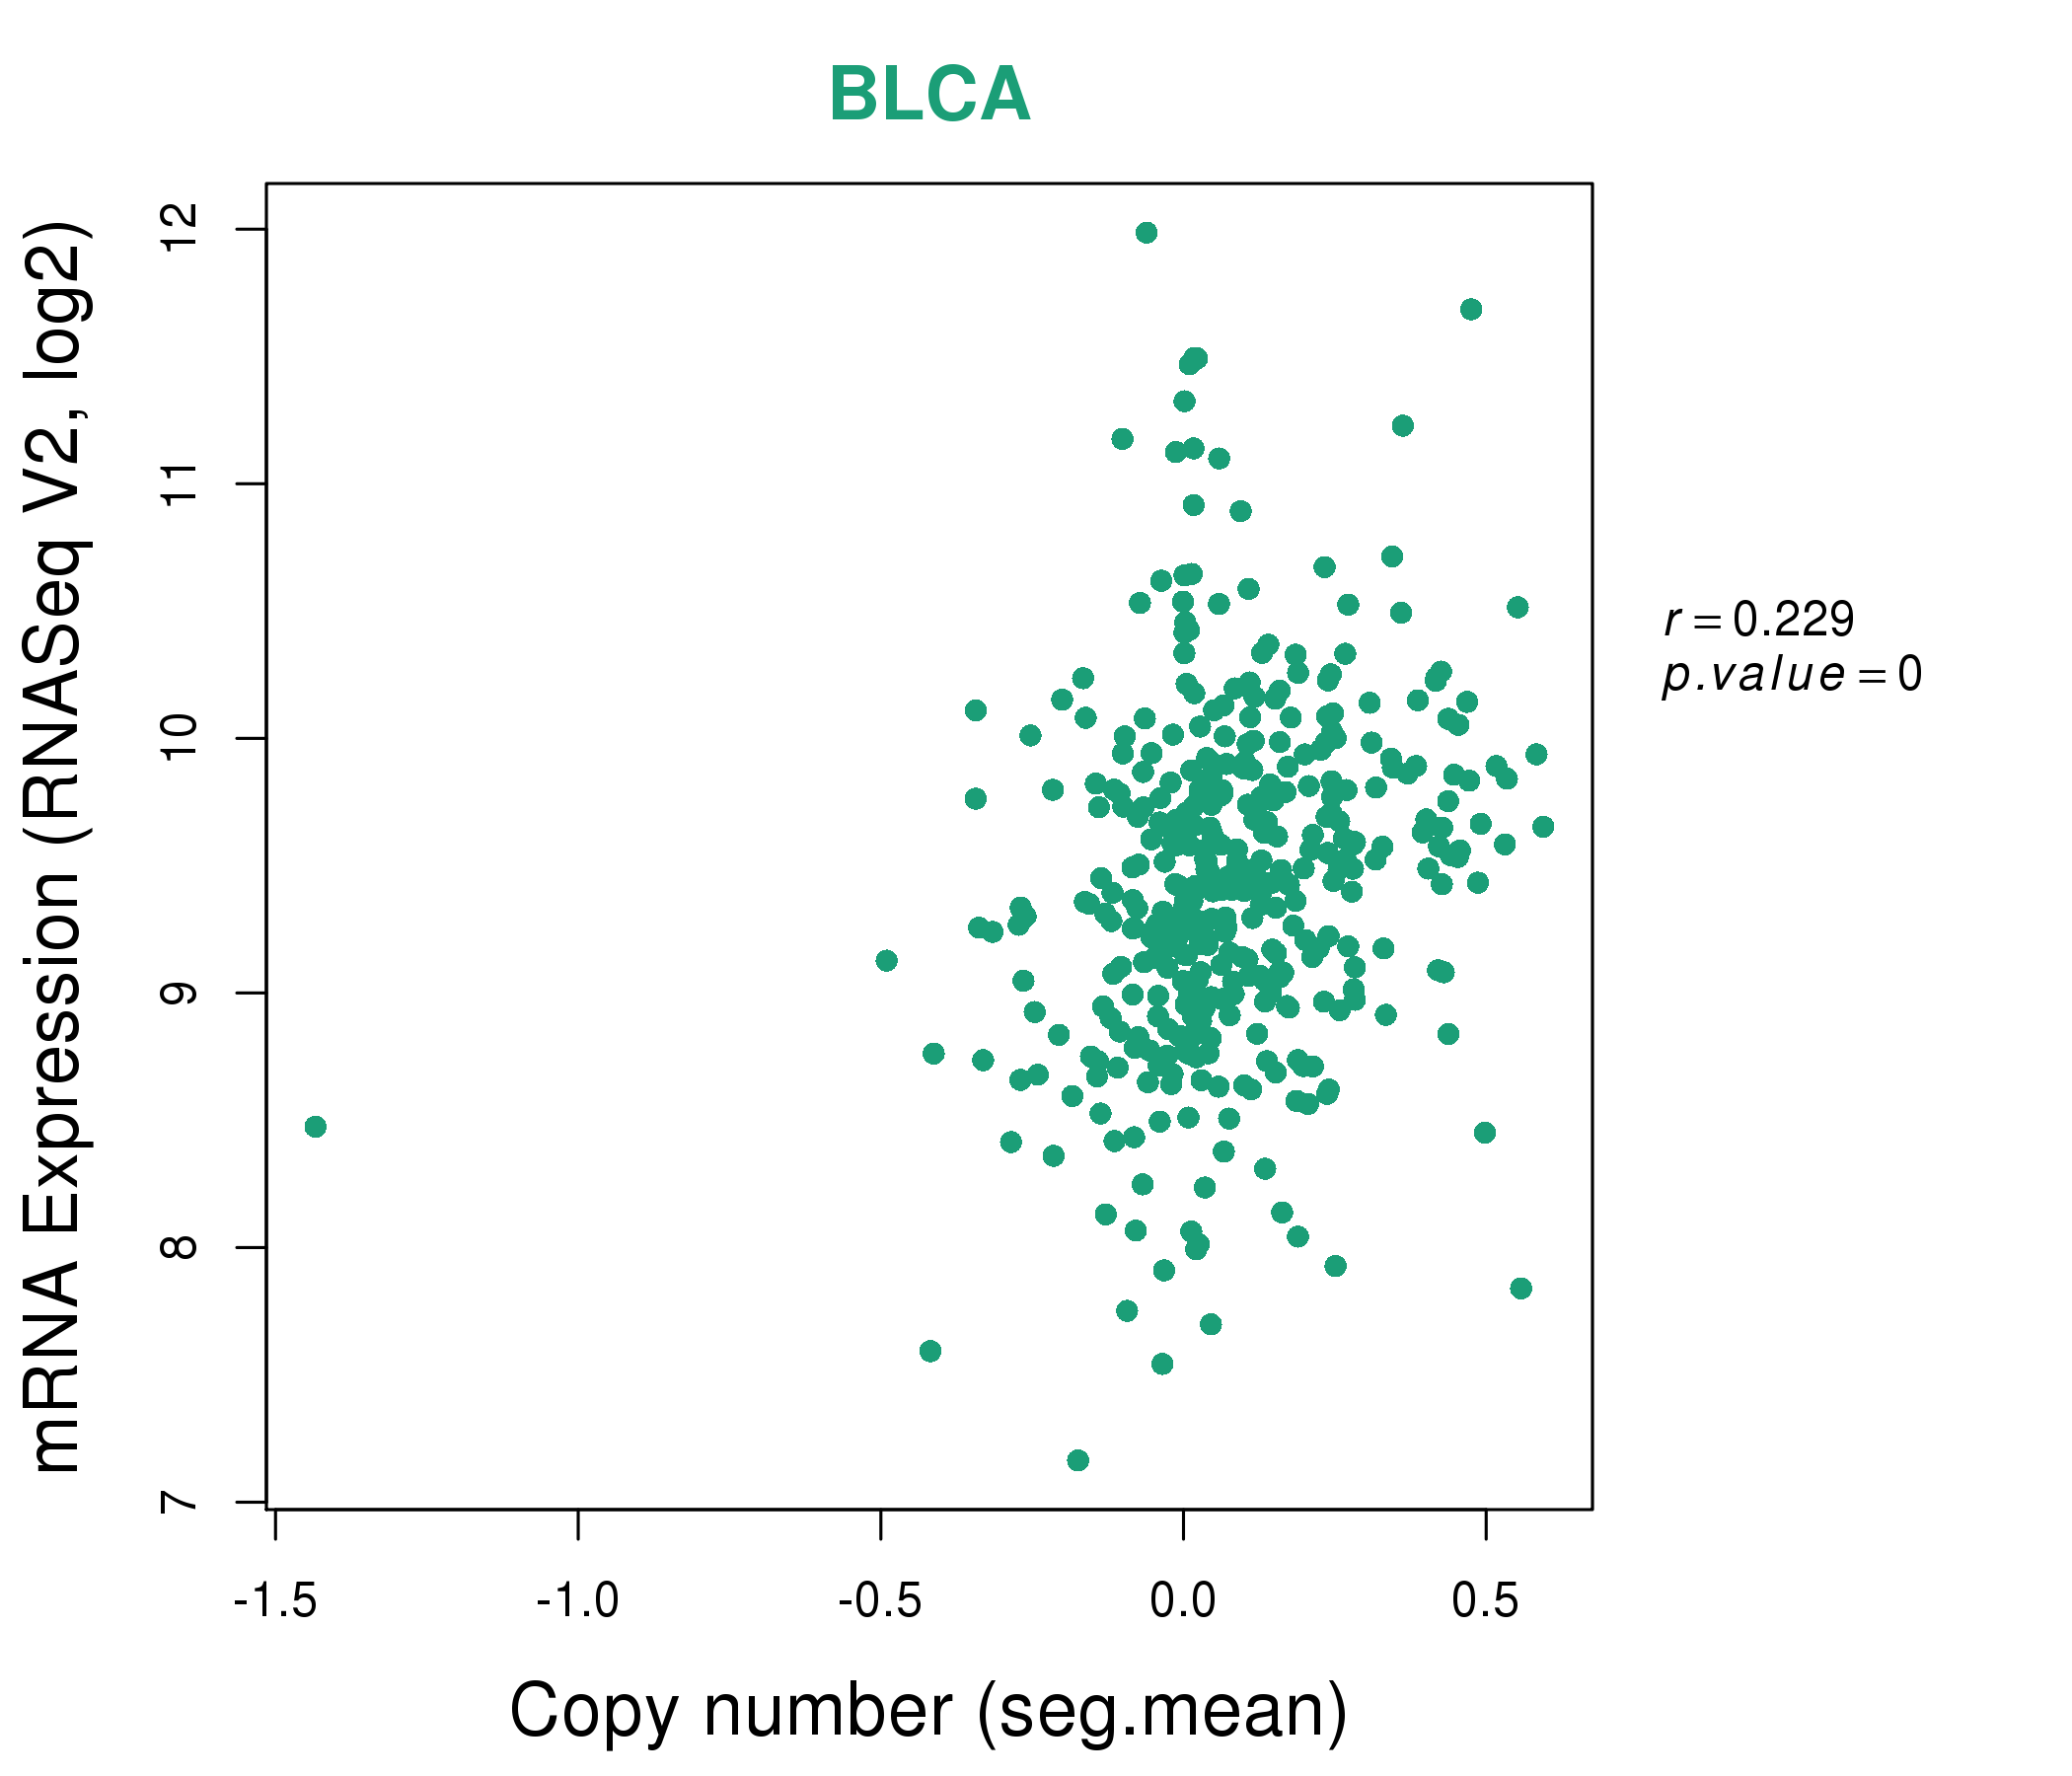
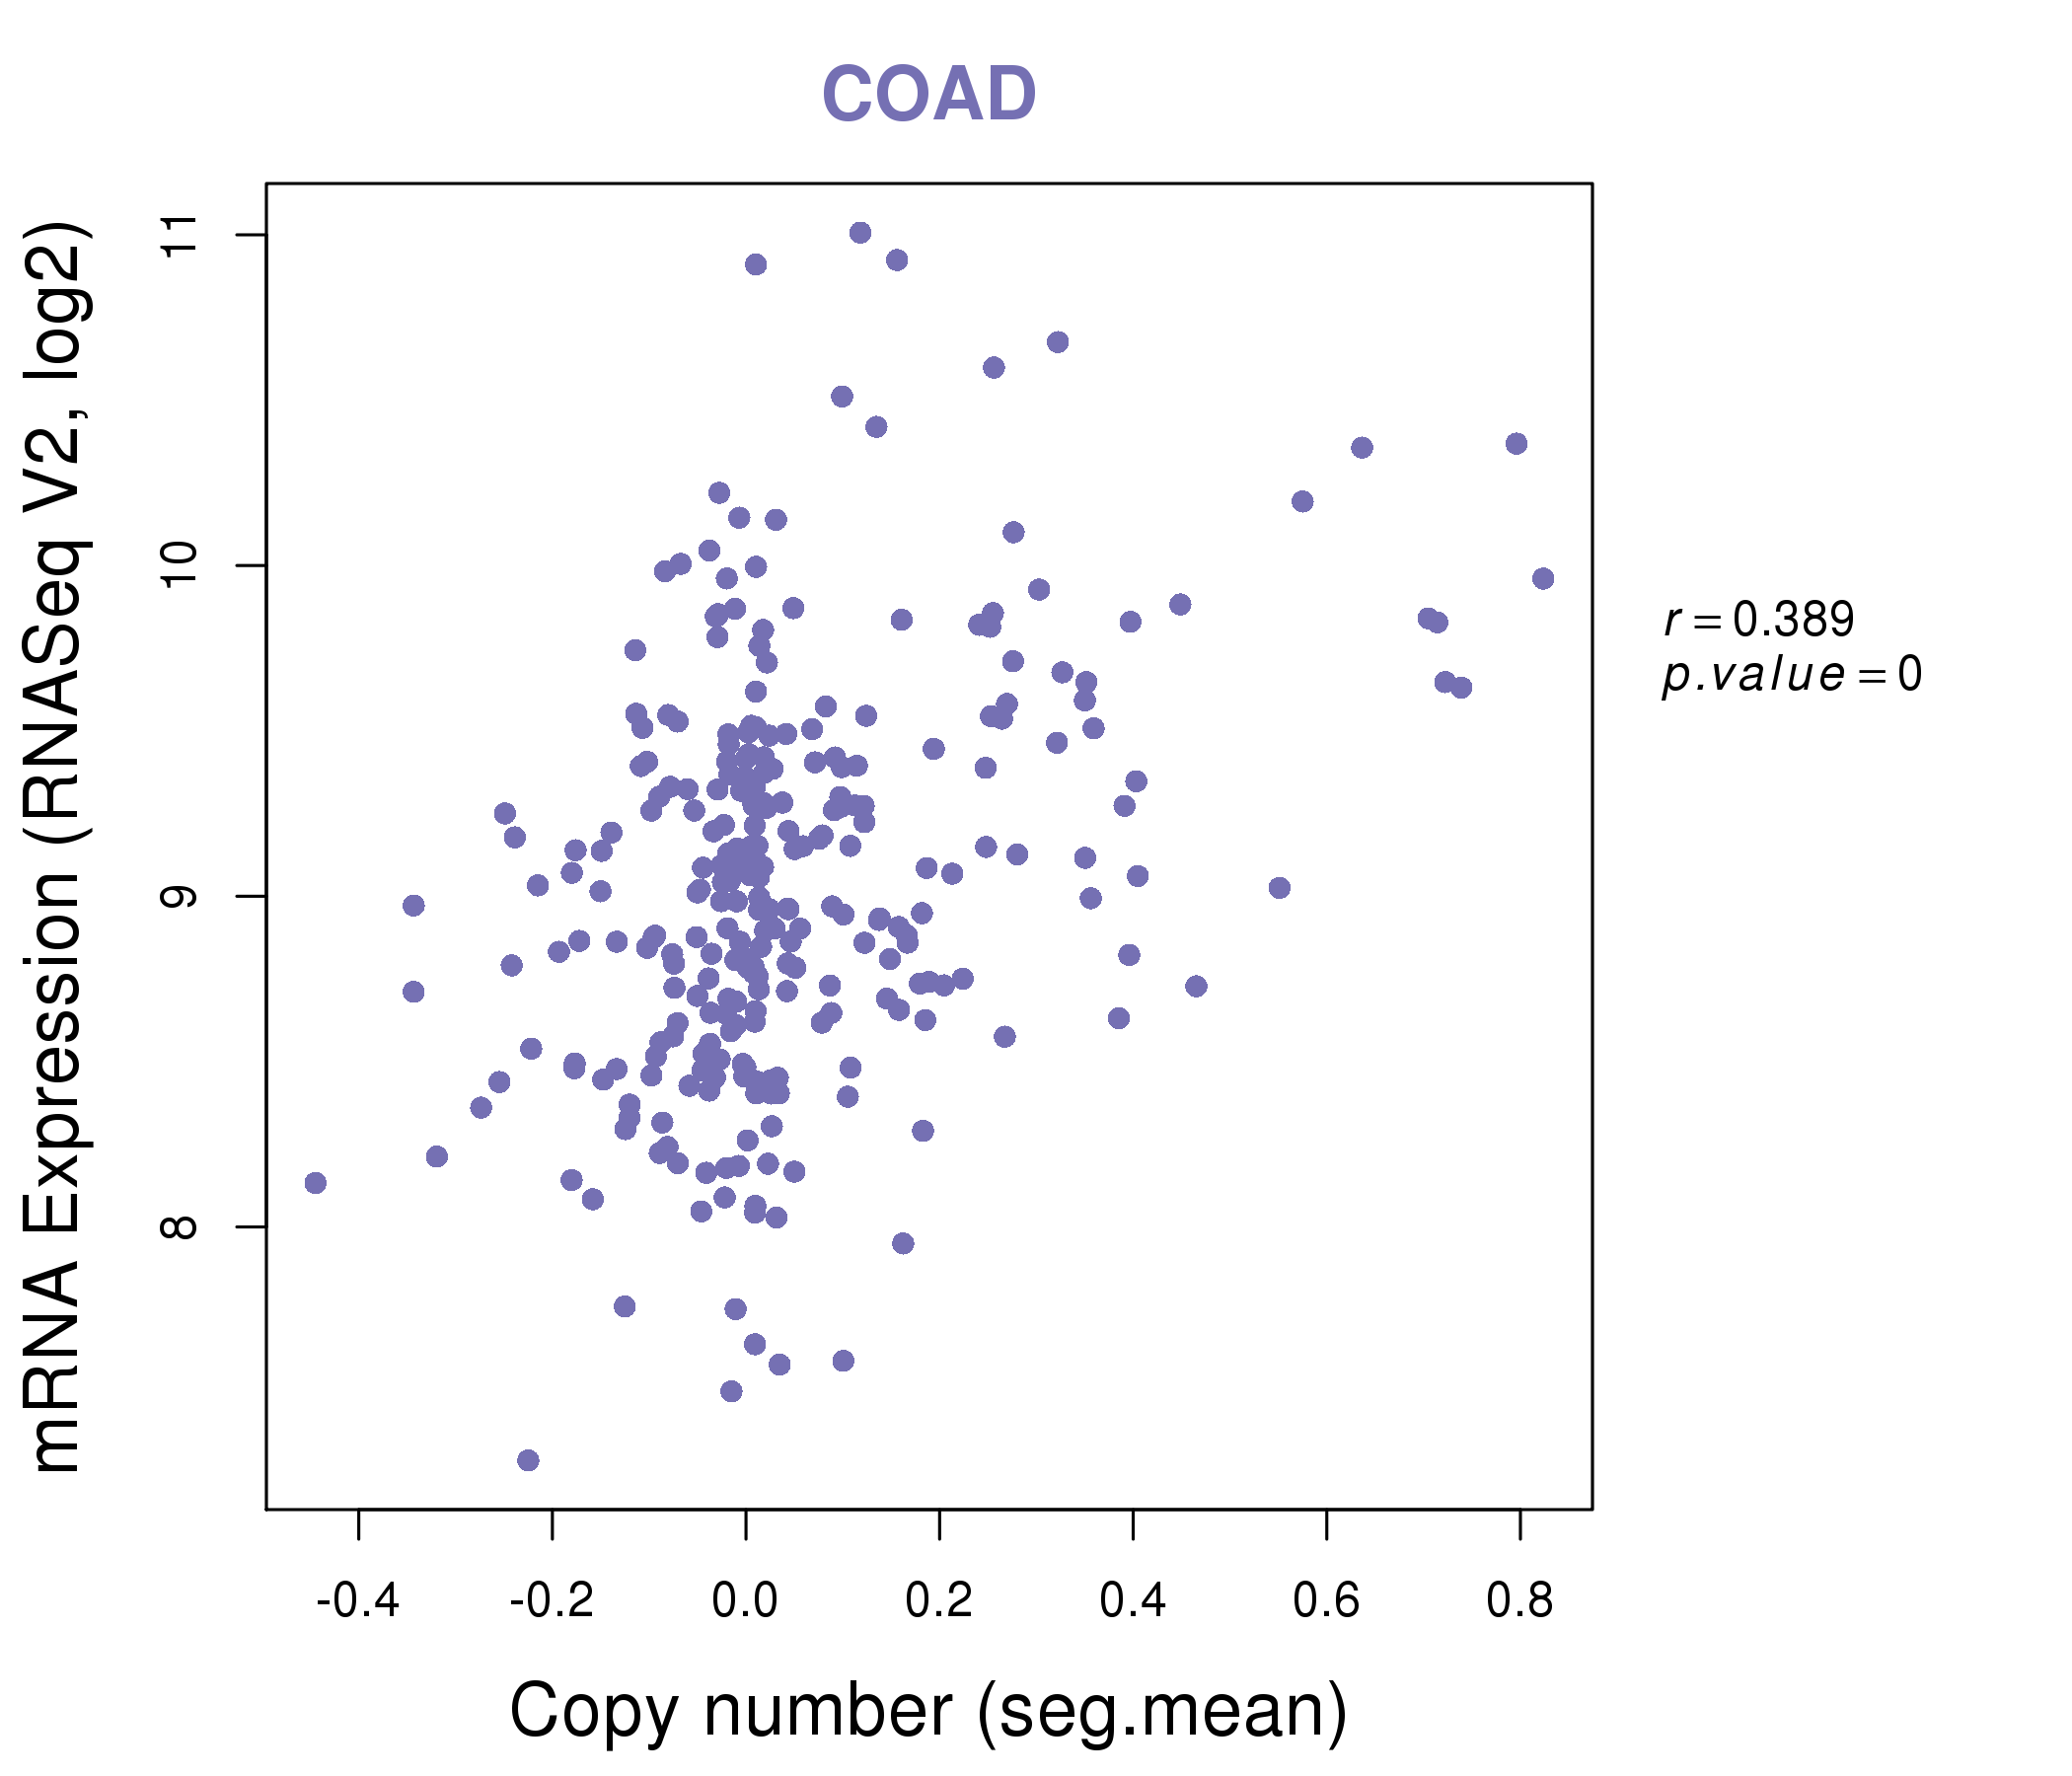
| * This plots show the correlation between CNV and gene expression. |
: Open all plots for all cancer types
 |
|
 |
|
| Top |
| Gene-Gene Network Information |
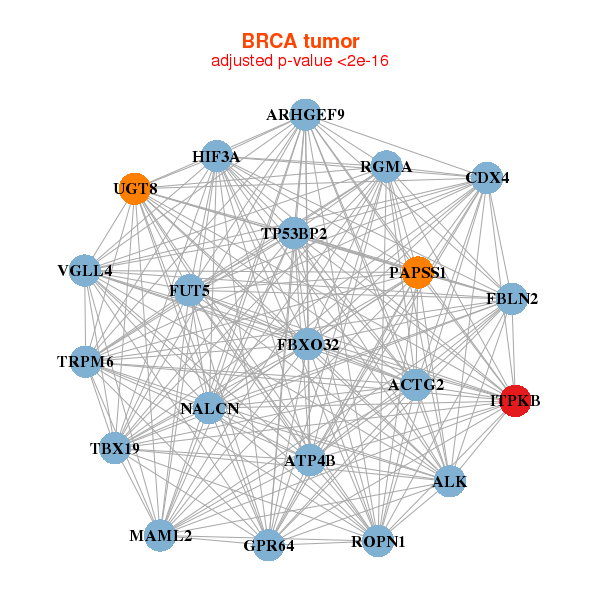
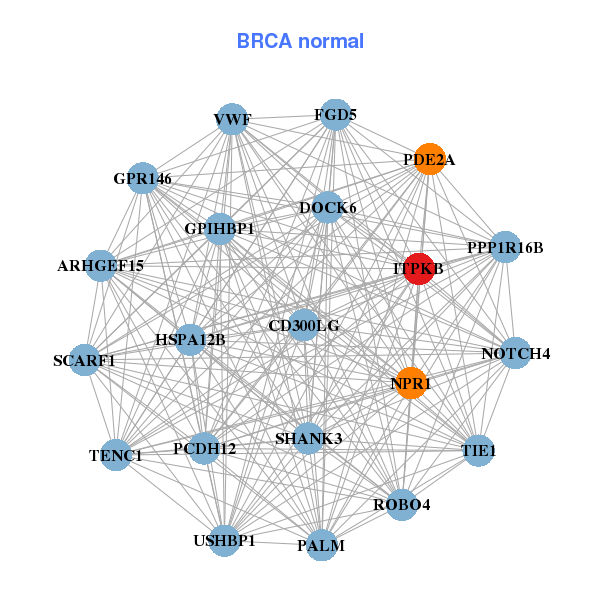
| * Co-Expression network figures were drawn using R package igraph. Only the top 20 genes with the highest correlations were shown. Red circle: input gene, orange circle: cell metabolism gene, sky circle: other gene |
: Open all plots for all cancer types
 |
|
| ACTG2,ALK,ARHGEF9,ATP4B,CDX4,FBLN2,FBXO32, FUT5,GPR64,HIF3A,ITPKB,MAML2,NALCN,PAPSS1, RGMA,ROPN1,TBX19,TP53BP2,TRPM6,UGT8,VGLL4 | ARHGEF15,CD300LG,DOCK6,FGD5,GPIHBP1,GPR146,HSPA12B, ITPKB,NOTCH4,NPR1,PALM,PCDH12,PDE2A,PPP1R16B, ROBO4,SCARF1,SHANK3,TENC1,TIE1,USHBP1,VWF |
 |
|
| AMOTL1,ANK2,ATP8B2,BAALC,CLIP3,DSTYK,ITPKB, ITPR1,JAM2,JAM3,KIF17,MFNG,NAP1L3,PKNOX2, PNMAL2,SETBP1,SLC9A9,SYNE1,SYT11,TENC1,ZNF512B | BNC2,CAND2,CDON,DOCK3,FAM129A,GRB10,HSPA2, ITPKB,CTIF,MTCL1,LAMB2,LYNX1,MID2,MYOCD, NBEA,PIP5K1C,PRICKLE2,ROR2,WFS1,ZBTB4,ZNF853 |
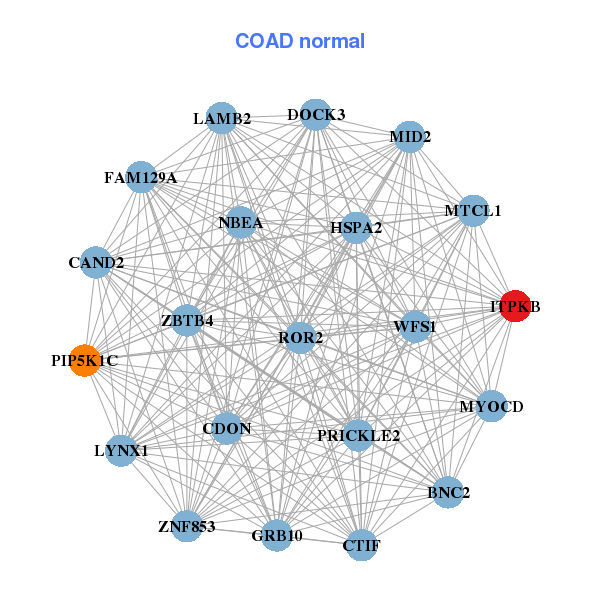
| * Co-Expression network figures were drawn using R package igraph. Only the top 20 genes with the highest correlations were shown. Red circle: input gene, orange circle: cell metabolism gene, sky circle: other gene |
: Open all plots for all cancer types
| Top |
: Open all interacting genes' information including KEGG pathway for all interacting genes from DAVID
| Top |
| Pharmacological Information for ITPKB |
| There's no related Drug. |
| Top |
| Cross referenced IDs for ITPKB |
| * We obtained these cross-references from Uniprot database. It covers 150 different DBs, 18 categories. http://www.uniprot.org/help/cross_references_section |
: Open all cross reference information
|
Copyright © 2016-Present - The Univsersity of Texas Health Science Center at Houston @ |