|
||||||||||||||||||||||||||||||||||||||||||||||||||||||||||||||||||||||||||||||||||||||||||||||||||||||||||||||||||||||||||||||||||||||||||||||||||||||||||||||||||||||||||||||||||||||||||||||||||||||||||||||||||||||||||||||||||||||||||||||||||||||||||||||||||||||||||||||||||||||||||||||||||||||||||||||||||||||||||
| |
| Phenotypic Information (metabolism pathway, cancer, disease, phenome) |
| |
| |
| Gene-Gene Network Information: Co-Expression Network, Interacting Genes & KEGG |
| |
|


| Gene Summary for ITPR2 |
| Basic gene info. | Gene symbol | ITPR2 |
| Gene name | inositol 1,4,5-trisphosphate receptor, type 2 | |
| Synonyms | CFAP48|IP3R2 | |
| Cytomap | UCSC genome browser: 12p11 | |
| Genomic location | chr12 :26488284-26986131 | |
| Type of gene | protein-coding | |
| RefGenes | NM_002223.2, | |
| Ensembl id | ENSG00000123104 | |
| Description | IP3 receptorIP3R 2cilia and flagella associated protein 48inositol 1,4,5-triphosphate receptor, type 2inositol 1,4,5-trisphosphate receptor type 2insP3R2type 2 InsP3 receptortype 2 inositol 1,4,5-trisphosphate receptor | |
| Modification date | 20141207 | |
| dbXrefs | MIM : 600144 | |
| HGNC : HGNC | ||
| Ensembl : ENSG00000123104 | ||
| HPRD : 02536 | ||
| Vega : OTTHUMG00000169181 | ||
| Protein | UniProt: go to UniProt's Cross Reference DB Table | |
| Expression | CleanEX: HS_ITPR2 | |
| BioGPS: 3709 | ||
| Gene Expression Atlas: ENSG00000123104 | ||
| The Human Protein Atlas: ENSG00000123104 | ||
| Pathway | NCI Pathway Interaction Database: ITPR2 | |
| KEGG: ITPR2 | ||
| REACTOME: ITPR2 | ||
| ConsensusPathDB | ||
| Pathway Commons: ITPR2 | ||
| Metabolism | MetaCyc: ITPR2 | |
| HUMANCyc: ITPR2 | ||
| Regulation | Ensembl's Regulation: ENSG00000123104 | |
| miRBase: chr12 :26,488,284-26,986,131 | ||
| TargetScan: NM_002223 | ||
| cisRED: ENSG00000123104 | ||
| Context | iHOP: ITPR2 | |
| cancer metabolism search in PubMed: ITPR2 | ||
| UCL Cancer Institute: ITPR2 | ||
| Assigned class in ccmGDB | C | |
| Top |
| Phenotypic Information for ITPR2(metabolism pathway, cancer, disease, phenome) |
| Cancer | CGAP: ITPR2 |
| Familial Cancer Database: ITPR2 | |
| * This gene is included in those cancer gene databases. |
|
|
|
|
|
|
| ||||||||||||||||||||||||||||||||||||||||||||||||||||||||||||||||||||||||||||||||||||||||||||||||||||||||||||||||||||||||||||||||||||||||||||||||||||||||||||||||||||||||||||||||||||||||||||||||||||||||||||||||||||||||||||||||||||||||||||||||||||||||||||||||||||||||||||||||||||||||||||||||||||||||||||||||||||
Oncogene 1 | Significant driver gene in | |||||||||||||||||||||||||||||||||||||||||||||||||||||||||||||||||||||||||||||||||||||||||||||||||||||||||||||||||||||||||||||||||||||||||||||||||||||||||||||||||||||||||||||||||||||||||||||||||||||||||||||||||||||||||||||||||||||||||||||||||||||||||||||||||||||||||||||||||||||||||||||||||||||||||||||||||||||||||
| cf) number; DB name 1 Oncogene; http://nar.oxfordjournals.org/content/35/suppl_1/D721.long, 2 Tumor Suppressor gene; https://bioinfo.uth.edu/TSGene/, 3 Cancer Gene Census; http://www.nature.com/nrc/journal/v4/n3/abs/nrc1299.html, 4 CancerGenes; http://nar.oxfordjournals.org/content/35/suppl_1/D721.long, 5 Network of Cancer Gene; http://ncg.kcl.ac.uk/index.php, 1Therapeutic Vulnerabilities in Cancer; http://cbio.mskcc.org/cancergenomics/statius/ |
| REACTOME_INTEGRATION_OF_ENERGY_METABOLISM | |
| OMIM | |
| Orphanet | |
| Disease | KEGG Disease: ITPR2 |
| MedGen: ITPR2 (Human Medical Genetics with Condition) | |
| ClinVar: ITPR2 | |
| Phenotype | MGI: ITPR2 (International Mouse Phenotyping Consortium) |
| PhenomicDB: ITPR2 | |
| Mutations for ITPR2 |
| * Under tables are showing count per each tissue to give us broad intuition about tissue specific mutation patterns.You can go to the detailed page for each mutation database's web site. |
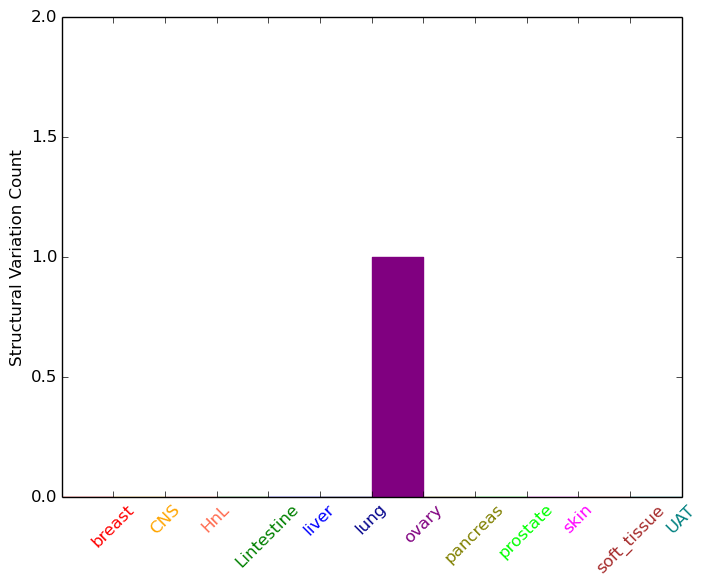
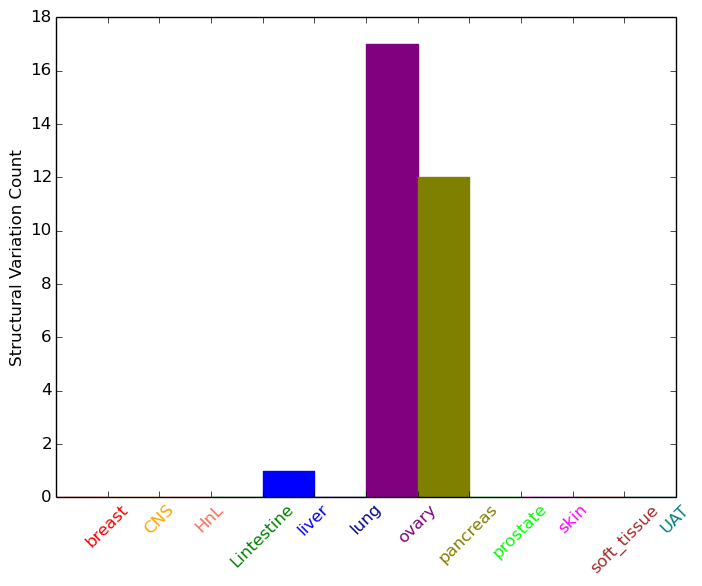
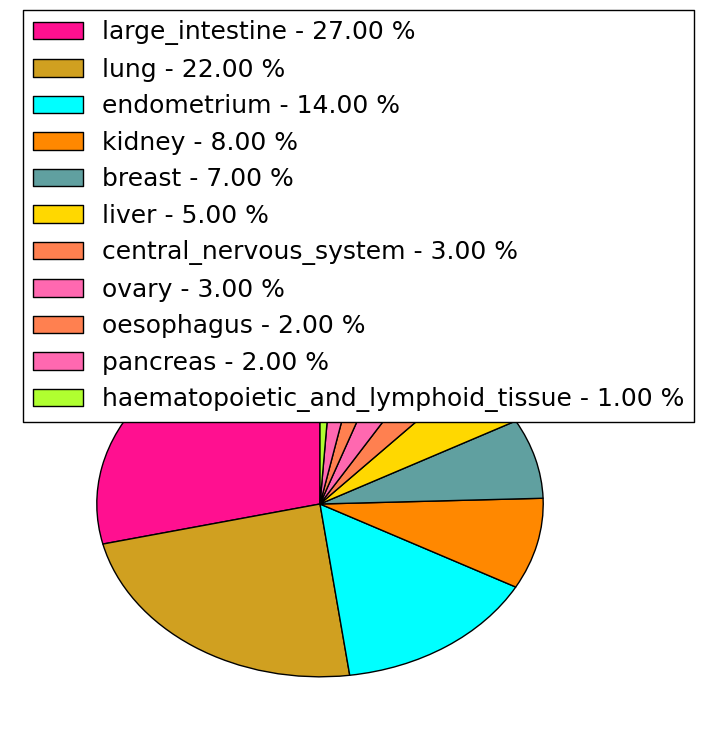
| - Statistics for Tissue and Mutation type | Top |
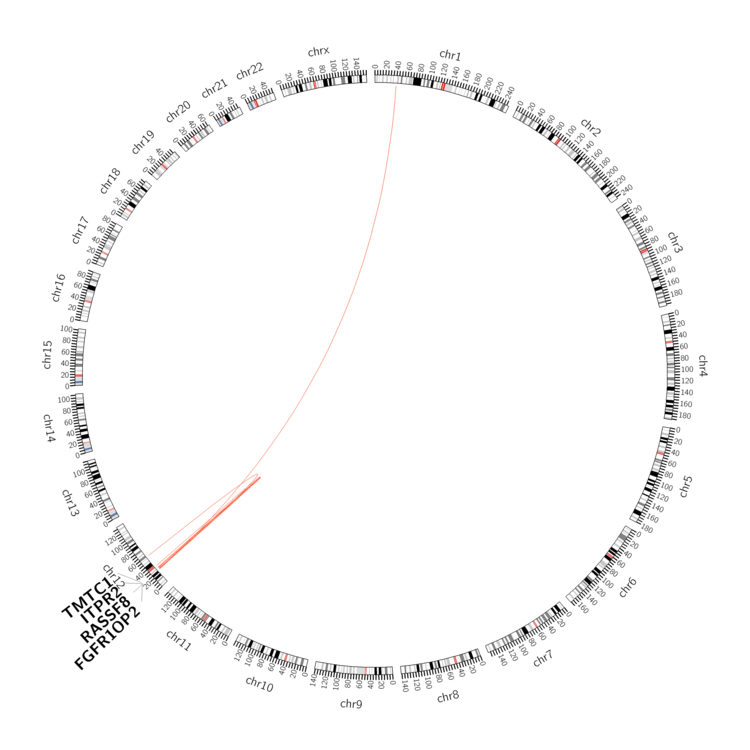 |
| - For Inter-chromosomal Variations |
| * Inter-chromosomal variantions includes 'interchromosomal amplicon to amplicon', 'interchromosomal amplicon to non-amplified dna', 'interchromosomal insertion', 'Interchromosomal unknown type'. |
 |
| - For Intra-chromosomal Variations |
| * Intra-chromosomal variantions includes 'intrachromosomal amplicon to amplicon', 'intrachromosomal amplicon to non-amplified dna', 'intrachromosomal deletion', 'intrachromosomal fold-back inversion', 'intrachromosomal inversion', 'intrachromosomal tandem duplication', 'Intrachromosomal unknown type', 'intrachromosomal with inverted orientation', 'intrachromosomal with non-inverted orientation'. |
 |
| Sample | Symbol_a | Chr_a | Start_a | End_a | Symbol_b | Chr_b | Start_b | End_b |
| liver | ITPR2 | chr12 | 26835062 | 26835062 | ITPR2 | chr12 | 26963351 | 26963351 |
| ovary | ITPR2 | chr12 | 26525637 | 26525657 | RASSF8 | chr12 | 26199183 | 26199203 |
| ovary | ITPR2 | chr12 | 26527907 | 26527927 | ITPR2 | chr12 | 26529764 | 26529784 |
| ovary | ITPR2 | chr12 | 26565712 | 26565732 | ITPR2 | chr12 | 26531571 | 26531591 |
| ovary | ITPR2 | chr12 | 26607674 | 26607694 | TMTC1 | chr12 | 29668283 | 29668303 |
| ovary | ITPR2 | chr12 | 26657187 | 26657207 | ITPR2 | chr12 | 26662150 | 26662170 |
| ovary | ITPR2 | chr12 | 26657195 | 26657215 | ITPR2 | chr12 | 26662150 | 26662170 |
| ovary | ITPR2 | chr12 | 26669554 | 26669574 | chr12 | 26065352 | 26065372 | |
| ovary | ITPR2 | chr12 | 26673137 | 26673157 | ITPR2 | chr12 | 26652709 | 26652729 |
| ovary | ITPR2 | chr12 | 26721794 | 26721814 | ITPR2 | chr12 | 26722027 | 26722047 |
| ovary | ITPR2 | chr12 | 26774282 | 26774302 | chr12 | 28338208 | 28338228 | |
| ovary | ITPR2 | chr12 | 26843455 | 26843475 | ITPR2 | chr12 | 26851106 | 26851126 |
| ovary | ITPR2 | chr12 | 26957954 | 26957974 | ITPR2 | chr12 | 26964166 | 26964186 |
| ovary | ITPR2 | chr12 | 26978194 | 26978214 | ITPR2 | chr12 | 26972306 | 26972326 |
| ovary | ITPR2 | chr12 | 26984866 | 26984886 | chr12 | 26991036 | 26991056 | |
| ovary | ITPR2 | chr12 | 26985936 | 26985956 | FGFR1OP2 | chr12 | 27103012 | 27103032 |
| pancreas | ITPR2 | chr12 | 26534733 | 26534753 | chr12 | 30513108 | 30513128 | |
| pancreas | ITPR2 | chr12 | 26536945 | 26536965 | chr12 | 28054145 | 28054165 | |
| pancreas | ITPR2 | chr12 | 26538373 | 26538393 | ITPR2 | chr12 | 26609092 | 26609112 |
| pancreas | ITPR2 | chr12 | 26541759 | 26541779 | chr12 | 28063795 | 28063815 | |
| pancreas | ITPR2 | chr12 | 26609070 | 26609090 | chr12 | 26326288 | 26326308 | |
| pancreas | ITPR2 | chr12 | 26618012 | 26618032 | chr12 | 34526376 | 34526396 | |
| pancreas | ITPR2 | chr12 | 26629821 | 26629841 | chr12 | 28068492 | 28068512 | |
| pancreas | ITPR2 | chr12 | 26681768 | 26681788 | chr12 | 34510899 | 34510919 | |
| pancreas | ITPR2 | chr12 | 26725182 | 26725202 | ITPR2 | chr12 | 26732096 | 26732116 |
| pancreas | ITPR2 | chr12 | 26729444 | 26729464 | chr12 | 30599481 | 30599501 | |
| pancreas | ITPR2 | chr12 | 26751128 | 26751148 | ITPR2 | chr12 | 26765346 | 26765366 |
| pancreas | ITPR2 | chr12 | 26753082 | 26753102 | chr12 | 58264420 | 58264440 |
| cf) Tissue number; Tissue name (1;Breast, 2;Central_nervous_system, 3;Haematopoietic_and_lymphoid_tissue, 4;Large_intestine, 5;Liver, 6;Lung, 7;Ovary, 8;Pancreas, 9;Prostate, 10;Skin, 11;Soft_tissue, 12;Upper_aerodigestive_tract) |
| * From mRNA Sanger sequences, Chitars2.0 arranged chimeric transcripts. This table shows ITPR2 related fusion information. |
| ID | Head Gene | Tail Gene | Accession | Gene_a | qStart_a | qEnd_a | Chromosome_a | tStart_a | tEnd_a | Gene_a | qStart_a | qEnd_a | Chromosome_a | tStart_a | tEnd_a |
| AK122857 | ITPR2 | 254 | 965 | 12 | 26832853 | 26833562 | HOMER1 | 961 | 1758 | 5 | 78671747 | 78742912 | |
| DA056326 | ITPR2 | 1 | 232 | 12 | 26648161 | 26709255 | FAM59A | 233 | 563 | 18 | 29992869 | 29993199 | |
| BF327272 | ZNF766 | 1 | 77 | 19 | 52772846 | 52785401 | ITPR2 | 70 | 331 | 12 | 26648132 | 26709260 | |
| AA526621 | ITPR2 | 1 | 78 | 12 | 26490189 | 26490266 | ITPR2 | 62 | 247 | 12 | 26490256 | 26490442 | |
| AI133642 | ITPR2 | 1 | 83 | 12 | 26853999 | 26854081 | EIF5 | 82 | 630 | 14 | 103800574 | 103802408 | |
| AA525297 | ITPR2 | 1 | 78 | 12 | 26490189 | 26490266 | ITPR2 | 62 | 247 | 12 | 26490256 | 26490442 | |
| AL832587 | SUGP2 | 51 | 4751 | 19 | 19103732 | 19141892 | ITPR2 | 4747 | 4772 | 12 | 26536695 | 26536720 | |
| BI027067 | POLDIP3 | 1 | 210 | 22 | 42980893 | 42981107 | ITPR2 | 209 | 364 | 12 | 26633327 | 26633482 | |
| AW972739 | ITPR2 | 116 | 204 | 12 | 26490189 | 26490277 | ITPR2 | 188 | 373 | 12 | 26490256 | 26490442 | |
| BQ331543 | ARF3 | 22 | 240 | 12 | 49333782 | 49334840 | ITPR2 | 234 | 508 | 12 | 26959676 | 26959951 | |
| Top |
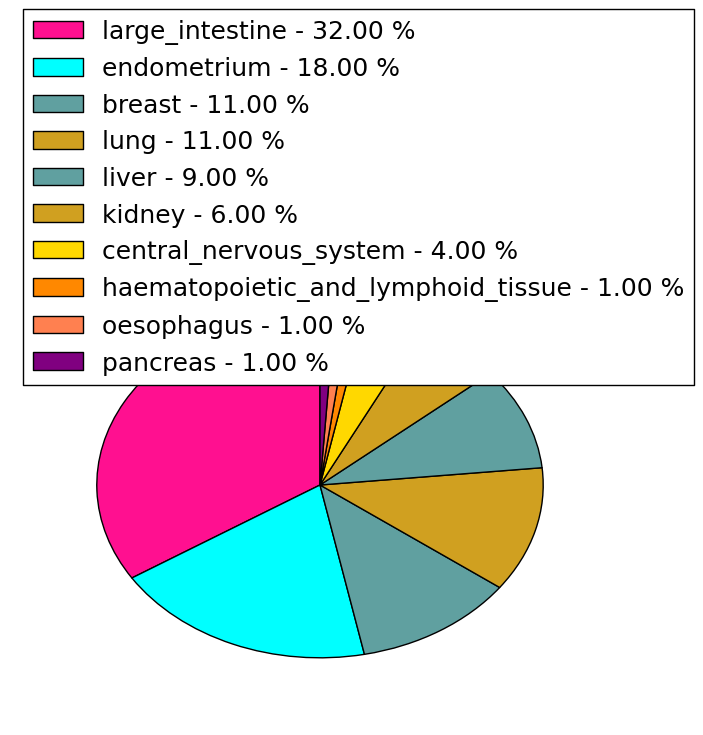
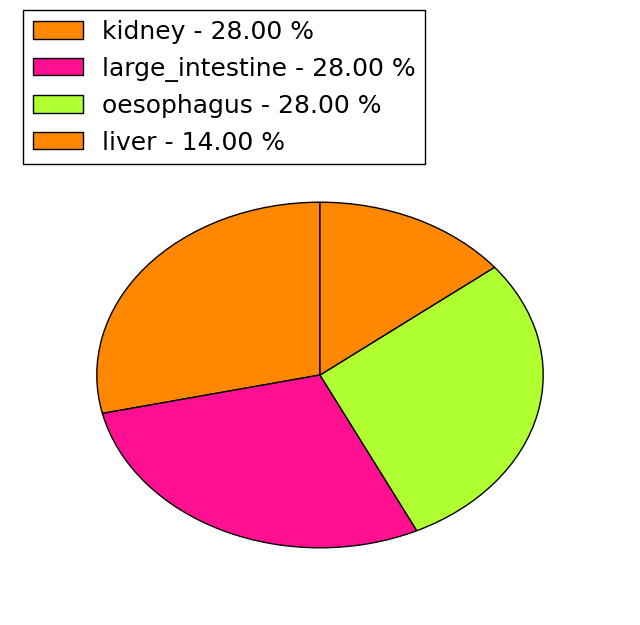
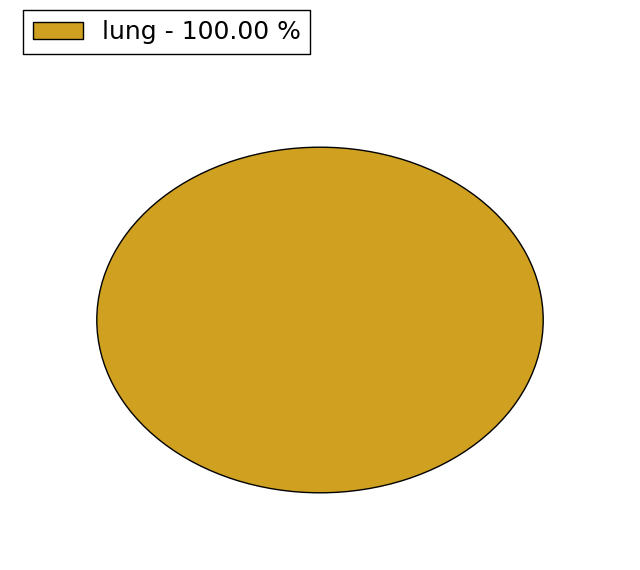
| Mutation type/ Tissue ID | brca | cns | cerv | endome | haematopo | kidn | Lintest | liver | lung | ns | ovary | pancre | prost | skin | stoma | thyro | urina | |||
| Total # sample | 13 | 3 | 5 | 3 | 10 | 19 | 1 | 8 | 1 | |||||||||||
| GAIN (# sample) | 13 | 3 | 5 | 2 | 10 | 19 | 1 | 8 | 1 | |||||||||||
| LOSS (# sample) | 1 |
| cf) Tissue ID; Tissue type (1; Breast, 2; Central_nervous_system, 3; Cervix, 4; Endometrium, 5; Haematopoietic_and_lymphoid_tissue, 6; Kidney, 7; Large_intestine, 8; Liver, 9; Lung, 10; NS, 11; Ovary, 12; Pancreas, 13; Prostate, 14; Skin, 15; Stomach, 16; Thyroid, 17; Urinary_tract) |
| Top |
|
 |
| Top |
| Stat. for Non-Synonymous SNVs (# total SNVs=231) | (# total SNVs=61) |
 |  |
(# total SNVs=7) | (# total SNVs=1) |
 |  |
| Top |
| * When you move the cursor on each content, you can see more deailed mutation information on the Tooltip. Those are primary_site,primary_histology,mutation(aa),pubmedID. |
| GRCh37 position | Mutation(aa) | Unique sampleID count |
| chr12:26839563-26839563 | p.R333R | 4 |
| chr12:26640150-26640150 | p.K1802fs*13 | 3 |
| chr12:26749897-26749897 | p.V1391V | 3 |
| chr12:26714877-26714877 | p.R1547C | 3 |
| chr12:26592234-26592234 | p.T2157A | 3 |
| chr12:26629850-26629850 | p.E2072* | 2 |
| chr12:26834898-26834898 | p.R440* | 2 |
| chr12:26775274-26775274 | p.H1063Y | 2 |
| chr12:26596517-26596517 | p.E2137K | 2 |
| chr12:26755382-26755382 | p.N1201fs*7 | 2 |
| Top |
|
 |
| Point Mutation/ Tissue ID | 1 | 2 | 3 | 4 | 5 | 6 | 7 | 8 | 9 | 10 | 11 | 12 | 13 | 14 | 15 | 16 | 17 | 18 | 19 | 20 |
| # sample | 8 | 10 | 1 | 38 | 5 | 10 | 1 | 12 | 3 | 29 | 14 | 7 | 15 | 22 | 4 | 25 | ||||
| # mutation | 9 | 11 | 1 | 46 | 5 | 11 | 1 | 13 | 3 | 35 | 14 | 7 | 17 | 28 | 4 | 41 | ||||
| nonsynonymous SNV | 7 | 7 | 1 | 34 | 3 | 9 | 11 | 1 | 27 | 11 | 7 | 12 | 17 | 4 | 30 | |||||
| synonymous SNV | 2 | 4 | 12 | 2 | 2 | 1 | 2 | 2 | 8 | 3 | 5 | 11 | 11 |
| cf) Tissue ID; Tissue type (1; BLCA[Bladder Urothelial Carcinoma], 2; BRCA[Breast invasive carcinoma], 3; CESC[Cervical squamous cell carcinoma and endocervical adenocarcinoma], 4; COAD[Colon adenocarcinoma], 5; GBM[Glioblastoma multiforme], 6; Glioma Low Grade, 7; HNSC[Head and Neck squamous cell carcinoma], 8; KICH[Kidney Chromophobe], 9; KIRC[Kidney renal clear cell carcinoma], 10; KIRP[Kidney renal papillary cell carcinoma], 11; LAML[Acute Myeloid Leukemia], 12; LUAD[Lung adenocarcinoma], 13; LUSC[Lung squamous cell carcinoma], 14; OV[Ovarian serous cystadenocarcinoma ], 15; PAAD[Pancreatic adenocarcinoma], 16; PRAD[Prostate adenocarcinoma], 17; SKCM[Skin Cutaneous Melanoma], 18:STAD[Stomach adenocarcinoma], 19:THCA[Thyroid carcinoma], 20:UCEC[Uterine Corpus Endometrial Carcinoma]) |
| Top |
| * We represented just top 10 SNVs. When you move the cursor on each content, you can see more deailed mutation information on the Tooltip. Those are primary_site, primary_histology, mutation(aa), pubmedID. |
| Genomic Position | Mutation(aa) | Unique sampleID count |
| chr12:26714877 | p.R1547C | 3 |
| chr12:26592234 | p.T2157A | 3 |
| chr12:26839563 | p.R333R | 3 |
| chr12:26775310 | p.A2351V | 2 |
| chr12:26784907 | p.I405V | 2 |
| chr12:26639047 | p.S277I | 2 |
| chr12:26839489 | p.R1934Q | 2 |
| chr12:26639109 | p.L2065I | 2 |
| chr12:26592232 | p.P358Q | 2 |
| chr12:26868257 | p.L264F | 2 |
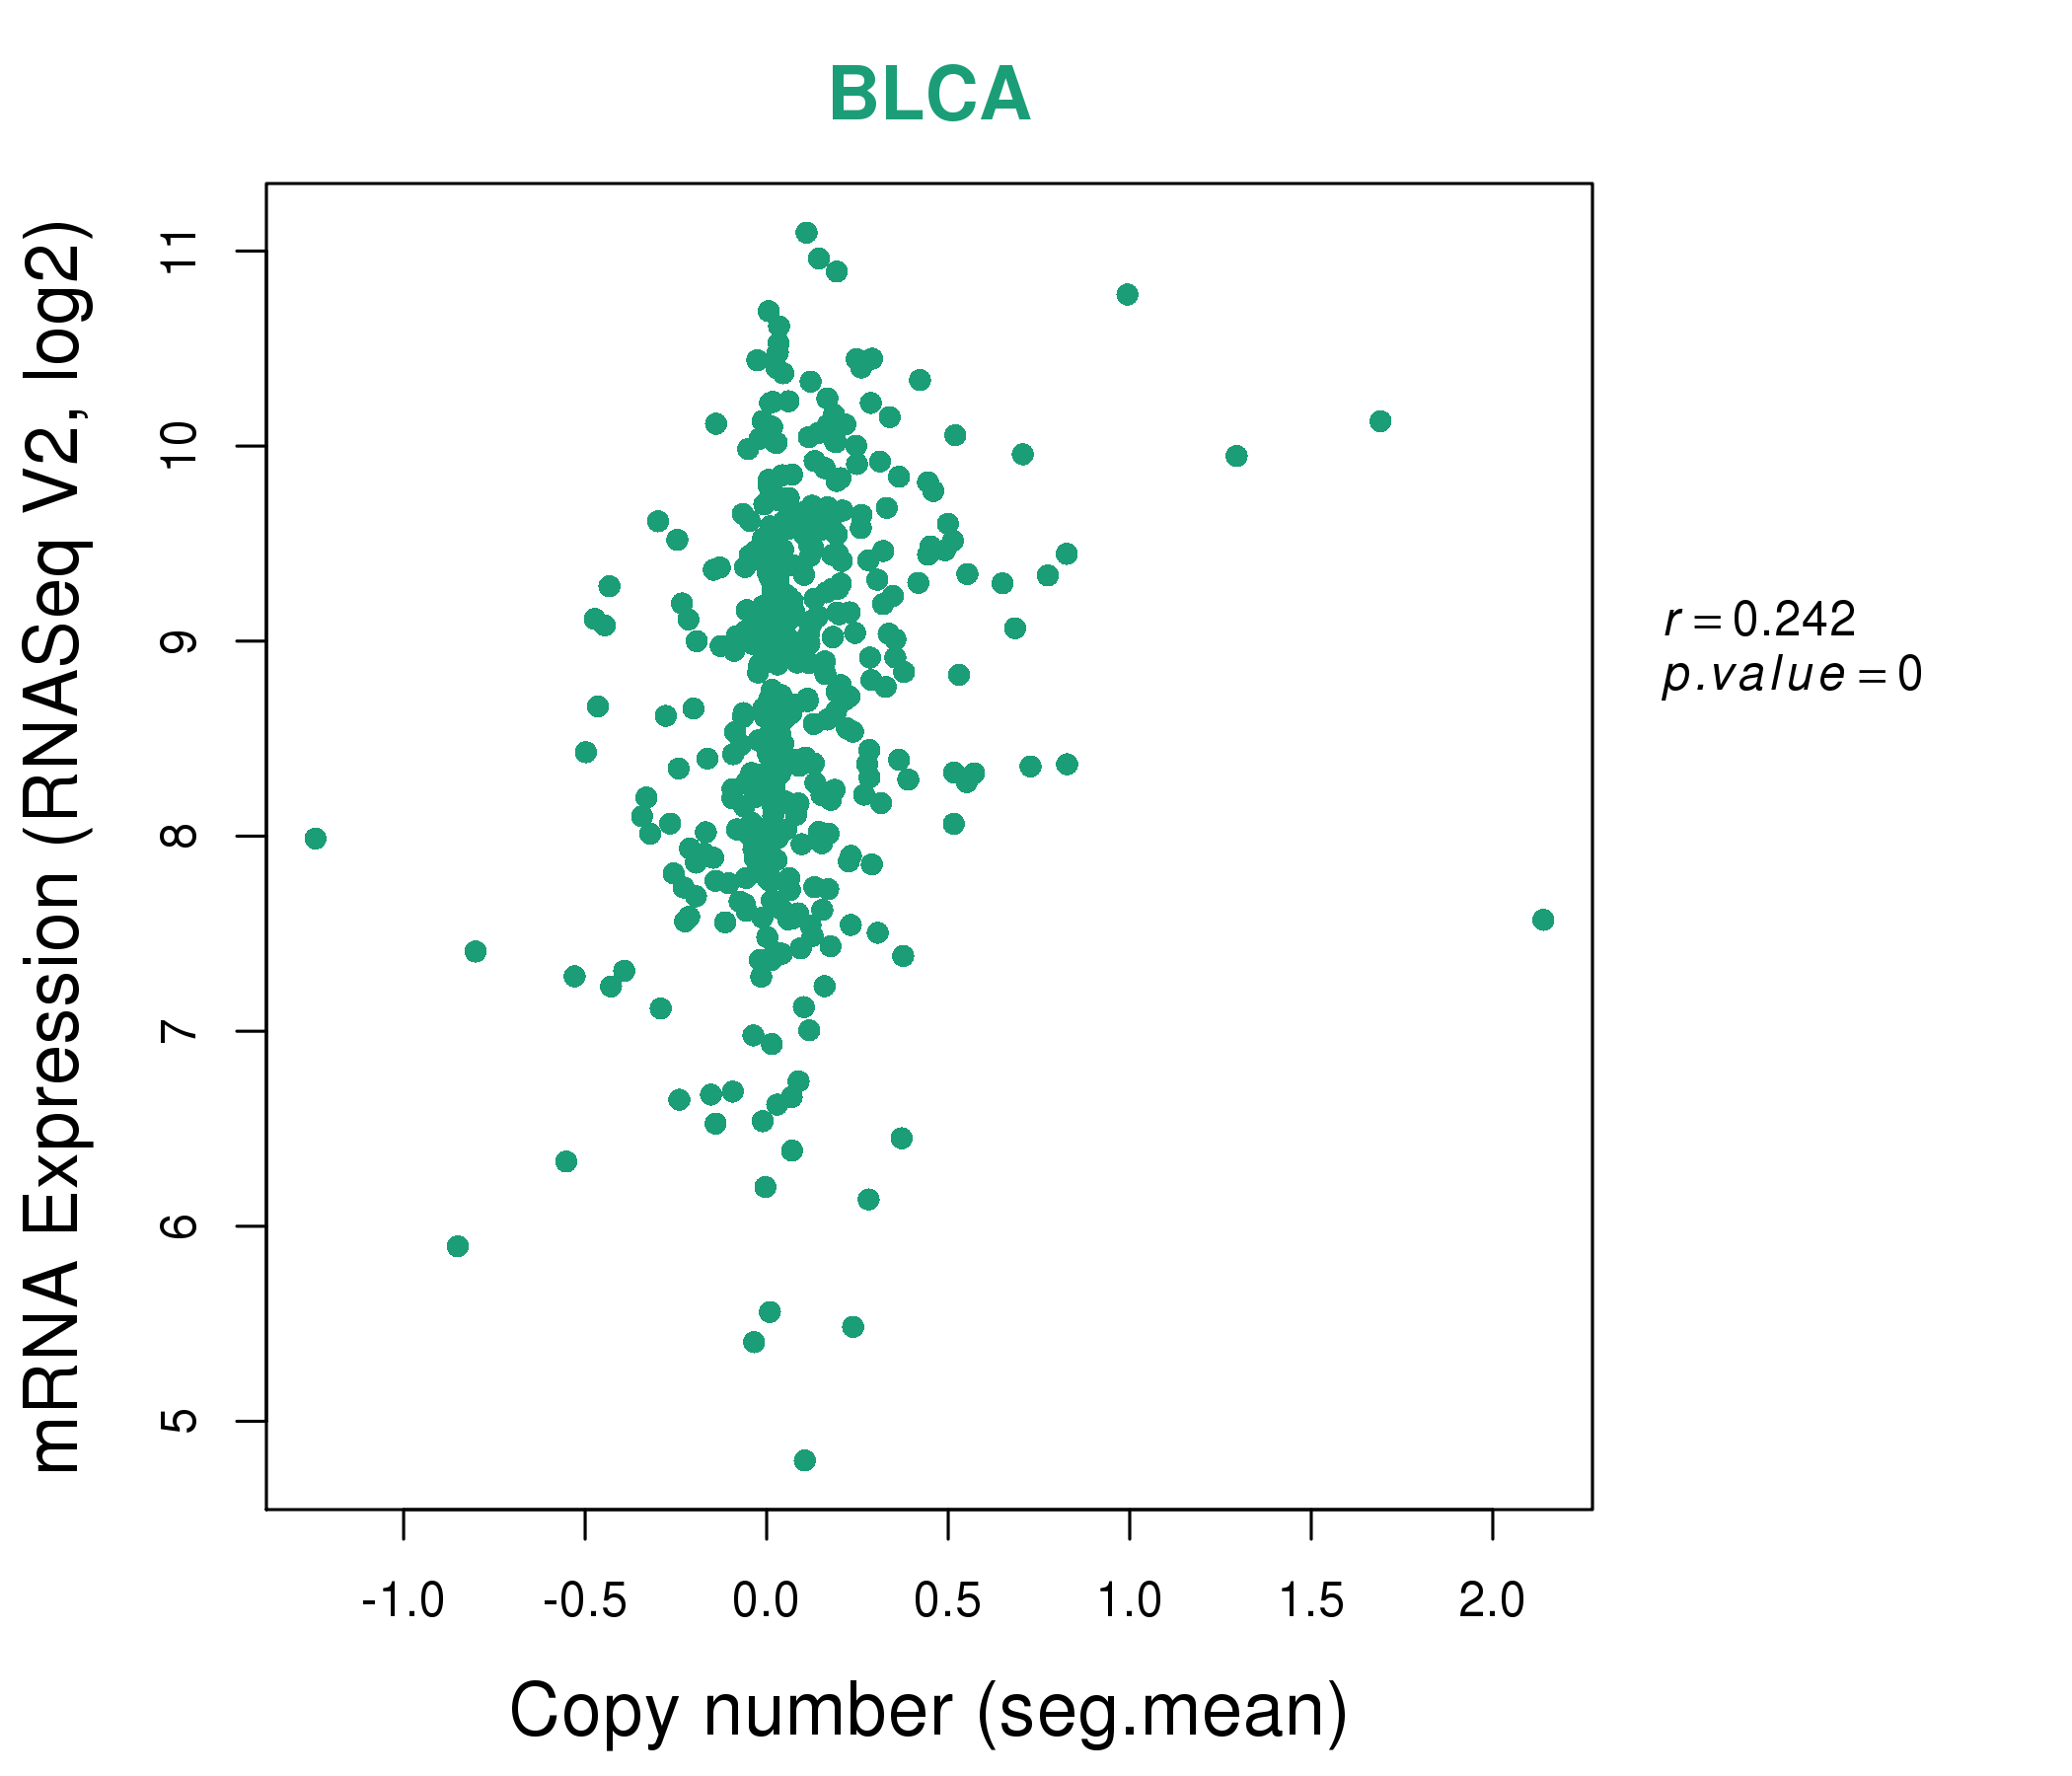
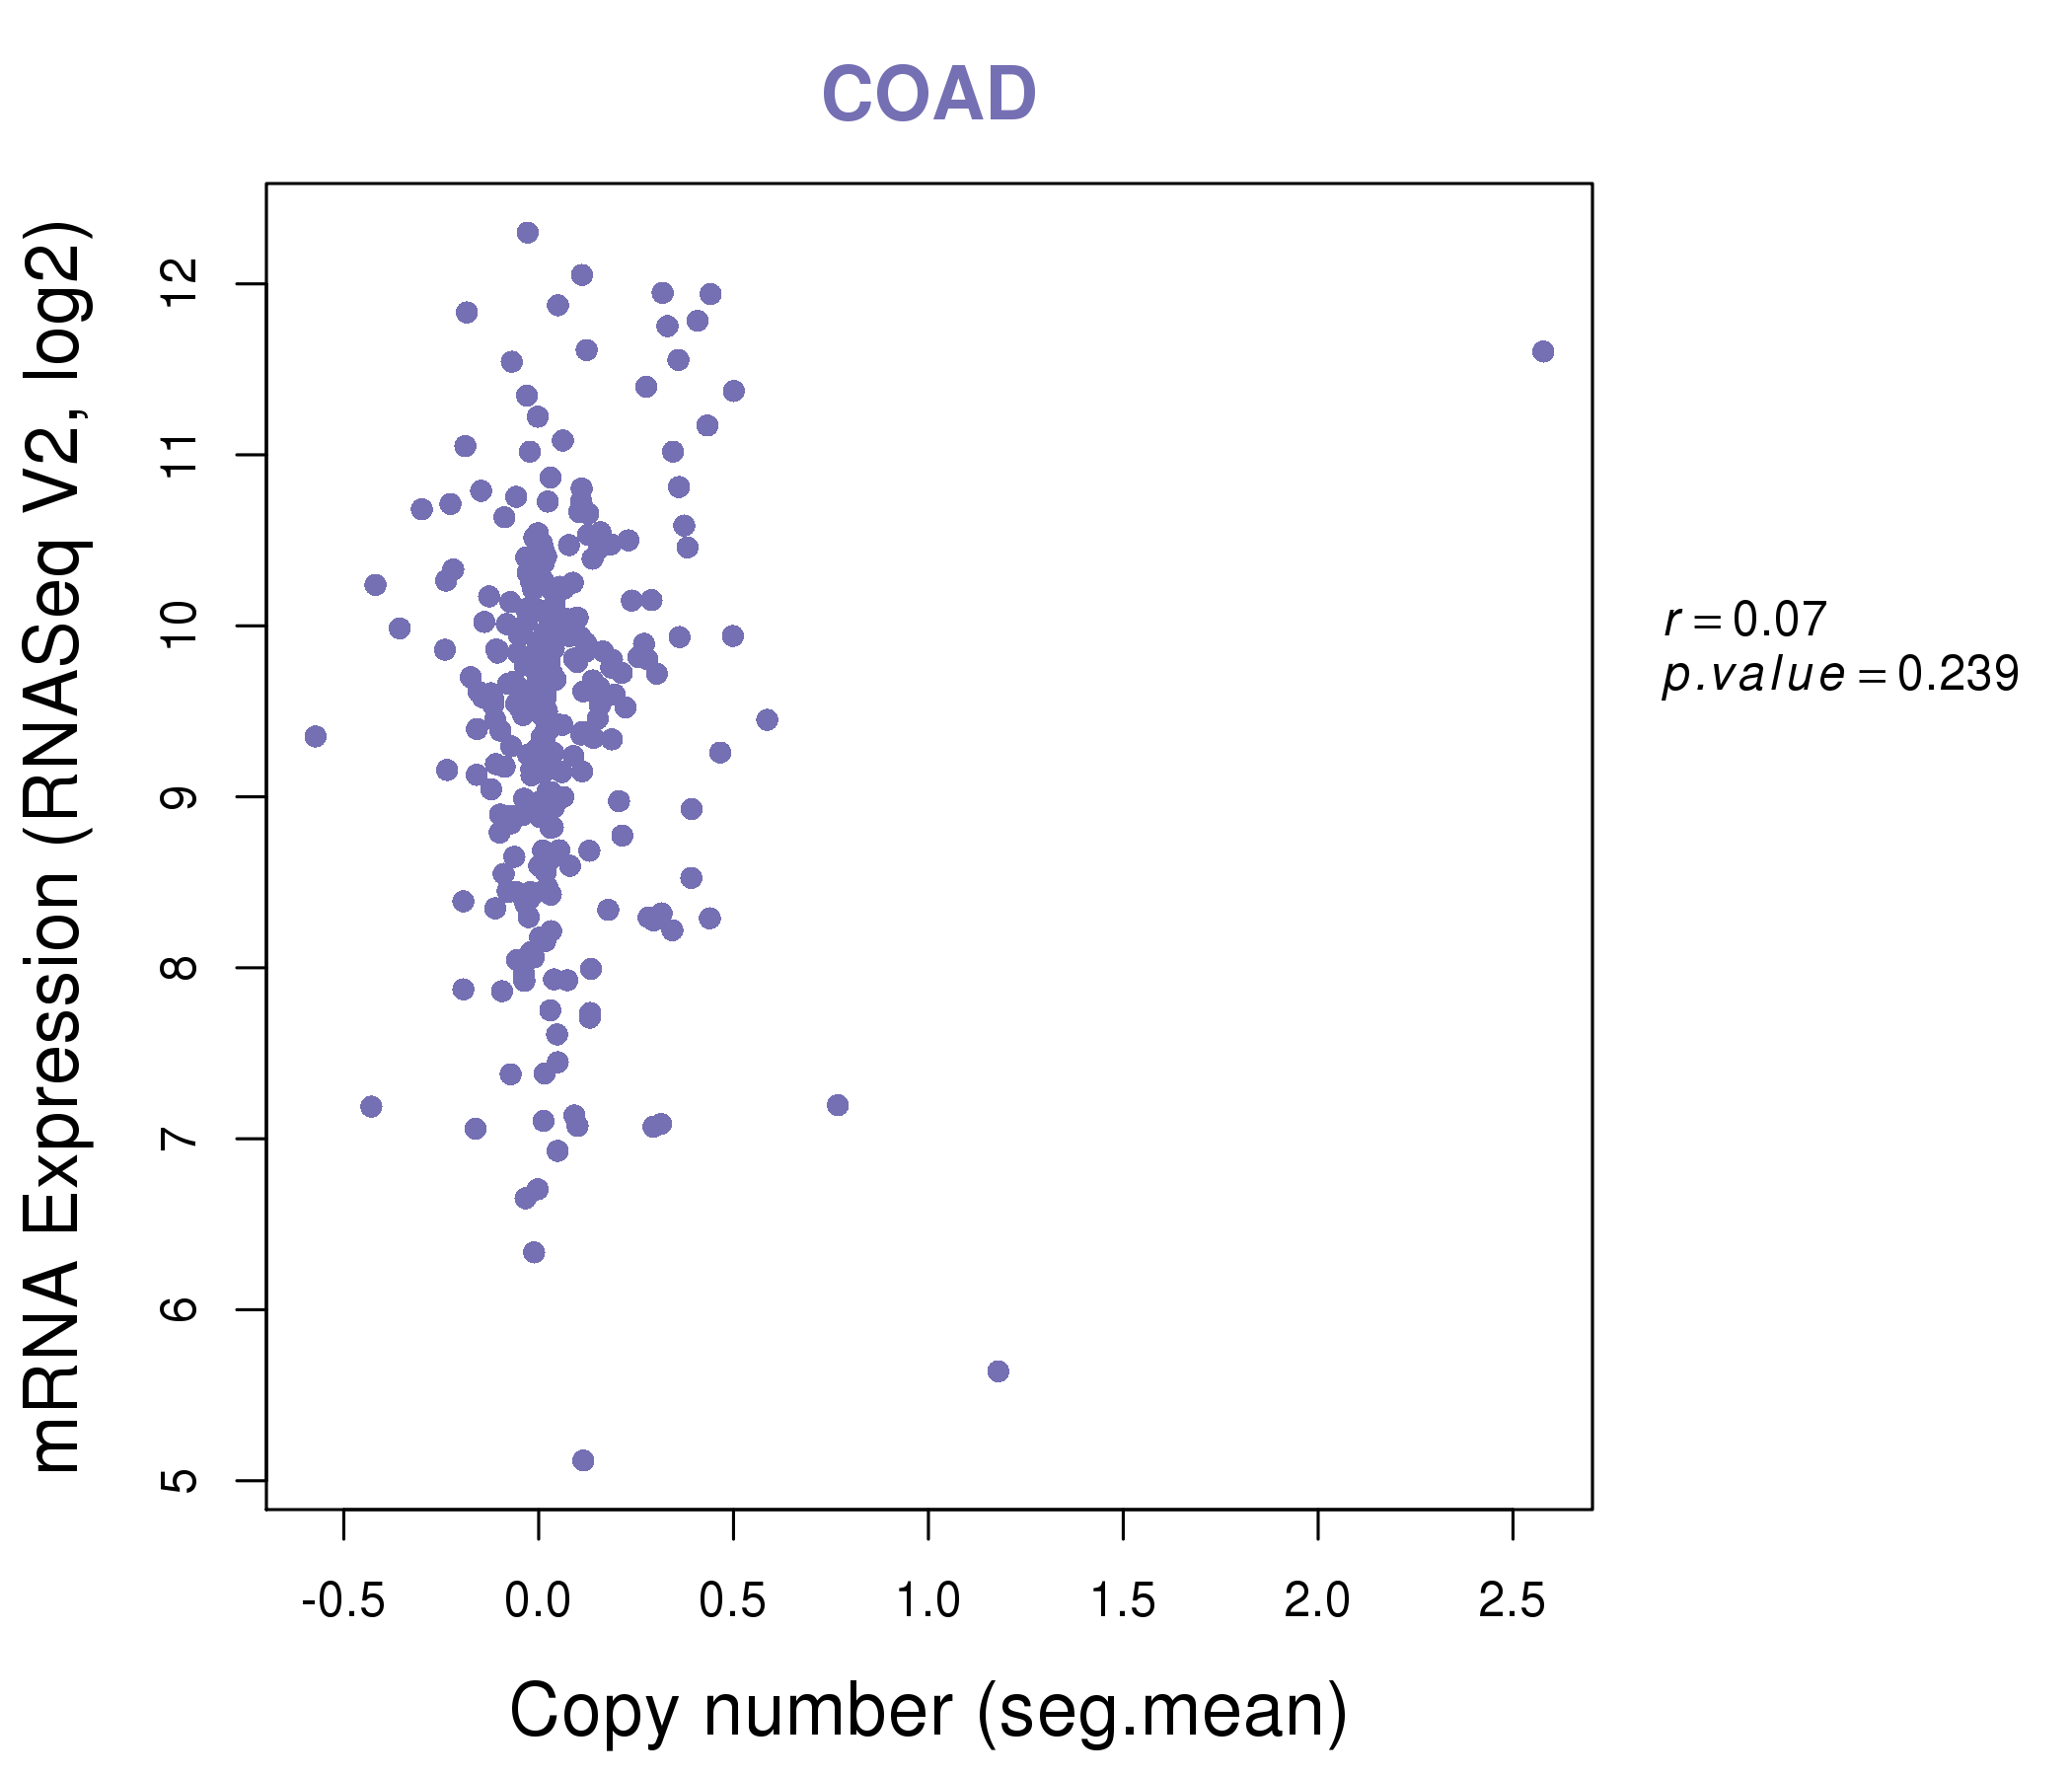
| * Copy number data were extracted from TCGA using R package TCGA-Assembler. The URLs of all public data files on TCGA DCC data server were gathered on Jan-05-2015. Function ProcessCNAData in TCGA-Assembler package was used to obtain gene-level copy number value which is calculated as the average copy number of the genomic region of a gene. |
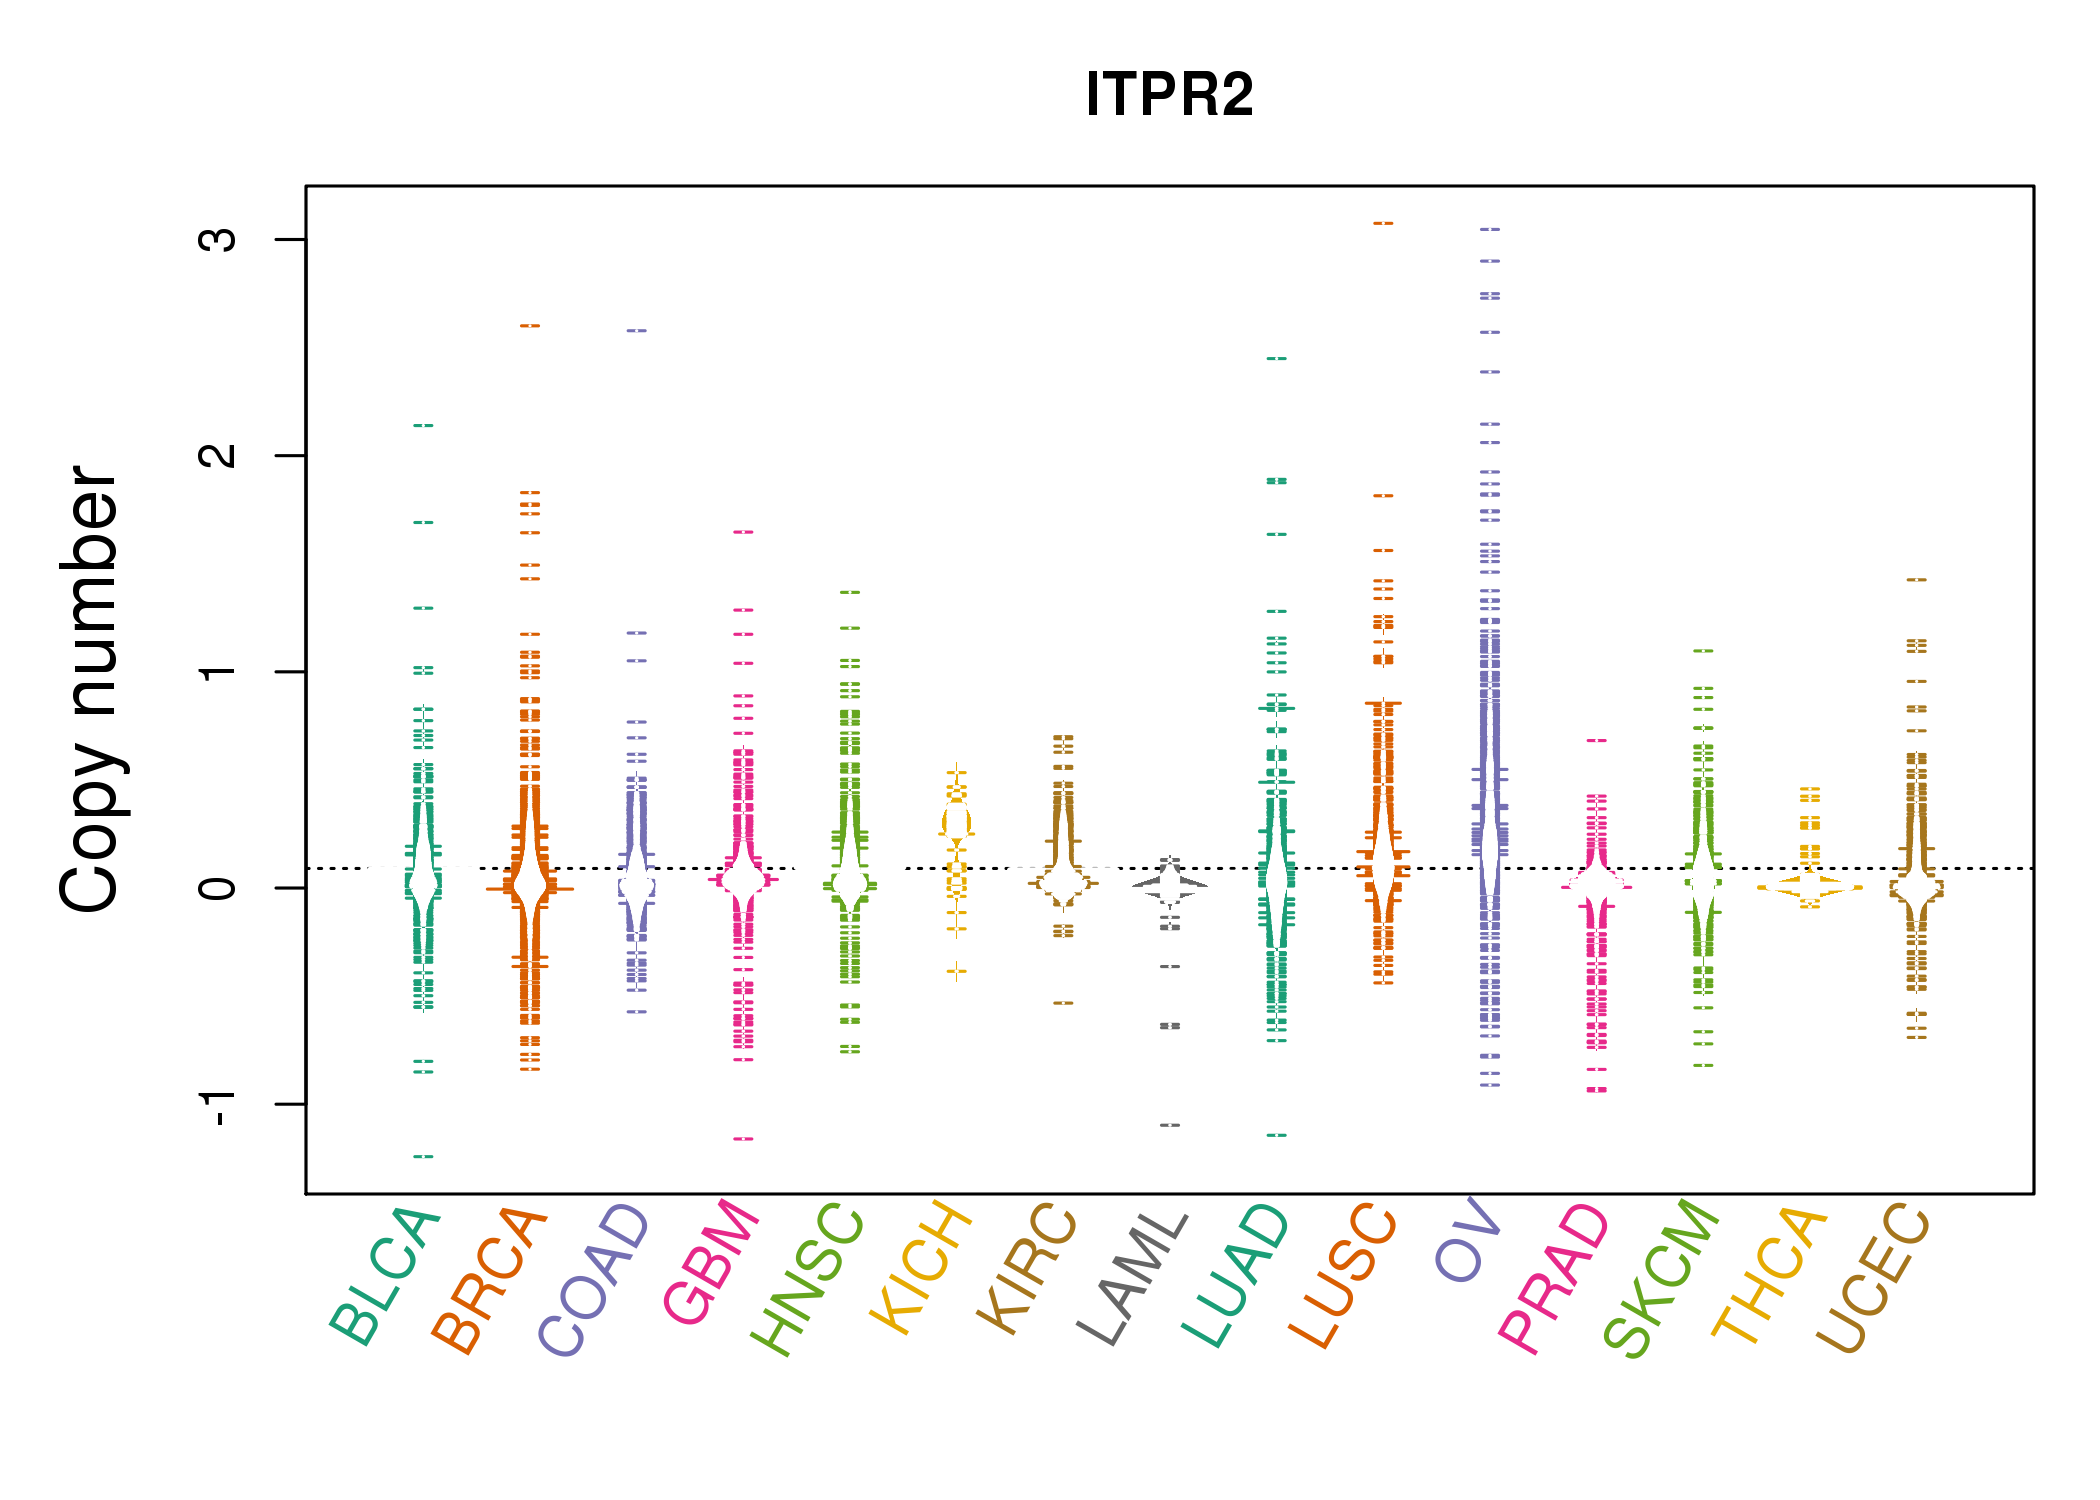 |
| cf) Tissue ID[Tissue type]: BLCA[Bladder Urothelial Carcinoma], BRCA[Breast invasive carcinoma], CESC[Cervical squamous cell carcinoma and endocervical adenocarcinoma], COAD[Colon adenocarcinoma], GBM[Glioblastoma multiforme], Glioma Low Grade, HNSC[Head and Neck squamous cell carcinoma], KICH[Kidney Chromophobe], KIRC[Kidney renal clear cell carcinoma], KIRP[Kidney renal papillary cell carcinoma], LAML[Acute Myeloid Leukemia], LUAD[Lung adenocarcinoma], LUSC[Lung squamous cell carcinoma], OV[Ovarian serous cystadenocarcinoma ], PAAD[Pancreatic adenocarcinoma], PRAD[Prostate adenocarcinoma], SKCM[Skin Cutaneous Melanoma], STAD[Stomach adenocarcinoma], THCA[Thyroid carcinoma], UCEC[Uterine Corpus Endometrial Carcinoma] |
| Top |
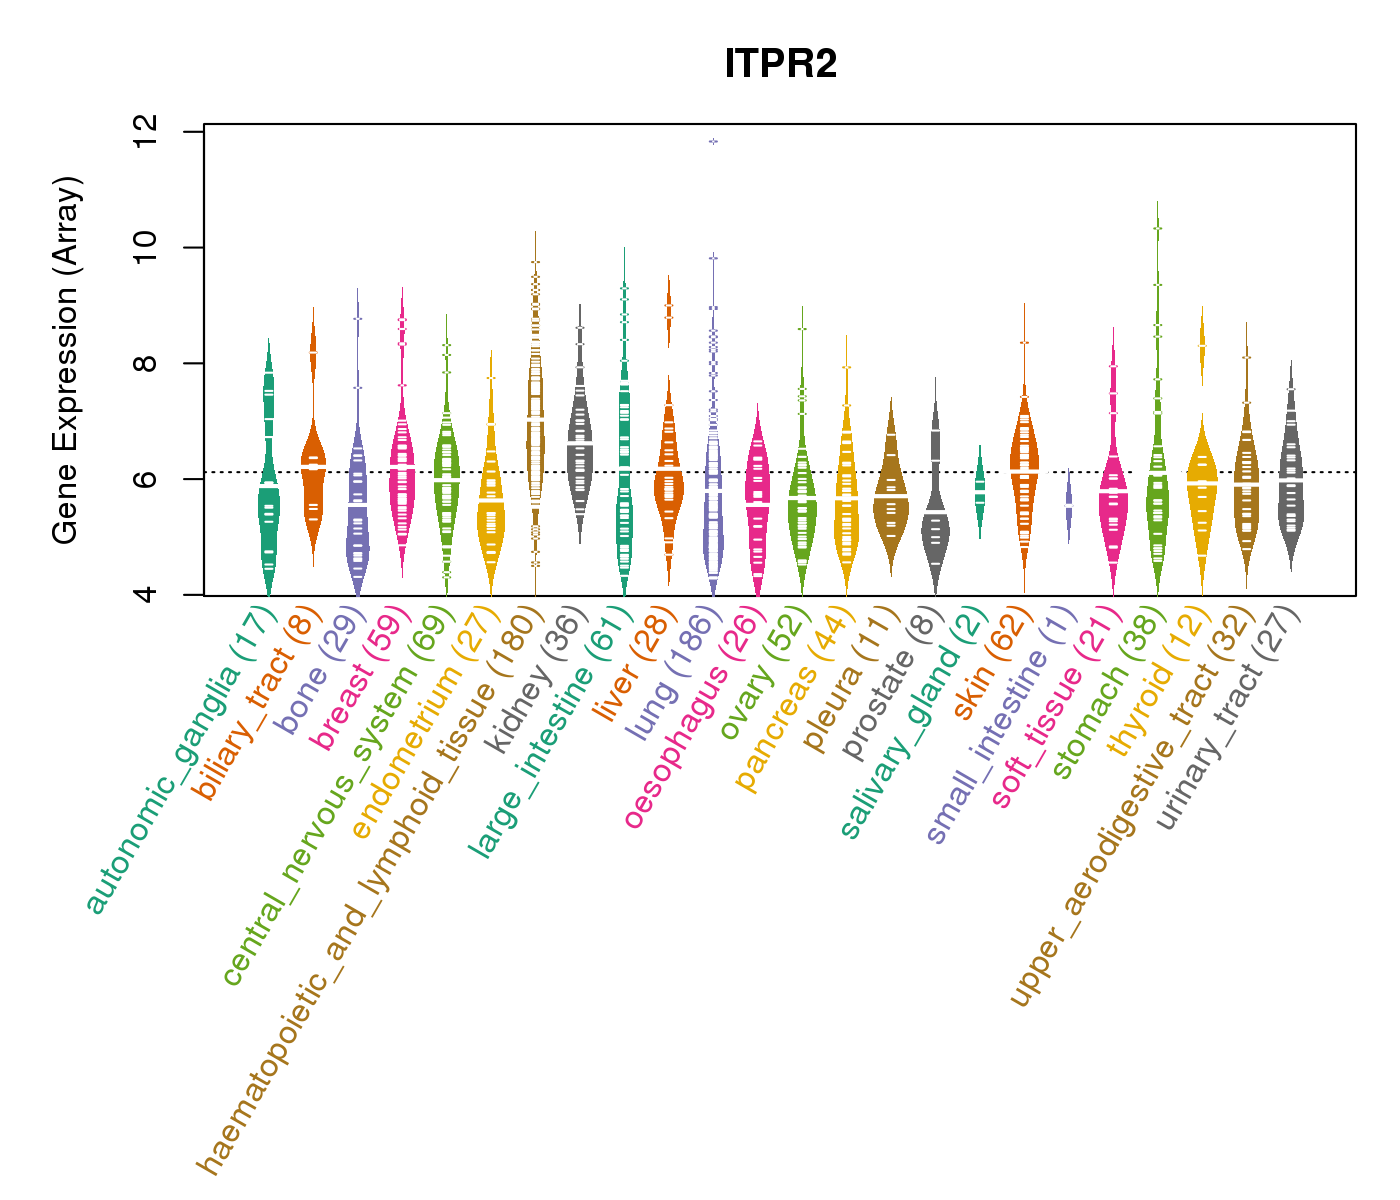
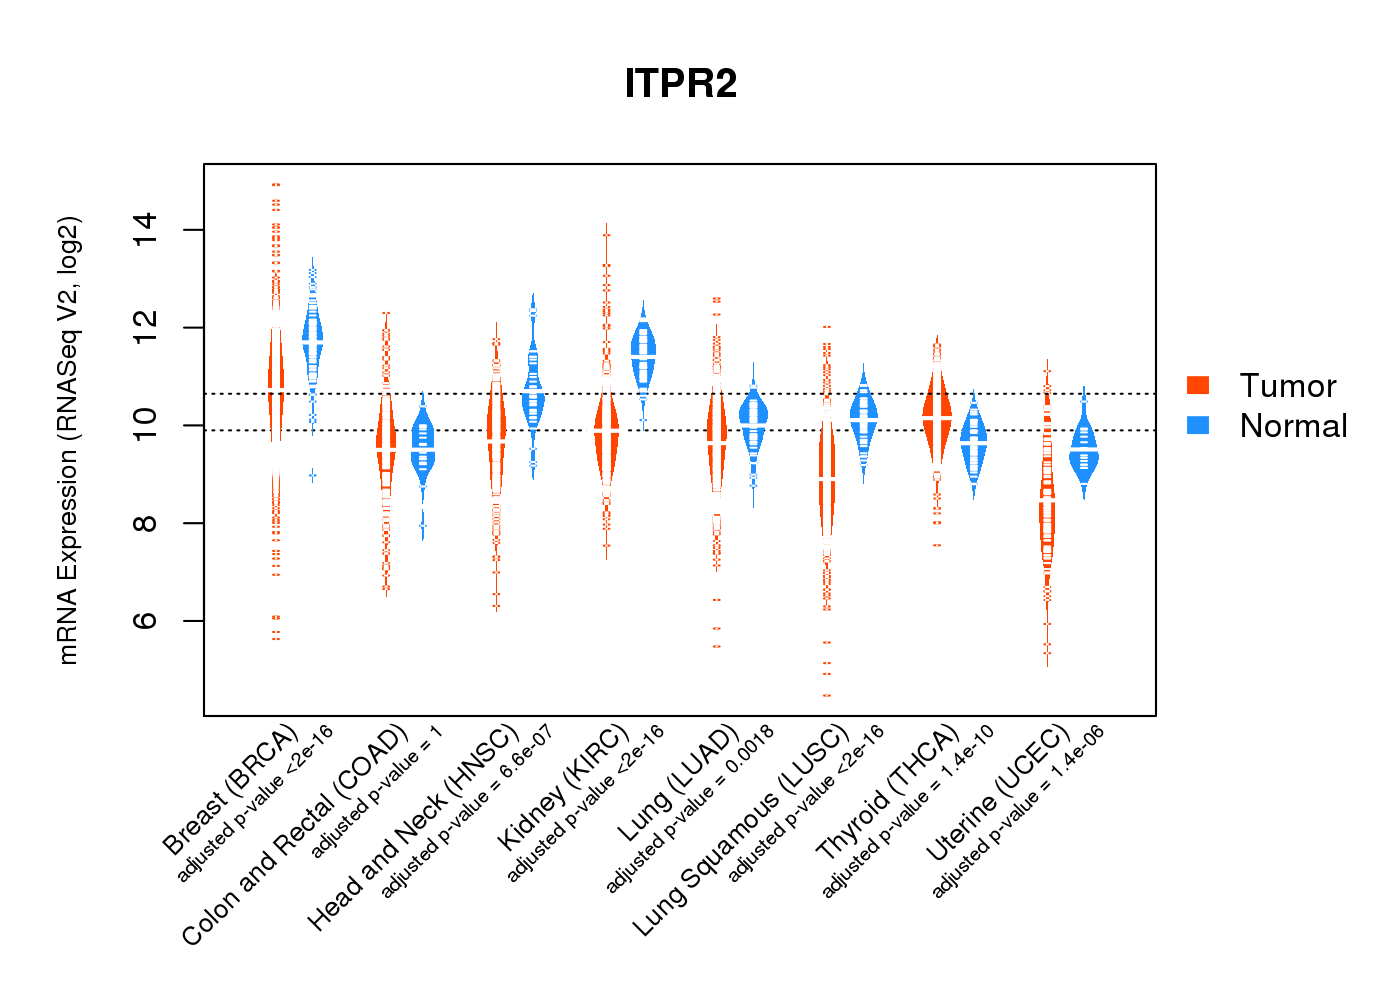
| Gene Expression for ITPR2 |
| * CCLE gene expression data were extracted from CCLE_Expression_Entrez_2012-10-18.res: Gene-centric RMA-normalized mRNA expression data. |
 |
| * Normalized gene expression data of RNASeqV2 was extracted from TCGA using R package TCGA-Assembler. The URLs of all public data files on TCGA DCC data server were gathered at Jan-05-2015. Only eight cancer types have enough normal control samples for differential expression analysis. (t test, adjusted p<0.05 (using Benjamini-Hochberg FDR)) |
 |
| Top |
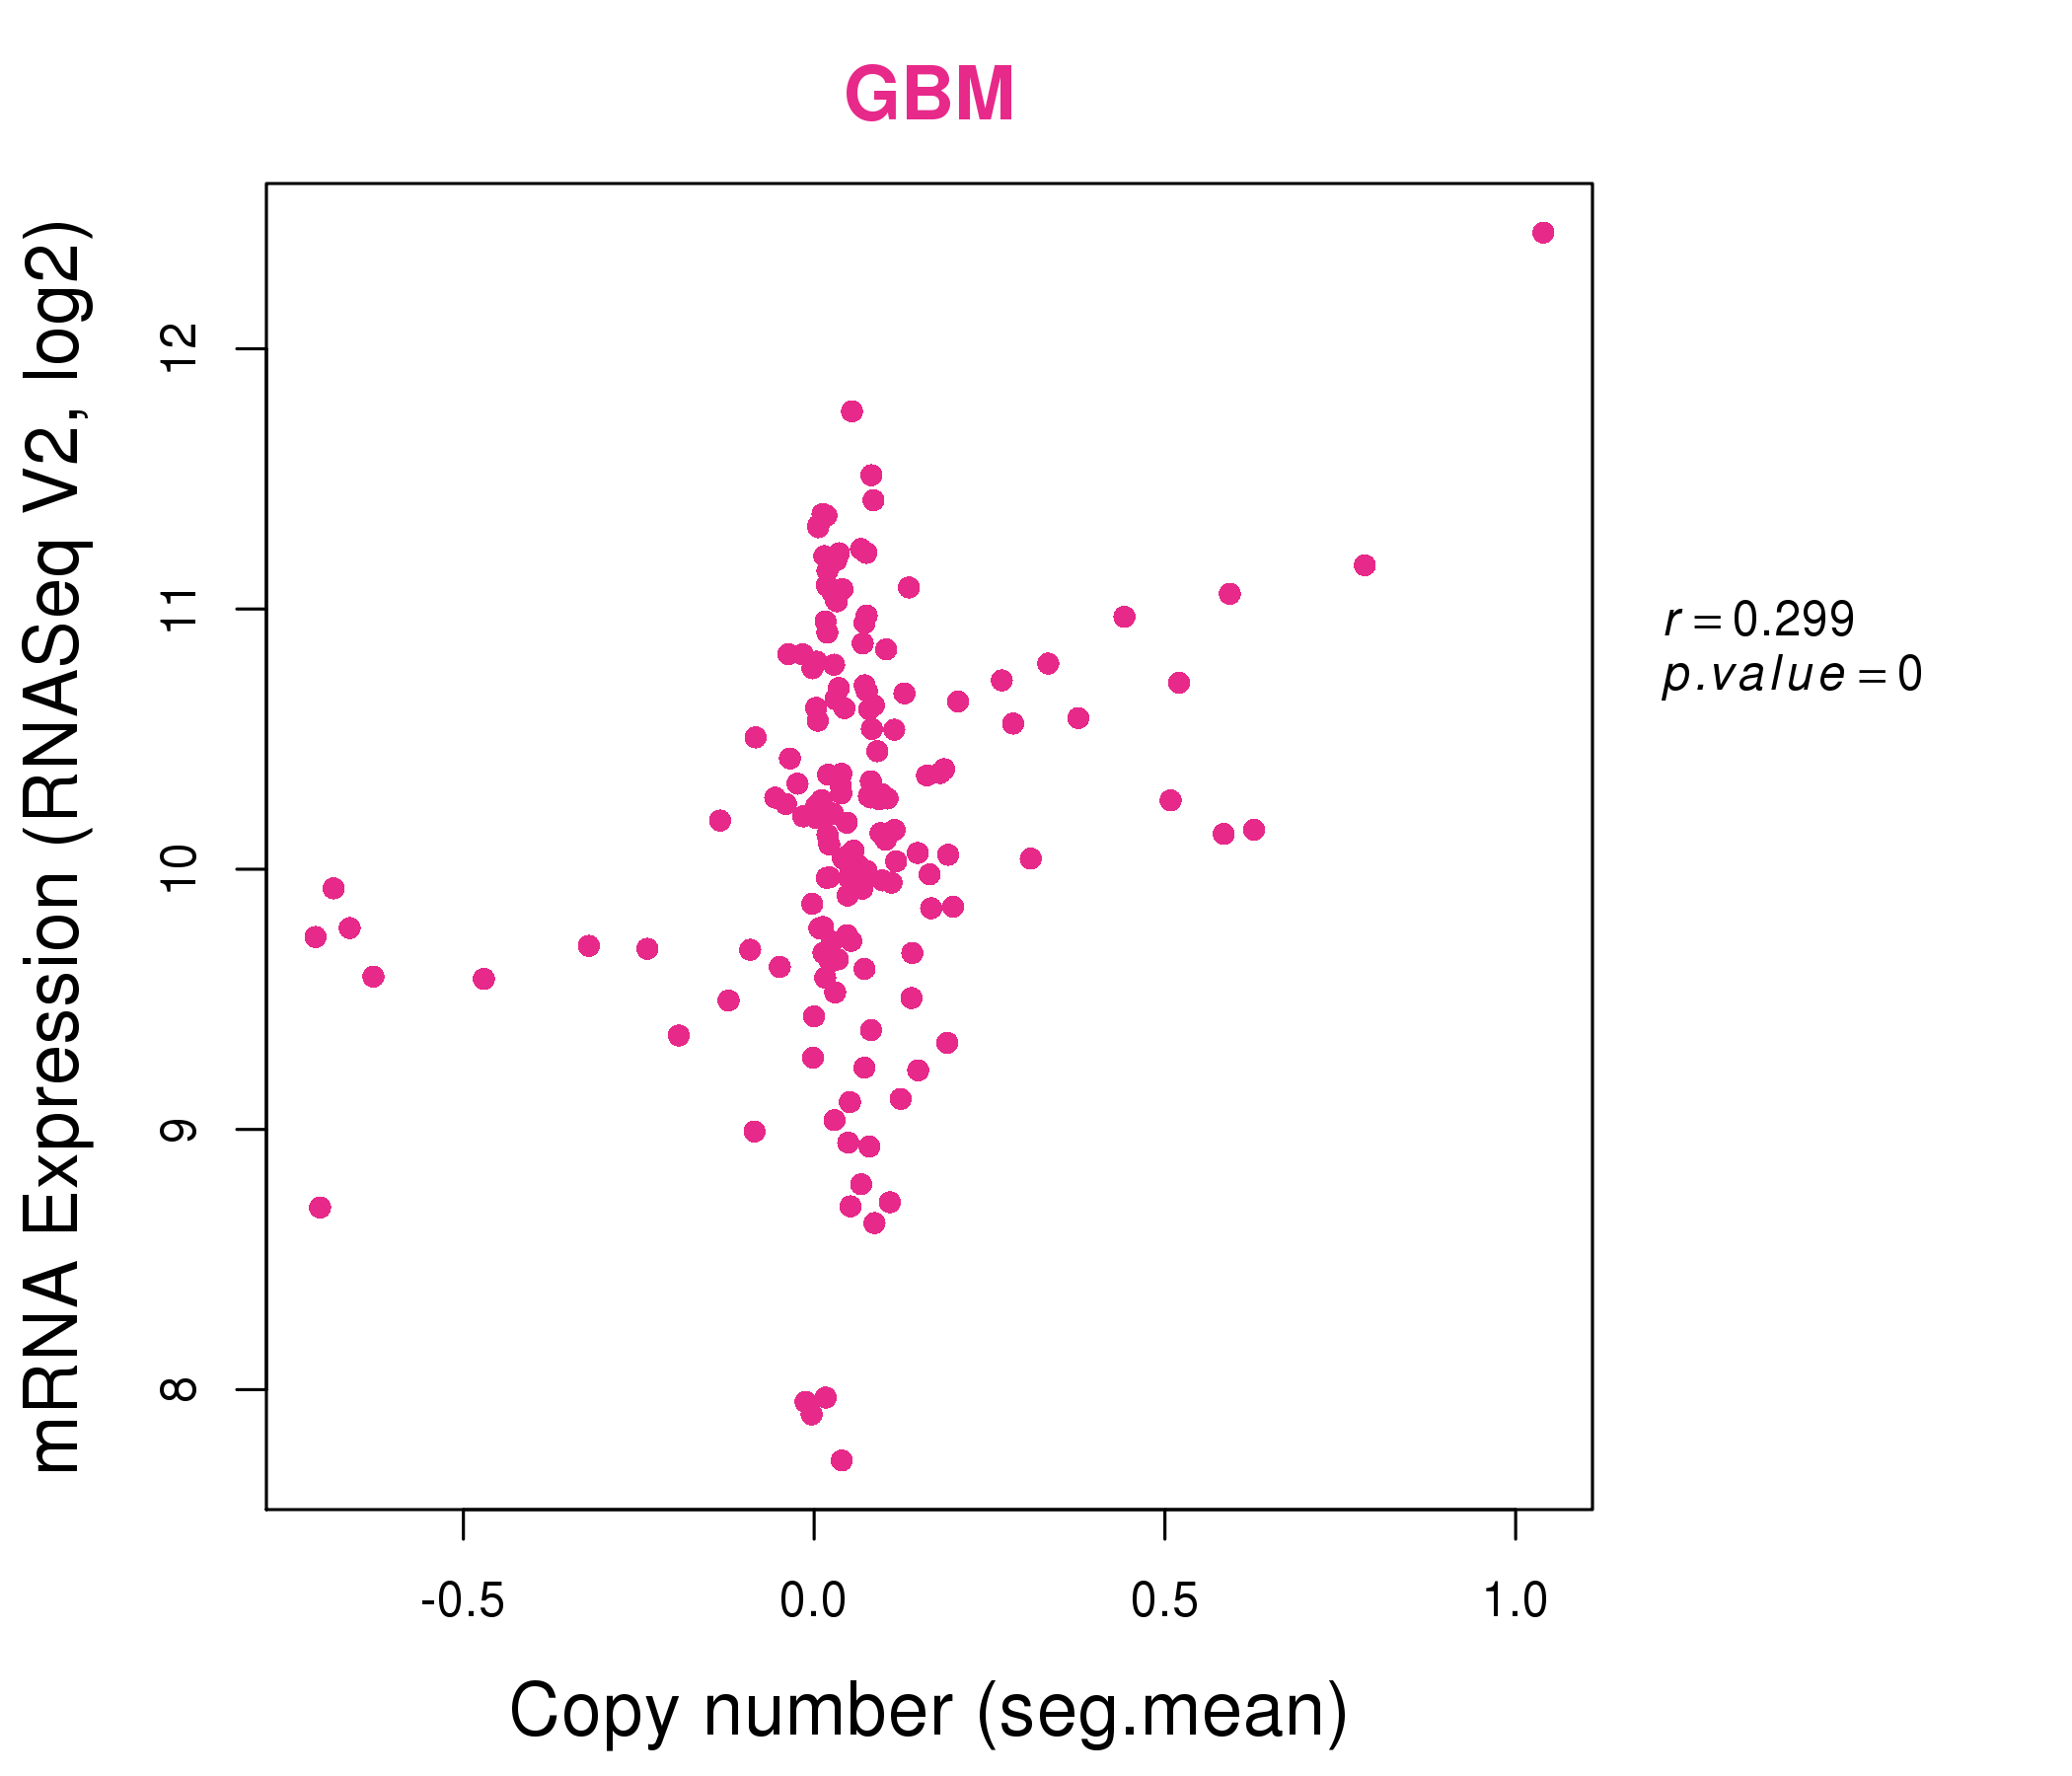
| * This plots show the correlation between CNV and gene expression. |
: Open all plots for all cancer types
 |
|
 |
|

| Top |
| Gene-Gene Network Information |
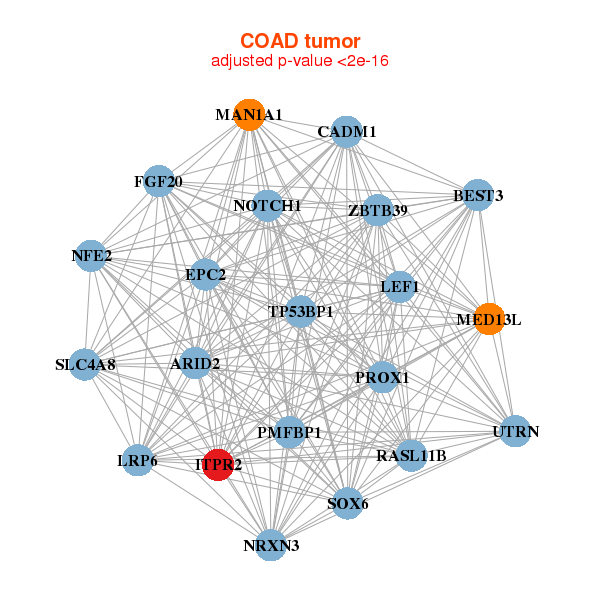
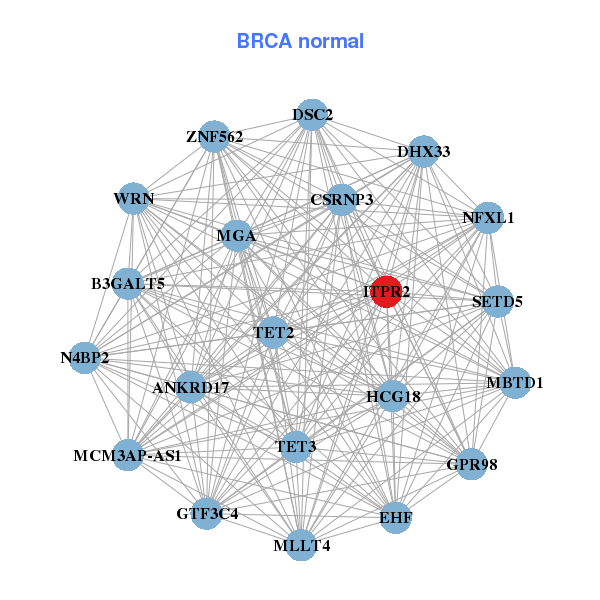
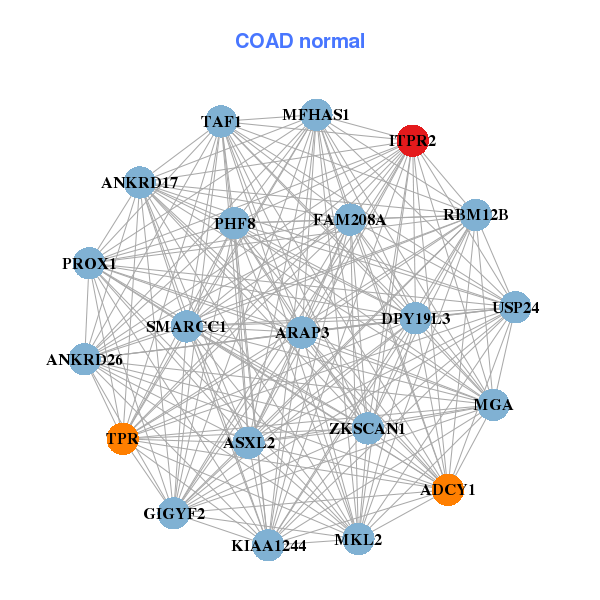
| * Co-Expression network figures were drawn using R package igraph. Only the top 20 genes with the highest correlations were shown. Red circle: input gene, orange circle: cell metabolism gene, sky circle: other gene |
: Open all plots for all cancer types
 |
|
| AFP,FAM169A,FBXL7,GPATCH2,ITPR2,KIAA1109,KIF3A, KLHDC10,KRBA2,MED13L,NAPB,NCOR1,PCDH19,PHF3, RASSF6,RUFY2,SEZ6L,TBC1D12,WBP11,ZFYVE9,ZKSCAN8 | ANKRD17,B3GALT5,CSRNP3,DHX33,DSC2,EHF,GPR98, GTF3C4,HCG18,ITPR2,MBTD1,MCM3AP-AS1,MGA,MLLT4, N4BP2,NFXL1,SETD5,TET2,TET3,WRN,ZNF562 |
 |
|
| ARID2,BEST3,CADM1,EPC2,FGF20,ITPR2,LEF1, LRP6,MAN1A1,MED13L,NFE2,NOTCH1,NRXN3,PMFBP1, PROX1,RASL11B,SLC4A8,SOX6,TP53BP1,UTRN,ZBTB39 | ADCY1,ANKRD17,ANKRD26,ARAP3,ASXL2,FAM208A,DPY19L3, GIGYF2,ITPR2,KIAA1244,MFHAS1,MGA,MKL2,PHF8, PROX1,RBM12B,SMARCC1,TAF1,TPR,USP24,ZKSCAN1 |
| * Co-Expression network figures were drawn using R package igraph. Only the top 20 genes with the highest correlations were shown. Red circle: input gene, orange circle: cell metabolism gene, sky circle: other gene |
: Open all plots for all cancer types
| Top |
: Open all interacting genes' information including KEGG pathway for all interacting genes from DAVID
| Top |
| Pharmacological Information for ITPR2 |
| There's no related Drug. |
| Top |
| Cross referenced IDs for ITPR2 |
| * We obtained these cross-references from Uniprot database. It covers 150 different DBs, 18 categories. http://www.uniprot.org/help/cross_references_section |
: Open all cross reference information
|
Copyright © 2016-Present - The Univsersity of Texas Health Science Center at Houston @ |