|
||||||||||||||||||||
| |
| Phenotypic Information (metabolism pathway, cancer, disease, phenome) |
| |
| |
| Gene-Gene Network Information: Co-Expression Network, Interacting Genes & KEGG |
| |
|


| Gene Summary for ARF3 |
| Basic gene info. | Gene symbol | ARF3 |
| Gene name | ADP-ribosylation factor 3 | |
| Synonyms | - | |
| Cytomap | UCSC genome browser: 12q13 | |
| Genomic location | chr12 :49329991-49351252 | |
| Type of gene | protein-coding | |
| RefGenes | NM_001659.2, | |
| Ensembl id | ENSG00000134287 | |
| Description | small GTP binding protein | |
| Modification date | 20141207 | |
| dbXrefs | MIM : 103190 | |
| HGNC : HGNC | ||
| Ensembl : ENSG00000134287 | ||
| HPRD : 00056 | ||
| Vega : OTTHUMG00000168080 | ||
| Protein | UniProt: go to UniProt's Cross Reference DB Table | |
| Expression | CleanEX: HS_ARF3 | |
| BioGPS: 377 | ||
| Gene Expression Atlas: ENSG00000134287 | ||
| The Human Protein Atlas: ENSG00000134287 | ||
| Pathway | NCI Pathway Interaction Database: ARF3 | |
| KEGG: ARF3 | ||
| REACTOME: ARF3 | ||
| ConsensusPathDB | ||
| Pathway Commons: ARF3 | ||
| Metabolism | MetaCyc: ARF3 | |
| HUMANCyc: ARF3 | ||
| Regulation | Ensembl's Regulation: ENSG00000134287 | |
| miRBase: chr12 :49,329,991-49,351,252 | ||
| TargetScan: NM_001659 | ||
| cisRED: ENSG00000134287 | ||
| Context | iHOP: ARF3 | |
| cancer metabolism search in PubMed: ARF3 | ||
| UCL Cancer Institute: ARF3 | ||
| Assigned class in ccmGDB | C | |
| Top |
| Phenotypic Information for ARF3(metabolism pathway, cancer, disease, phenome) |
| Cancer | CGAP: ARF3 |
| Familial Cancer Database: ARF3 | |
| * This gene is included in those cancer gene databases. |
|
|
|
|
|
|
| ||||||||||||||
Oncogene 1 | Significant driver gene in | |||||||||||||||||||
| cf) number; DB name 1 Oncogene; http://nar.oxfordjournals.org/content/35/suppl_1/D721.long, 2 Tumor Suppressor gene; https://bioinfo.uth.edu/TSGene/, 3 Cancer Gene Census; http://www.nature.com/nrc/journal/v4/n3/abs/nrc1299.html, 4 CancerGenes; http://nar.oxfordjournals.org/content/35/suppl_1/D721.long, 5 Network of Cancer Gene; http://ncg.kcl.ac.uk/index.php, 1Therapeutic Vulnerabilities in Cancer; http://cbio.mskcc.org/cancergenomics/statius/ |
| REACTOME_PHOSPHOLIPID_METABOLISM REACTOME_PI_METABOLISM REACTOME_METABOLISM_OF_LIPIDS_AND_LIPOPROTEINS | |
| OMIM | |
| Orphanet | |
| Disease | KEGG Disease: ARF3 |
| MedGen: ARF3 (Human Medical Genetics with Condition) | |
| ClinVar: ARF3 | |
| Phenotype | MGI: ARF3 (International Mouse Phenotyping Consortium) |
| PhenomicDB: ARF3 | |
| Mutations for ARF3 |
| * Under tables are showing count per each tissue to give us broad intuition about tissue specific mutation patterns.You can go to the detailed page for each mutation database's web site. |
| There's no structural variation information in COSMIC data for this gene. |
| * From mRNA Sanger sequences, Chitars2.0 arranged chimeric transcripts. This table shows ARF3 related fusion information. |
| ID | Head Gene | Tail Gene | Accession | Gene_a | qStart_a | qEnd_a | Chromosome_a | tStart_a | tEnd_a | Gene_a | qStart_a | qEnd_a | Chromosome_a | tStart_a | tEnd_a |
| H14073 | GBF1 | 1 | 84 | 10 | 104142570 | 104142653 | ARF3 | 76 | 407 | 12 | 49332083 | 49332407 | |
| BF509886 | RAD23A | 17 | 192 | 19 | 13064281 | 13064456 | ARF3 | 188 | 434 | 12 | 49331931 | 49332177 | |
| BQ668805 | ARF3 | 1 | 59 | 12 | 49330793 | 49330851 | NDUFA6 | 60 | 458 | 22 | 42482118 | 42486691 | |
| R23430 | ARF3 | 4 | 183 | 12 | 49332574 | 49332754 | OGFOD2 | 175 | 225 | 12 | 123463043 | 123463093 | |
| BG001600 | ARF3 | 1 | 268 | 12 | 49332704 | 49333517 | SLC38A7 | 258 | 337 | 16 | 58700633 | 58700712 | |
| AA527815 | ARF3 | 1 | 289 | 12 | 49331604 | 49331892 | ARF3 | 284 | 346 | 12 | 49331514 | 49331576 | |
| AI742354 | ARF3 | 1 | 71 | 12 | 49331319 | 49331389 | ARF3 | 58 | 342 | 12 | 49331518 | 49331802 | |
| R85158 | GBF1 | 1 | 84 | 10 | 104142570 | 104142653 | ARF3 | 76 | 276 | 12 | 49332083 | 49332284 | |
| AA525008 | ARF3 | 1 | 289 | 12 | 49331604 | 49331892 | ARF3 | 284 | 368 | 12 | 49331514 | 49331598 | |
| BC020999 | CCNB1IP1 | 1386 | 2828 | 14 | 20779529 | 20797531 | ARF3 | 2829 | 3851 | 12 | 49332489 | 49351235 | |
| H38464 | GBF1 | 1 | 84 | 10 | 104142570 | 104142653 | ARF3 | 76 | 350 | 12 | 49332083 | 49332356 | |
| BQ331543 | ARF3 | 22 | 240 | 12 | 49333782 | 49334840 | ITPR2 | 234 | 508 | 12 | 26959676 | 26959951 | |
| Top |
| There's no copy number variation information in COSMIC data for this gene. |
| Top |
|
 |
| Top |
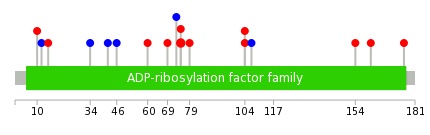
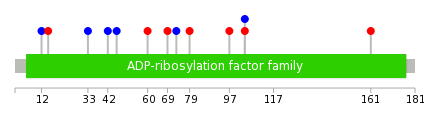
| Stat. for Non-Synonymous SNVs (# total SNVs=12) | (# total SNVs=4) |
 |  |
(# total SNVs=0) | (# total SNVs=0) |
| Top |
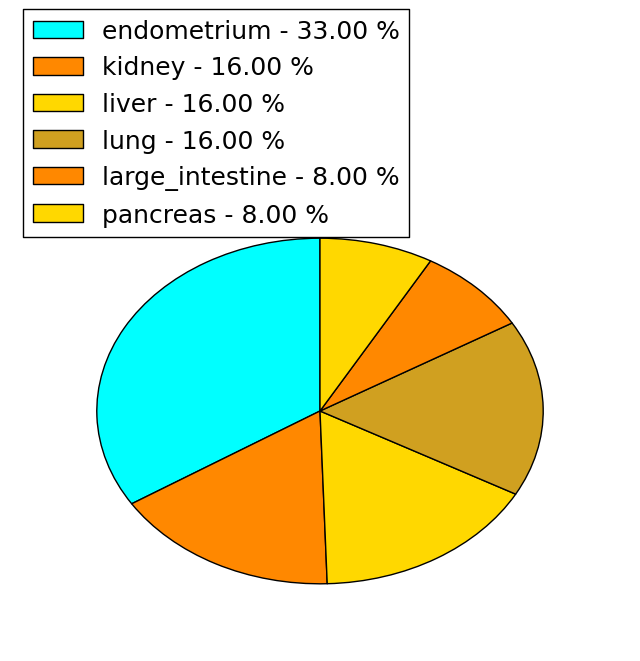
| * When you move the cursor on each content, you can see more deailed mutation information on the Tooltip. Those are primary_site,primary_histology,mutation(aa),pubmedID. |
| GRCh37 position | Mutation(aa) | Unique sampleID count |
| chr12:49333815-49333815 | p.R75Q | 3 |
| chr12:49334854-49334857 | p.L8fs*4 | 1 |
| chr12:49333820-49333820 | p.K73K | 1 |
| chr12:49333834-49333834 | p.G69R | 1 |
| chr12:49333860-49333860 | p.N60S | 1 |
| chr12:49332749-49332749 | p.Q176R | 1 |
| chr12:49334730-49334730 | p.? | 1 |
| chr12:49332794-49332794 | p.T161I | 1 |
| chr12:49334741-49334741 | p.I46I | 1 |
| chr12:49332815-49332815 | p.Y154F | 1 |
| Top |
|
 |
| Point Mutation/ Tissue ID | 1 | 2 | 3 | 4 | 5 | 6 | 7 | 8 | 9 | 10 | 11 | 12 | 13 | 14 | 15 | 16 | 17 | 18 | 19 | 20 |
| # sample | 1 | 1 | 1 | 1 | 1 | 1 | 5 | |||||||||||||
| # mutation | 1 | 1 | 1 | 2 | 1 | 1 | 6 | |||||||||||||
| nonsynonymous SNV | 1 | 1 | 1 | 4 | ||||||||||||||||
| synonymous SNV | 1 | 1 | 1 | 1 | 2 |
| cf) Tissue ID; Tissue type (1; BLCA[Bladder Urothelial Carcinoma], 2; BRCA[Breast invasive carcinoma], 3; CESC[Cervical squamous cell carcinoma and endocervical adenocarcinoma], 4; COAD[Colon adenocarcinoma], 5; GBM[Glioblastoma multiforme], 6; Glioma Low Grade, 7; HNSC[Head and Neck squamous cell carcinoma], 8; KICH[Kidney Chromophobe], 9; KIRC[Kidney renal clear cell carcinoma], 10; KIRP[Kidney renal papillary cell carcinoma], 11; LAML[Acute Myeloid Leukemia], 12; LUAD[Lung adenocarcinoma], 13; LUSC[Lung squamous cell carcinoma], 14; OV[Ovarian serous cystadenocarcinoma ], 15; PAAD[Pancreatic adenocarcinoma], 16; PRAD[Prostate adenocarcinoma], 17; SKCM[Skin Cutaneous Melanoma], 18:STAD[Stomach adenocarcinoma], 19:THCA[Thyroid carcinoma], 20:UCEC[Uterine Corpus Endometrial Carcinoma]) |
| Top |
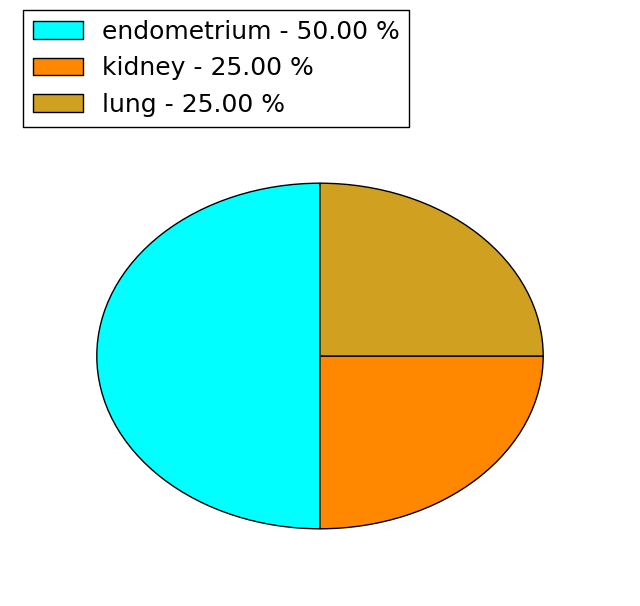
| * We represented just top 10 SNVs. When you move the cursor on each content, you can see more deailed mutation information on the Tooltip. Those are primary_site, primary_histology, mutation(aa), pubmedID. |
| Genomic Position | Mutation(aa) | Unique sampleID count |
| chr12:49333860 | p.I46I | 1 |
| chr12:49334741 | p.I42I | 1 |
| chr12:49334753 | p.I33I | 1 |
| chr12:49334780 | p.K15M | 1 |
| chr12:49332794 | p.L12L | 1 |
| chr12:49334835 | p.T161I | 1 |
| chr12:49333511 | p.R104Q | 1 |
| chr12:49334843 | p.R104R | 1 |
| chr12:49333512 | p.R97L | 1 |
| chr12:49333532 | p.R79G | 1 |
| * Copy number data were extracted from TCGA using R package TCGA-Assembler. The URLs of all public data files on TCGA DCC data server were gathered on Jan-05-2015. Function ProcessCNAData in TCGA-Assembler package was used to obtain gene-level copy number value which is calculated as the average copy number of the genomic region of a gene. |
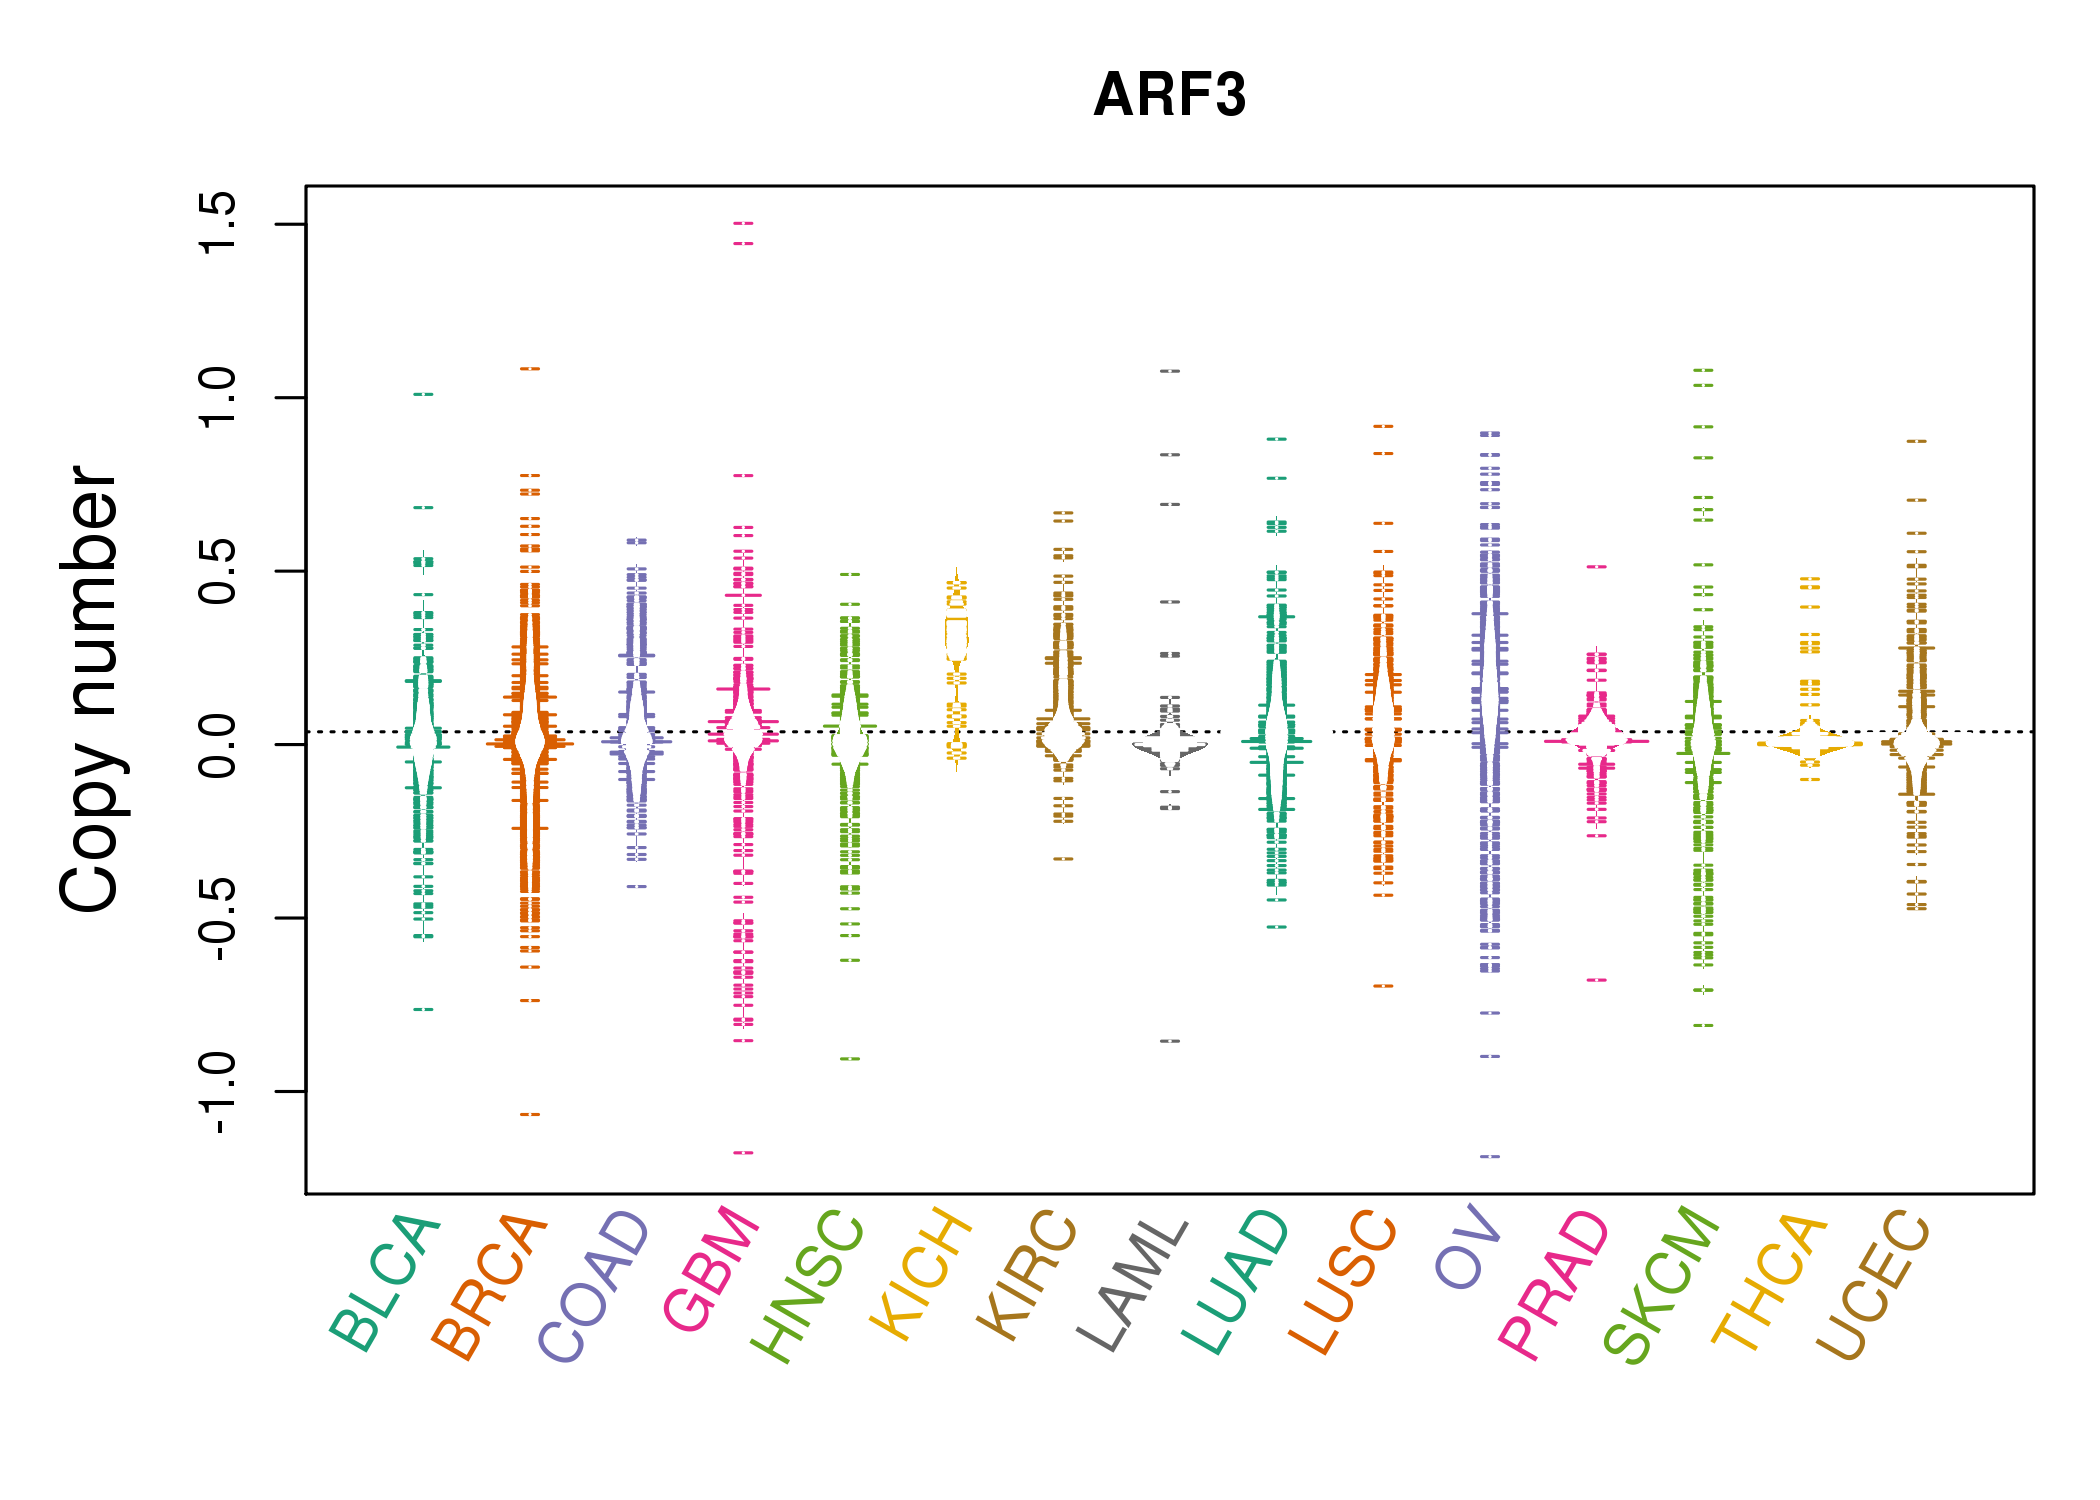 |
| cf) Tissue ID[Tissue type]: BLCA[Bladder Urothelial Carcinoma], BRCA[Breast invasive carcinoma], CESC[Cervical squamous cell carcinoma and endocervical adenocarcinoma], COAD[Colon adenocarcinoma], GBM[Glioblastoma multiforme], Glioma Low Grade, HNSC[Head and Neck squamous cell carcinoma], KICH[Kidney Chromophobe], KIRC[Kidney renal clear cell carcinoma], KIRP[Kidney renal papillary cell carcinoma], LAML[Acute Myeloid Leukemia], LUAD[Lung adenocarcinoma], LUSC[Lung squamous cell carcinoma], OV[Ovarian serous cystadenocarcinoma ], PAAD[Pancreatic adenocarcinoma], PRAD[Prostate adenocarcinoma], SKCM[Skin Cutaneous Melanoma], STAD[Stomach adenocarcinoma], THCA[Thyroid carcinoma], UCEC[Uterine Corpus Endometrial Carcinoma] |
| Top |
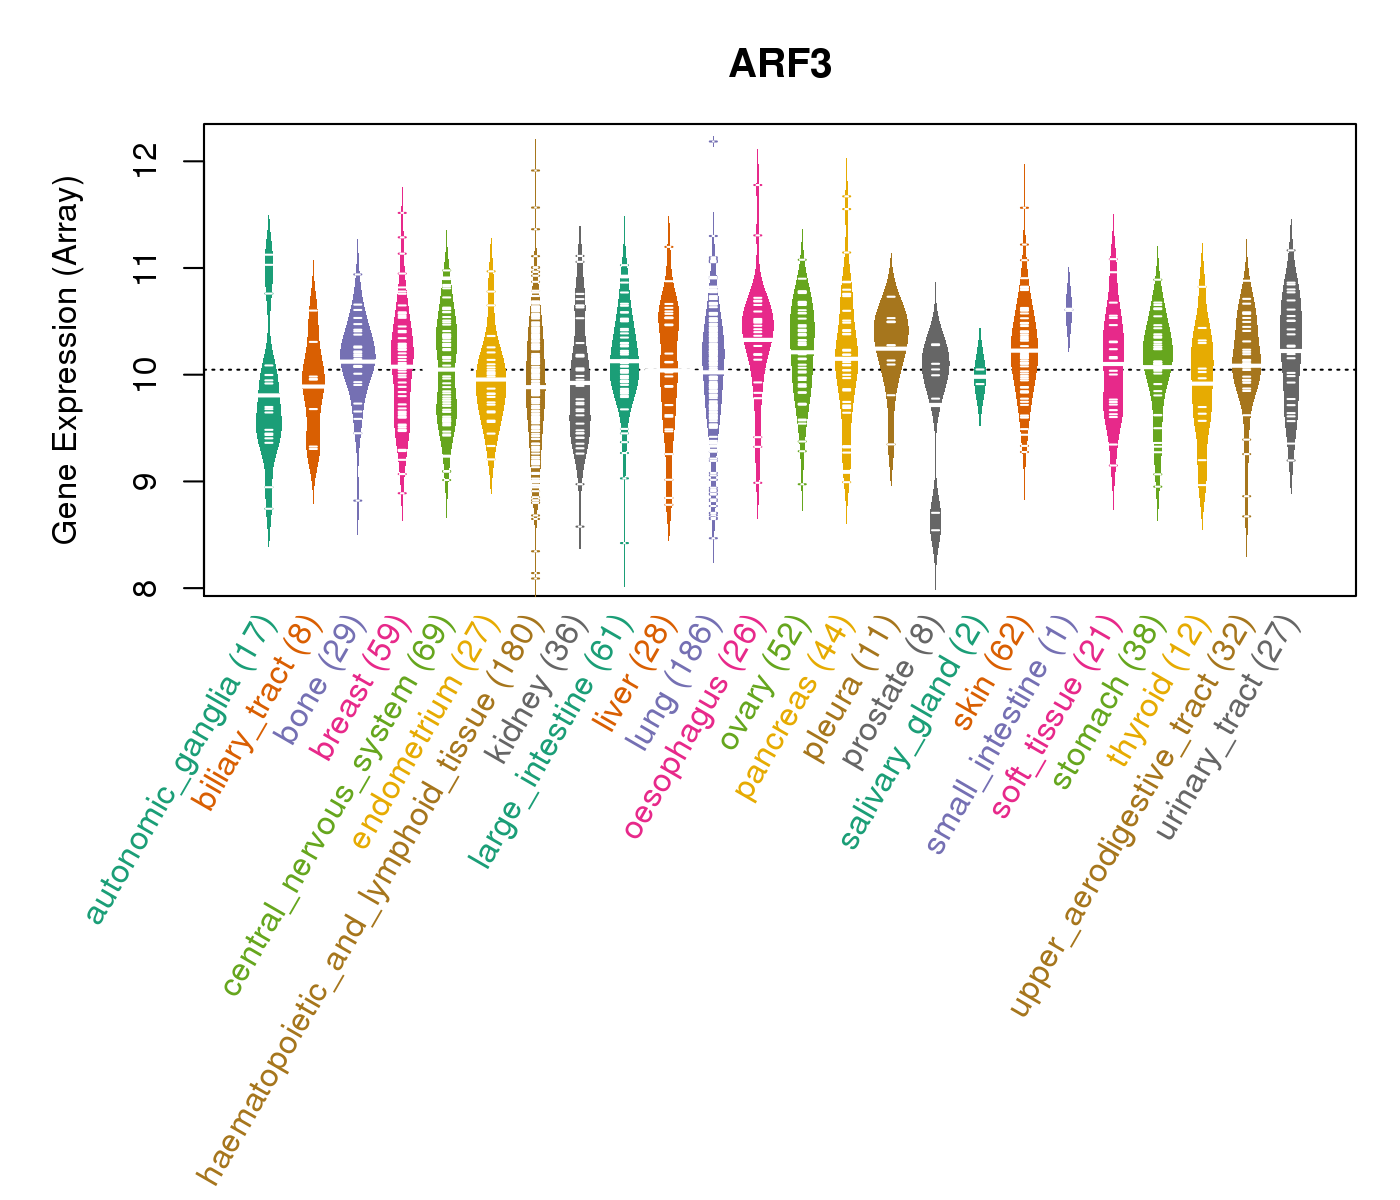
| Gene Expression for ARF3 |
| * CCLE gene expression data were extracted from CCLE_Expression_Entrez_2012-10-18.res: Gene-centric RMA-normalized mRNA expression data. |
 |
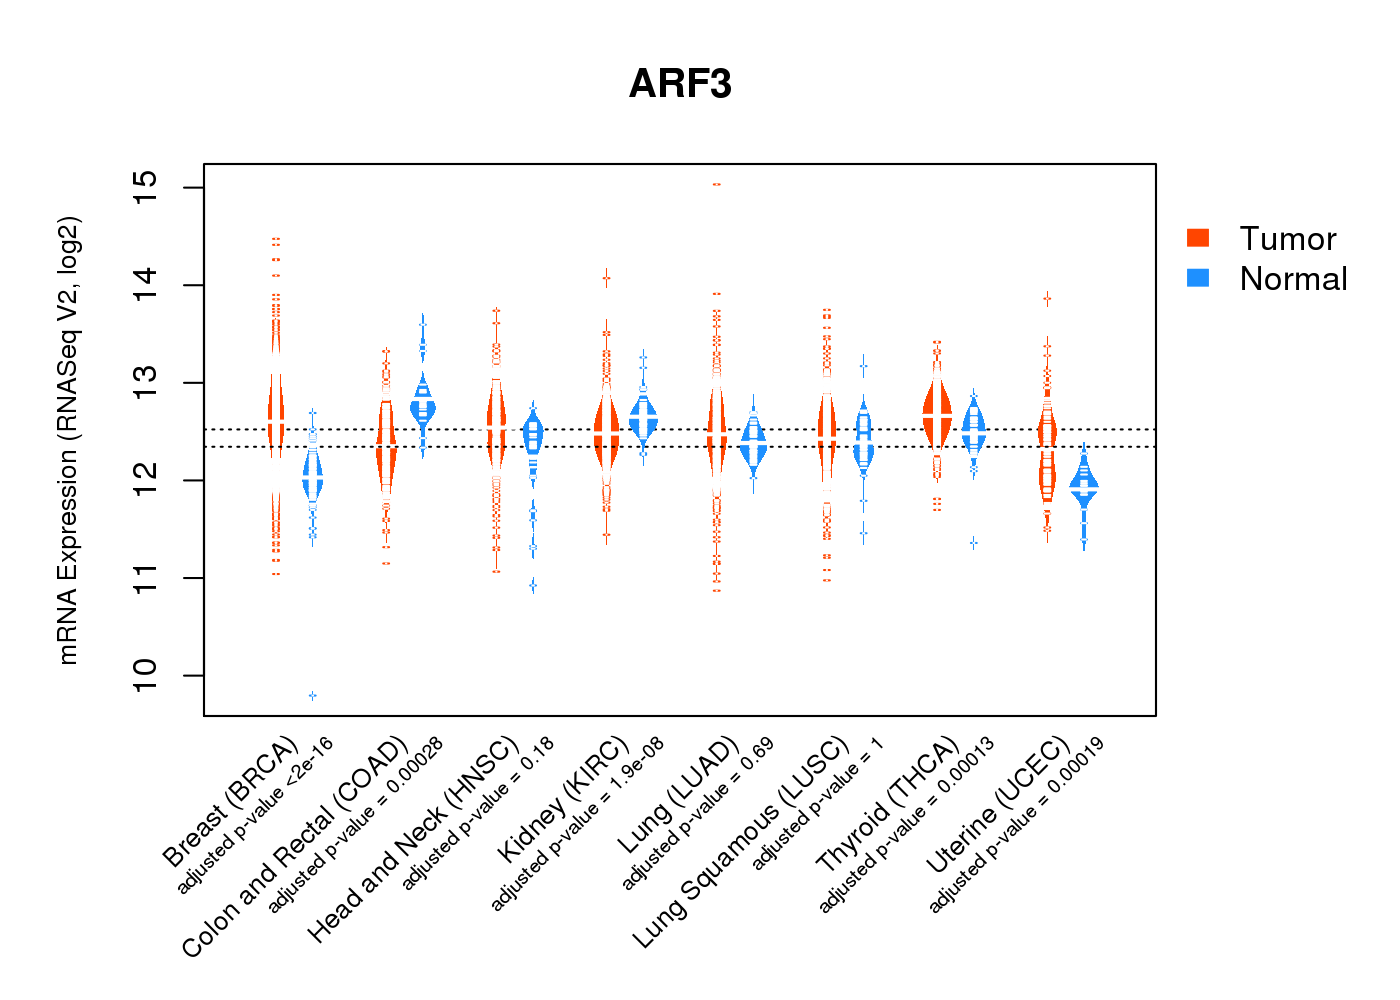
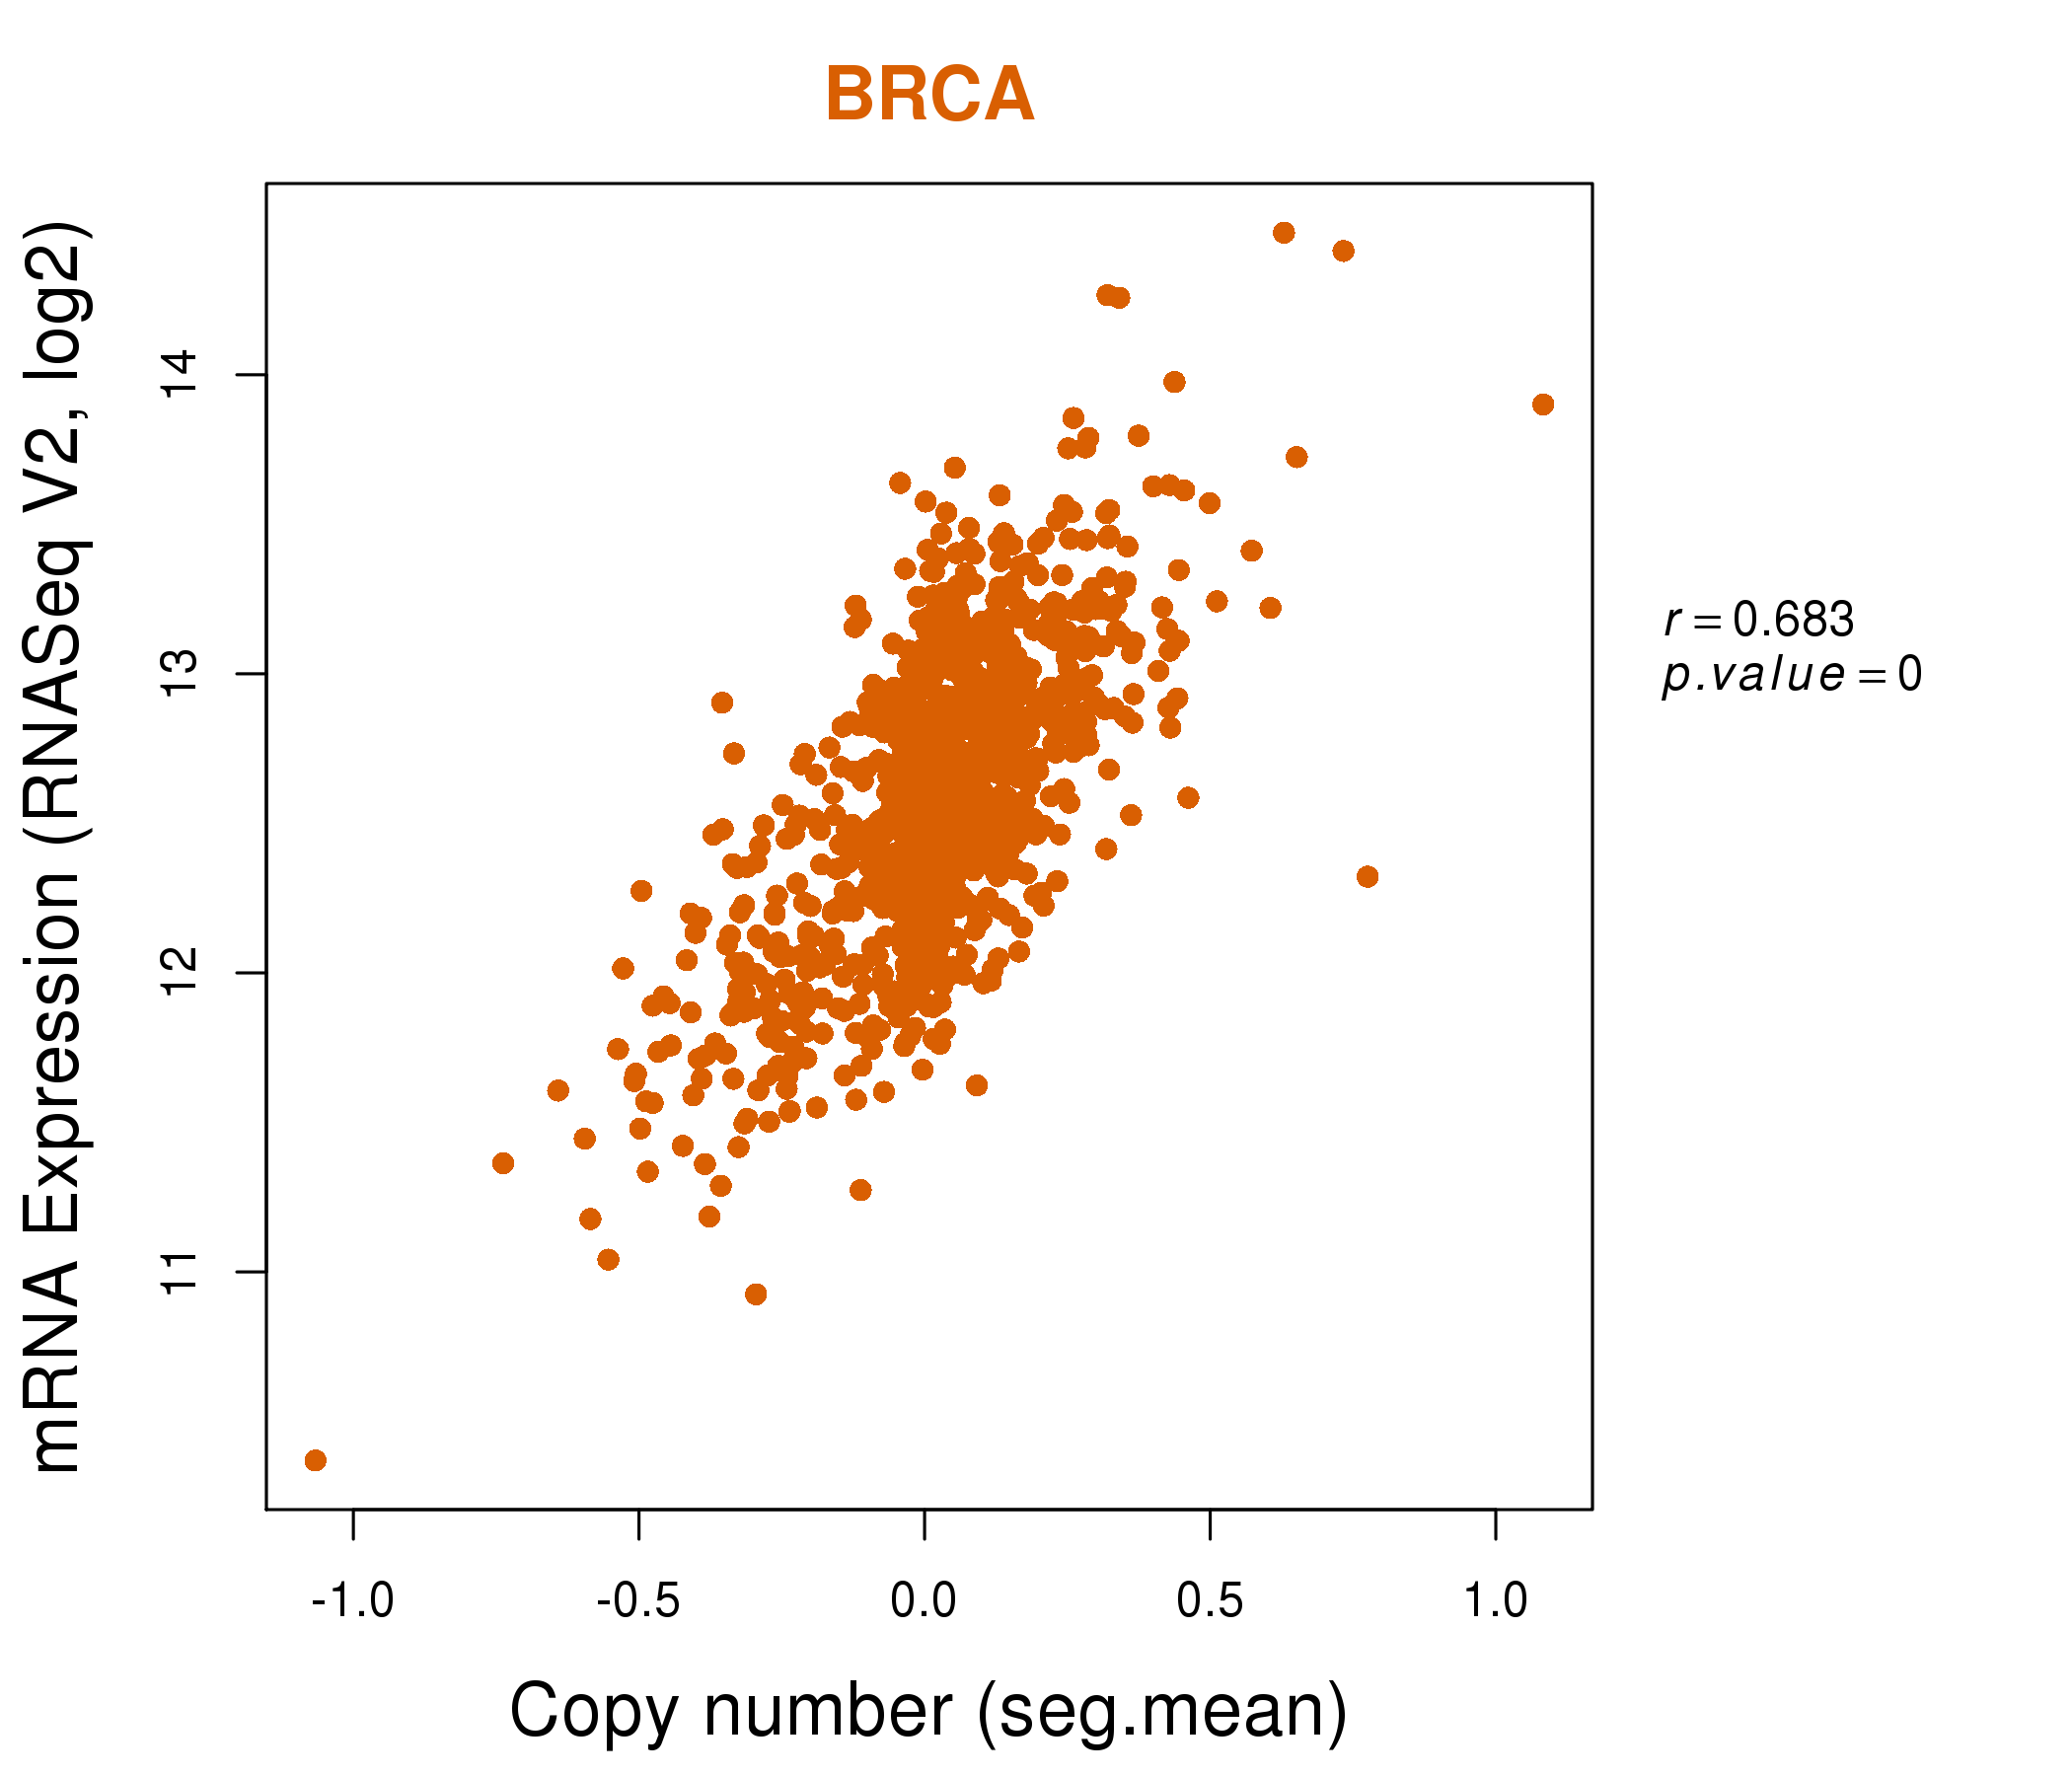
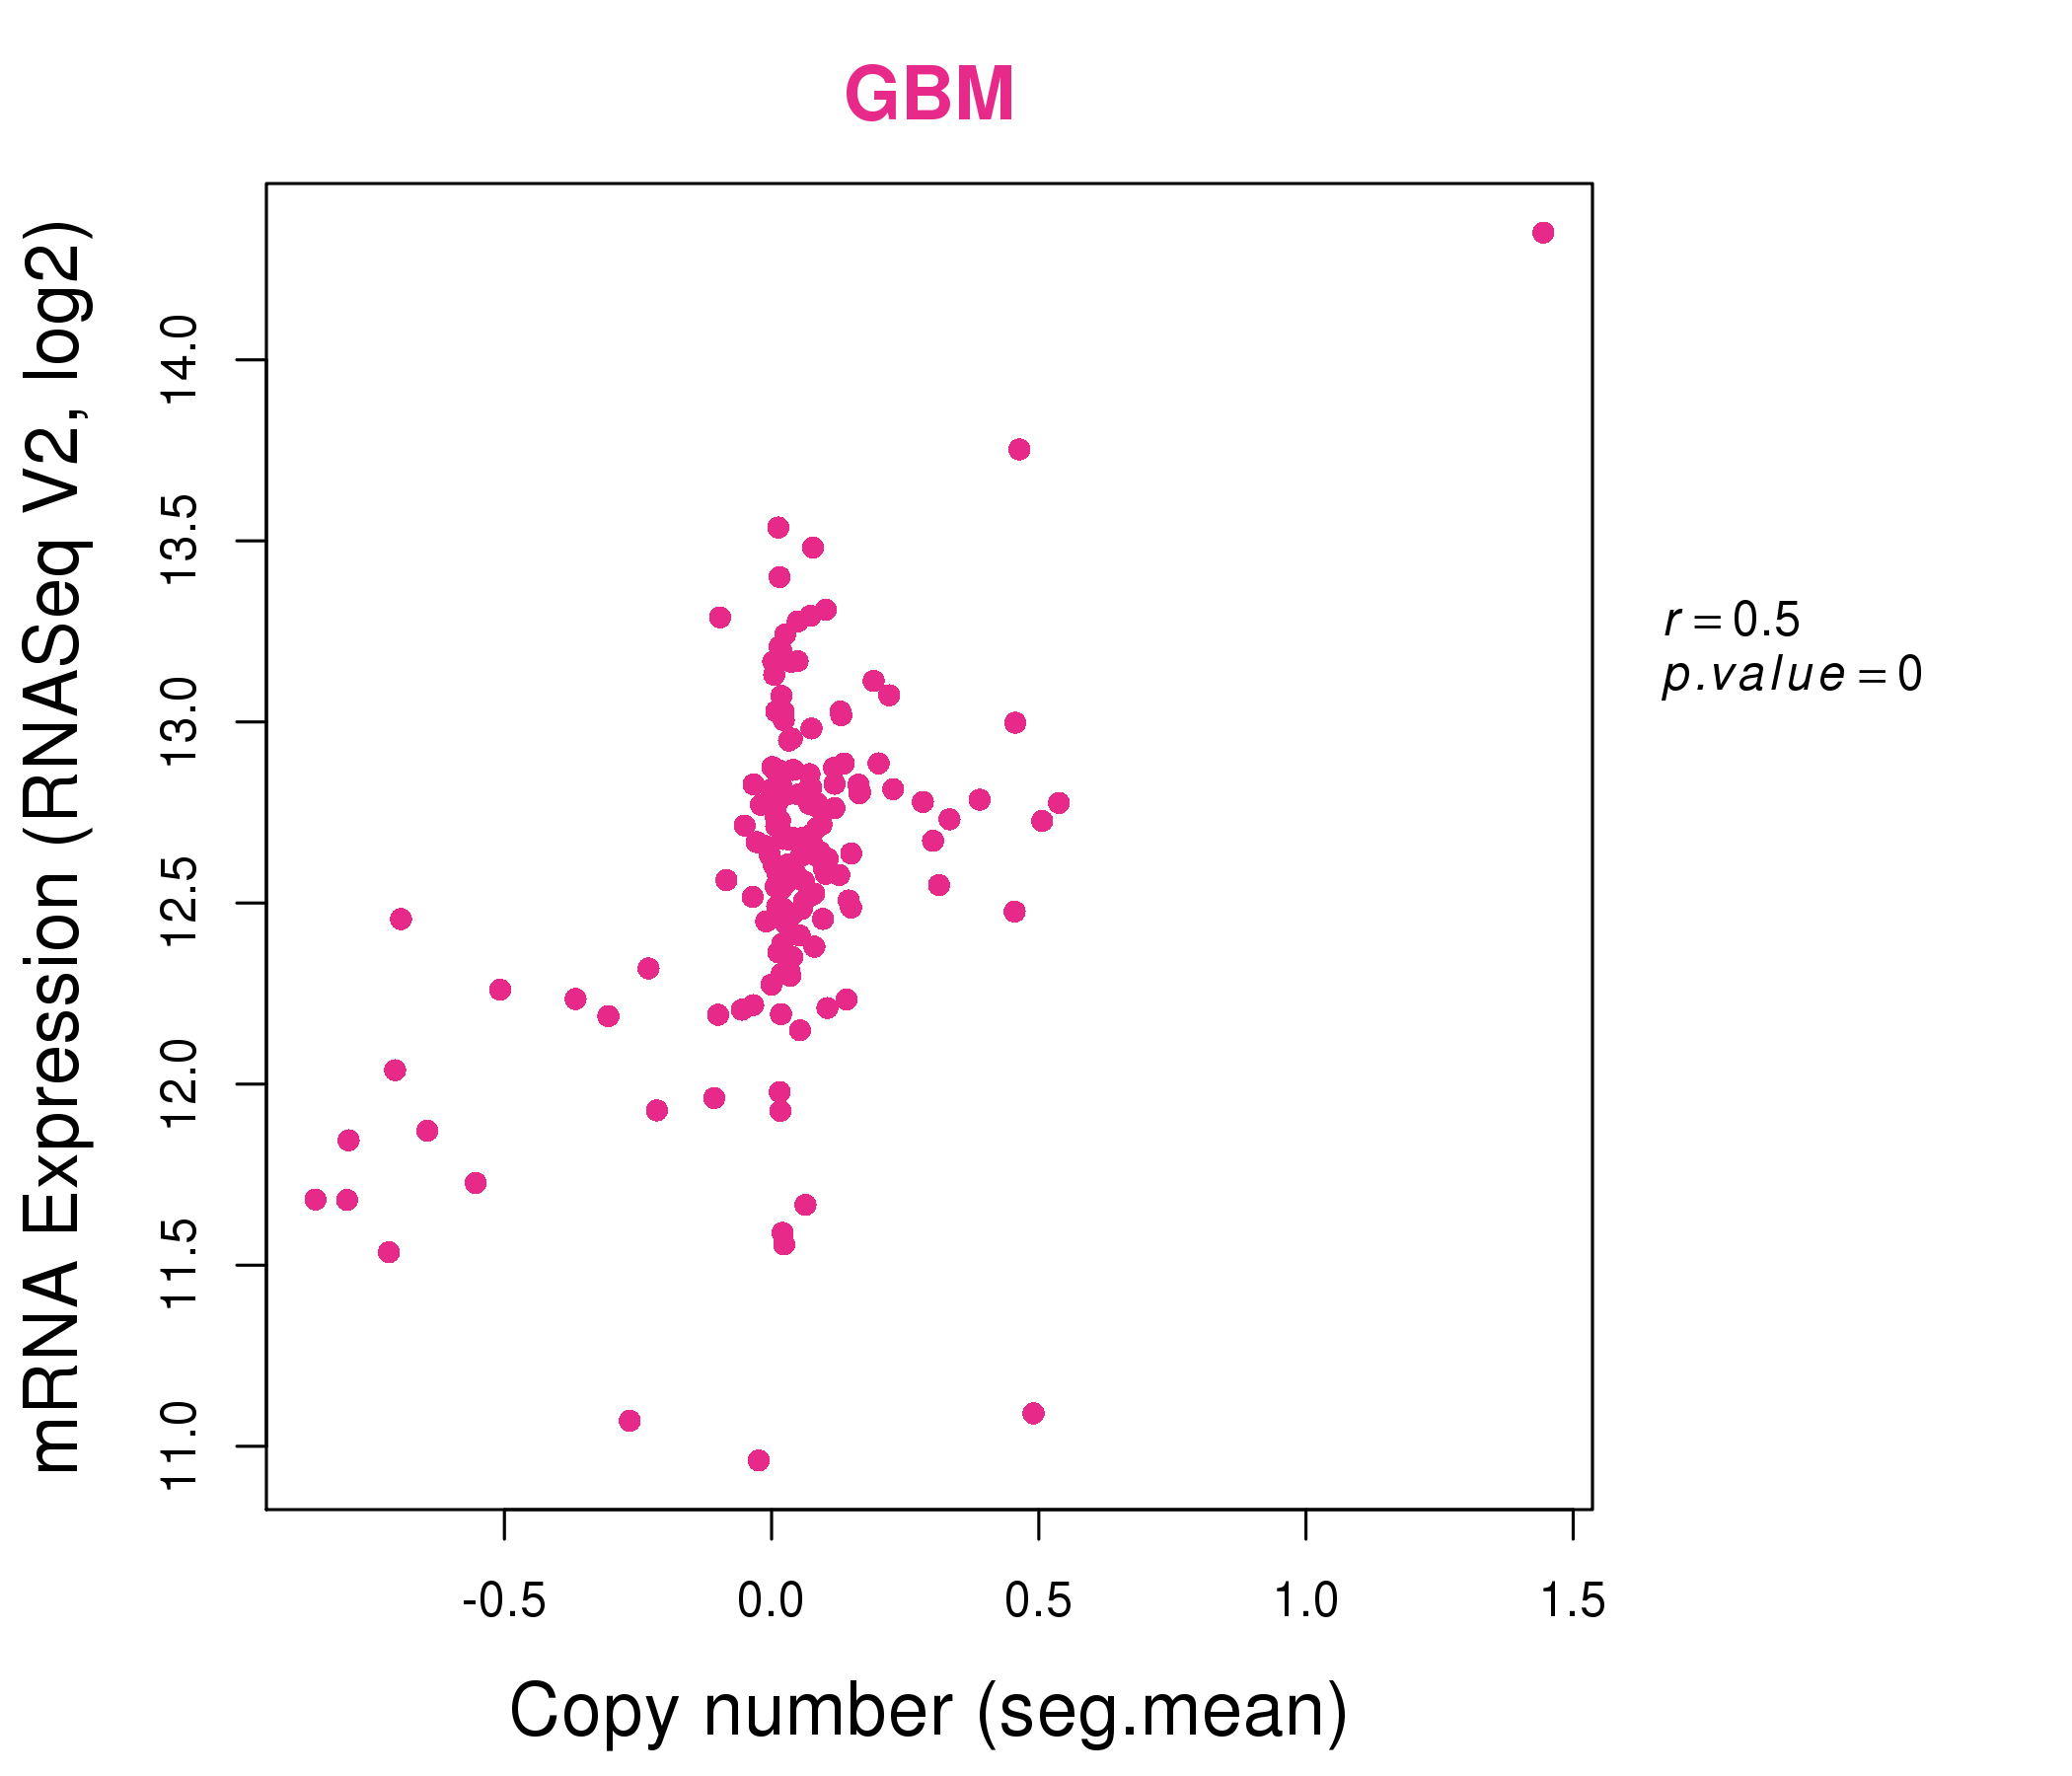
| * Normalized gene expression data of RNASeqV2 was extracted from TCGA using R package TCGA-Assembler. The URLs of all public data files on TCGA DCC data server were gathered at Jan-05-2015. Only eight cancer types have enough normal control samples for differential expression analysis. (t test, adjusted p<0.05 (using Benjamini-Hochberg FDR)) |
 |
| Top |
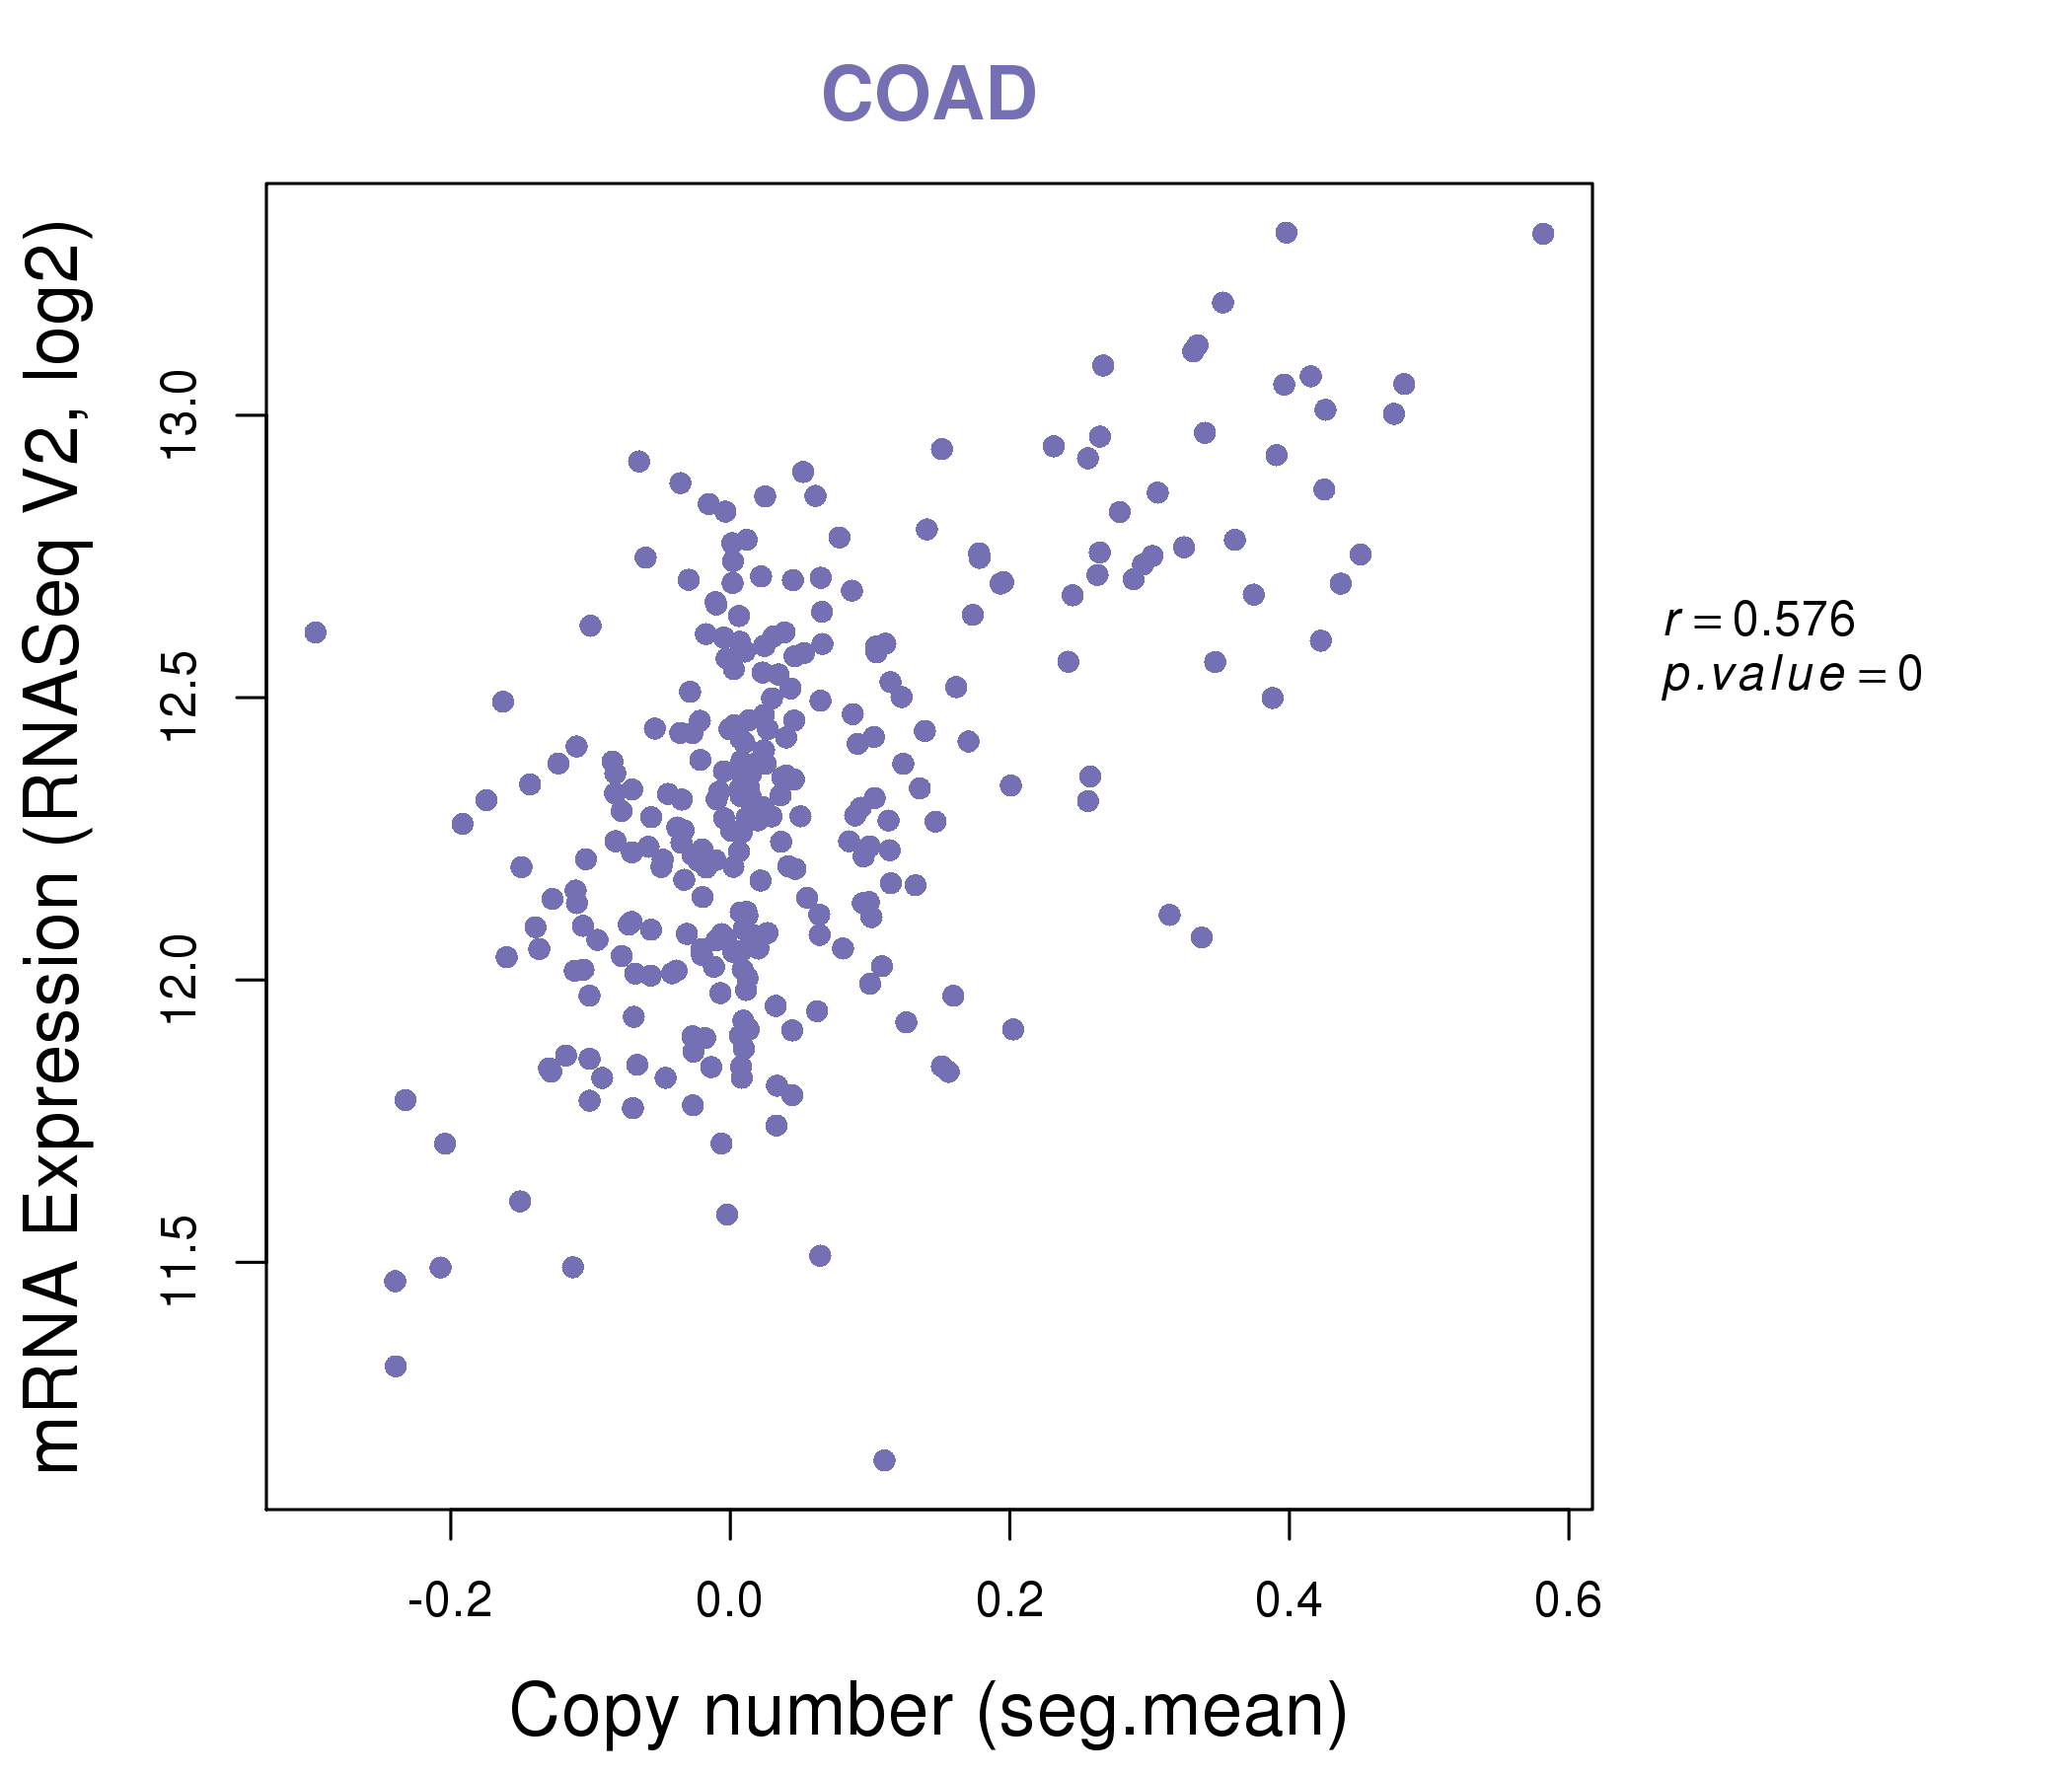
| * This plots show the correlation between CNV and gene expression. |
: Open all plots for all cancer types
 |
|
 |
|
| Top |
| Gene-Gene Network Information |
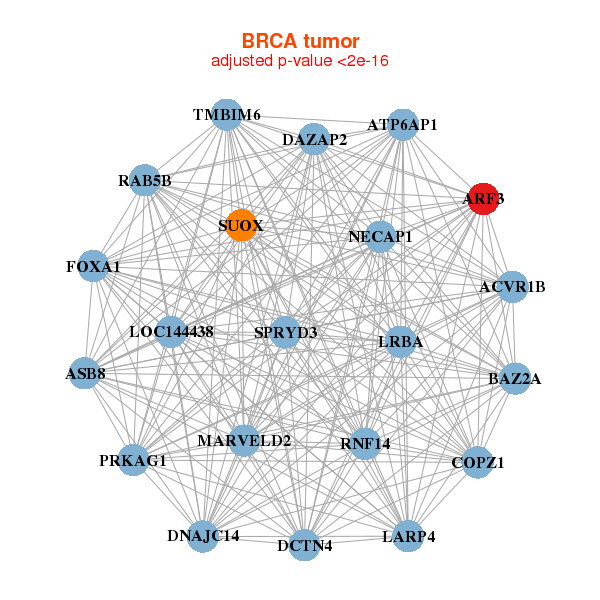
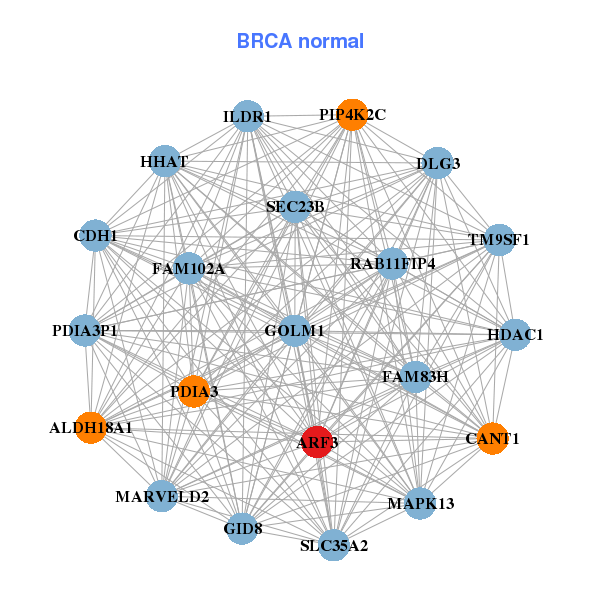
| * Co-Expression network figures were drawn using R package igraph. Only the top 20 genes with the highest correlations were shown. Red circle: input gene, orange circle: cell metabolism gene, sky circle: other gene |
: Open all plots for all cancer types
 |
|
| ACVR1B,ARF3,ASB8,ATP6AP1,BAZ2A,COPZ1,DAZAP2, DCTN4,DNAJC14,FOXA1,LARP4,LOC144438,LRBA,MARVELD2, NECAP1,PRKAG1,RAB5B,RNF14,SPRYD3,SUOX,TMBIM6 | ALDH18A1,ARF3,GID8,CANT1,CDH1,DLG3,FAM102A, FAM83H,GOLM1,HDAC1,HHAT,ILDR1,MAPK13,MARVELD2, PDIA3,PDIA3P1,PIP4K2C,RAB11FIP4,SEC23B,SLC35A2,TM9SF1 |
 |
|
| ARF3,ASB8,ATP5B,ATG101,COPZ1,CS,DAZAP2, DDX23,DNAJC14,LARP4,LLPH,MFSD5,PIP4K2C,PRR13, RAB35,RAB5B,SENP1,SCAF11,SPRYD3,SUDS3,TMBIM6 | ACOX1,ALAS1,AMBRA1,ARF3,BSG,CAPN2,CDH1, CEACAM5,CEACAM7,RHOV___CHP1,ABHD17C,FUT3,GBA,GBAP1, MGLL,OPN3,PAPSS2,PPARG,SFXN1,SH3KBP1,ZNF217 |
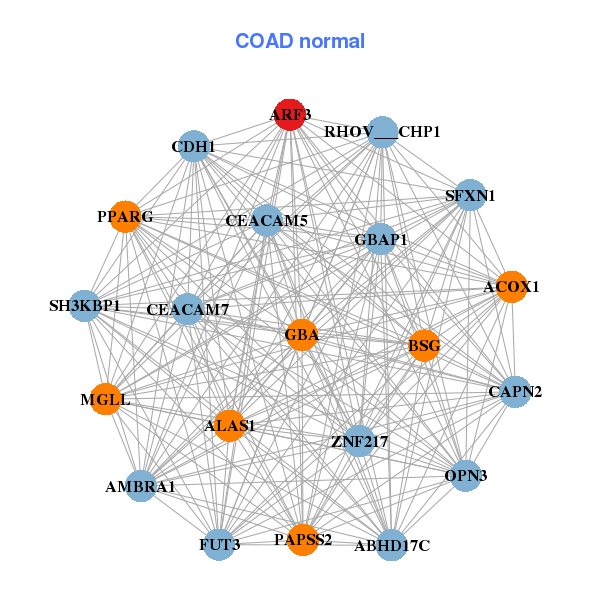
| * Co-Expression network figures were drawn using R package igraph. Only the top 20 genes with the highest correlations were shown. Red circle: input gene, orange circle: cell metabolism gene, sky circle: other gene |
: Open all plots for all cancer types
| Top |
: Open all interacting genes' information including KEGG pathway for all interacting genes from DAVID
| Top |
| Pharmacological Information for ARF3 |
| There's no related Drug. |
| Top |
| Cross referenced IDs for ARF3 |
| * We obtained these cross-references from Uniprot database. It covers 150 different DBs, 18 categories. http://www.uniprot.org/help/cross_references_section |
: Open all cross reference information
|
Copyright © 2016-Present - The Univsersity of Texas Health Science Center at Houston @ |