|
||||||||||||||||||||
| |
| Phenotypic Information (metabolism pathway, cancer, disease, phenome) |
| |
| |
| Gene-Gene Network Information: Co-Expression Network, Interacting Genes & KEGG |
| |
|


| Gene Summary for KCNS3 |
| Basic gene info. | Gene symbol | KCNS3 |
| Gene name | potassium voltage-gated channel, delayed-rectifier, subfamily S, member 3 | |
| Synonyms | KV9.3 | |
| Cytomap | UCSC genome browser: 2p24 | |
| Genomic location | chr2 :18059944-18114225 | |
| Type of gene | protein-coding | |
| RefGenes | NM_001282428.1, NM_002252.4, | |
| Ensembl id | ENSG00000170745 | |
| Description | Shab-related delayed-rectifier K+ channel alpha subunit 3delayed-rectifier K(+) channel alpha subunit 3potassium voltage-gated channel delayed-rectifier protein S3potassium voltage-gated channel subfamily S member 3voltage-gated potassium channel prot | |
| Modification date | 20141207 | |
| dbXrefs | MIM : 603888 | |
| HGNC : HGNC | ||
| Ensembl : ENSG00000170745 | ||
| HPRD : 04865 | ||
| Vega : OTTHUMG00000044150 | ||
| Protein | UniProt: go to UniProt's Cross Reference DB Table | |
| Expression | CleanEX: HS_KCNS3 | |
| BioGPS: 3790 | ||
| Gene Expression Atlas: ENSG00000170745 | ||
| The Human Protein Atlas: ENSG00000170745 | ||
| Pathway | NCI Pathway Interaction Database: KCNS3 | |
| KEGG: KCNS3 | ||
| REACTOME: KCNS3 | ||
| ConsensusPathDB | ||
| Pathway Commons: KCNS3 | ||
| Metabolism | MetaCyc: KCNS3 | |
| HUMANCyc: KCNS3 | ||
| Regulation | Ensembl's Regulation: ENSG00000170745 | |
| miRBase: chr2 :18,059,944-18,114,225 | ||
| TargetScan: NM_001282428 | ||
| cisRED: ENSG00000170745 | ||
| Context | iHOP: KCNS3 | |
| cancer metabolism search in PubMed: KCNS3 | ||
| UCL Cancer Institute: KCNS3 | ||
| Assigned class in ccmGDB | C | |
| Top |
| Phenotypic Information for KCNS3(metabolism pathway, cancer, disease, phenome) |
| Cancer | CGAP: KCNS3 |
| Familial Cancer Database: KCNS3 | |
| * This gene is included in those cancer gene databases. |
|
|
|
|
|
| . | ||||||||||||||
Oncogene 1 | Significant driver gene in | |||||||||||||||||||
| cf) number; DB name 1 Oncogene; http://nar.oxfordjournals.org/content/35/suppl_1/D721.long, 2 Tumor Suppressor gene; https://bioinfo.uth.edu/TSGene/, 3 Cancer Gene Census; http://www.nature.com/nrc/journal/v4/n3/abs/nrc1299.html, 4 CancerGenes; http://nar.oxfordjournals.org/content/35/suppl_1/D721.long, 5 Network of Cancer Gene; http://ncg.kcl.ac.uk/index.php, 1Therapeutic Vulnerabilities in Cancer; http://cbio.mskcc.org/cancergenomics/statius/ |
| REACTOME_INTEGRATION_OF_ENERGY_METABOLISM | |
| OMIM | |
| Orphanet | |
| Disease | KEGG Disease: KCNS3 |
| MedGen: KCNS3 (Human Medical Genetics with Condition) | |
| ClinVar: KCNS3 | |
| Phenotype | MGI: KCNS3 (International Mouse Phenotyping Consortium) |
| PhenomicDB: KCNS3 | |
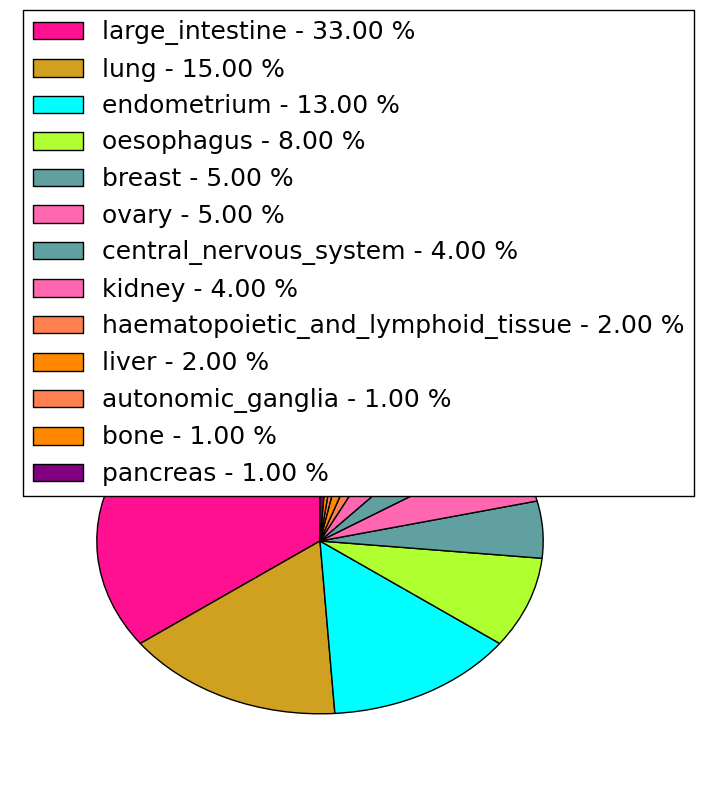
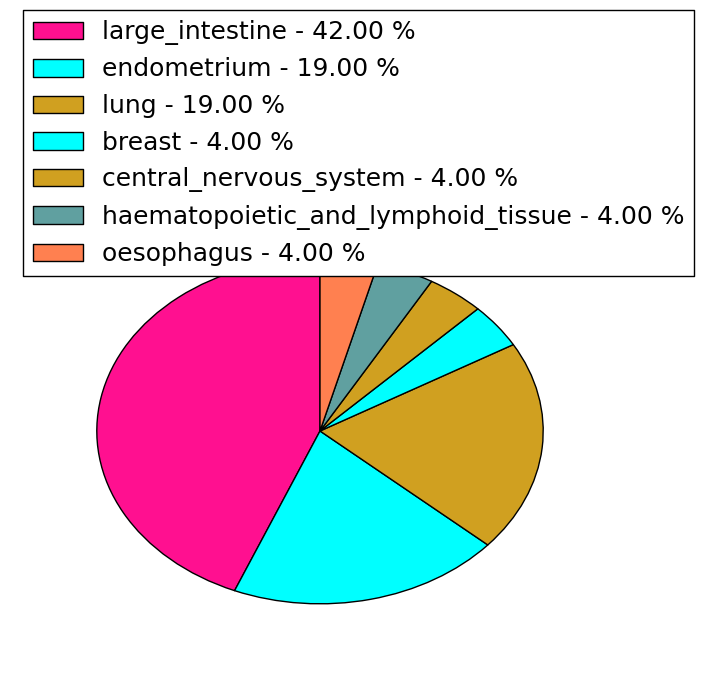
| Mutations for KCNS3 |
| * Under tables are showing count per each tissue to give us broad intuition about tissue specific mutation patterns.You can go to the detailed page for each mutation database's web site. |
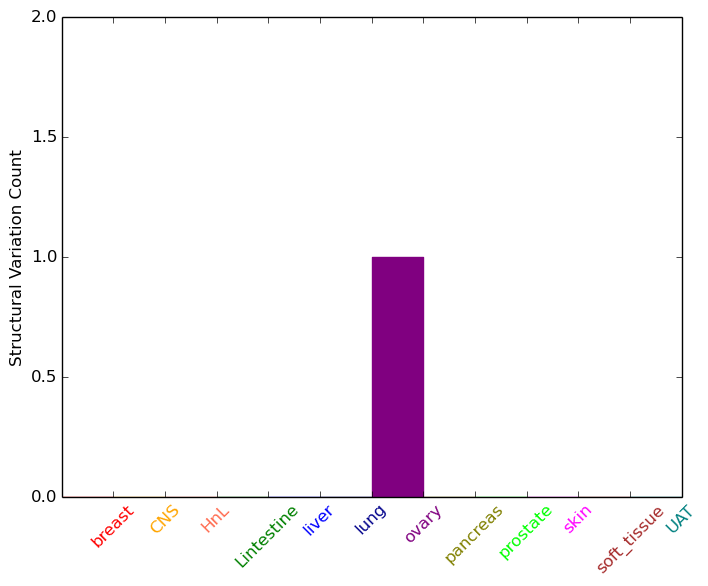
| - Statistics for Tissue and Mutation type | Top |
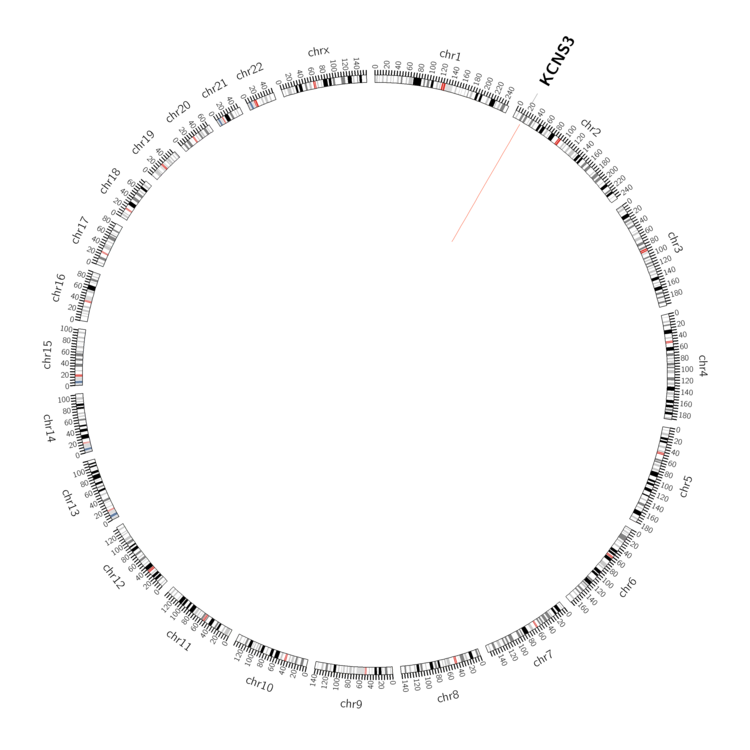 |
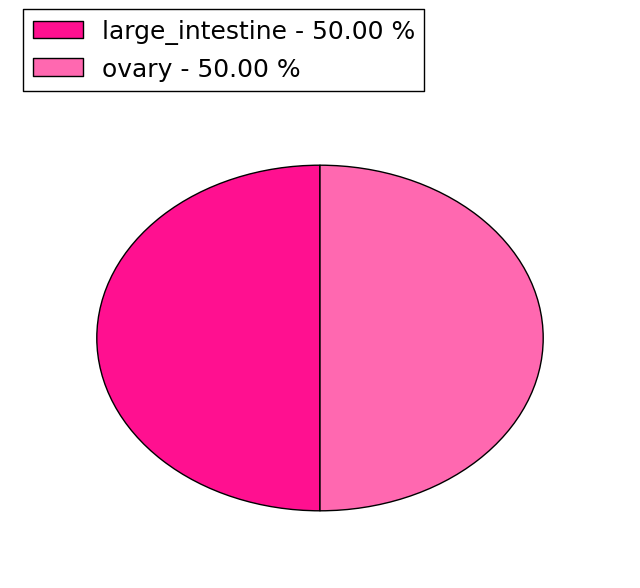
| - For Inter-chromosomal Variations |
| There's no inter-chromosomal structural variation. |
| - For Intra-chromosomal Variations |
| * Intra-chromosomal variantions includes 'intrachromosomal amplicon to amplicon', 'intrachromosomal amplicon to non-amplified dna', 'intrachromosomal deletion', 'intrachromosomal fold-back inversion', 'intrachromosomal inversion', 'intrachromosomal tandem duplication', 'Intrachromosomal unknown type', 'intrachromosomal with inverted orientation', 'intrachromosomal with non-inverted orientation'. |
 |
| Sample | Symbol_a | Chr_a | Start_a | End_a | Symbol_b | Chr_b | Start_b | End_b |
| ovary | KCNS3 | chr2 | 18082555 | 18082575 | KCNS3 | chr2 | 18093251 | 18093271 |
| cf) Tissue number; Tissue name (1;Breast, 2;Central_nervous_system, 3;Haematopoietic_and_lymphoid_tissue, 4;Large_intestine, 5;Liver, 6;Lung, 7;Ovary, 8;Pancreas, 9;Prostate, 10;Skin, 11;Soft_tissue, 12;Upper_aerodigestive_tract) |
| * From mRNA Sanger sequences, Chitars2.0 arranged chimeric transcripts. This table shows KCNS3 related fusion information. |
| ID | Head Gene | Tail Gene | Accession | Gene_a | qStart_a | qEnd_a | Chromosome_a | tStart_a | tEnd_a | Gene_a | qStart_a | qEnd_a | Chromosome_a | tStart_a | tEnd_a |
| Top |
| There's no copy number variation information in COSMIC data for this gene. |
| Top |
|
 |
| Top |
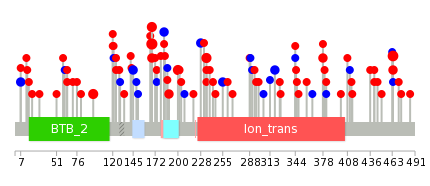
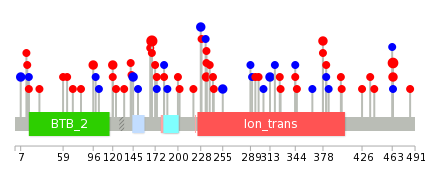
| Stat. for Non-Synonymous SNVs (# total SNVs=72) | (# total SNVs=21) |
 |  |
(# total SNVs=2) | (# total SNVs=0) |
 |
| Top |
| * When you move the cursor on each content, you can see more deailed mutation information on the Tooltip. Those are primary_site,primary_histology,mutation(aa),pubmedID. |
| GRCh37 position | Mutation(aa) | Unique sampleID count |
| chr2:18112777-18112777 | p.R168W | 5 |
| chr2:18112778-18112778 | p.R168L | 5 |
| chr2:18113665-18113665 | p.D464N | 4 |
| chr2:18112561-18112561 | p.V96I | 3 |
| chr2:18112978-18112978 | p.G235R | 3 |
| chr2:18112873-18112873 | p.V200M | 3 |
| chr2:18113666-18113666 | p.D464G | 2 |
| chr2:18113407-18113407 | p.P378S | 2 |
| chr2:18112710-18112710 | p.S145S | 2 |
| chr2:18112824-18112824 | p.S183S | 2 |
| Top |
|
 |
| Point Mutation/ Tissue ID | 1 | 2 | 3 | 4 | 5 | 6 | 7 | 8 | 9 | 10 | 11 | 12 | 13 | 14 | 15 | 16 | 17 | 18 | 19 | 20 |
| # sample | 1 | 2 | 1 | 22 | 1 | 4 | 2 | 8 | 2 | 4 | 13 | 7 | 11 | |||||||
| # mutation | 1 | 2 | 1 | 16 | 1 | 5 | 2 | 8 | 2 | 4 | 17 | 7 | 12 | |||||||
| nonsynonymous SNV | 1 | 2 | 10 | 1 | 3 | 2 | 4 | 2 | 4 | 10 | 5 | 8 | ||||||||
| synonymous SNV | 1 | 6 | 2 | 4 | 7 | 2 | 4 |
| cf) Tissue ID; Tissue type (1; BLCA[Bladder Urothelial Carcinoma], 2; BRCA[Breast invasive carcinoma], 3; CESC[Cervical squamous cell carcinoma and endocervical adenocarcinoma], 4; COAD[Colon adenocarcinoma], 5; GBM[Glioblastoma multiforme], 6; Glioma Low Grade, 7; HNSC[Head and Neck squamous cell carcinoma], 8; KICH[Kidney Chromophobe], 9; KIRC[Kidney renal clear cell carcinoma], 10; KIRP[Kidney renal papillary cell carcinoma], 11; LAML[Acute Myeloid Leukemia], 12; LUAD[Lung adenocarcinoma], 13; LUSC[Lung squamous cell carcinoma], 14; OV[Ovarian serous cystadenocarcinoma ], 15; PAAD[Pancreatic adenocarcinoma], 16; PRAD[Prostate adenocarcinoma], 17; SKCM[Skin Cutaneous Melanoma], 18:STAD[Stomach adenocarcinoma], 19:THCA[Thyroid carcinoma], 20:UCEC[Uterine Corpus Endometrial Carcinoma]) |
| Top |
| * We represented just top 10 SNVs. When you move the cursor on each content, you can see more deailed mutation information on the Tooltip. Those are primary_site, primary_histology, mutation(aa), pubmedID. |
| Genomic Position | Mutation(aa) | Unique sampleID count |
| chr2:18112777 | p.R168W,KCNS3 | 5 |
| chr2:18113665 | p.D464N,KCNS3 | 4 |
| chr2:18113407 | p.G235R,KCNS3 | 2 |
| chr2:18112978 | p.G235E,KCNS3 | 2 |
| chr2:18112979 | p.D464G,KCNS3 | 2 |
| chr2:18113666 | p.P378S,KCNS3 | 2 |
| chr2:18112710 | p.V96I,KCNS3 | 2 |
| chr2:18112561 | p.R120C,KCNS3 | 2 |
| chr2:18112296 | p.F7F,KCNS3 | 2 |
| chr2:18112959 | p.A228A,KCNS3 | 2 |
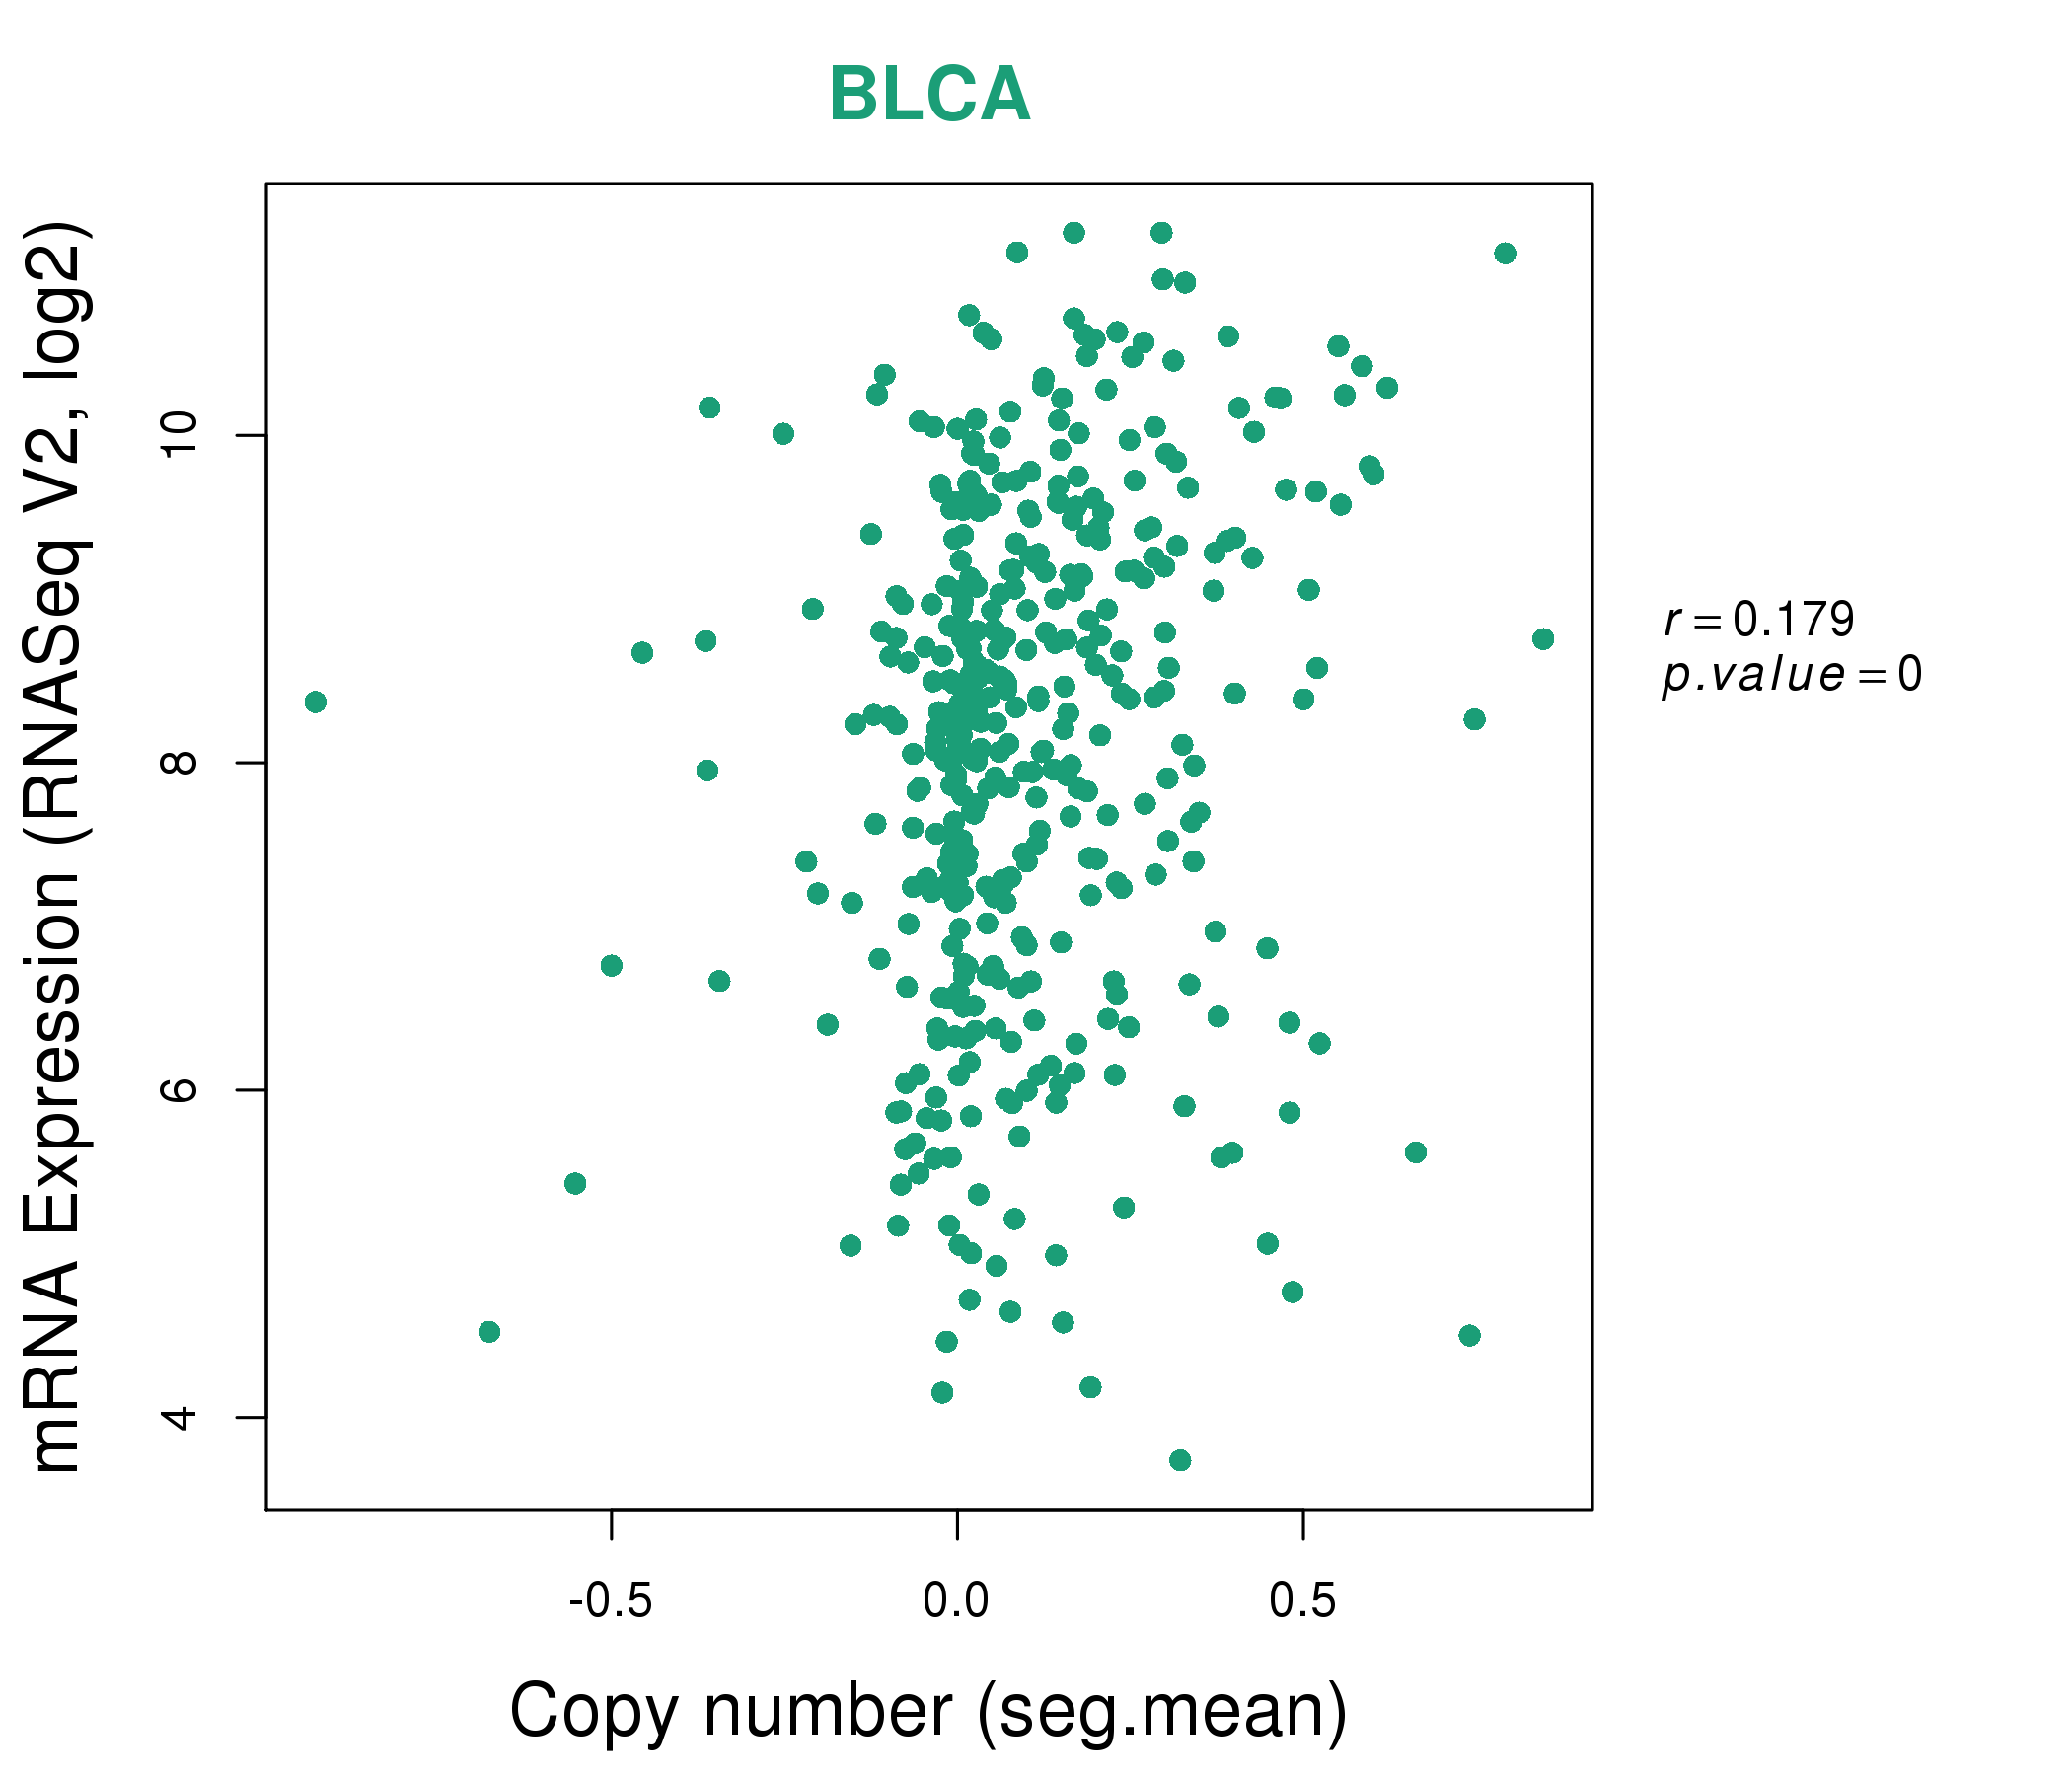
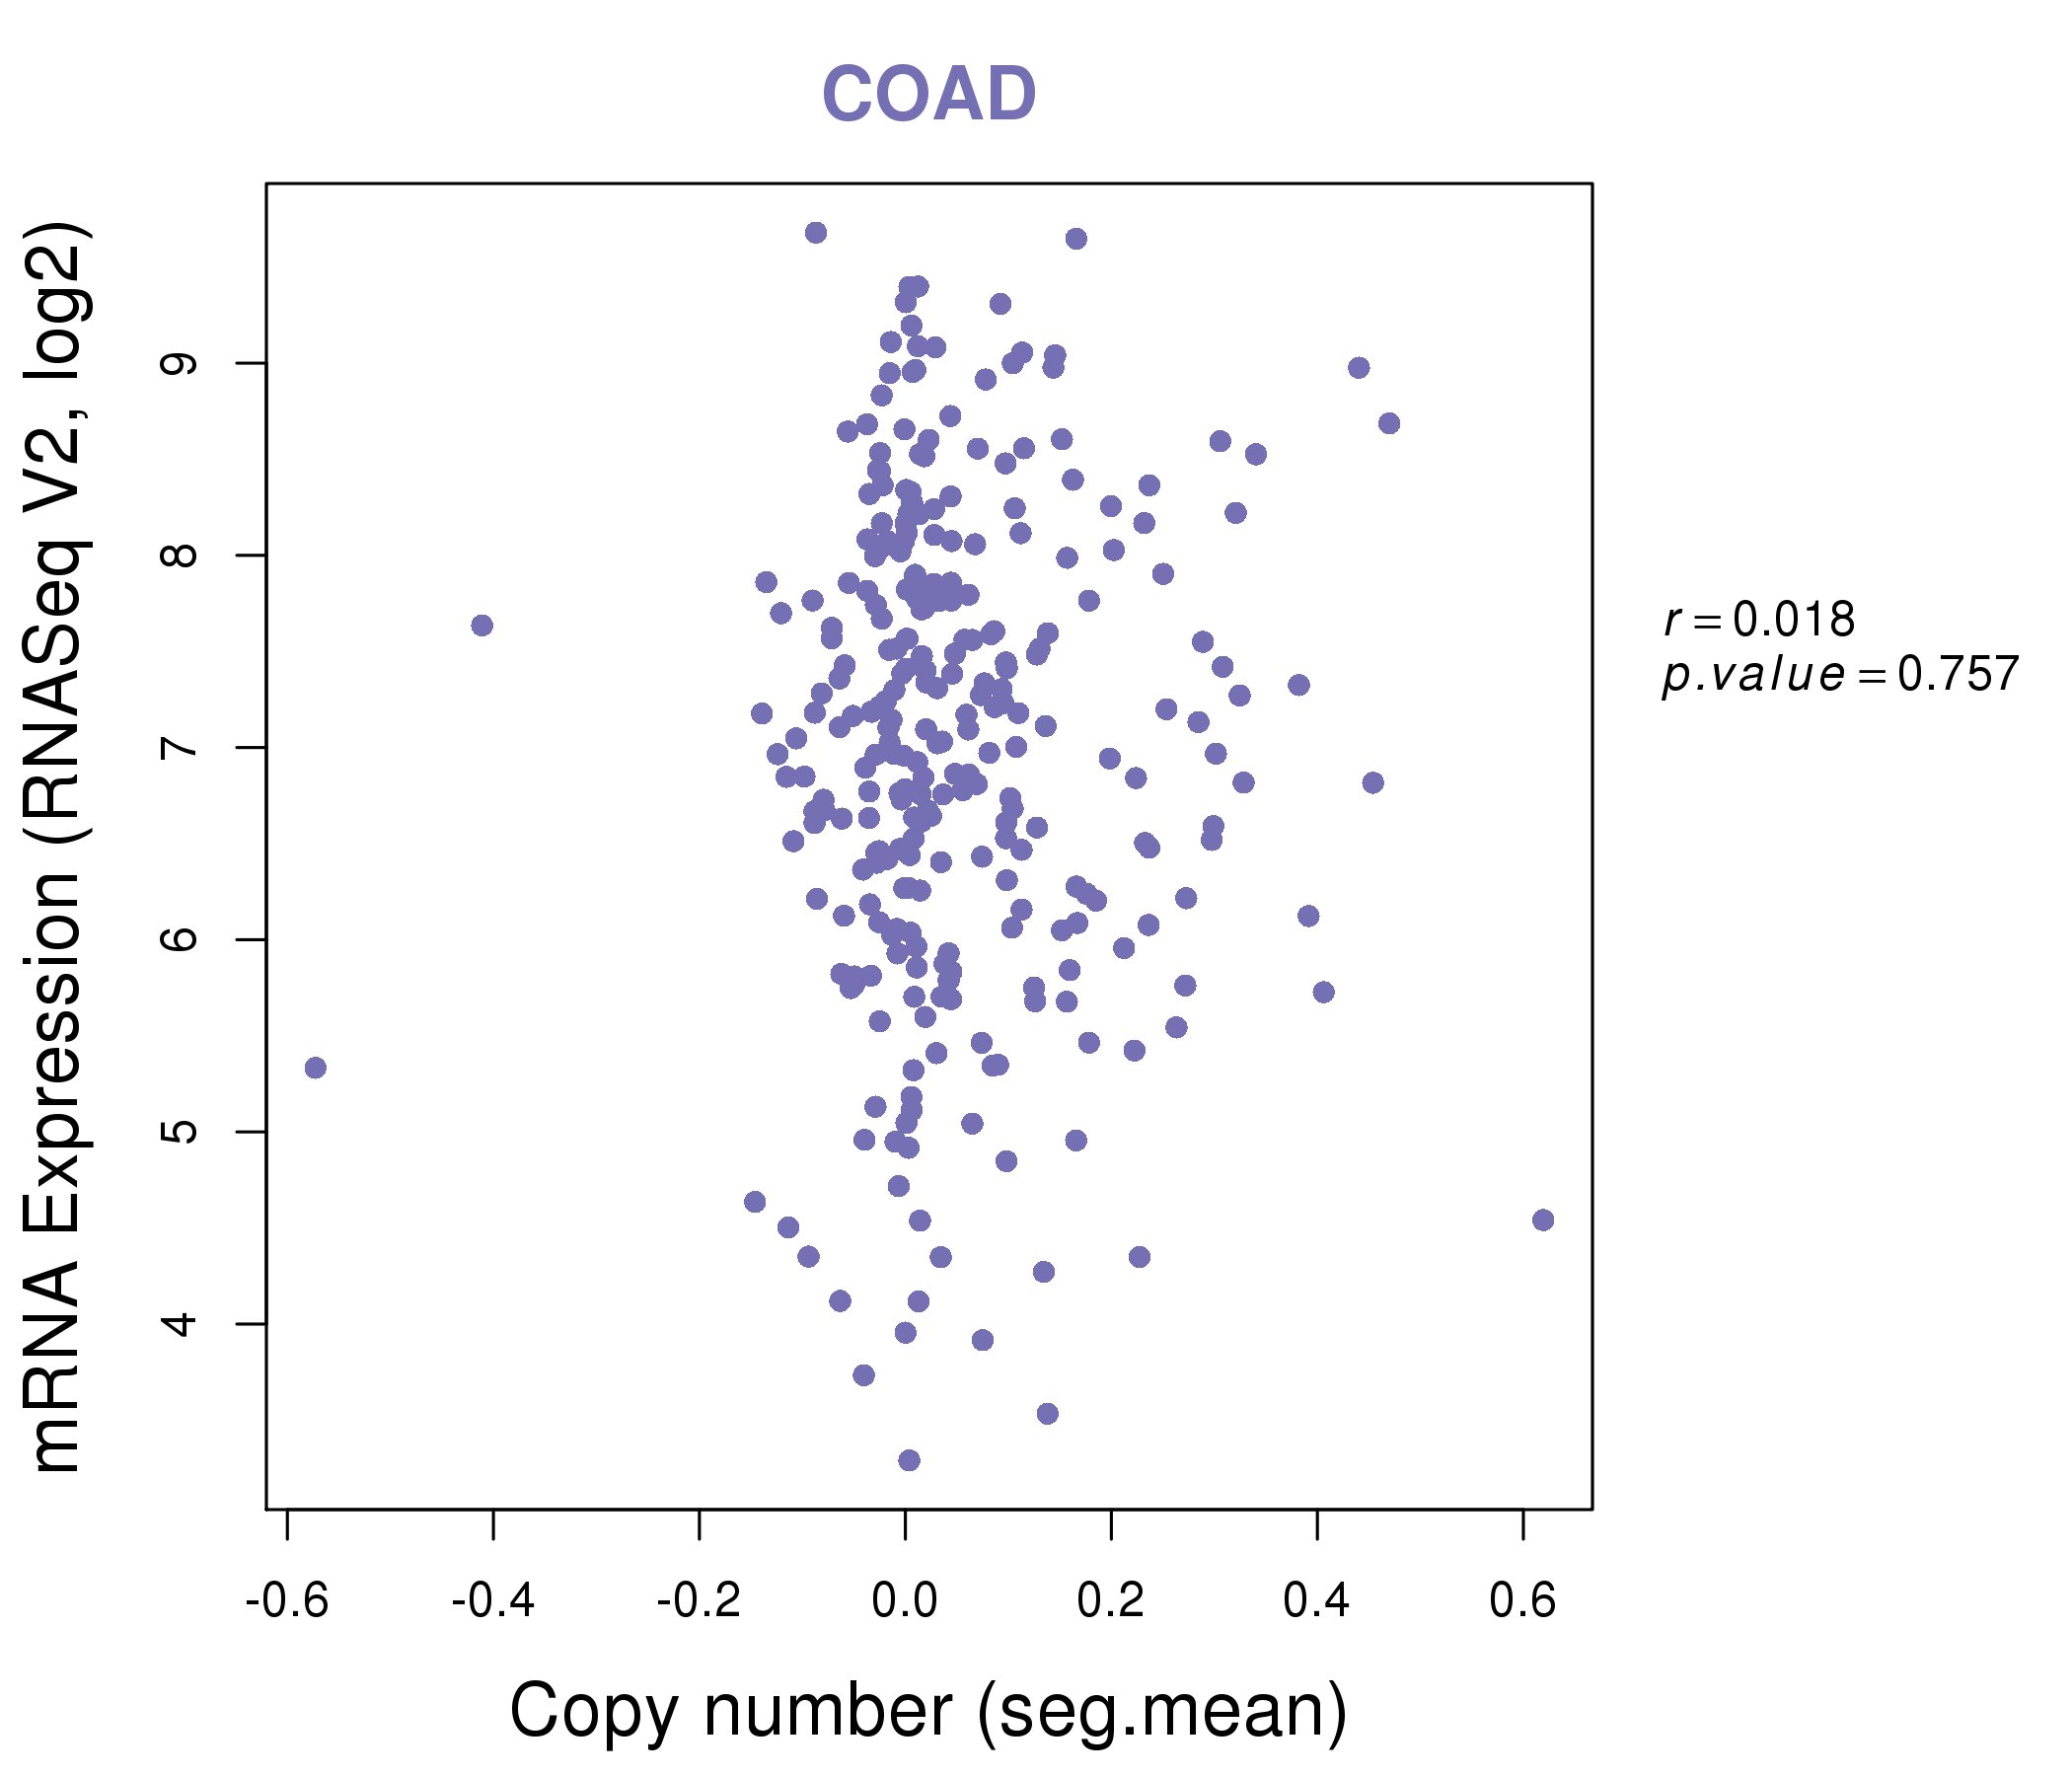
| * Copy number data were extracted from TCGA using R package TCGA-Assembler. The URLs of all public data files on TCGA DCC data server were gathered on Jan-05-2015. Function ProcessCNAData in TCGA-Assembler package was used to obtain gene-level copy number value which is calculated as the average copy number of the genomic region of a gene. |
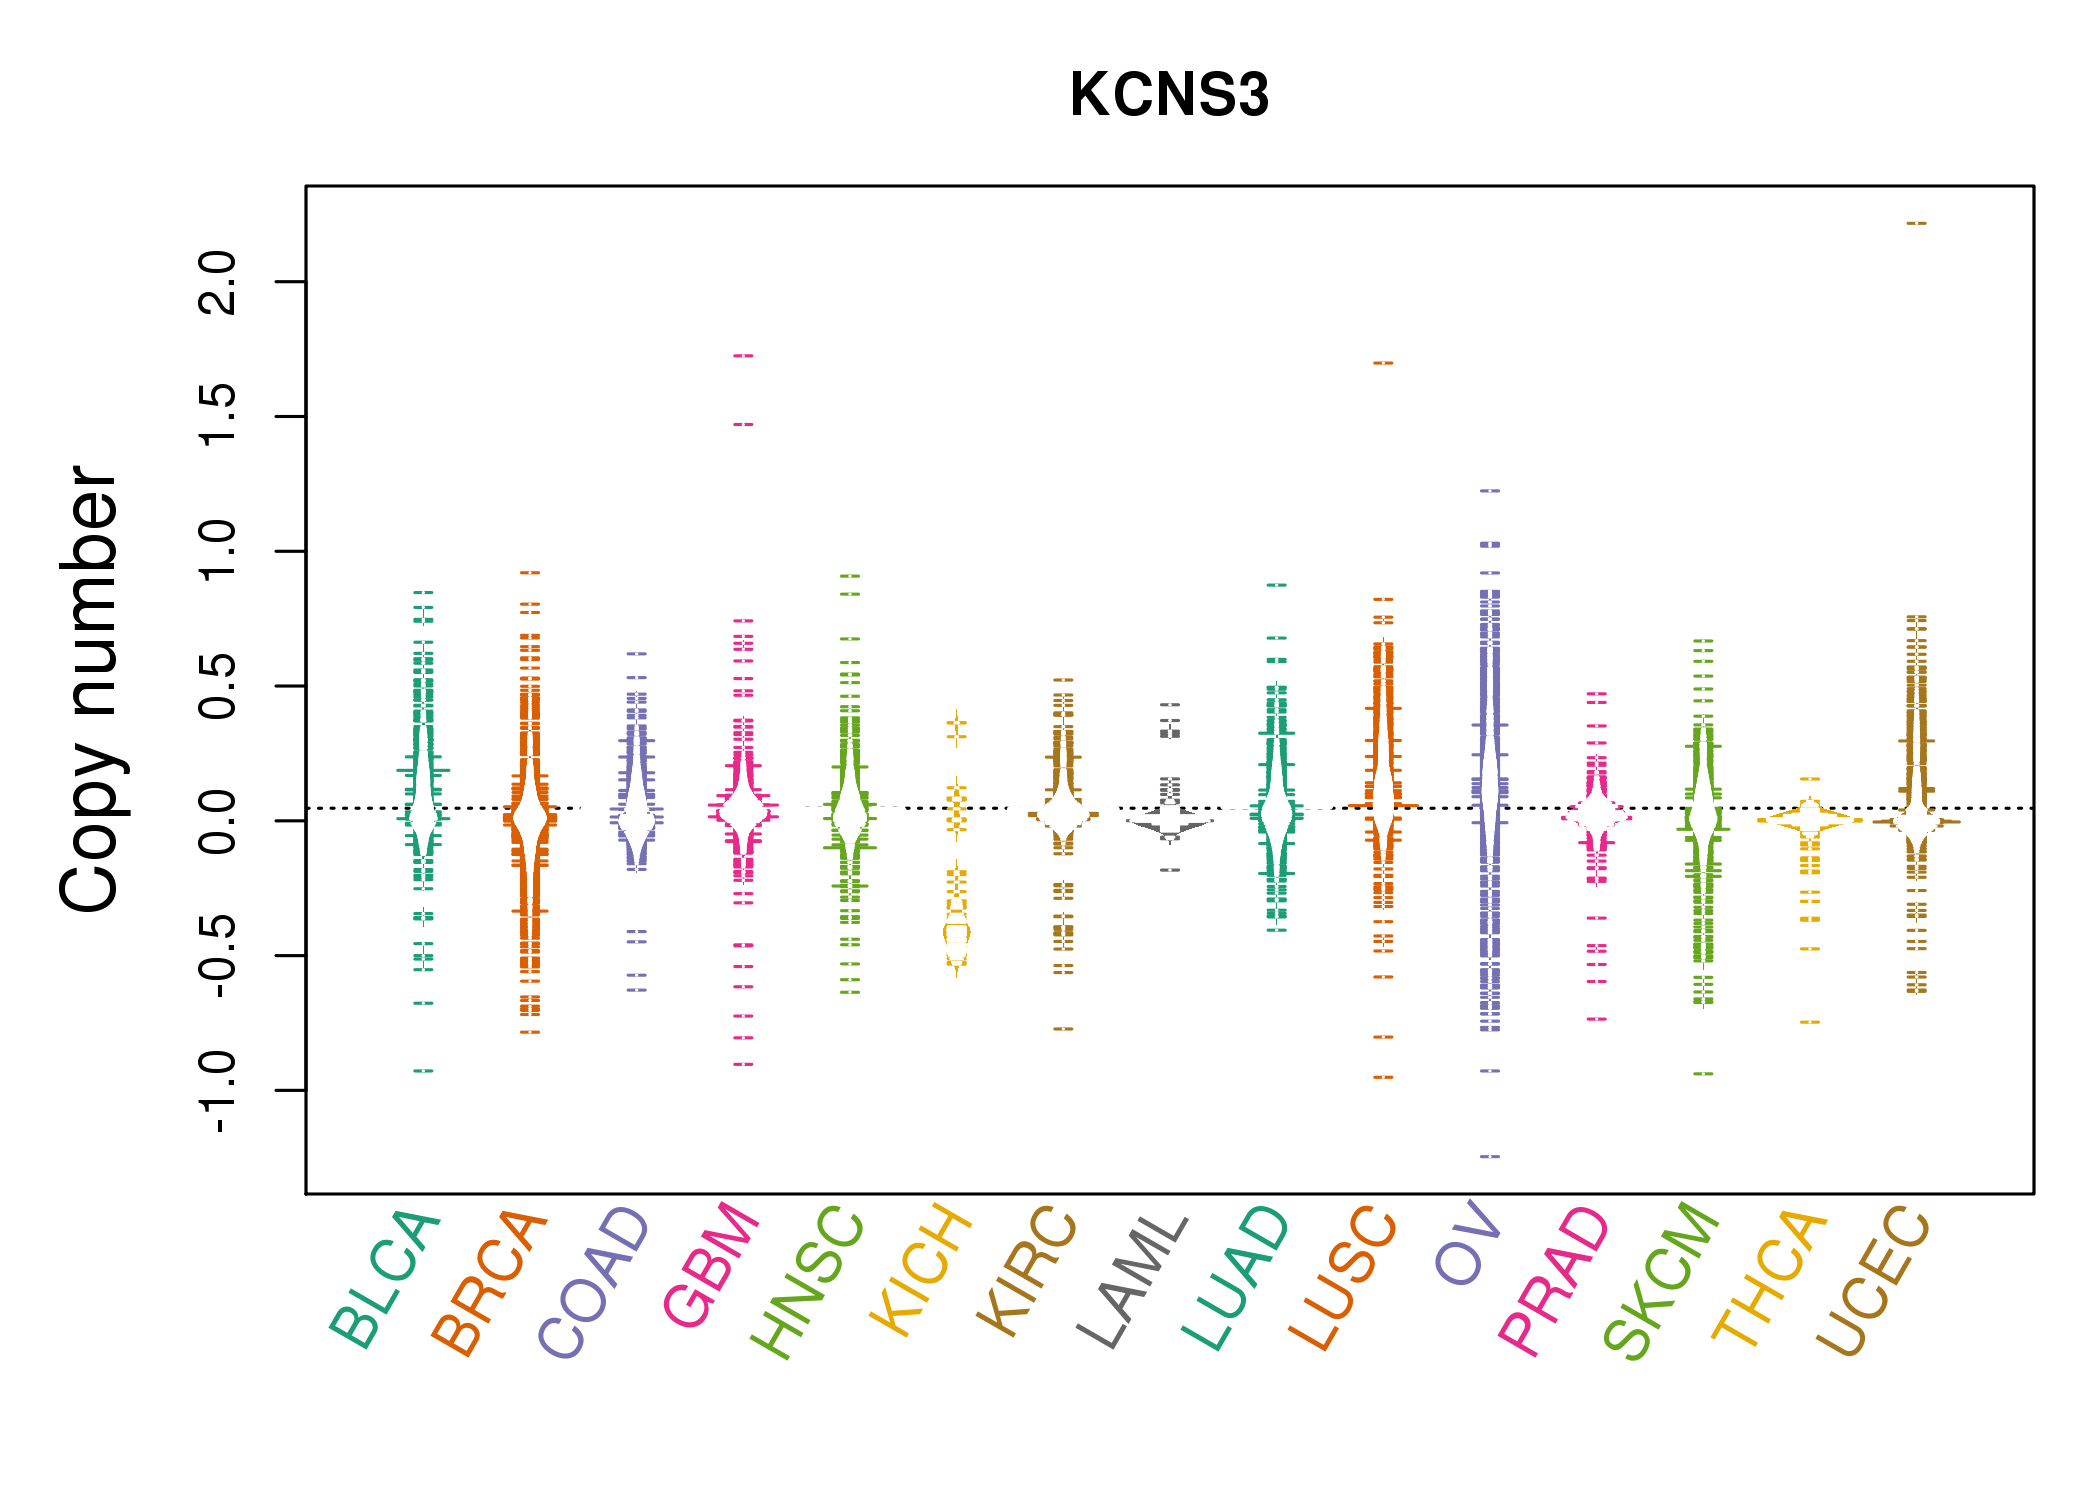 |
| cf) Tissue ID[Tissue type]: BLCA[Bladder Urothelial Carcinoma], BRCA[Breast invasive carcinoma], CESC[Cervical squamous cell carcinoma and endocervical adenocarcinoma], COAD[Colon adenocarcinoma], GBM[Glioblastoma multiforme], Glioma Low Grade, HNSC[Head and Neck squamous cell carcinoma], KICH[Kidney Chromophobe], KIRC[Kidney renal clear cell carcinoma], KIRP[Kidney renal papillary cell carcinoma], LAML[Acute Myeloid Leukemia], LUAD[Lung adenocarcinoma], LUSC[Lung squamous cell carcinoma], OV[Ovarian serous cystadenocarcinoma ], PAAD[Pancreatic adenocarcinoma], PRAD[Prostate adenocarcinoma], SKCM[Skin Cutaneous Melanoma], STAD[Stomach adenocarcinoma], THCA[Thyroid carcinoma], UCEC[Uterine Corpus Endometrial Carcinoma] |
| Top |
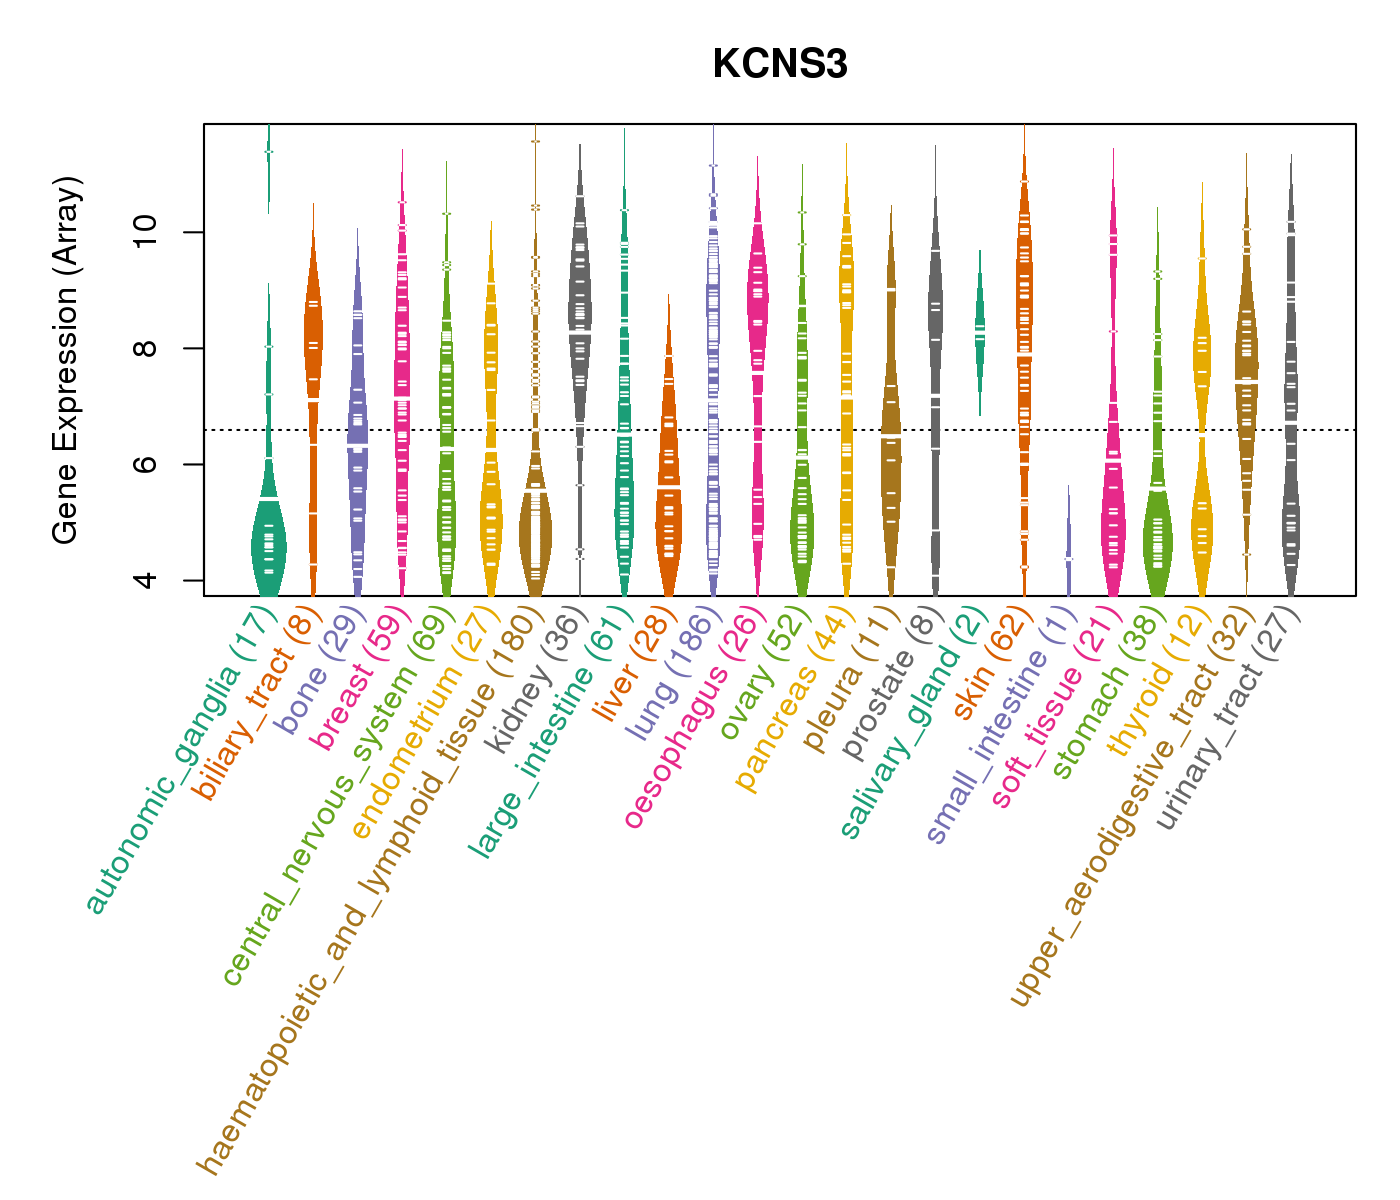
| Gene Expression for KCNS3 |
| * CCLE gene expression data were extracted from CCLE_Expression_Entrez_2012-10-18.res: Gene-centric RMA-normalized mRNA expression data. |
 |
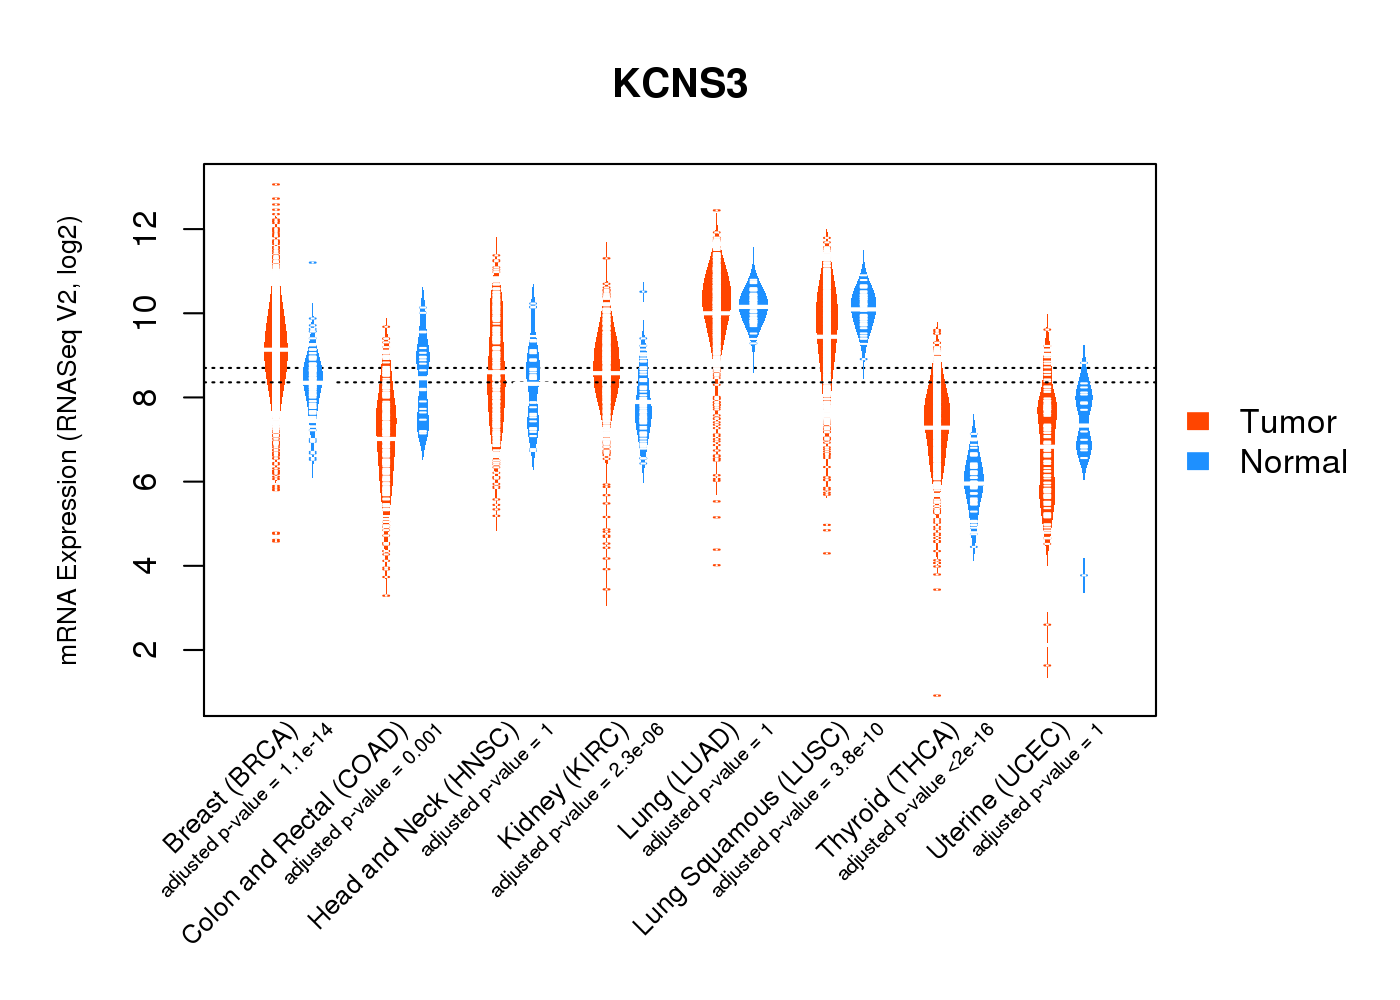
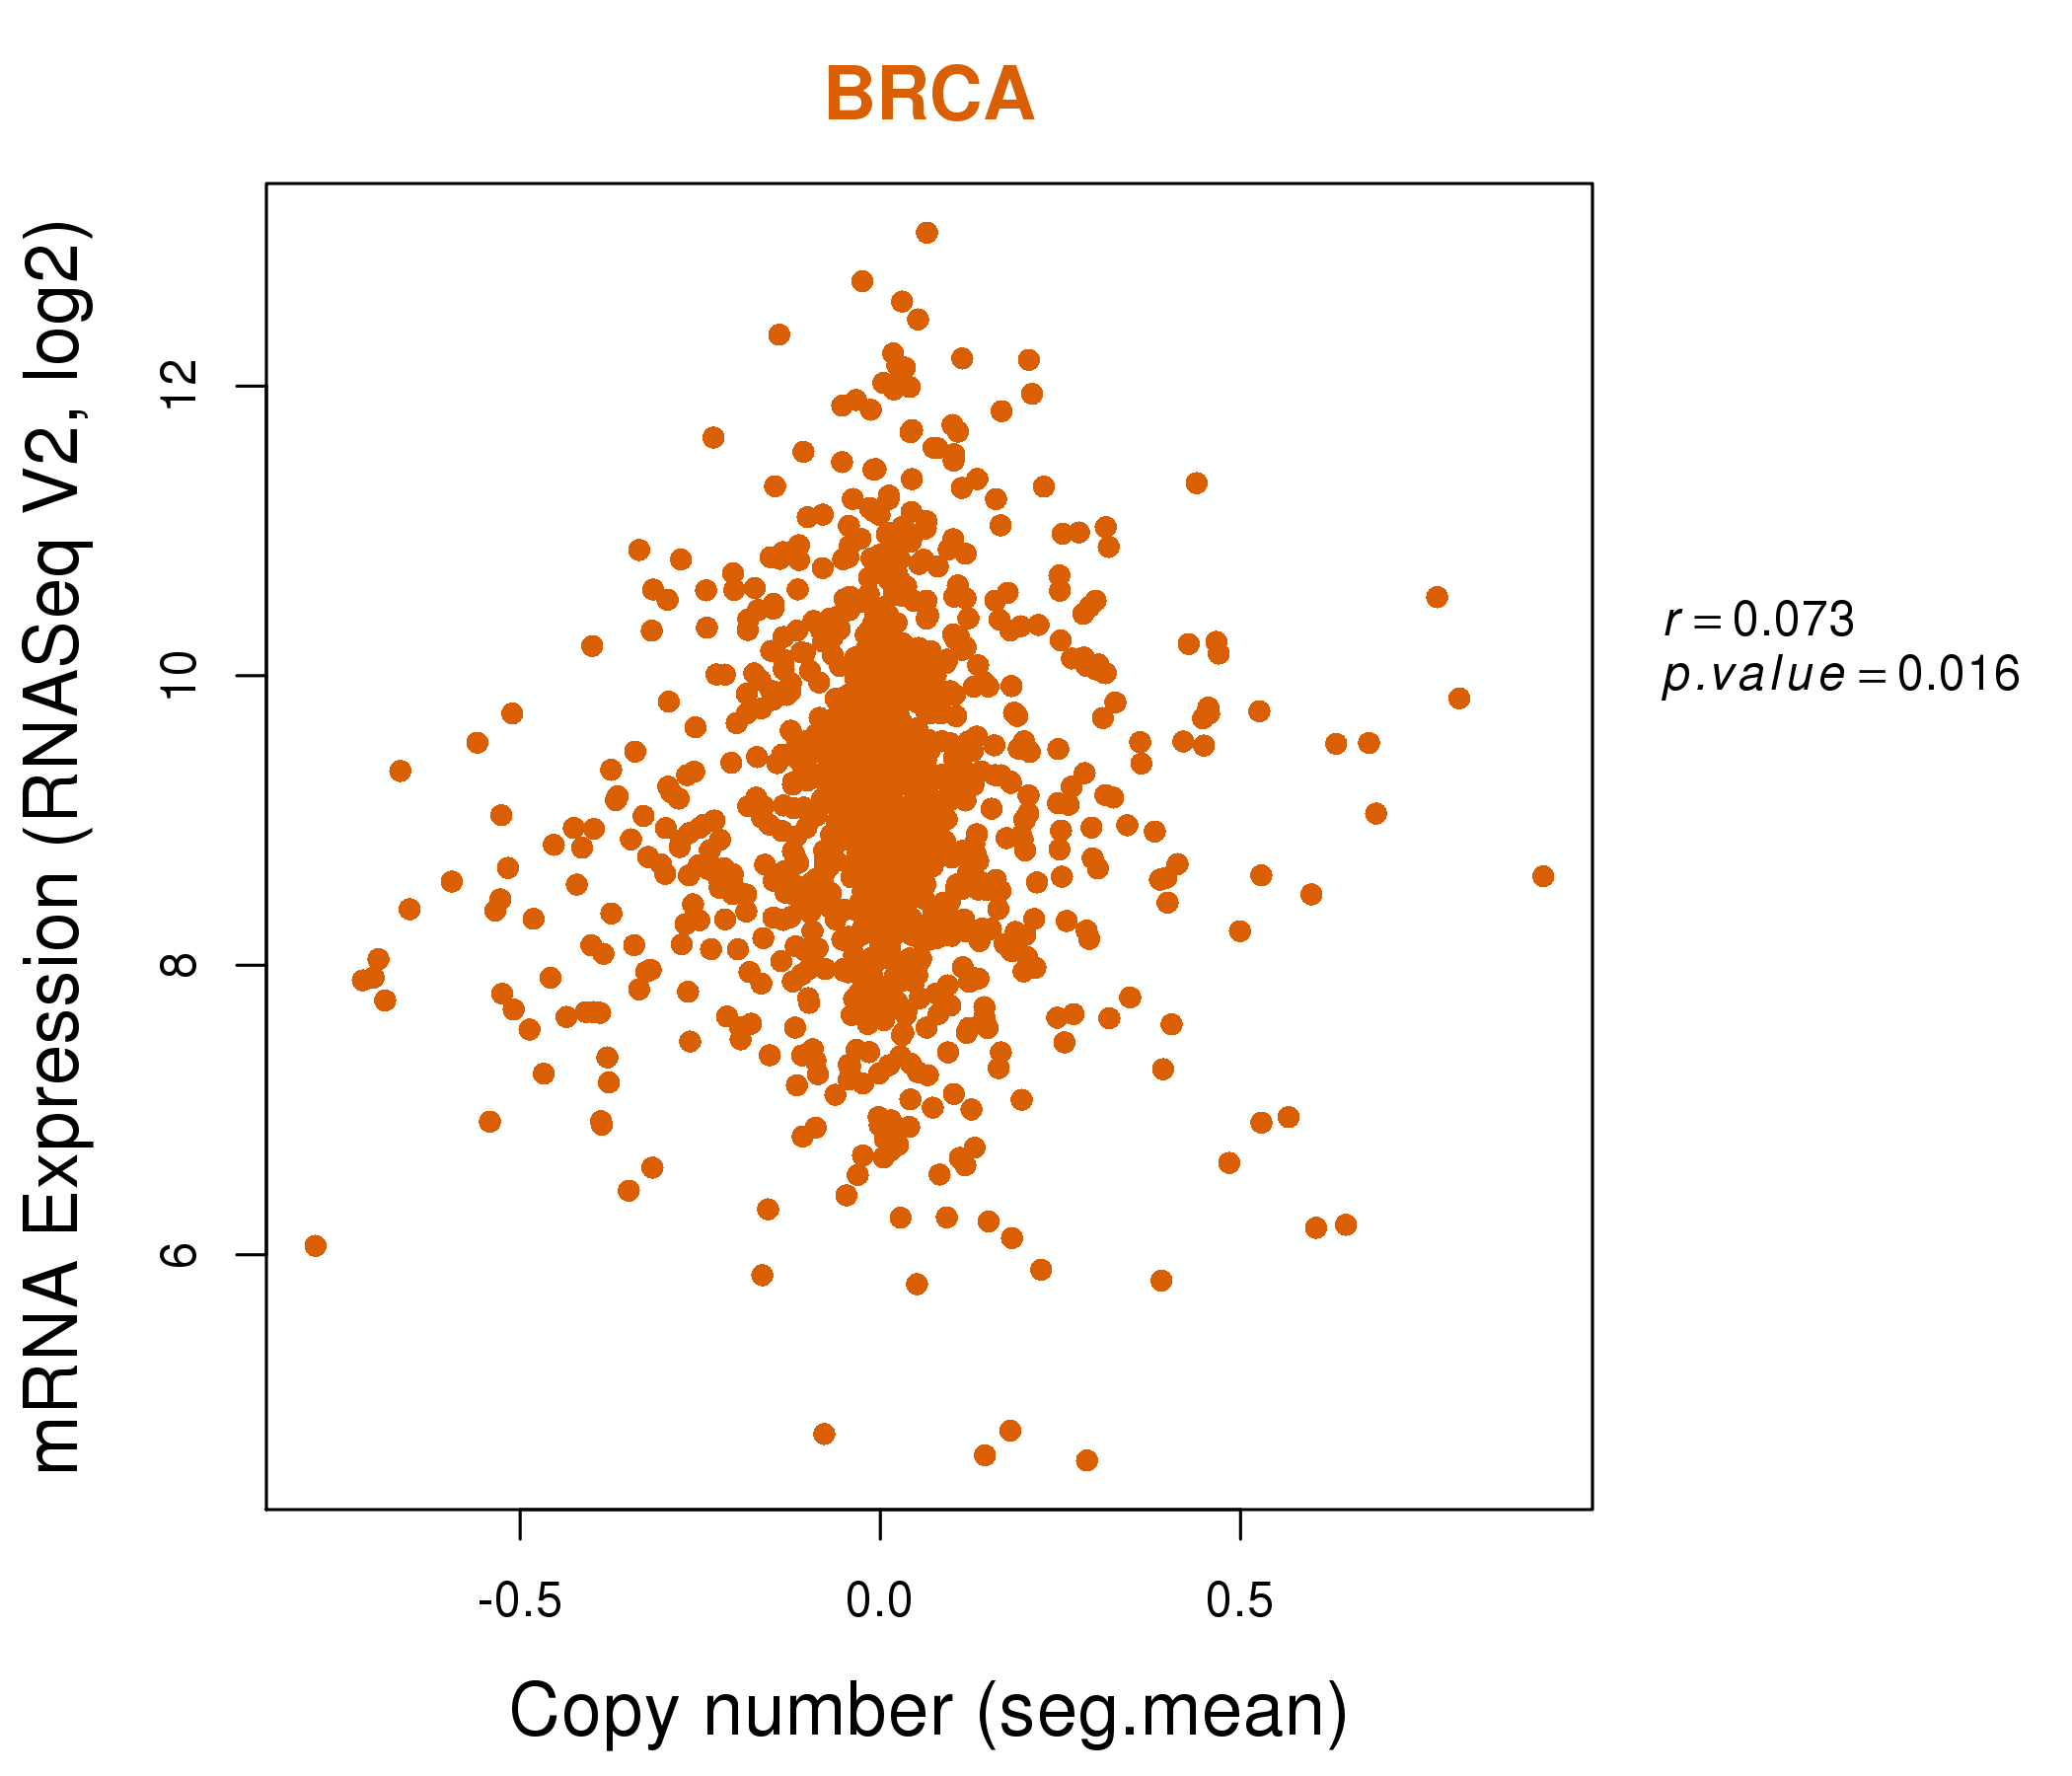
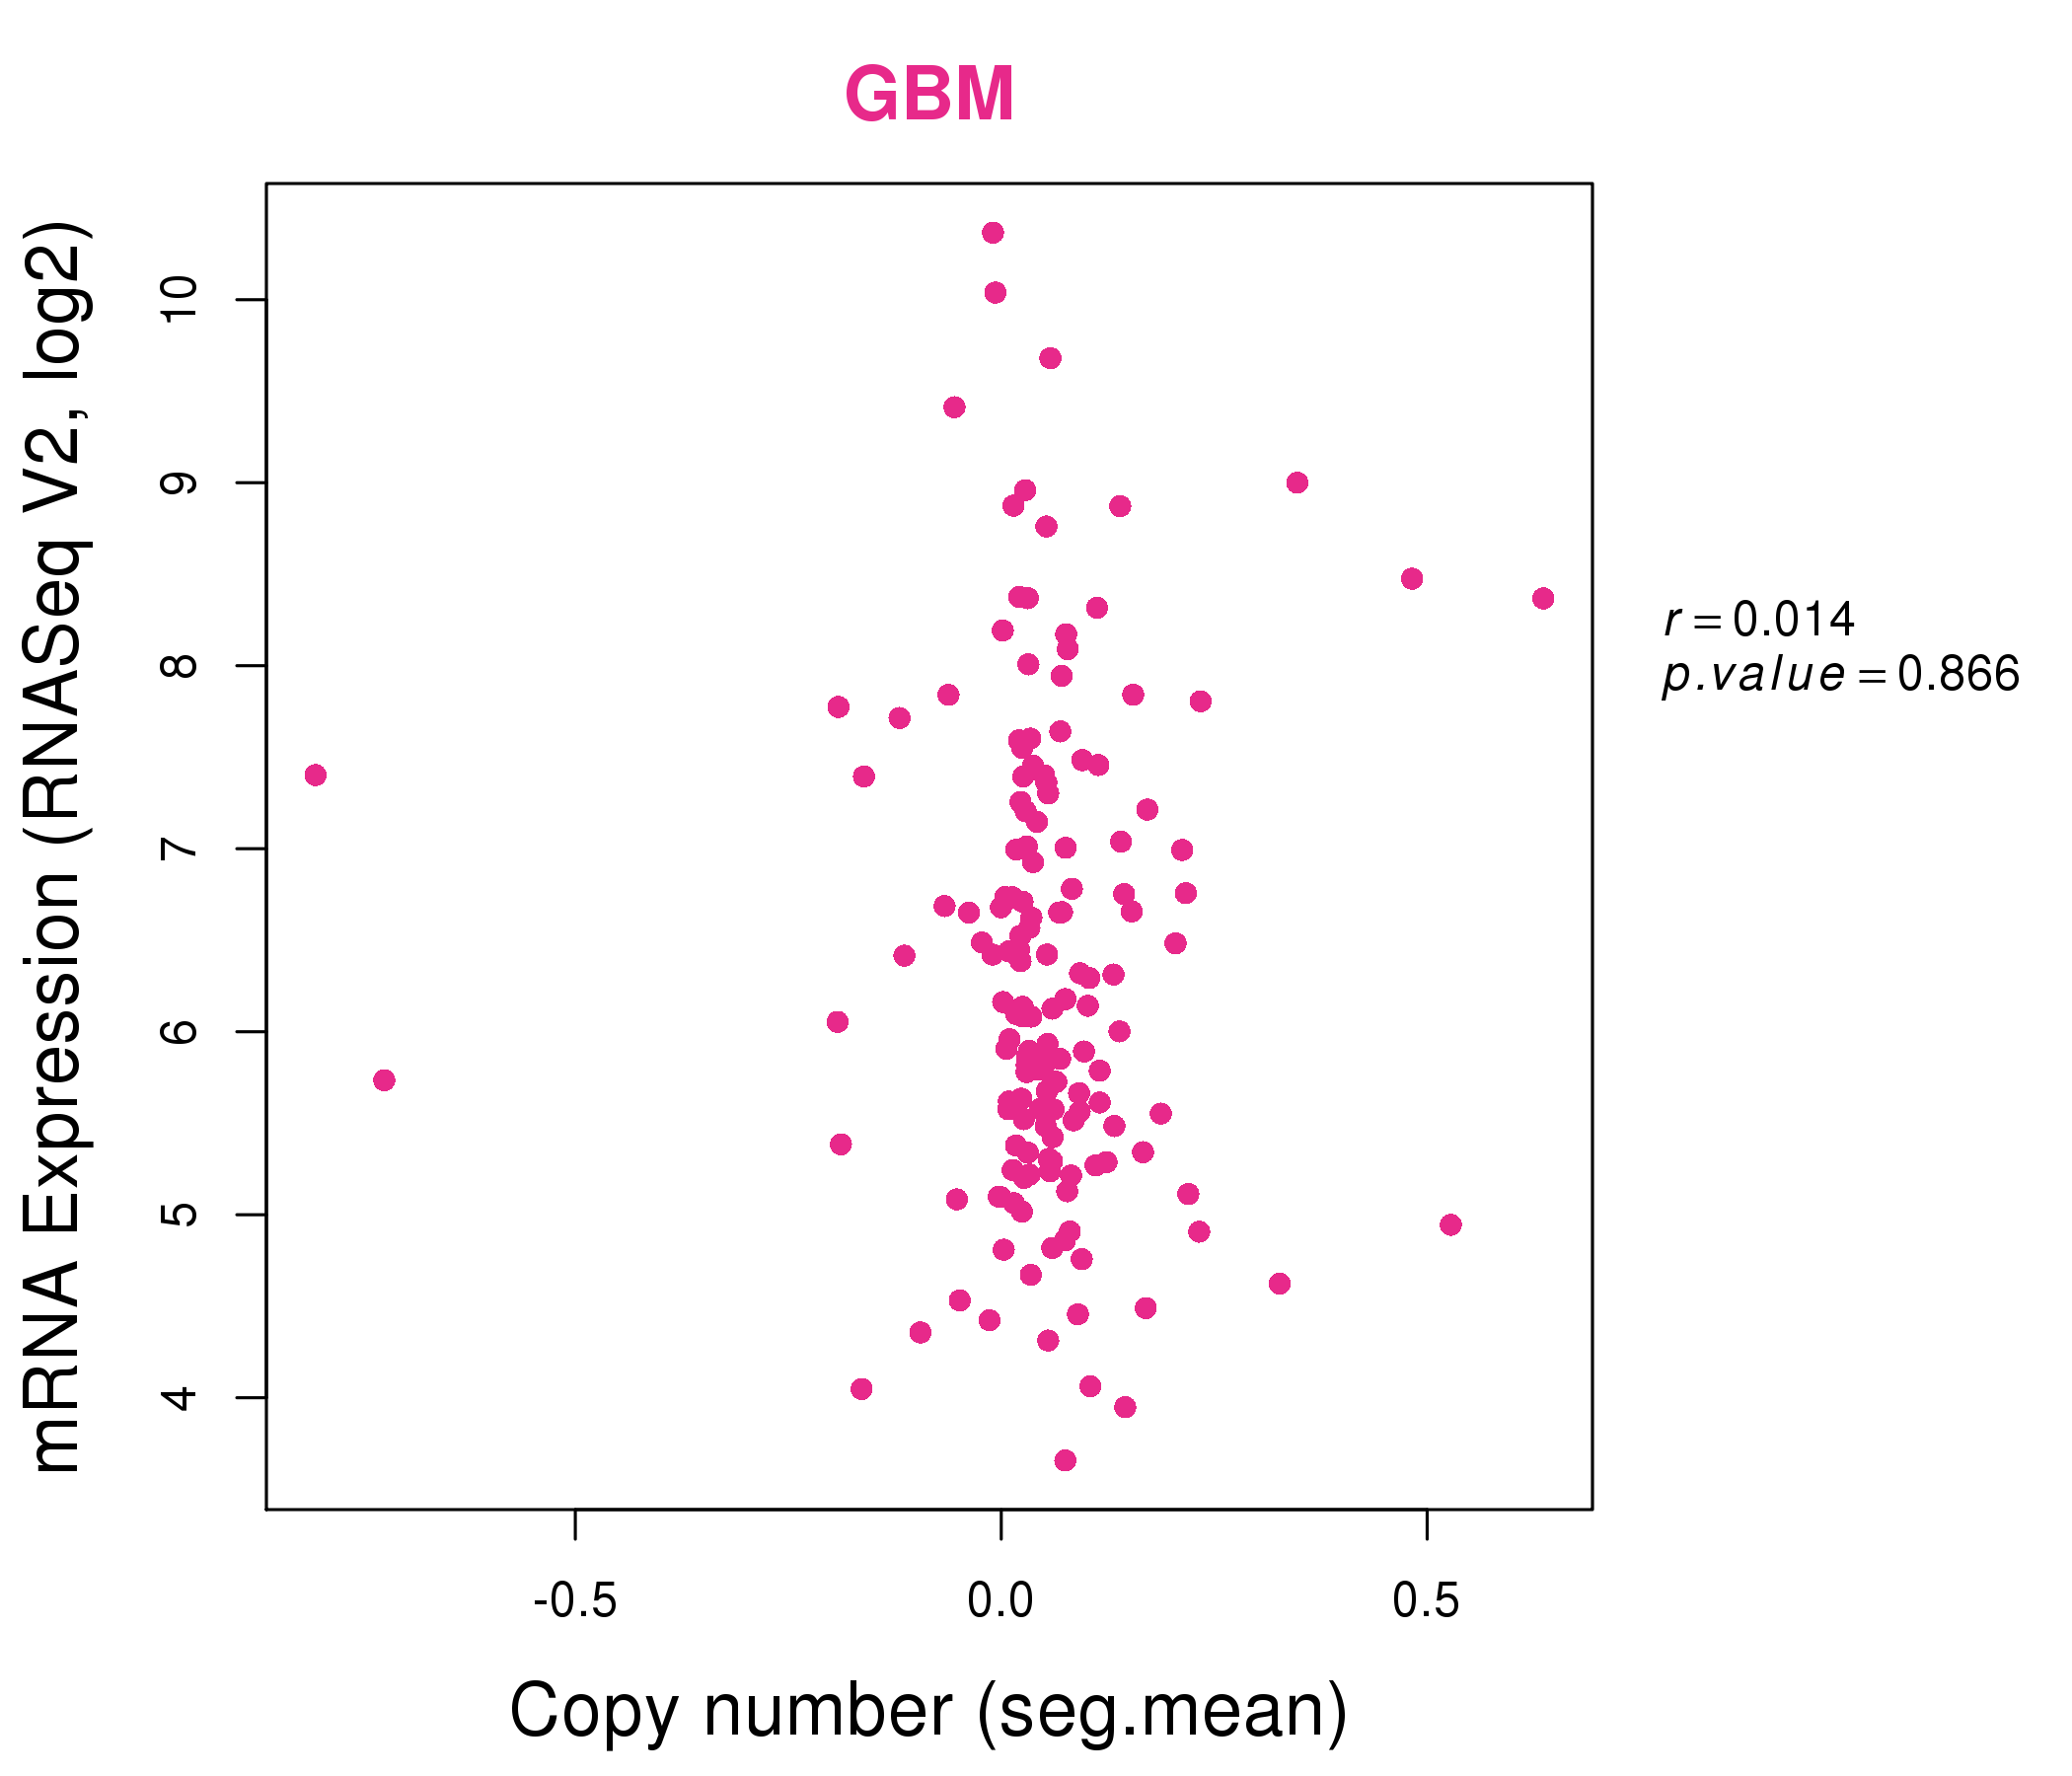
| * Normalized gene expression data of RNASeqV2 was extracted from TCGA using R package TCGA-Assembler. The URLs of all public data files on TCGA DCC data server were gathered at Jan-05-2015. Only eight cancer types have enough normal control samples for differential expression analysis. (t test, adjusted p<0.05 (using Benjamini-Hochberg FDR)) |
 |
| Top |
| * This plots show the correlation between CNV and gene expression. |
: Open all plots for all cancer types
 |
|
 |
|
| Top |
| Gene-Gene Network Information |
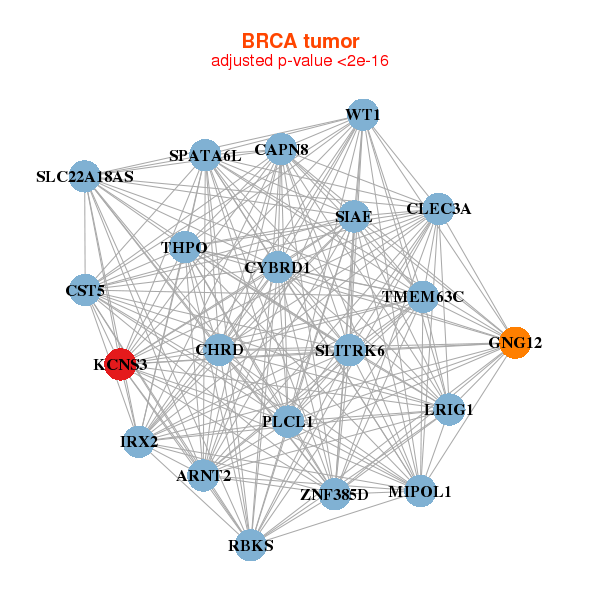
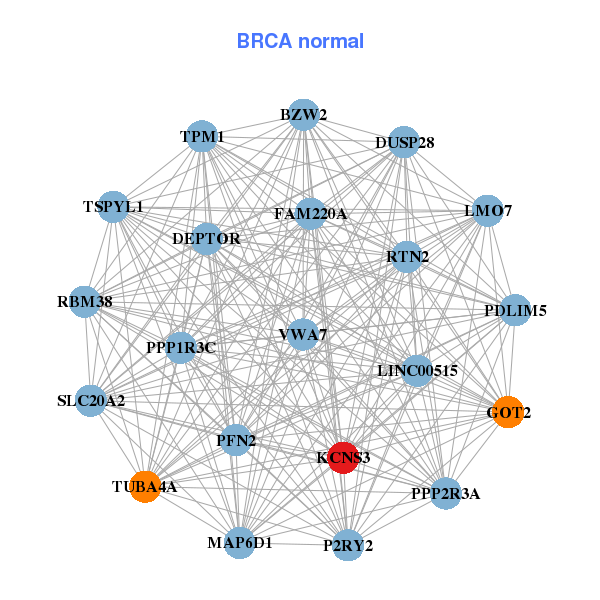
| * Co-Expression network figures were drawn using R package igraph. Only the top 20 genes with the highest correlations were shown. Red circle: input gene, orange circle: cell metabolism gene, sky circle: other gene |
: Open all plots for all cancer types
 |
|
| ARNT2,SPATA6L,CAPN8,CHRD,CLEC3A,CST5,CYBRD1, GNG12,IRX2,KCNS3,LRIG1,MIPOL1,PLCL1,RBKS, SIAE,SLC22A18AS,SLITRK6,THPO,TMEM63C,WT1,ZNF385D | BZW2,LINC00515,VWA7,FAM220A,DEPTOR,DUSP28,GOT2, KCNS3,LMO7,MAP6D1,P2RY2,PDLIM5,PFN2,PPP1R3C, PPP2R3A,RBM38,RTN2,SLC20A2,TPM1,TSPYL1,TUBA4A |
 |
|
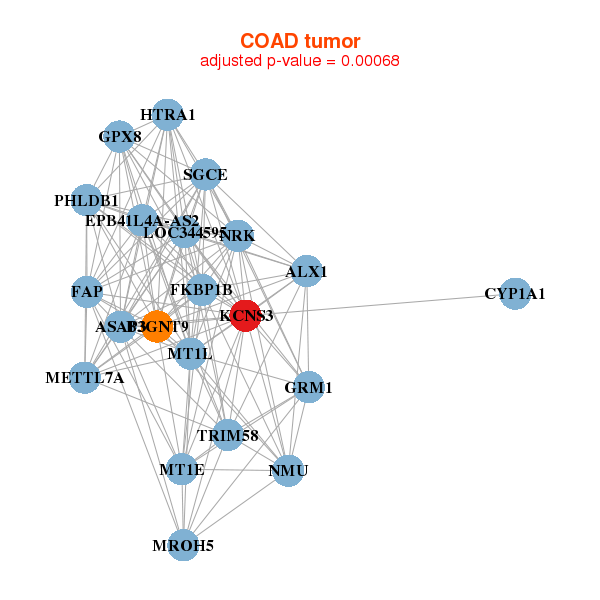
| ALX1,ASAP3,B3GNT9,CYP1A1,FAP,FKBP1B,EPB41L4A-AS2, MROH5,GPX8,GRM1,HTRA1,KCNS3,LOC344595,METTL7A, MT1E,MT1L,NMU,NRK,PHLDB1,SGCE,TRIM58 | ABHD14A,CALHM2,CSRP2,FADS1,FKBP9P1,GPX7,HRH2, IKBIP,KCNS3,MAD2L2,MTA3,PDPN,PRY2,PTGIR, SLC27A5,SLC43A3,SLFN12,SMOC2,TPRG1,TTC39C,XRRA1 |
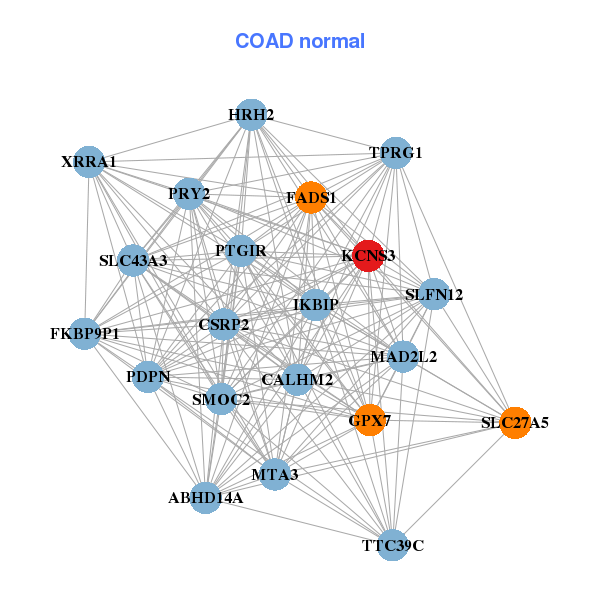
| * Co-Expression network figures were drawn using R package igraph. Only the top 20 genes with the highest correlations were shown. Red circle: input gene, orange circle: cell metabolism gene, sky circle: other gene |
: Open all plots for all cancer types
| Top |
: Open all interacting genes' information including KEGG pathway for all interacting genes from DAVID
| Top |
| Pharmacological Information for KCNS3 |
| There's no related Drug. |
| Top |
| Cross referenced IDs for KCNS3 |
| * We obtained these cross-references from Uniprot database. It covers 150 different DBs, 18 categories. http://www.uniprot.org/help/cross_references_section |
: Open all cross reference information
|
Copyright © 2016-Present - The Univsersity of Texas Health Science Center at Houston @ |