|
||||||||||||||||||||
| |
| Phenotypic Information (metabolism pathway, cancer, disease, phenome) |
| |
| |
| Gene-Gene Network Information: Co-Expression Network, Interacting Genes & KEGG |
| |
|


| Gene Summary for ACAT1 |
| Basic gene info. | Gene symbol | ACAT1 |
| Gene name | acetyl-CoA acetyltransferase 1 | |
| Synonyms | ACAT|MAT|T2|THIL | |
| Cytomap | UCSC genome browser: 11q22.3 | |
| Genomic location | chr11 :107992257-108018891 | |
| Type of gene | protein-coding | |
| RefGenes | NM_000019.3, | |
| Ensembl id | ENSG00000075239 | |
| Description | acetoacetyl Coenzyme A thiolaseacetoacetyl-CoA thiolaseacetyl-CoA acetyltransferase, mitochondrialacetyl-Coenzyme A acetyltransferase 1mitochondrial acetoacetyl-CoA thiolase | |
| Modification date | 20141207 | |
| dbXrefs | MIM : 607809 | |
| HGNC : HGNC | ||
| Ensembl : ENSG00000075239 | ||
| HPRD : 01946 | ||
| Vega : OTTHUMG00000166381 | ||
| Protein | UniProt: go to UniProt's Cross Reference DB Table | |
| Expression | CleanEX: HS_ACAT1 | |
| BioGPS: 38 | ||
| Gene Expression Atlas: ENSG00000075239 | ||
| The Human Protein Atlas: ENSG00000075239 | ||
| Pathway | NCI Pathway Interaction Database: ACAT1 | |
| KEGG: ACAT1 | ||
| REACTOME: ACAT1 | ||
| ConsensusPathDB | ||
| Pathway Commons: ACAT1 | ||
| Metabolism | MetaCyc: ACAT1 | |
| HUMANCyc: ACAT1 | ||
| Regulation | Ensembl's Regulation: ENSG00000075239 | |
| miRBase: chr11 :107,992,257-108,018,891 | ||
| TargetScan: NM_000019 | ||
| cisRED: ENSG00000075239 | ||
| Context | iHOP: ACAT1 | |
| cancer metabolism search in PubMed: ACAT1 | ||
| UCL Cancer Institute: ACAT1 | ||
| Assigned class in ccmGDB | C | |
| Top |
| Phenotypic Information for ACAT1(metabolism pathway, cancer, disease, phenome) |
| Cancer | CGAP: ACAT1 |
| Familial Cancer Database: ACAT1 | |
| * This gene is included in those cancer gene databases. |
|
|
|
|
|
|
| ||||||||||||||
Oncogene 1 | Significant driver gene in | |||||||||||||||||||
| cf) number; DB name 1 Oncogene; http://nar.oxfordjournals.org/content/35/suppl_1/D721.long, 2 Tumor Suppressor gene; https://bioinfo.uth.edu/TSGene/, 3 Cancer Gene Census; http://www.nature.com/nrc/journal/v4/n3/abs/nrc1299.html, 4 CancerGenes; http://nar.oxfordjournals.org/content/35/suppl_1/D721.long, 5 Network of Cancer Gene; http://ncg.kcl.ac.uk/index.php, 1Therapeutic Vulnerabilities in Cancer; http://cbio.mskcc.org/cancergenomics/statius/ |
| KEGG_FATTY_ACID_METABOLISM KEGG_TRYPTOPHAN_METABOLISM KEGG_PYRUVATE_METABOLISM KEGG_PROPANOATE_METABOLISM KEGG_BUTANOATE_METABOLISM REACTOME_METABOLISM_OF_AMINO_ACIDS_AND_DERIVATIVES REACTOME_METABOLISM_OF_LIPIDS_AND_LIPOPROTEINS | |
| OMIM | |
| Orphanet | |
| Disease | KEGG Disease: ACAT1 |
| MedGen: ACAT1 (Human Medical Genetics with Condition) | |
| ClinVar: ACAT1 | |
| Phenotype | MGI: ACAT1 (International Mouse Phenotyping Consortium) |
| PhenomicDB: ACAT1 | |
| Mutations for ACAT1 |
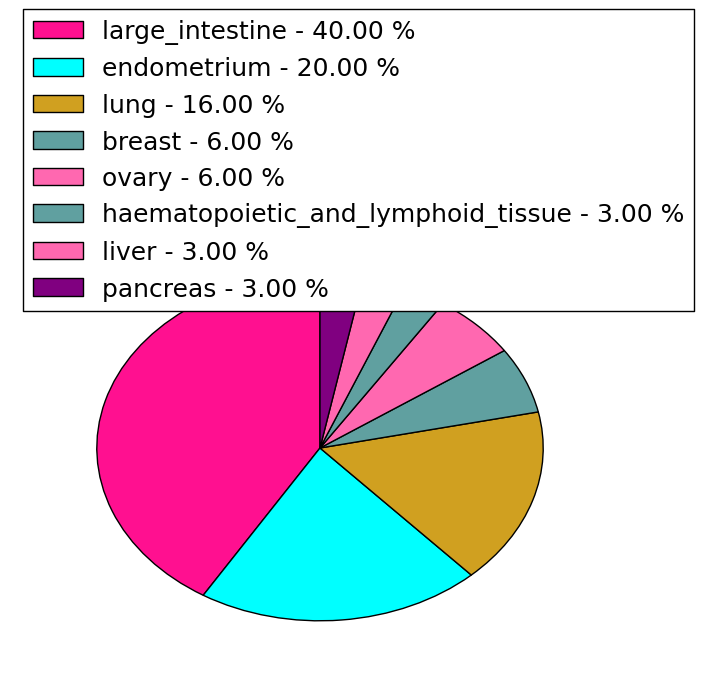
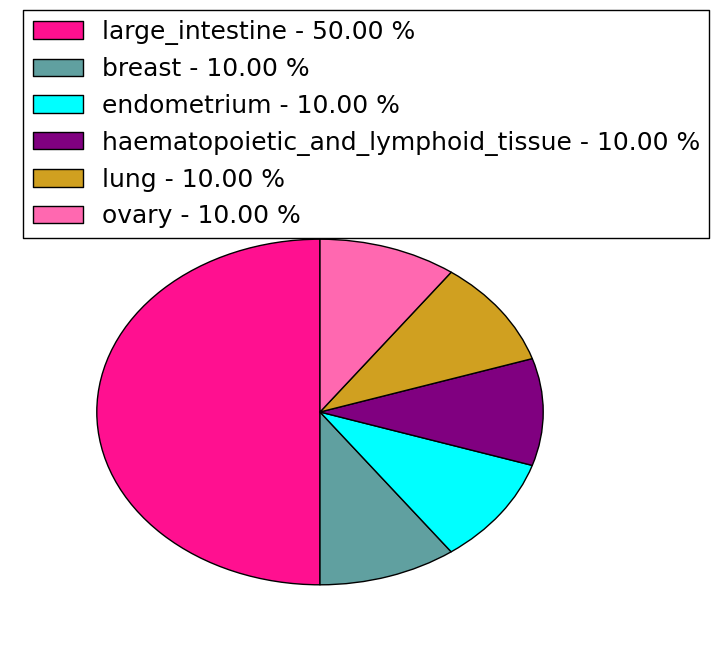
| * Under tables are showing count per each tissue to give us broad intuition about tissue specific mutation patterns.You can go to the detailed page for each mutation database's web site. |
| - Statistics for Tissue and Mutation type | Top |
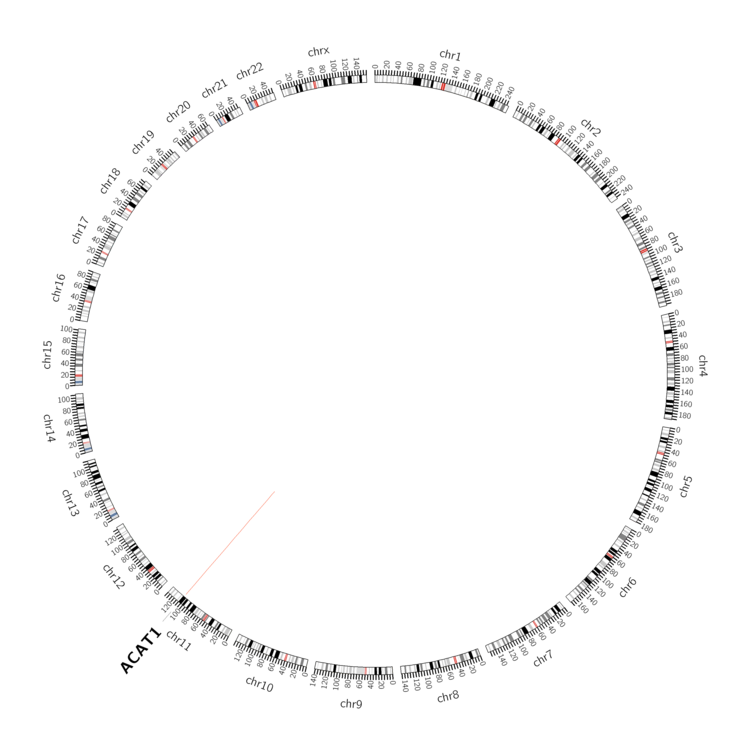 |
| - For Inter-chromosomal Variations |
| There's no inter-chromosomal structural variation. |
| - For Intra-chromosomal Variations |
| * Intra-chromosomal variantions includes 'intrachromosomal amplicon to amplicon', 'intrachromosomal amplicon to non-amplified dna', 'intrachromosomal deletion', 'intrachromosomal fold-back inversion', 'intrachromosomal inversion', 'intrachromosomal tandem duplication', 'Intrachromosomal unknown type', 'intrachromosomal with inverted orientation', 'intrachromosomal with non-inverted orientation'. |
 |
| Sample | Symbol_a | Chr_a | Start_a | End_a | Symbol_b | Chr_b | Start_b | End_b |
| ovary | ACAT1 | chr11 | 108004471 | 108004491 | ACAT1 | chr11 | 107999069 | 107999089 |
| cf) Tissue number; Tissue name (1;Breast, 2;Central_nervous_system, 3;Haematopoietic_and_lymphoid_tissue, 4;Large_intestine, 5;Liver, 6;Lung, 7;Ovary, 8;Pancreas, 9;Prostate, 10;Skin, 11;Soft_tissue, 12;Upper_aerodigestive_tract) |
| * From mRNA Sanger sequences, Chitars2.0 arranged chimeric transcripts. This table shows ACAT1 related fusion information. |
| ID | Head Gene | Tail Gene | Accession | Gene_a | qStart_a | qEnd_a | Chromosome_a | tStart_a | tEnd_a | Gene_a | qStart_a | qEnd_a | Chromosome_a | tStart_a | tEnd_a |
| AK024206 | ACAT1 | 1 | 748 | 11 | 108007716 | 108008511 | VPRBP | 743 | 762 | 3 | 51496761 | 51496780 | |
| Top |
| There's no copy number variation information in COSMIC data for this gene. |
| Top |
|
 |
| Top |
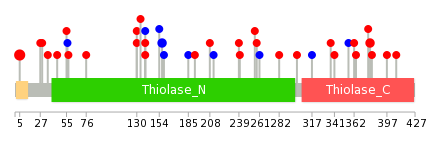
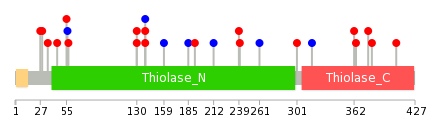
| Stat. for Non-Synonymous SNVs (# total SNVs=30) | (# total SNVs=10) |
 |  |
(# total SNVs=1) | (# total SNVs=1) |
 |  |
| Top |
| * When you move the cursor on each content, you can see more deailed mutation information on the Tooltip. Those are primary_site,primary_histology,mutation(aa),pubmedID. |
| GRCh37 position | Mutation(aa) | Unique sampleID count |
| chr11:107992346-107992346 | p.A5P | 5 |
| chr11:108009660-108009660 | p.S157S | 2 |
| chr11:108017059-108017059 | p.G379A | 2 |
| chr11:108012373-108012373 | p.R258C | 1 |
| chr11:108004595-108004595 | p.G57C | 1 |
| chr11:108017053-108017053 | p.N377T | 1 |
| chr11:108009666-108009666 | p.V159V | 1 |
| chr11:108012384-108012384 | p.F261F | 1 |
| chr11:108004653-108004653 | p.I76N | 1 |
| chr11:108009744-108009744 | p.T185T | 1 |
| Top |
|
 |
| Point Mutation/ Tissue ID | 1 | 2 | 3 | 4 | 5 | 6 | 7 | 8 | 9 | 10 | 11 | 12 | 13 | 14 | 15 | 16 | 17 | 18 | 19 | 20 |
| # sample | 1 | 2 | 6 | 1 | 2 | 2 | 1 | 3 | 4 | |||||||||||
| # mutation | 1 | 2 | 7 | 1 | 2 | 3 | 1 | 3 | 6 | |||||||||||
| nonsynonymous SNV | 2 | 4 | 2 | 2 | 1 | 3 | 5 | |||||||||||||
| synonymous SNV | 1 | 3 | 1 | 1 | 1 |
| cf) Tissue ID; Tissue type (1; BLCA[Bladder Urothelial Carcinoma], 2; BRCA[Breast invasive carcinoma], 3; CESC[Cervical squamous cell carcinoma and endocervical adenocarcinoma], 4; COAD[Colon adenocarcinoma], 5; GBM[Glioblastoma multiforme], 6; Glioma Low Grade, 7; HNSC[Head and Neck squamous cell carcinoma], 8; KICH[Kidney Chromophobe], 9; KIRC[Kidney renal clear cell carcinoma], 10; KIRP[Kidney renal papillary cell carcinoma], 11; LAML[Acute Myeloid Leukemia], 12; LUAD[Lung adenocarcinoma], 13; LUSC[Lung squamous cell carcinoma], 14; OV[Ovarian serous cystadenocarcinoma ], 15; PAAD[Pancreatic adenocarcinoma], 16; PRAD[Prostate adenocarcinoma], 17; SKCM[Skin Cutaneous Melanoma], 18:STAD[Stomach adenocarcinoma], 19:THCA[Thyroid carcinoma], 20:UCEC[Uterine Corpus Endometrial Carcinoma]) |
| Top |
| * We represented just top 10 SNVs. When you move the cursor on each content, you can see more deailed mutation information on the Tooltip. Those are primary_site, primary_histology, mutation(aa), pubmedID. |
| Genomic Position | Mutation(aa) | Unique sampleID count |
| chr11:108012384 | p.V159V | 1 |
| chr11:108005924 | p.T185T | 1 |
| chr11:108013239 | p.H192N | 1 |
| chr11:108005949 | p.D212D | 1 |
| chr11:108014720 | p.R27I | 1 |
| chr11:108005950 | p.T239A | 1 |
| chr11:108017007 | p.V29L | 1 |
| chr11:108002641 | p.V240D | 1 |
| chr11:108005951 | p.S35L | 1 |
| chr11:108017014 | p.F261F | 1 |
| * Copy number data were extracted from TCGA using R package TCGA-Assembler. The URLs of all public data files on TCGA DCC data server were gathered on Jan-05-2015. Function ProcessCNAData in TCGA-Assembler package was used to obtain gene-level copy number value which is calculated as the average copy number of the genomic region of a gene. |
 |
| cf) Tissue ID[Tissue type]: BLCA[Bladder Urothelial Carcinoma], BRCA[Breast invasive carcinoma], CESC[Cervical squamous cell carcinoma and endocervical adenocarcinoma], COAD[Colon adenocarcinoma], GBM[Glioblastoma multiforme], Glioma Low Grade, HNSC[Head and Neck squamous cell carcinoma], KICH[Kidney Chromophobe], KIRC[Kidney renal clear cell carcinoma], KIRP[Kidney renal papillary cell carcinoma], LAML[Acute Myeloid Leukemia], LUAD[Lung adenocarcinoma], LUSC[Lung squamous cell carcinoma], OV[Ovarian serous cystadenocarcinoma ], PAAD[Pancreatic adenocarcinoma], PRAD[Prostate adenocarcinoma], SKCM[Skin Cutaneous Melanoma], STAD[Stomach adenocarcinoma], THCA[Thyroid carcinoma], UCEC[Uterine Corpus Endometrial Carcinoma] |
| Top |
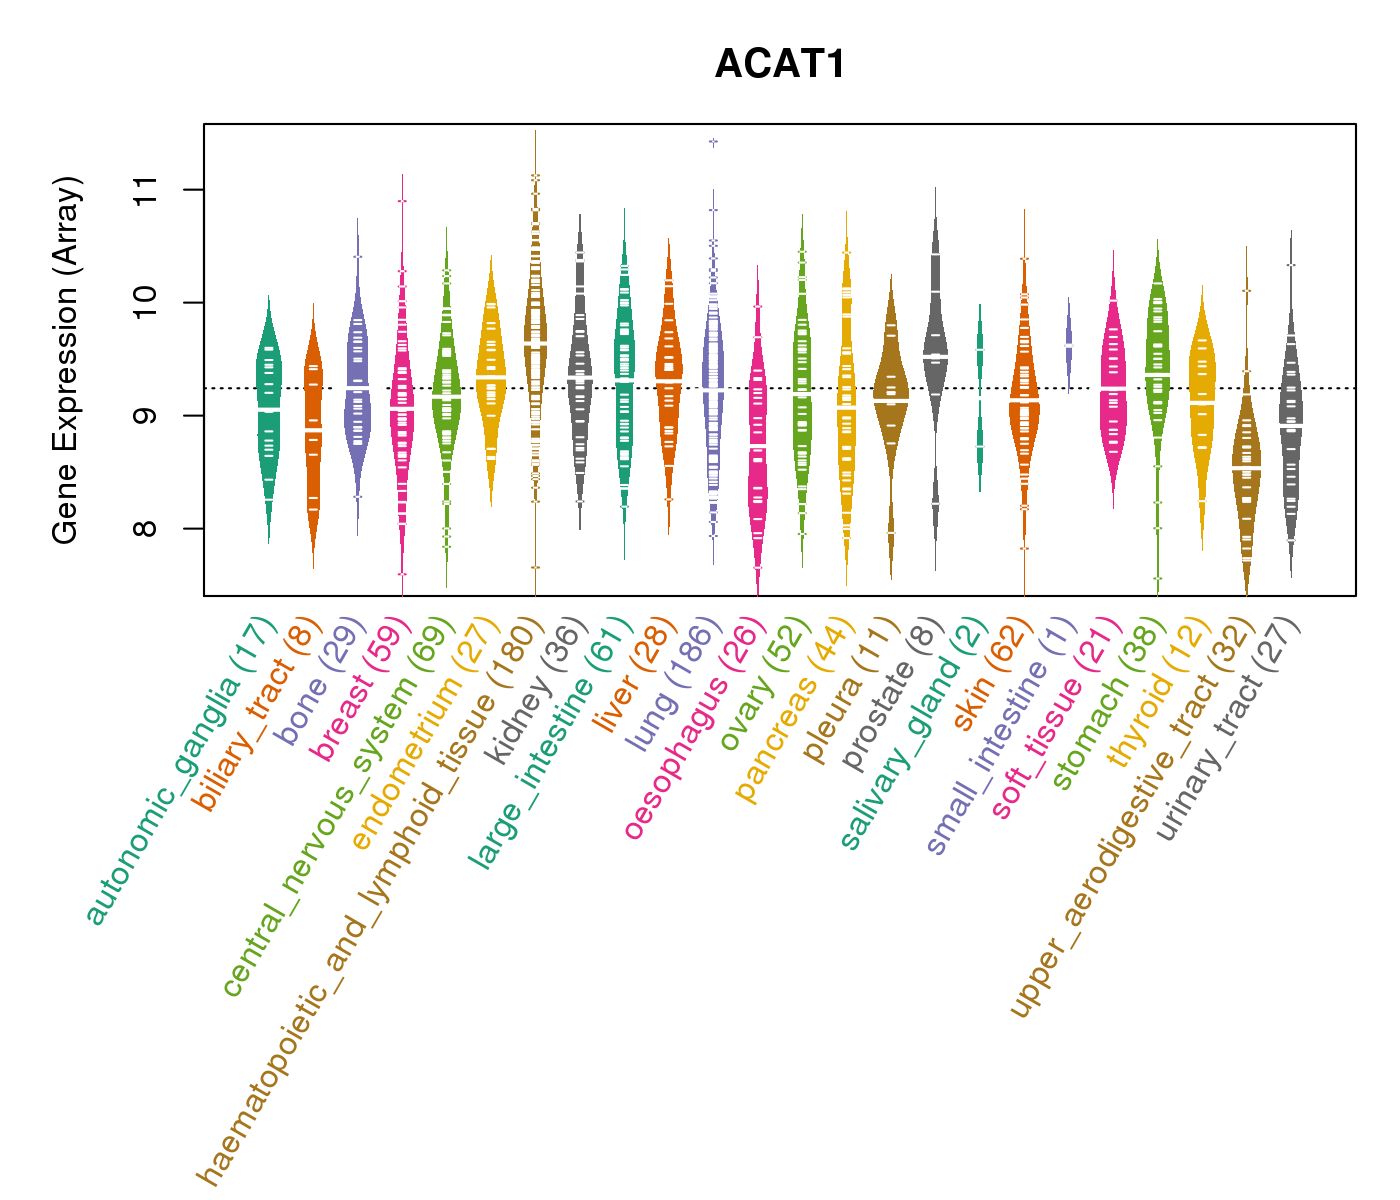
| Gene Expression for ACAT1 |
| * CCLE gene expression data were extracted from CCLE_Expression_Entrez_2012-10-18.res: Gene-centric RMA-normalized mRNA expression data. |
 |
| * Normalized gene expression data of RNASeqV2 was extracted from TCGA using R package TCGA-Assembler. The URLs of all public data files on TCGA DCC data server were gathered at Jan-05-2015. Only eight cancer types have enough normal control samples for differential expression analysis. (t test, adjusted p<0.05 (using Benjamini-Hochberg FDR)) |
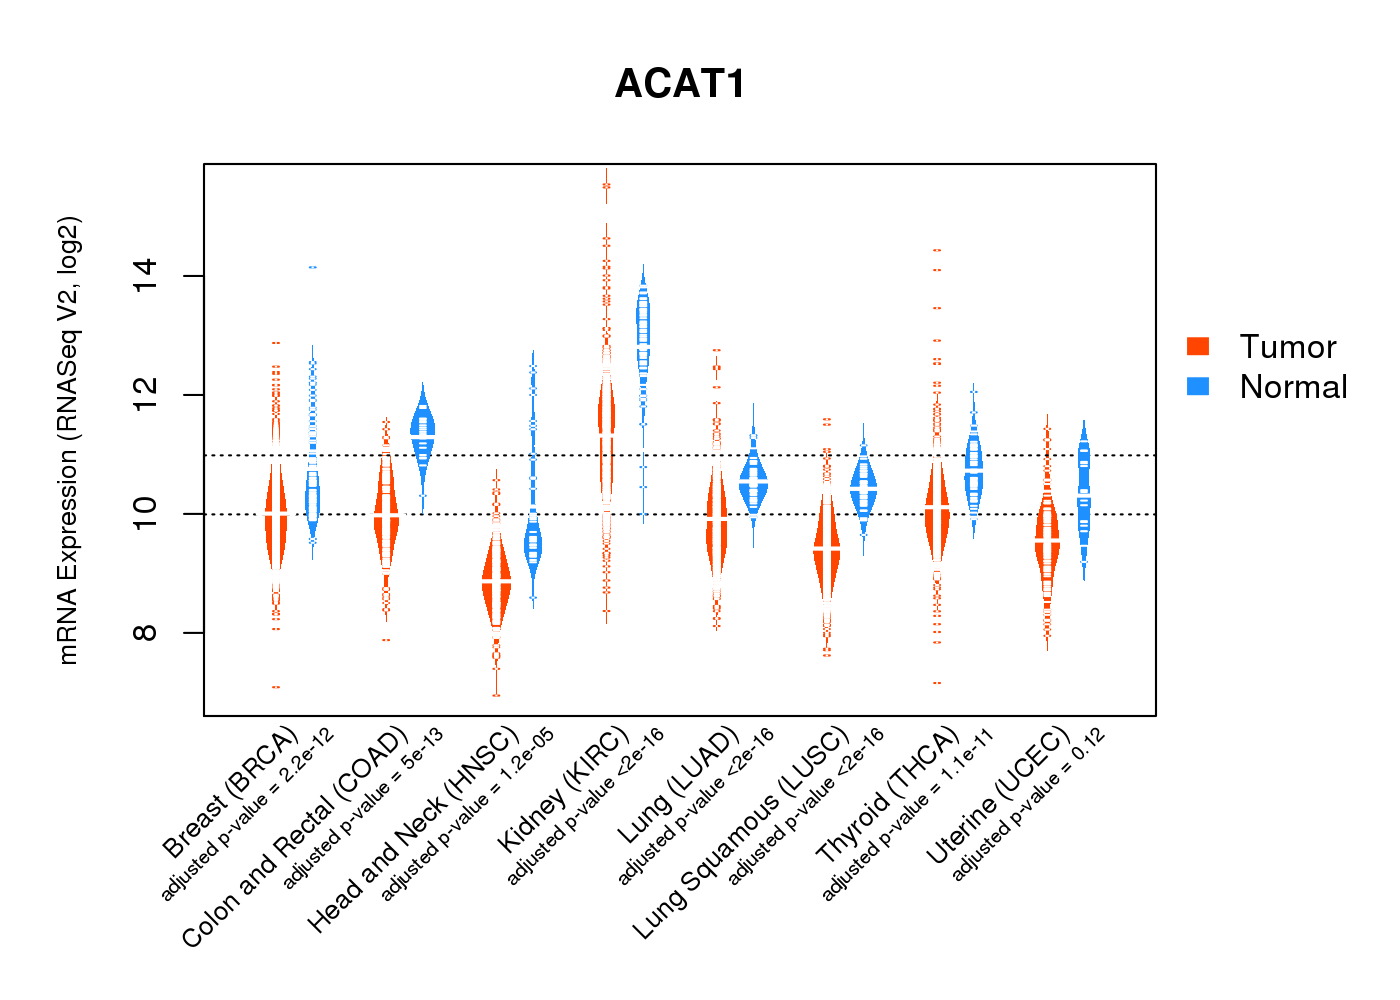 |
| Top |
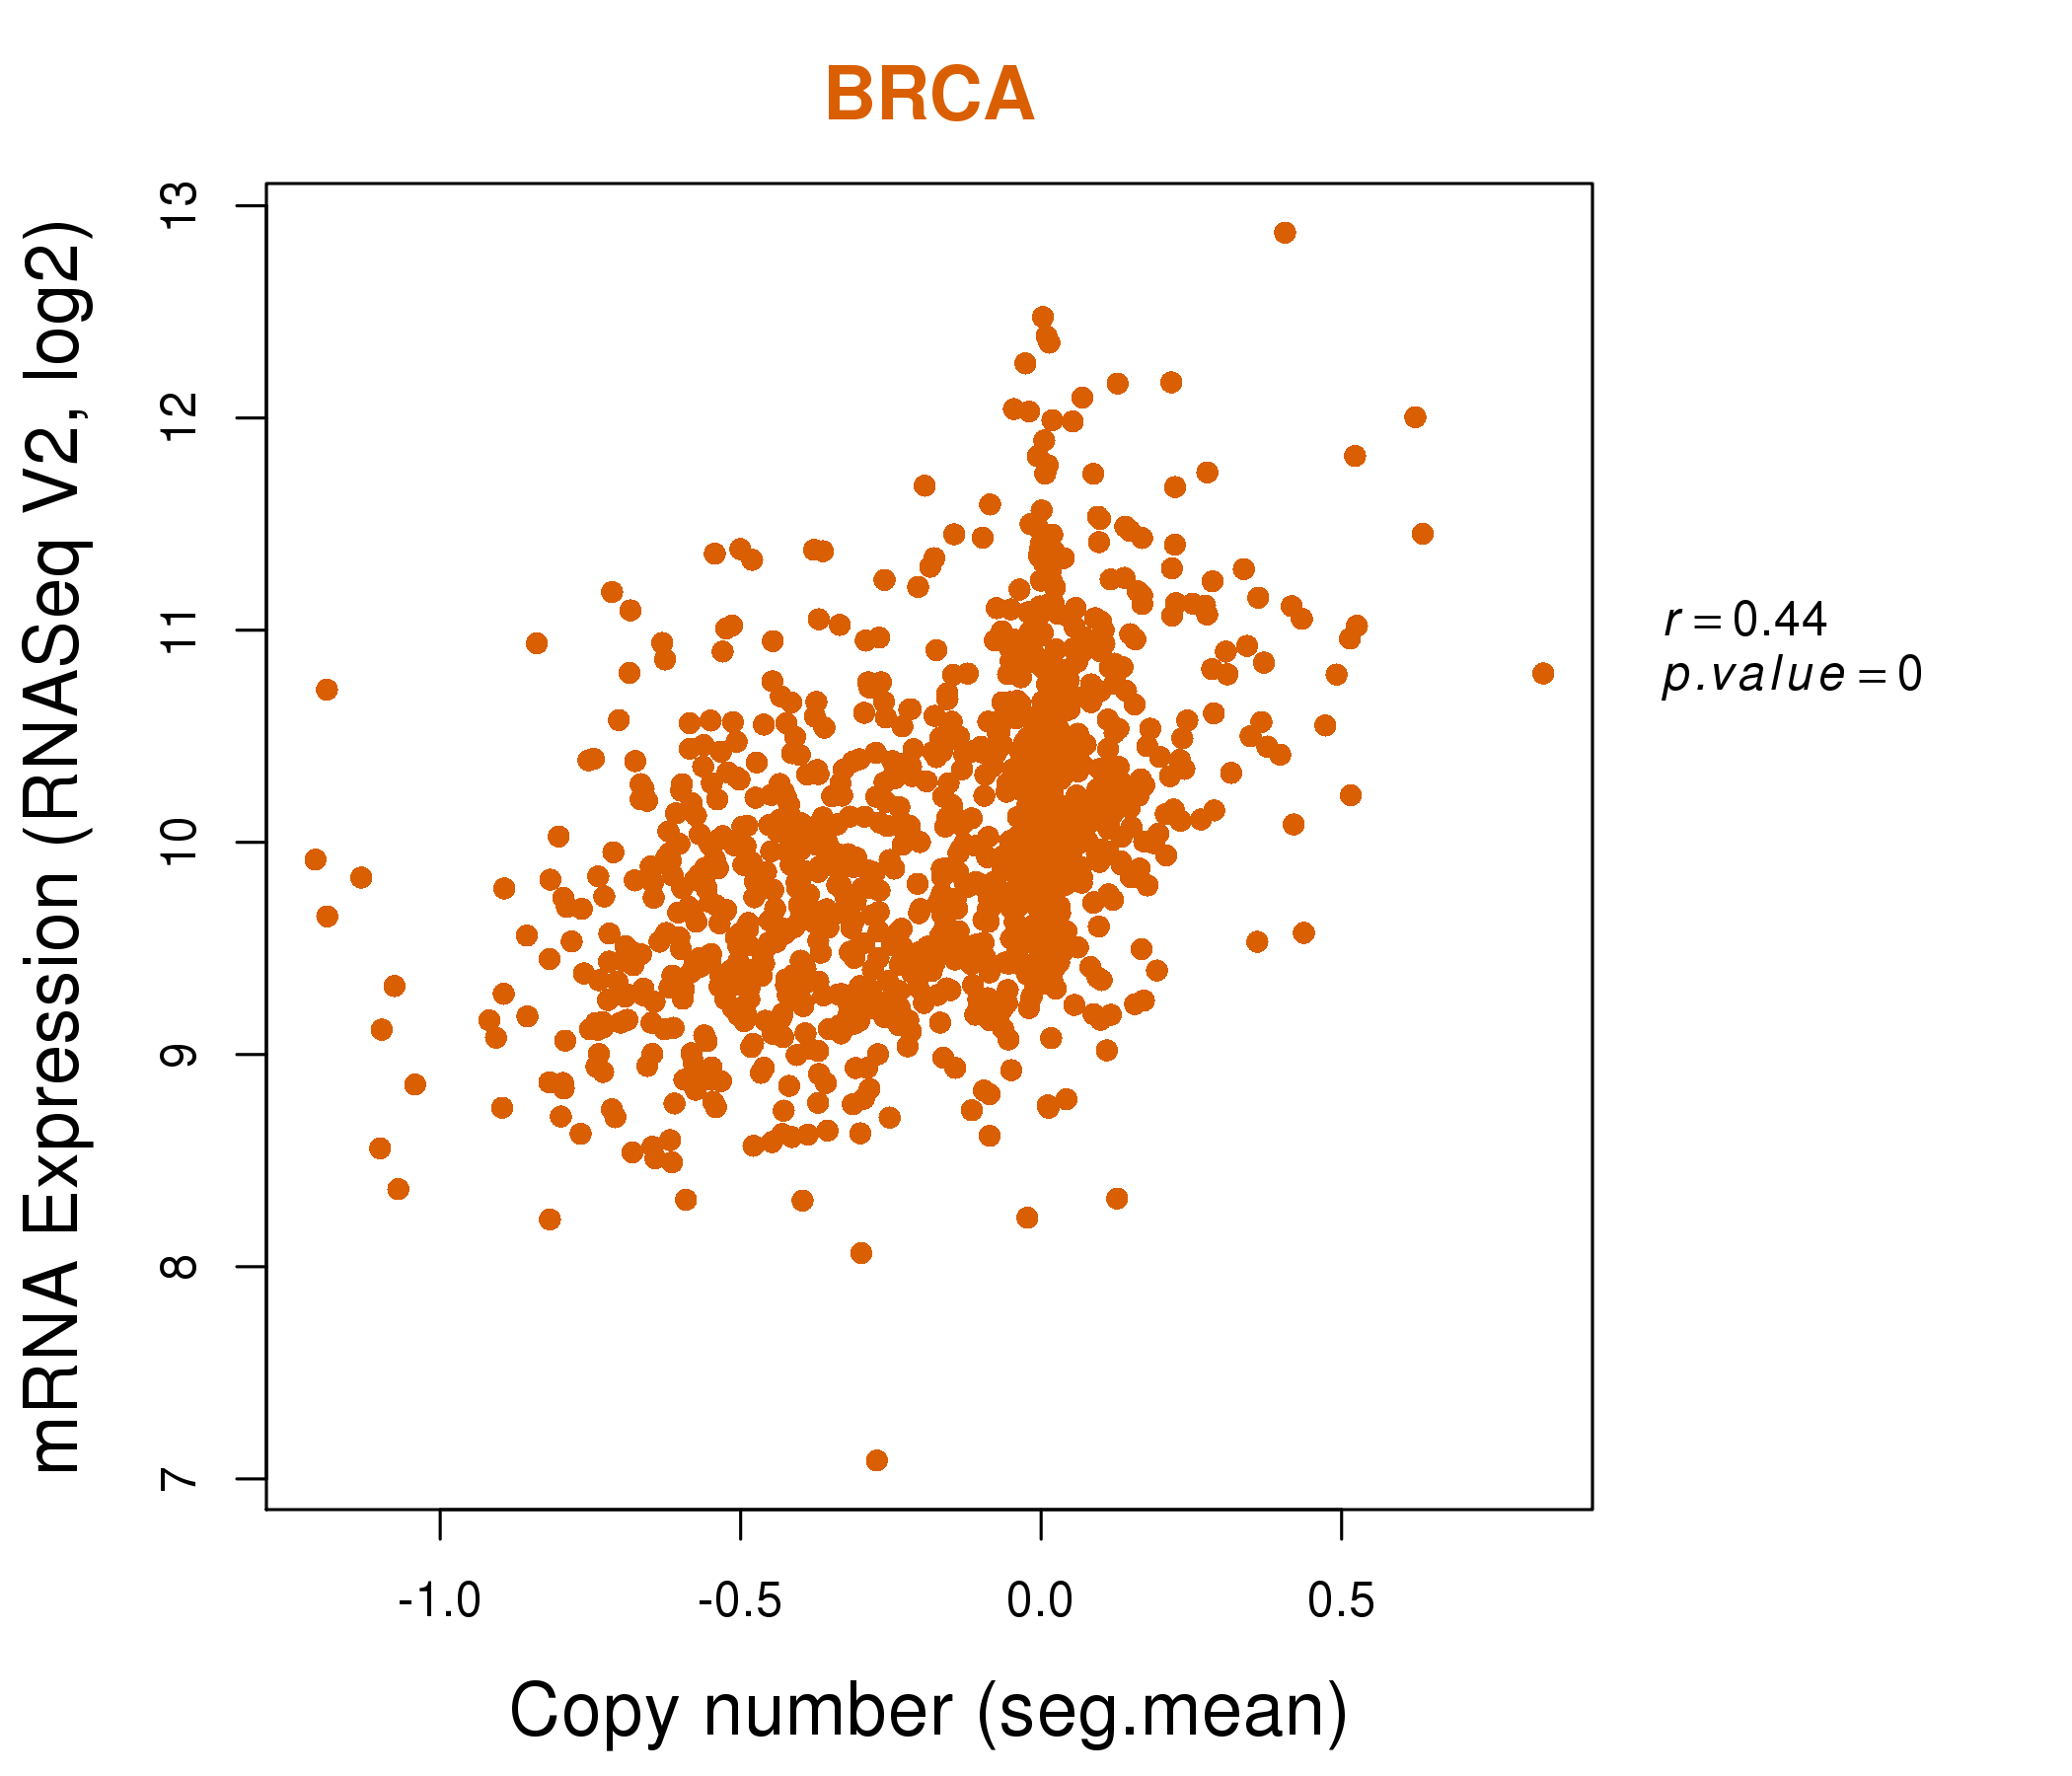
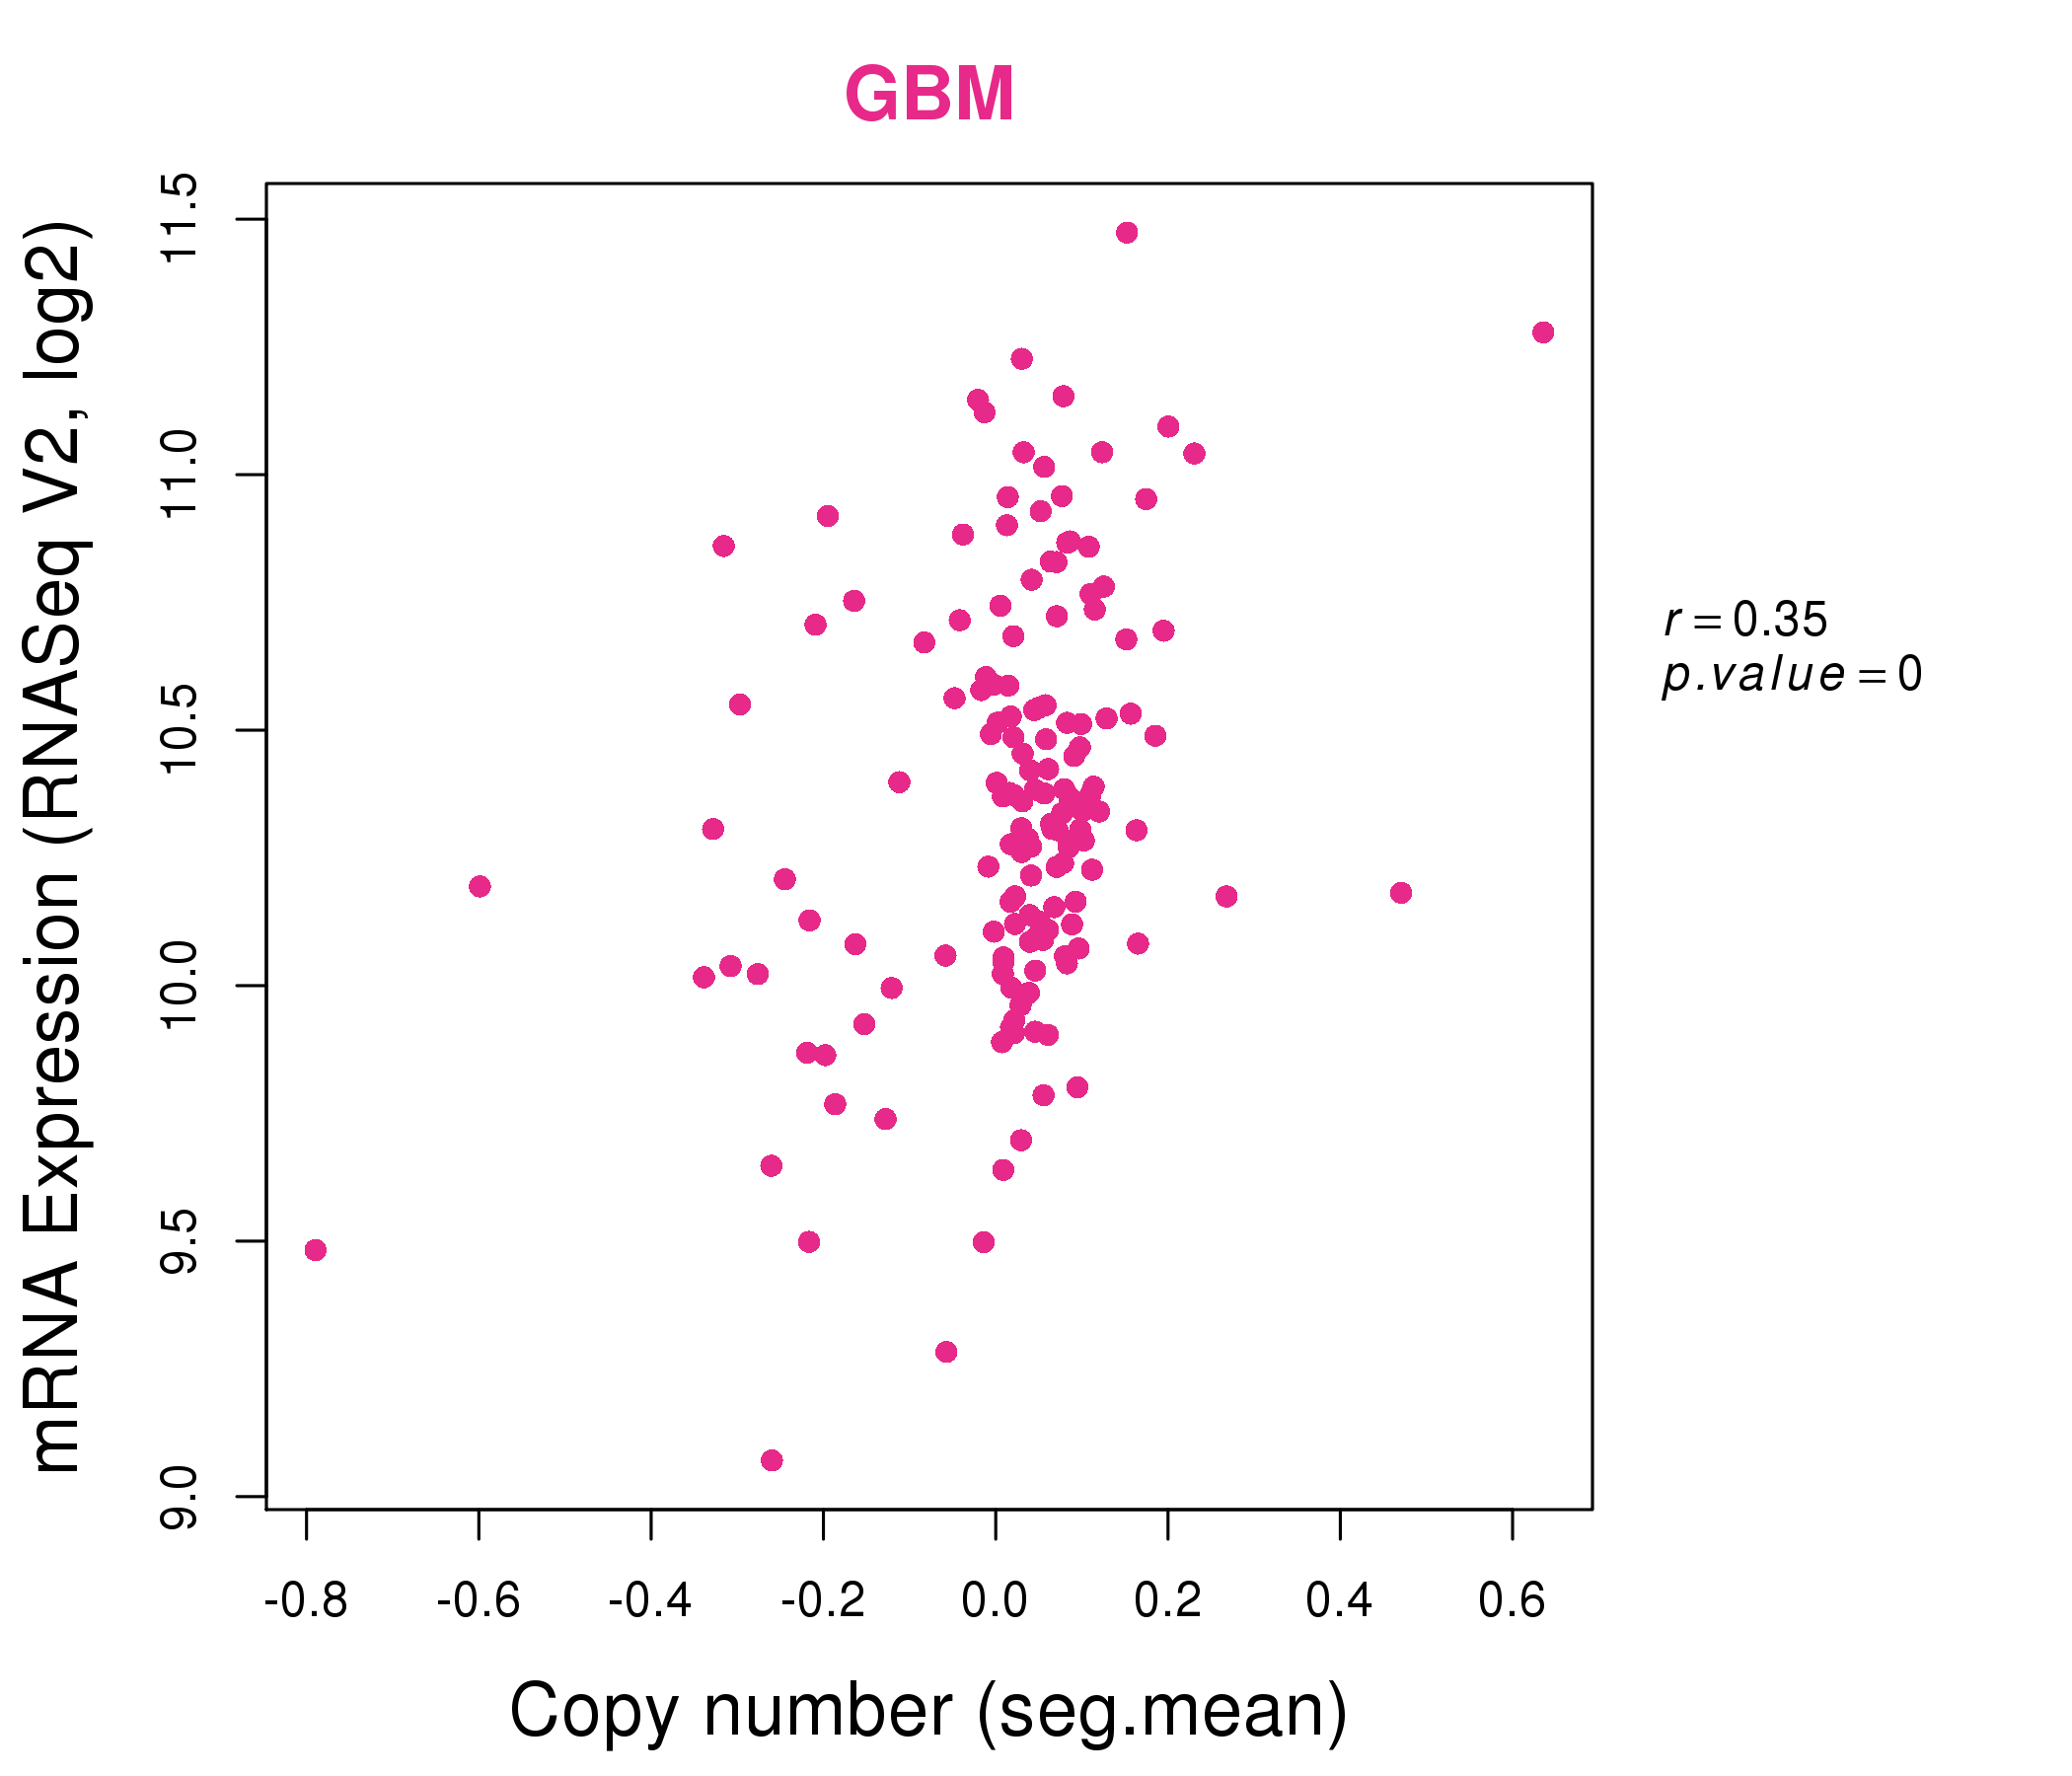
| * This plots show the correlation between CNV and gene expression. |
: Open all plots for all cancer types
 |
|
 |
|
| Top |
| Gene-Gene Network Information |
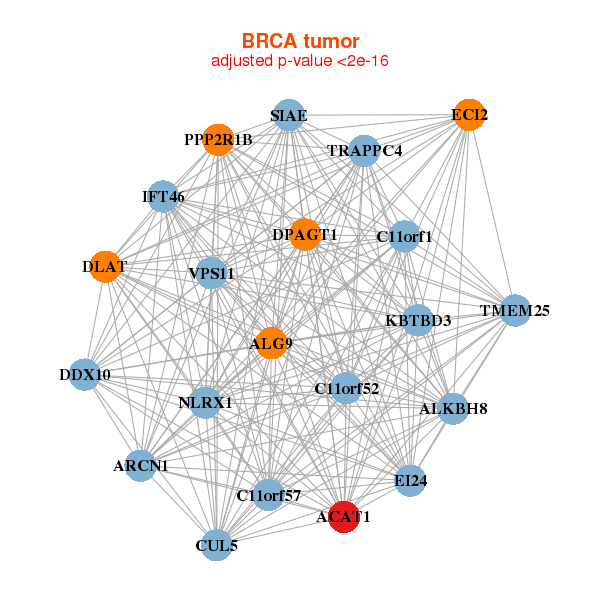
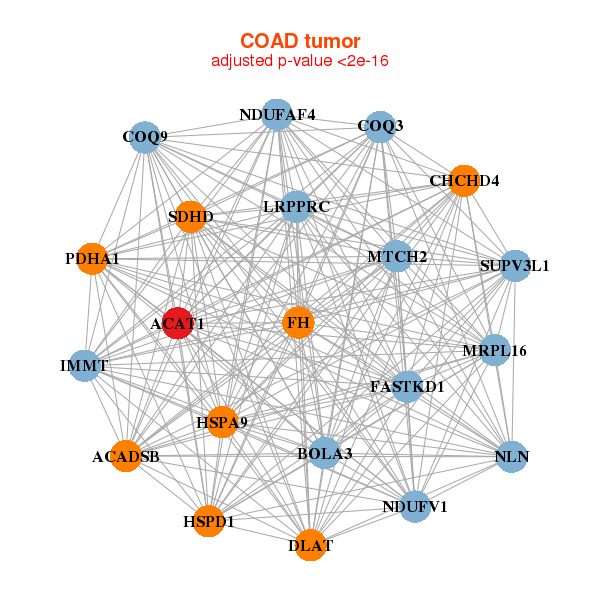
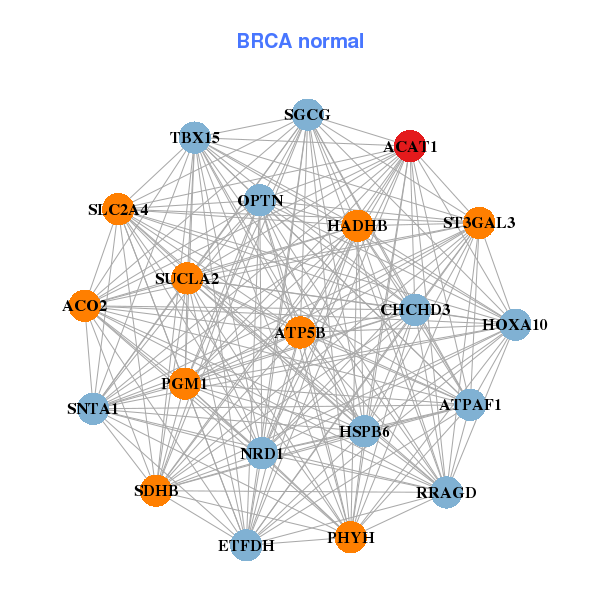
| * Co-Expression network figures were drawn using R package igraph. Only the top 20 genes with the highest correlations were shown. Red circle: input gene, orange circle: cell metabolism gene, sky circle: other gene |
: Open all plots for all cancer types
 |
| ||||
| ACAT1,ALG9,ALKBH8,ARCN1,C11orf1,C11orf52,C11orf57, CUL5,DDX10,DLAT,DPAGT1,EI24,IFT46,KBTBD3, NLRX1,ECI2,PPP2R1B,SIAE,TMEM25,TRAPPC4,VPS11 | ACAT1,ACO2,ATP5B,ATPAF1,CHCHD3,ETFDH,HADHB, HOXA10,HSPB6,NRD1,OPTN,PGM1,PHYH,RRAGD, SDHB,SGCG,SLC2A4,SNTA1,ST3GAL3,SUCLA2,TBX15 | ||||
 |
| ||||
| ACADSB,ACAT1,BOLA3,CHCHD4,COQ3,COQ9,DLAT, FASTKD1,FH,HSPA9,HSPD1,IMMT,LRPPRC,MRPL16, MTCH2,NDUFAF4,NDUFV1,NLN,PDHA1,SDHD,SUPV3L1 | ACAA2,ACAT1,BSG,BTBD3,CA2,CD24,CPT2, ETHE1,GHITM,LCMT1,PGM1,PKIB,PPARG,SDHA, SLC16A1,TMEM171,TSPAN7,TST,UBE2D2,UGT1A10,WDR78 |
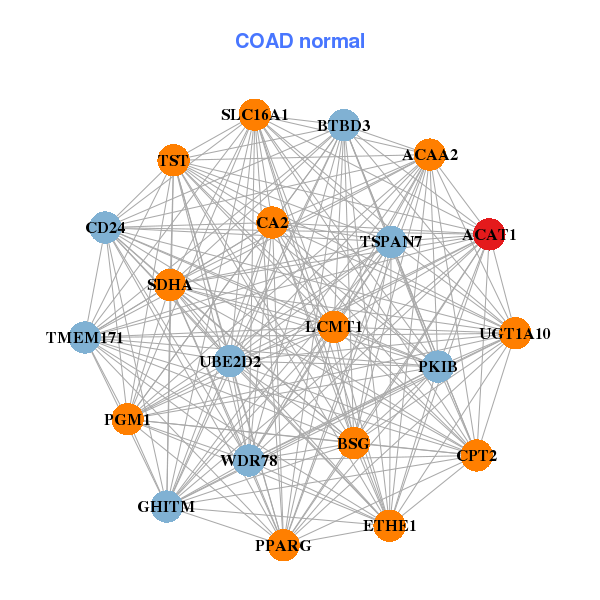
| * Co-Expression network figures were drawn using R package igraph. Only the top 20 genes with the highest correlations were shown. Red circle: input gene, orange circle: cell metabolism gene, sky circle: other gene |
: Open all plots for all cancer types
| Top |
: Open all interacting genes' information including KEGG pathway for all interacting genes from DAVID
| Top |
| Pharmacological Information for ACAT1 |
| DB Category | DB Name | DB's ID and Url link |
| * Gene Centered Interaction Network. |
 |
| * Drug Centered Interaction Network. |
| DrugBank ID | Target Name | Drug Groups | Generic Name | Drug Centered Network | Drug Structure |
| DB00795 | acetyl-CoA acetyltransferase 1 | approved | Sulfasalazine | 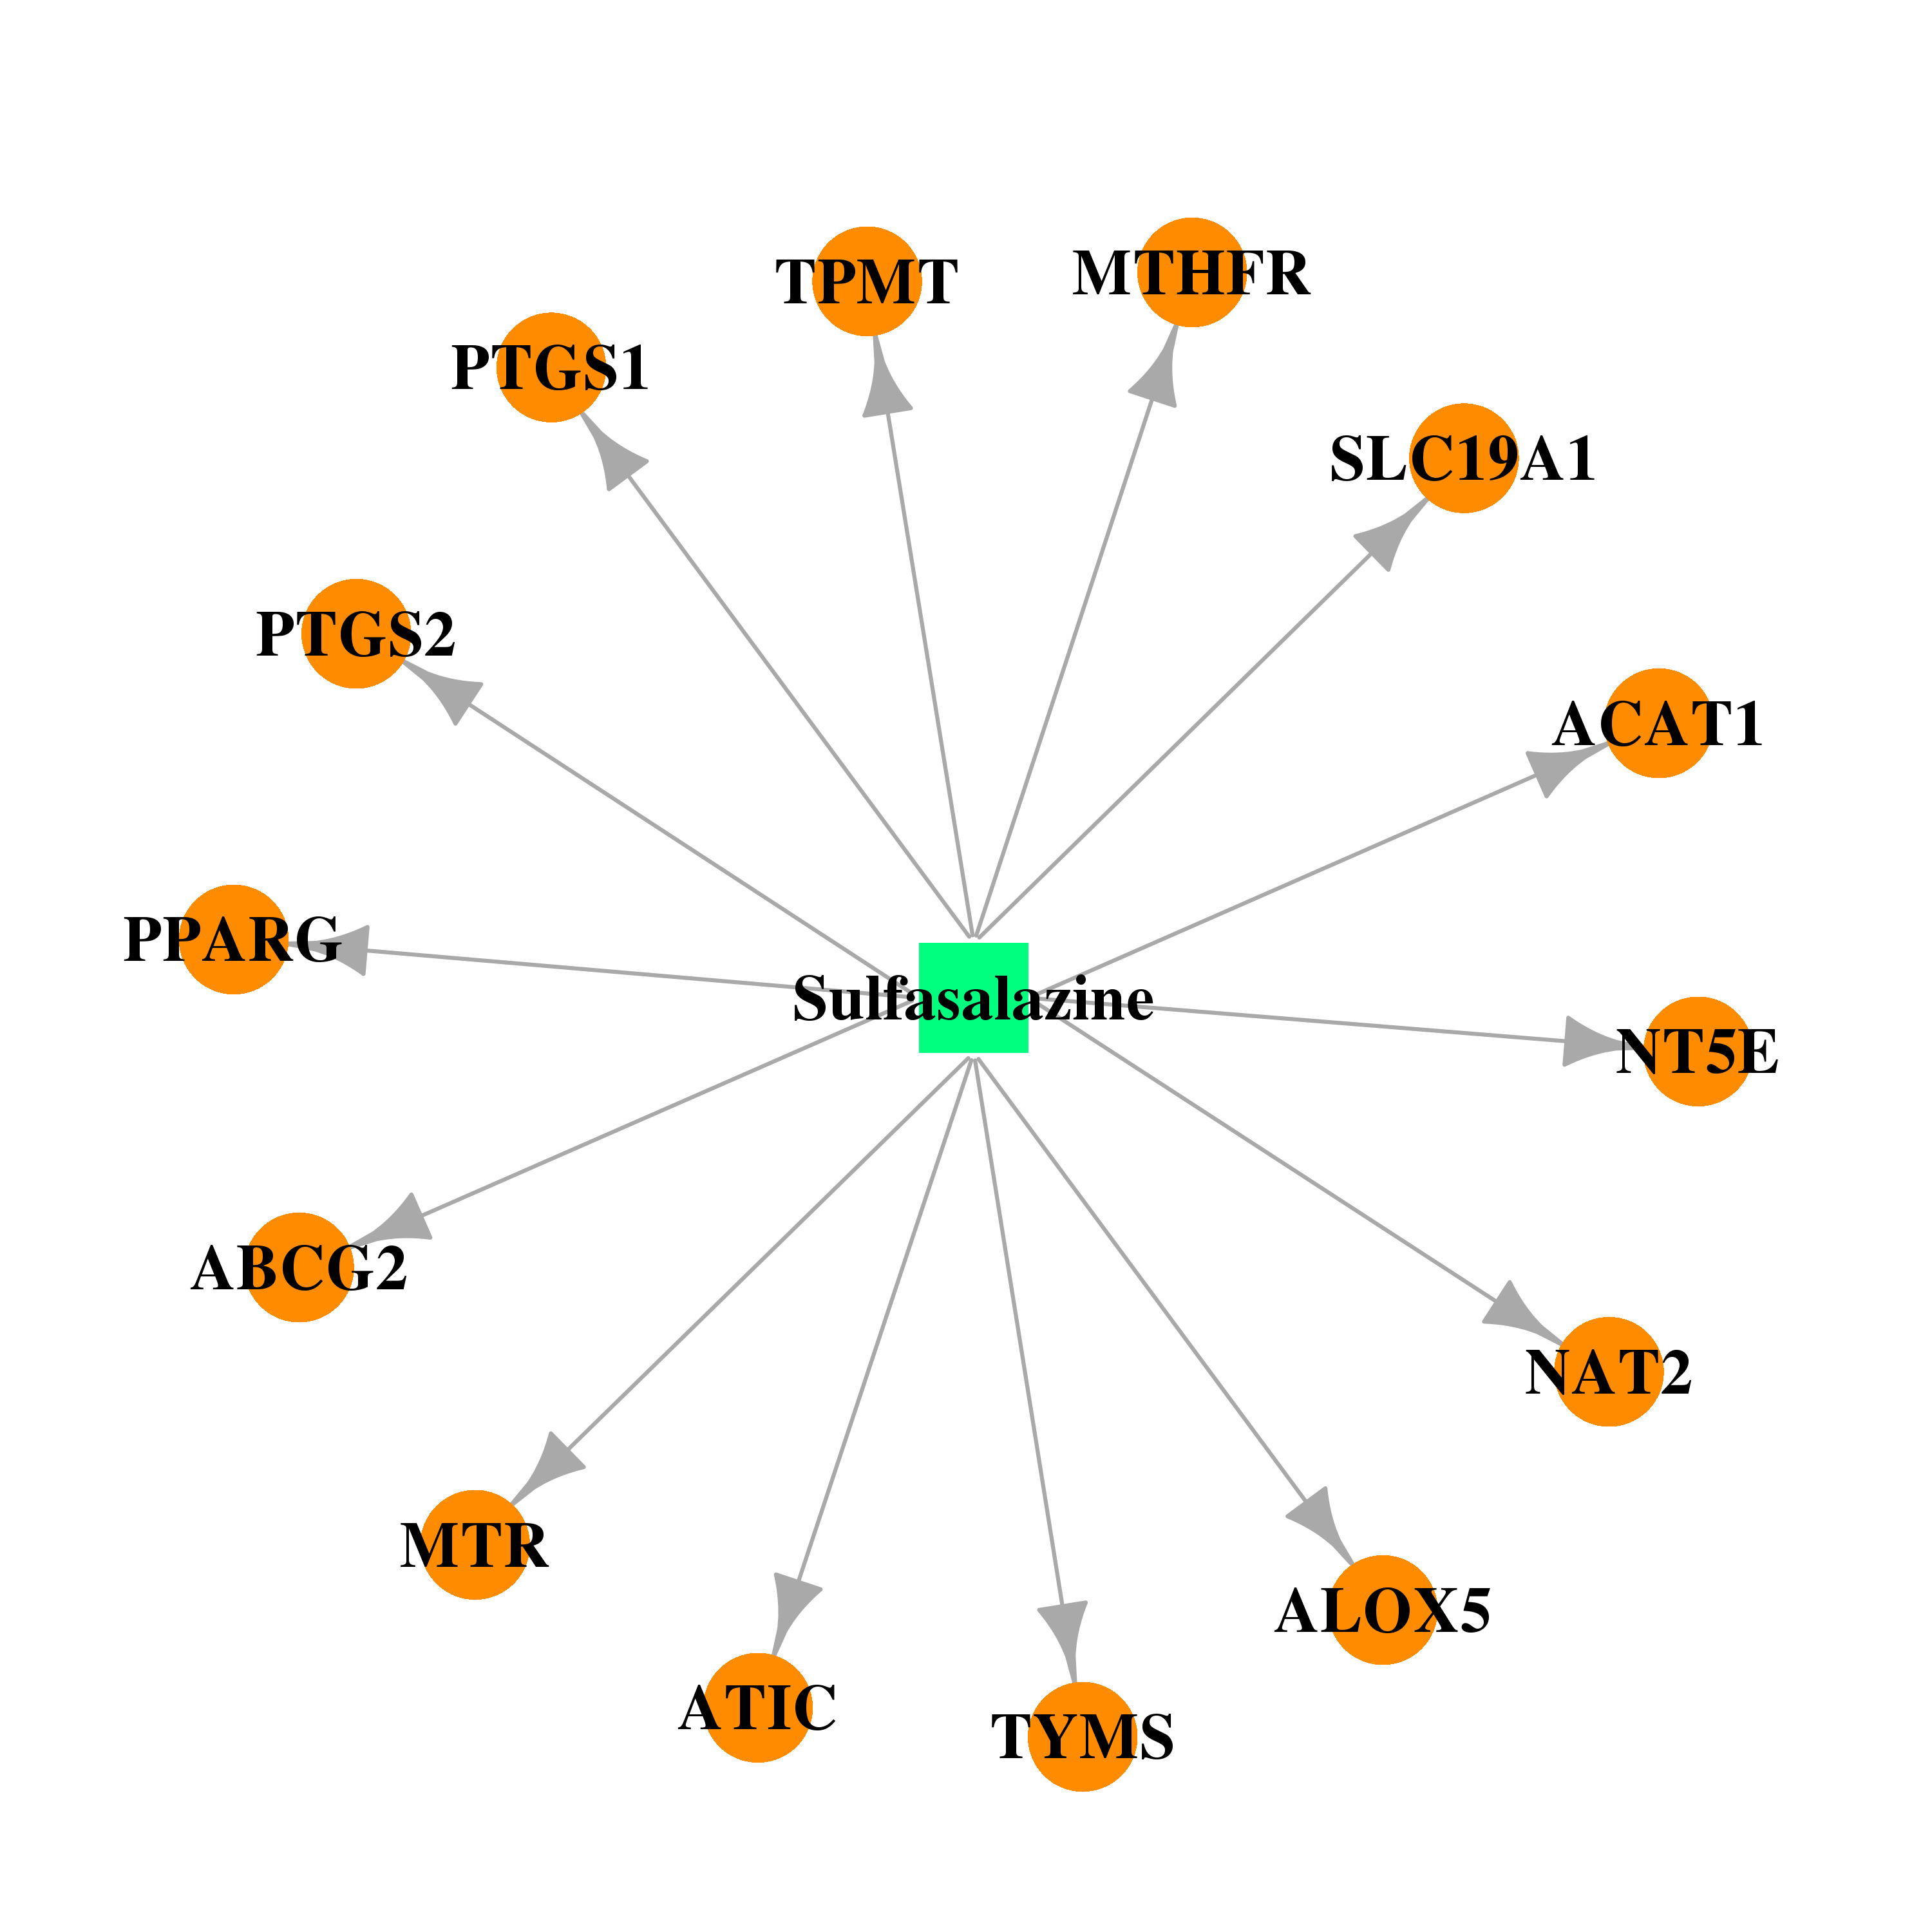 | 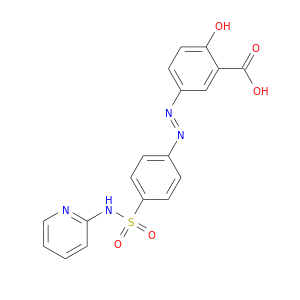 |
| Top |
| Cross referenced IDs for ACAT1 |
| * We obtained these cross-references from Uniprot database. It covers 150 different DBs, 18 categories. http://www.uniprot.org/help/cross_references_section |
: Open all cross reference information
|
Copyright © 2016-Present - The Univsersity of Texas Health Science Center at Houston @ |