|
||||||||||||||||||||||||||||||||||||||||||||||||||||||||||||||||||||||||||||||||||||||||||||||||||||||||||||||||||||||||||||||||||||||||||||||||||||||||||||||||||||||||||||||||||||||||||||||||||||||||||||||||||||||||||||||||||||||||||||||||||||||||||||||||||||||||||||||||||||||||||||||||||||||||||||||||||||||||||
| |
| Phenotypic Information (metabolism pathway, cancer, disease, phenome) |
| |
| |
| Gene-Gene Network Information: Co-Expression Network, Interacting Genes & KEGG |
| |
|


| Gene Summary for KIFC3 |
| Basic gene info. | Gene symbol | KIFC3 |
| Gene name | kinesin family member C3 | |
| Synonyms | - | |
| Cytomap | UCSC genome browser: 16q13-q21 | |
| Genomic location | chr16 :57792128-57831929 | |
| Type of gene | protein-coding | |
| RefGenes | NM_001130099.1, NM_001130100.1,NM_005550.3, | |
| Ensembl id | ENSG00000269180 | |
| Description | kinesin-like protein KIFC3 | |
| Modification date | 20141207 | |
| dbXrefs | MIM : 604535 | |
| HGNC : HGNC | ||
| Ensembl : ENSG00000140859 | ||
| HPRD : 05171 | ||
| Vega : OTTHUMG00000133455 | ||
| Protein | UniProt: go to UniProt's Cross Reference DB Table | |
| Expression | CleanEX: HS_KIFC3 | |
| BioGPS: 3801 | ||
| Gene Expression Atlas: ENSG00000269180 | ||
| The Human Protein Atlas: ENSG00000269180 | ||
| Pathway | NCI Pathway Interaction Database: KIFC3 | |
| KEGG: KIFC3 | ||
| REACTOME: KIFC3 | ||
| ConsensusPathDB | ||
| Pathway Commons: KIFC3 | ||
| Metabolism | MetaCyc: KIFC3 | |
| HUMANCyc: KIFC3 | ||
| Regulation | Ensembl's Regulation: ENSG00000269180 | |
| miRBase: chr16 :57,792,128-57,831,929 | ||
| TargetScan: NM_001130099 | ||
| cisRED: ENSG00000269180 | ||
| Context | iHOP: KIFC3 | |
| cancer metabolism search in PubMed: KIFC3 | ||
| UCL Cancer Institute: KIFC3 | ||
| Assigned class in ccmGDB | C | |
| Top |
| Phenotypic Information for KIFC3(metabolism pathway, cancer, disease, phenome) |
| Cancer | CGAP: KIFC3 |
| Familial Cancer Database: KIFC3 | |
| * This gene is included in those cancer gene databases. |
|
|
|
|
|
| . | ||||||||||||||||||||||||||||||||||||||||||||||||||||||||||||||||||||||||||||||||||||||||||||||||||||||||||||||||||||||||||||||||||||||||||||||||||||||||||||||||||||||||||||||||||||||||||||||||||||||||||||||||||||||||||||||||||||||||||||||||||||||||||||||||||||||||||||||||||||||||||||||||||||||||||||||||||||
Oncogene 1 | Significant driver gene in | |||||||||||||||||||||||||||||||||||||||||||||||||||||||||||||||||||||||||||||||||||||||||||||||||||||||||||||||||||||||||||||||||||||||||||||||||||||||||||||||||||||||||||||||||||||||||||||||||||||||||||||||||||||||||||||||||||||||||||||||||||||||||||||||||||||||||||||||||||||||||||||||||||||||||||||||||||||||||
| cf) number; DB name 1 Oncogene; http://nar.oxfordjournals.org/content/35/suppl_1/D721.long, 2 Tumor Suppressor gene; https://bioinfo.uth.edu/TSGene/, 3 Cancer Gene Census; http://www.nature.com/nrc/journal/v4/n3/abs/nrc1299.html, 4 CancerGenes; http://nar.oxfordjournals.org/content/35/suppl_1/D721.long, 5 Network of Cancer Gene; http://ncg.kcl.ac.uk/index.php, 1Therapeutic Vulnerabilities in Cancer; http://cbio.mskcc.org/cancergenomics/statius/ |
| REACTOME_METABOLISM_OF_PROTEINS | |
| OMIM | |
| Orphanet | |
| Disease | KEGG Disease: KIFC3 |
| MedGen: KIFC3 (Human Medical Genetics with Condition) | |
| ClinVar: KIFC3 | |
| Phenotype | MGI: KIFC3 (International Mouse Phenotyping Consortium) |
| PhenomicDB: KIFC3 | |
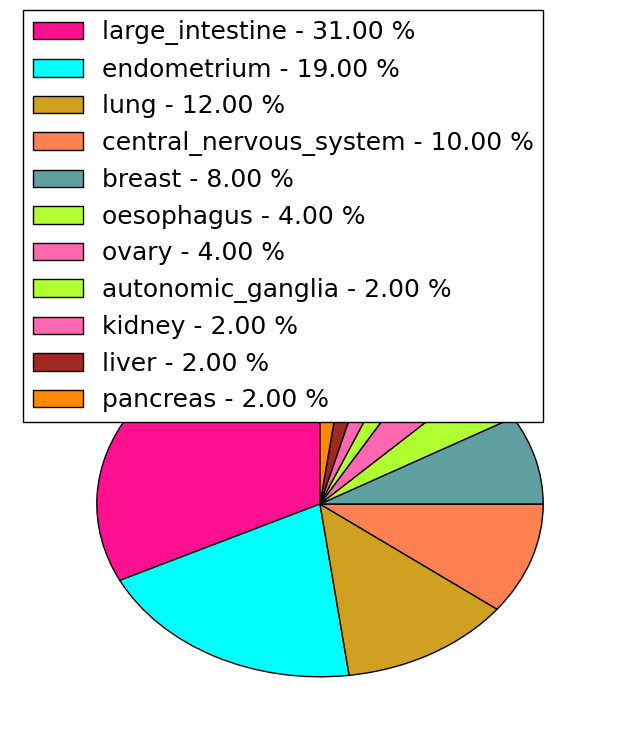
| Mutations for KIFC3 |
| * Under tables are showing count per each tissue to give us broad intuition about tissue specific mutation patterns.You can go to the detailed page for each mutation database's web site. |
| - Statistics for Tissue and Mutation type | Top |
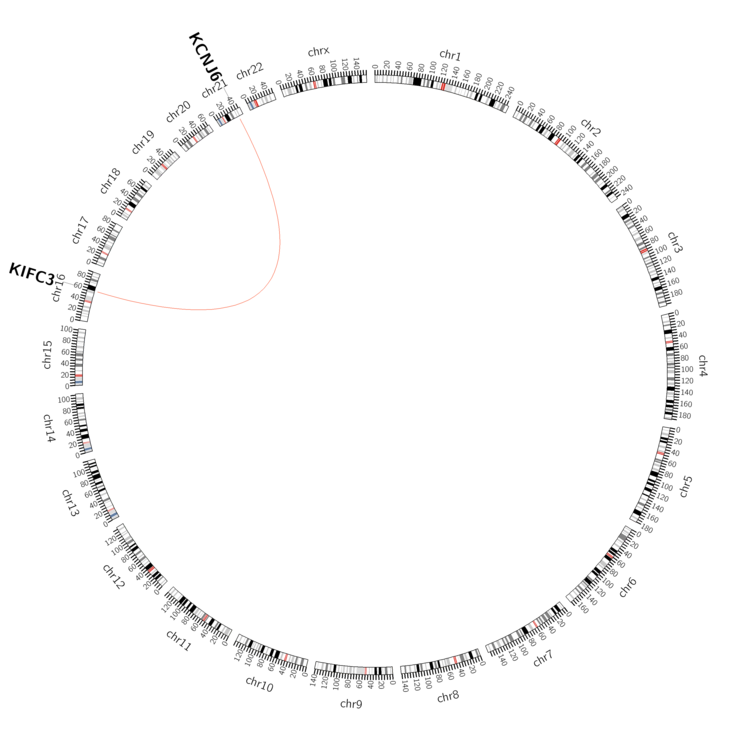 |
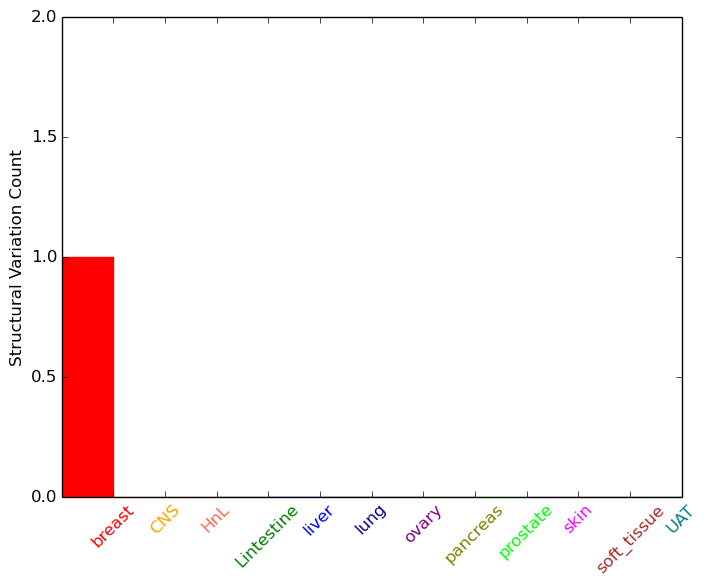
| - For Inter-chromosomal Variations |
| * Inter-chromosomal variantions includes 'interchromosomal amplicon to amplicon', 'interchromosomal amplicon to non-amplified dna', 'interchromosomal insertion', 'Interchromosomal unknown type'. |
 |
| - For Intra-chromosomal Variations |
| There's no intra-chromosomal structural variation. |
| Sample | Symbol_a | Chr_a | Start_a | End_a | Symbol_b | Chr_b | Start_b | End_b |
| breast | KIFC3 | chr16 | 57810327 | 57810327 | KCNJ6 | chr21 | 39130447 | 39130447 |
| cf) Tissue number; Tissue name (1;Breast, 2;Central_nervous_system, 3;Haematopoietic_and_lymphoid_tissue, 4;Large_intestine, 5;Liver, 6;Lung, 7;Ovary, 8;Pancreas, 9;Prostate, 10;Skin, 11;Soft_tissue, 12;Upper_aerodigestive_tract) |
| * From mRNA Sanger sequences, Chitars2.0 arranged chimeric transcripts. This table shows KIFC3 related fusion information. |
| ID | Head Gene | Tail Gene | Accession | Gene_a | qStart_a | qEnd_a | Chromosome_a | tStart_a | tEnd_a | Gene_a | qStart_a | qEnd_a | Chromosome_a | tStart_a | tEnd_a |
| BM726297 | KIFC3 | 1 | 69 | 16 | 57792333 | 57792401 | CANX | 69 | 495 | 5 | 179157500 | 179157926 | |
| BM680904 | CANX | 19 | 445 | 5 | 179157500 | 179157926 | KIFC3 | 445 | 498 | 16 | 57792333 | 57792386 | |
| BE715187 | LAMB3 | 15 | 101 | 1 | 209791887 | 209791973 | KIFC3 | 95 | 265 | 16 | 57818591 | 57818761 | |
| CV355096 | KIFC3 | 5 | 377 | 16 | 57806598 | 57806970 | INSR | 368 | 587 | 19 | 7227814 | 7228036 | |
| Top |
| Mutation type/ Tissue ID | brca | cns | cerv | endome | haematopo | kidn | Lintest | liver | lung | ns | ovary | pancre | prost | skin | stoma | thyro | urina | |||
| Total # sample | 1 | |||||||||||||||||||
| GAIN (# sample) | ||||||||||||||||||||
| LOSS (# sample) | 1 |
| cf) Tissue ID; Tissue type (1; Breast, 2; Central_nervous_system, 3; Cervix, 4; Endometrium, 5; Haematopoietic_and_lymphoid_tissue, 6; Kidney, 7; Large_intestine, 8; Liver, 9; Lung, 10; NS, 11; Ovary, 12; Pancreas, 13; Prostate, 14; Skin, 15; Stomach, 16; Thyroid, 17; Urinary_tract) |
| Top |
|
 |
| Top |
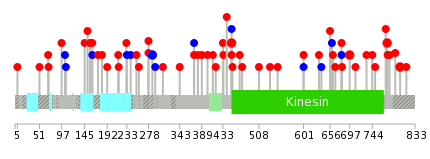
| Stat. for Non-Synonymous SNVs (# total SNVs=47) | (# total SNVs=11) |
 |  |
(# total SNVs=2) | (# total SNVs=1) |
 |  |
| Top |
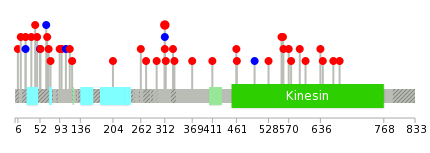
| * When you move the cursor on each content, you can see more deailed mutation information on the Tooltip. Those are primary_site,primary_histology,mutation(aa),pubmedID. |
| GRCh37 position | Mutation(aa) | Unique sampleID count |
| chr16:57794238-57794238 | p.R775C | 2 |
| chr16:57804520-57804520 | p.V286V | 2 |
| chr16:57804546-57804546 | p.R278W | 2 |
| chr16:57799532-57799532 | p.R451C | 2 |
| chr16:57794781-57794781 | p.I697V | 2 |
| chr16:57793712-57793712 | p.R802W | 2 |
| chr16:57798150-57798150 | p.E508K | 1 |
| chr16:57805229-57805229 | p.E216Q | 1 |
| chr16:57794233-57794233 | p.R776S | 1 |
| chr16:57800863-57800863 | p.N418I | 1 |
| Top |
|
 |
| Point Mutation/ Tissue ID | 1 | 2 | 3 | 4 | 5 | 6 | 7 | 8 | 9 | 10 | 11 | 12 | 13 | 14 | 15 | 16 | 17 | 18 | 19 | 20 |
| # sample | 10 | 1 | 1 | 1 | 5 | 1 | 2 | 1 | 2 | 6 | 7 | |||||||||
| # mutation | 11 | 1 | 1 | 1 | 6 | 1 | 2 | 1 | 3 | 7 | 9 | |||||||||
| nonsynonymous SNV | 9 | 1 | 6 | 2 | 1 | 3 | 6 | 9 | ||||||||||||
| synonymous SNV | 2 | 1 | 1 | 1 | 1 |
| cf) Tissue ID; Tissue type (1; BLCA[Bladder Urothelial Carcinoma], 2; BRCA[Breast invasive carcinoma], 3; CESC[Cervical squamous cell carcinoma and endocervical adenocarcinoma], 4; COAD[Colon adenocarcinoma], 5; GBM[Glioblastoma multiforme], 6; Glioma Low Grade, 7; HNSC[Head and Neck squamous cell carcinoma], 8; KICH[Kidney Chromophobe], 9; KIRC[Kidney renal clear cell carcinoma], 10; KIRP[Kidney renal papillary cell carcinoma], 11; LAML[Acute Myeloid Leukemia], 12; LUAD[Lung adenocarcinoma], 13; LUSC[Lung squamous cell carcinoma], 14; OV[Ovarian serous cystadenocarcinoma ], 15; PAAD[Pancreatic adenocarcinoma], 16; PRAD[Prostate adenocarcinoma], 17; SKCM[Skin Cutaneous Melanoma], 18:STAD[Stomach adenocarcinoma], 19:THCA[Thyroid carcinoma], 20:UCEC[Uterine Corpus Endometrial Carcinoma]) |
| Top |
| * We represented just top 10 SNVs. When you move the cursor on each content, you can see more deailed mutation information on the Tooltip. Those are primary_site, primary_histology, mutation(aa), pubmedID. |
| Genomic Position | Mutation(aa) | Unique sampleID count |
| chr16:57799532 | p.R312C,KIFC3 | 2 |
| chr16:57805259 | p.Q605H,KIFC3 | 1 |
| chr16:57794781 | p.R312R,KIFC3 | 1 |
| chr16:57829017 | p.R12W,KIFC3 | 1 |
| chr16:57799530 | p.S593L,KIFC3 | 1 |
| chr16:57805300 | p.R312H,KIFC3 | 1 |
| chr16:57794790 | p.R6Q,KIFC3 | 1 |
| chr16:57829031 | p.R575H,KIFC3 | 1 |
| chr16:57799531 | p.V106V,KIFC3 | 1 |
| chr16:57793672 | p.A570V,KIFC3 | 1 |
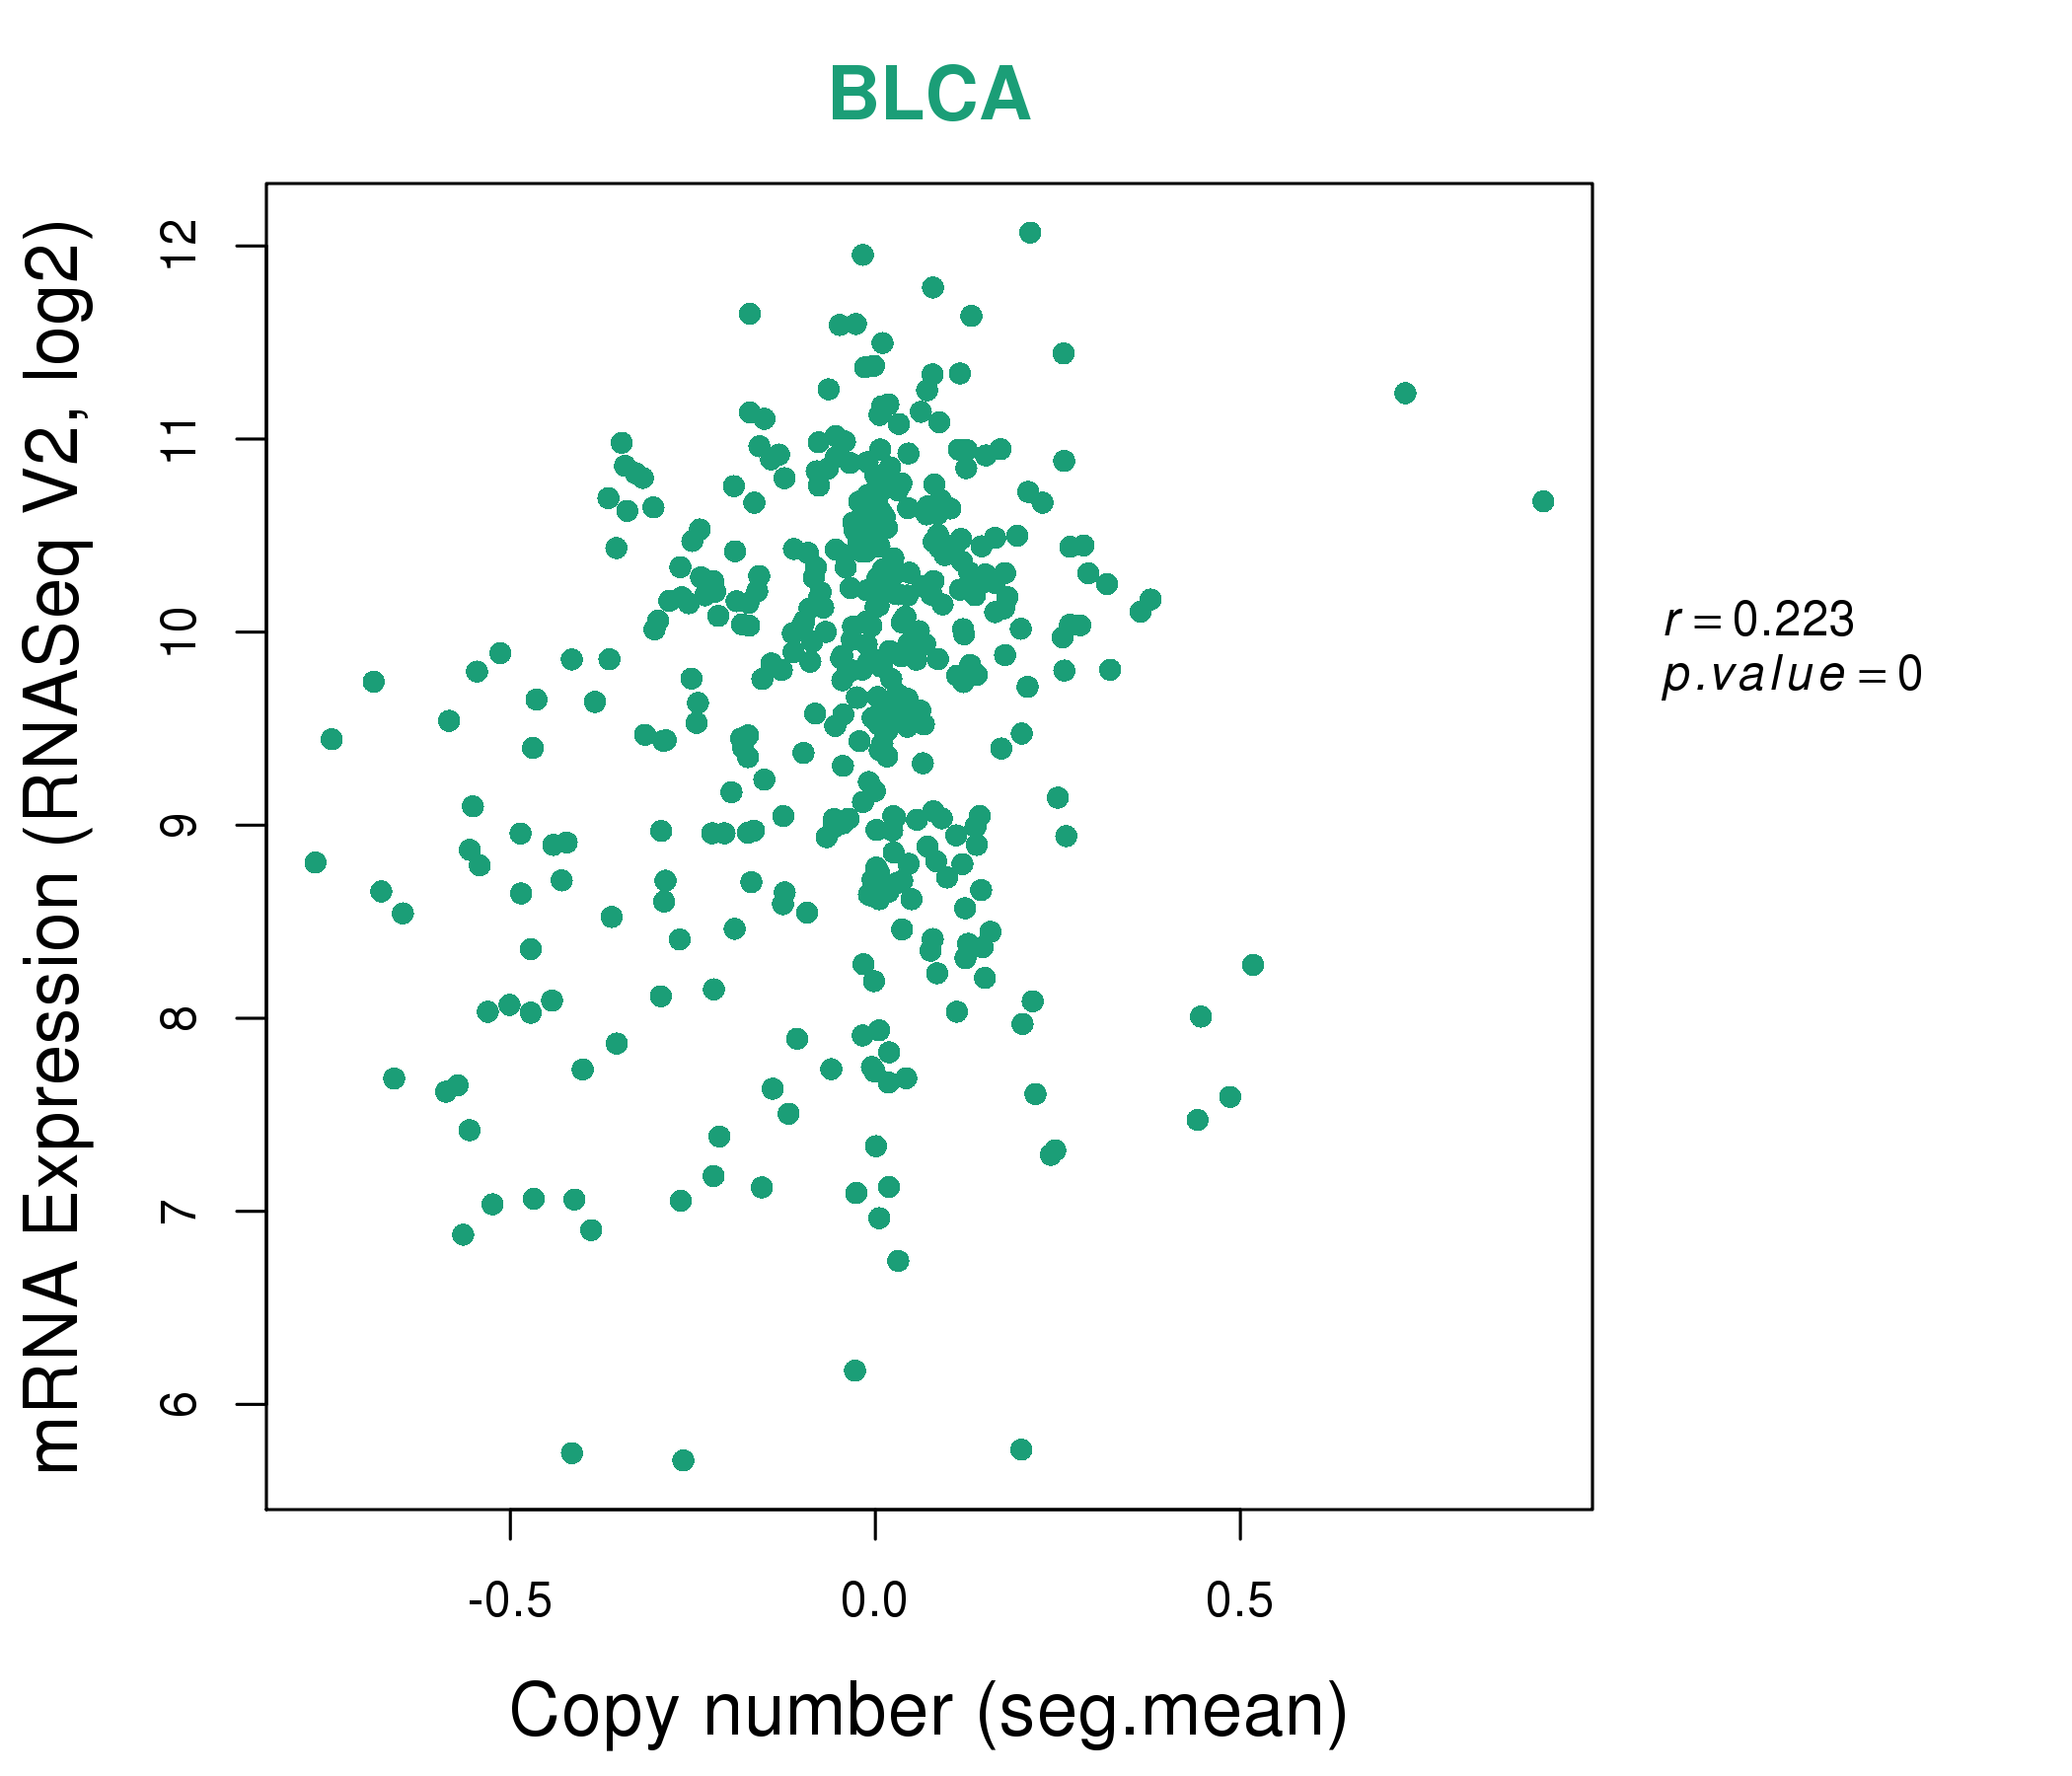
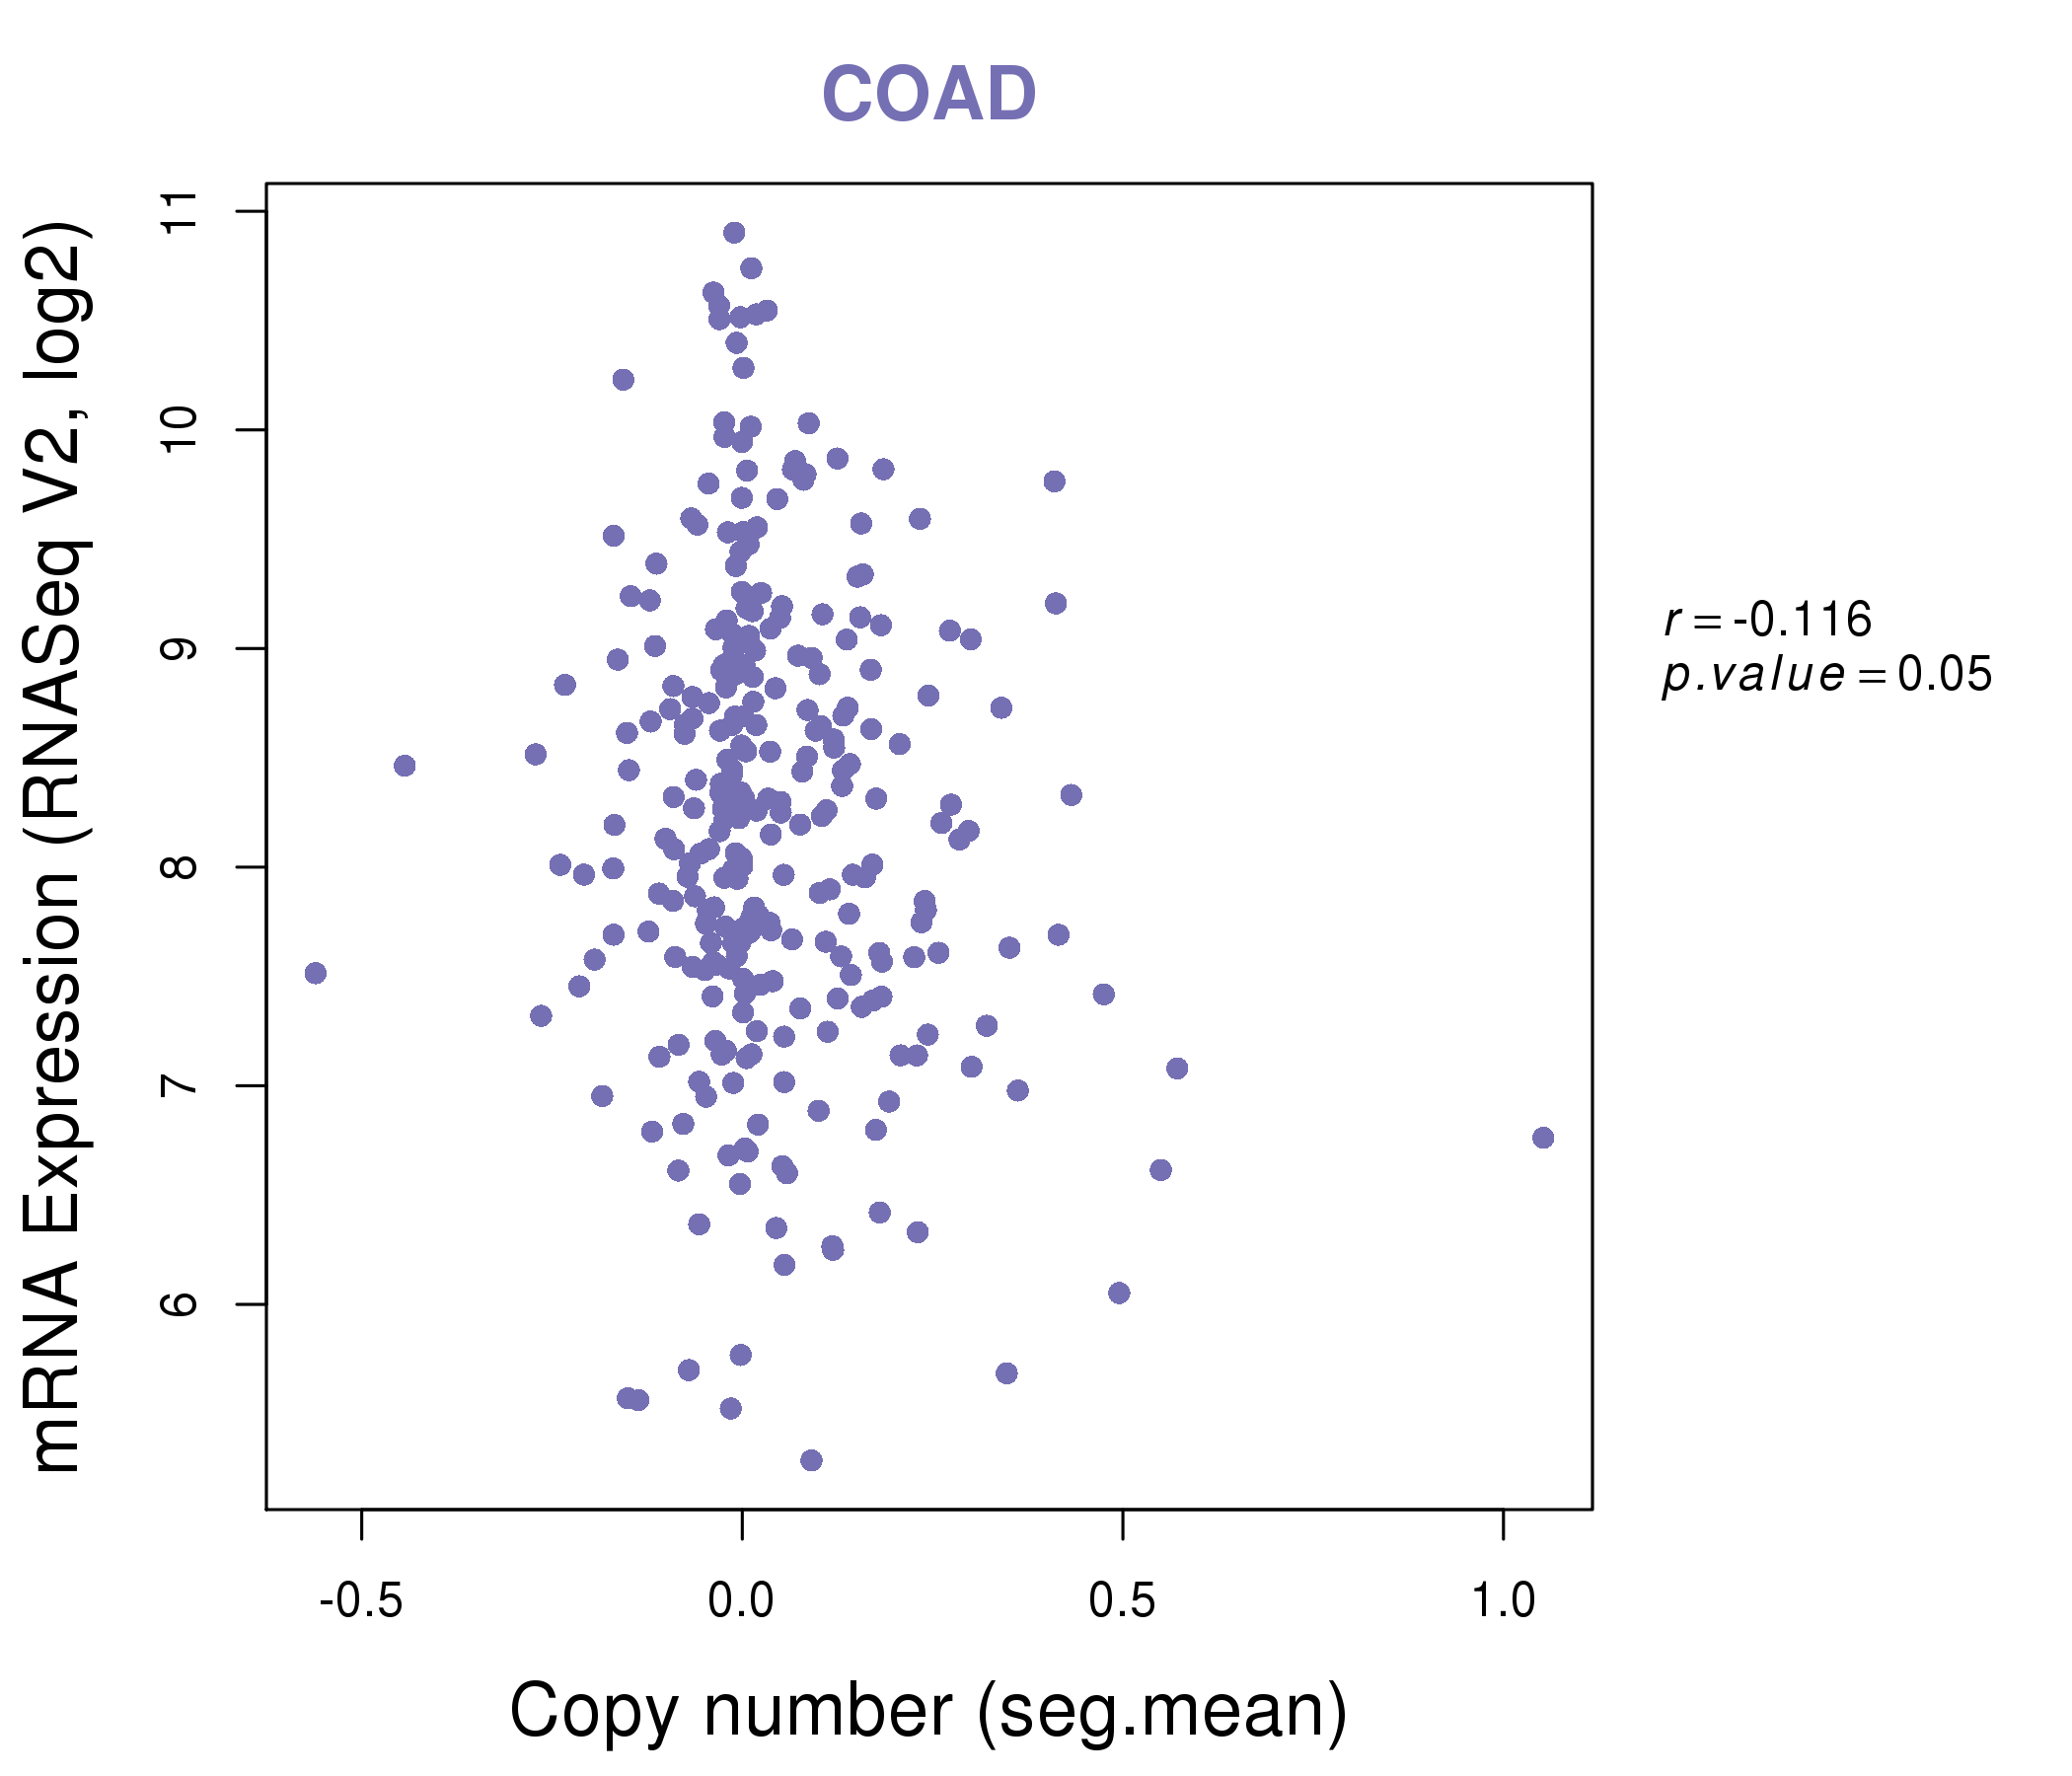
| * Copy number data were extracted from TCGA using R package TCGA-Assembler. The URLs of all public data files on TCGA DCC data server were gathered on Jan-05-2015. Function ProcessCNAData in TCGA-Assembler package was used to obtain gene-level copy number value which is calculated as the average copy number of the genomic region of a gene. |
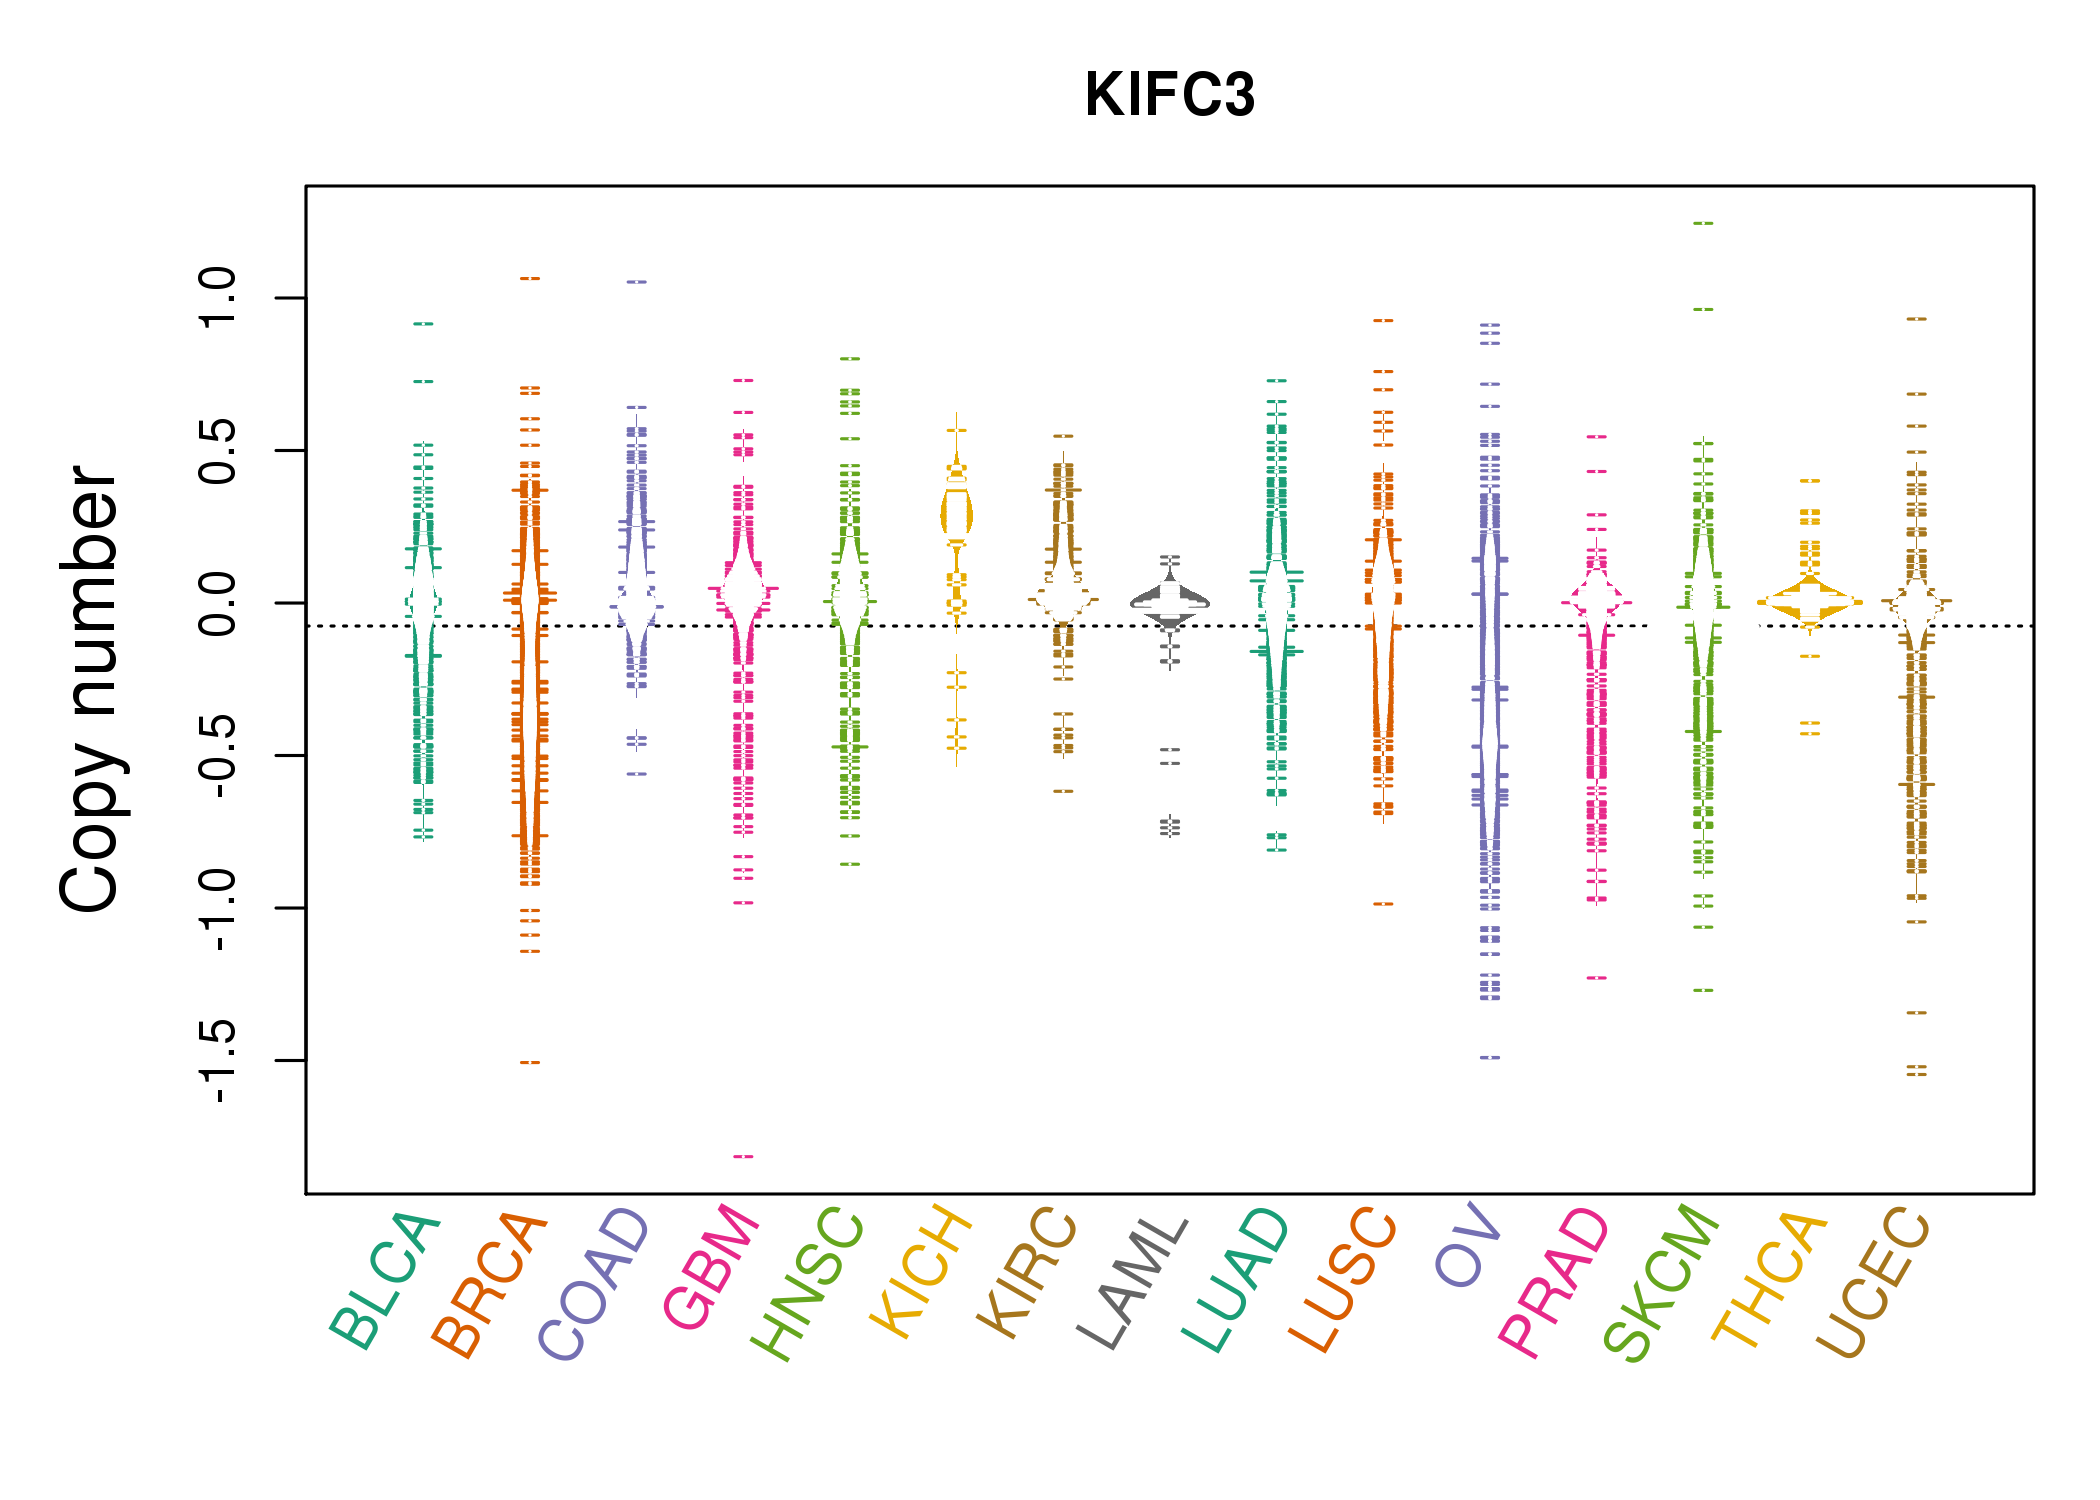 |
| cf) Tissue ID[Tissue type]: BLCA[Bladder Urothelial Carcinoma], BRCA[Breast invasive carcinoma], CESC[Cervical squamous cell carcinoma and endocervical adenocarcinoma], COAD[Colon adenocarcinoma], GBM[Glioblastoma multiforme], Glioma Low Grade, HNSC[Head and Neck squamous cell carcinoma], KICH[Kidney Chromophobe], KIRC[Kidney renal clear cell carcinoma], KIRP[Kidney renal papillary cell carcinoma], LAML[Acute Myeloid Leukemia], LUAD[Lung adenocarcinoma], LUSC[Lung squamous cell carcinoma], OV[Ovarian serous cystadenocarcinoma ], PAAD[Pancreatic adenocarcinoma], PRAD[Prostate adenocarcinoma], SKCM[Skin Cutaneous Melanoma], STAD[Stomach adenocarcinoma], THCA[Thyroid carcinoma], UCEC[Uterine Corpus Endometrial Carcinoma] |
| Top |
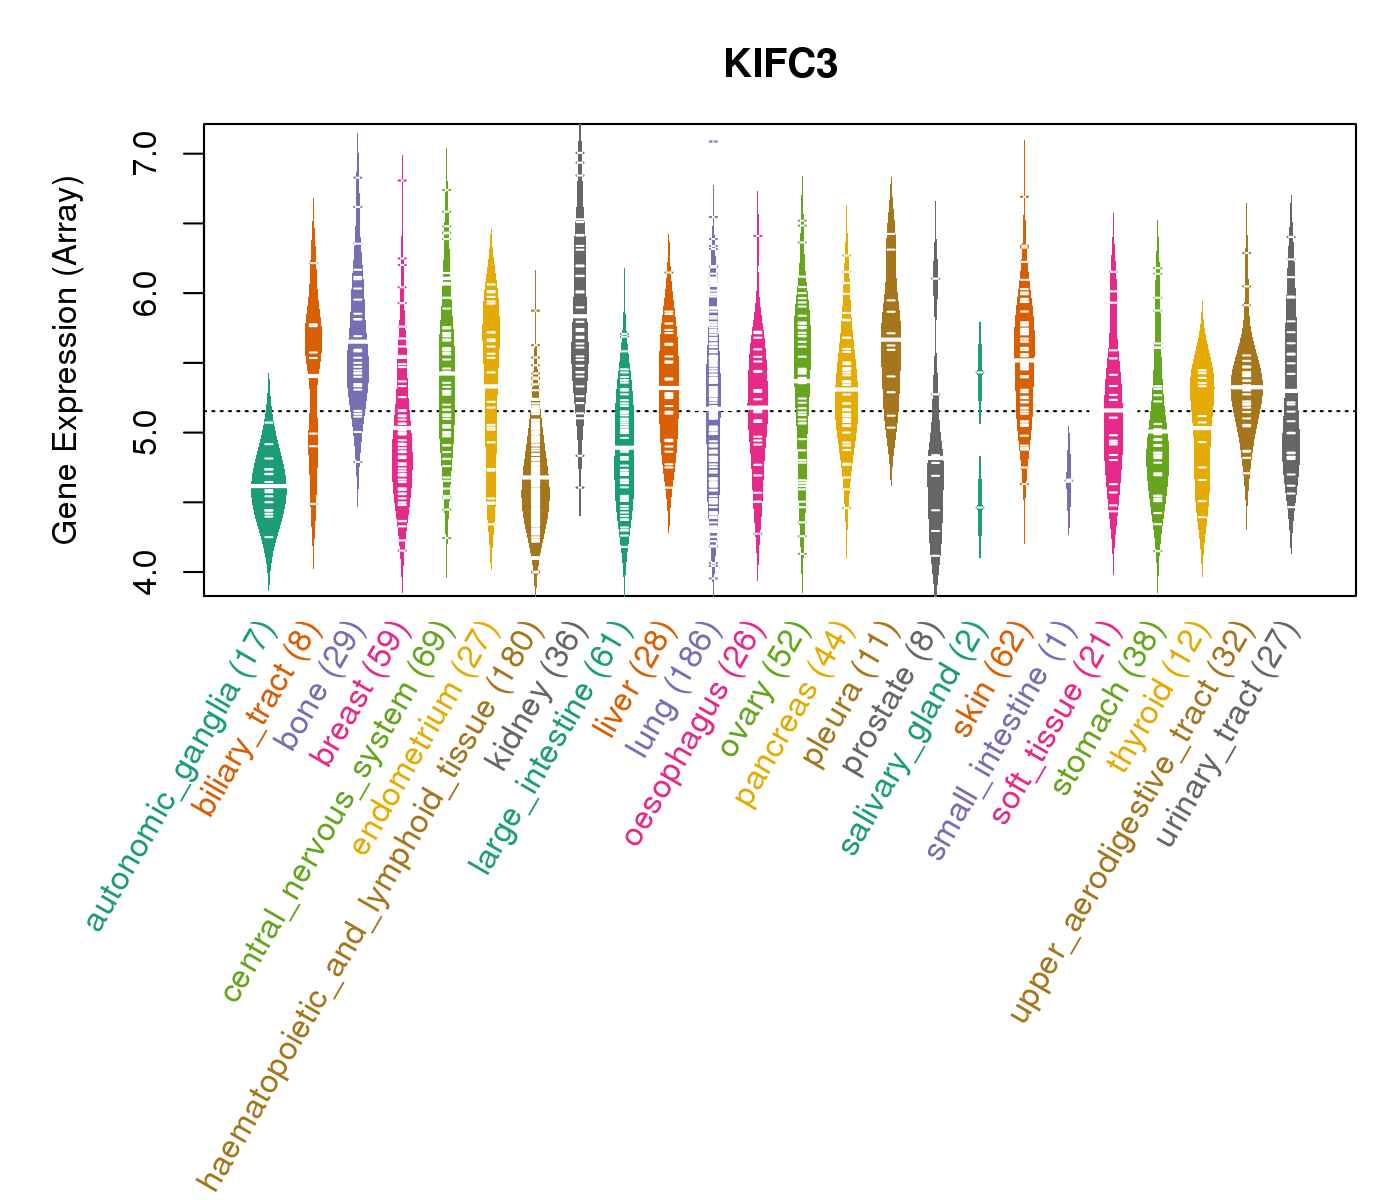
| Gene Expression for KIFC3 |
| * CCLE gene expression data were extracted from CCLE_Expression_Entrez_2012-10-18.res: Gene-centric RMA-normalized mRNA expression data. |
 |
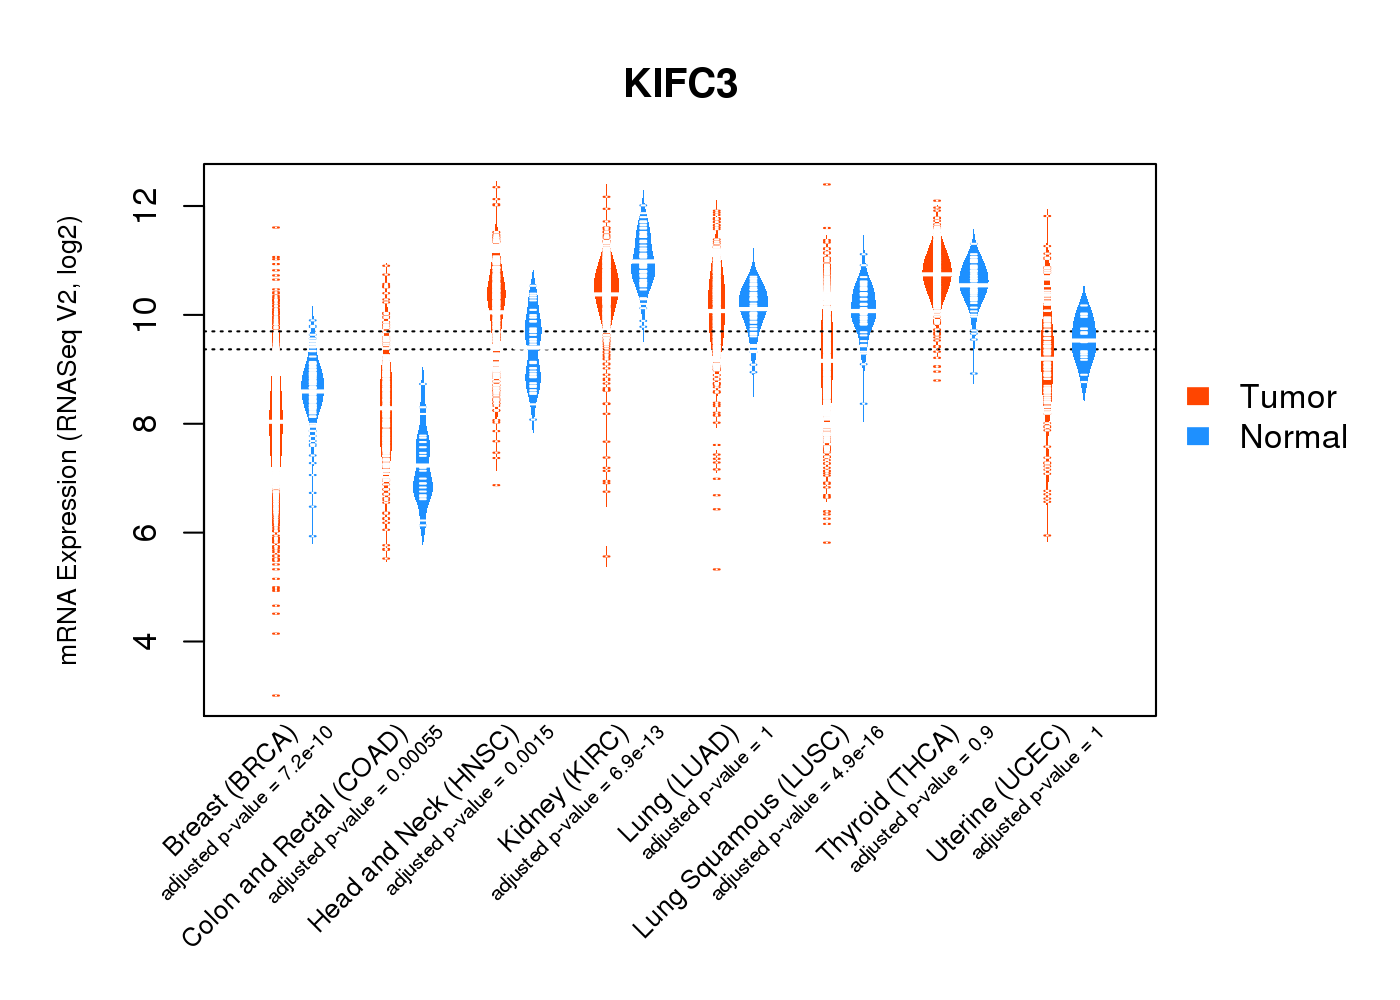
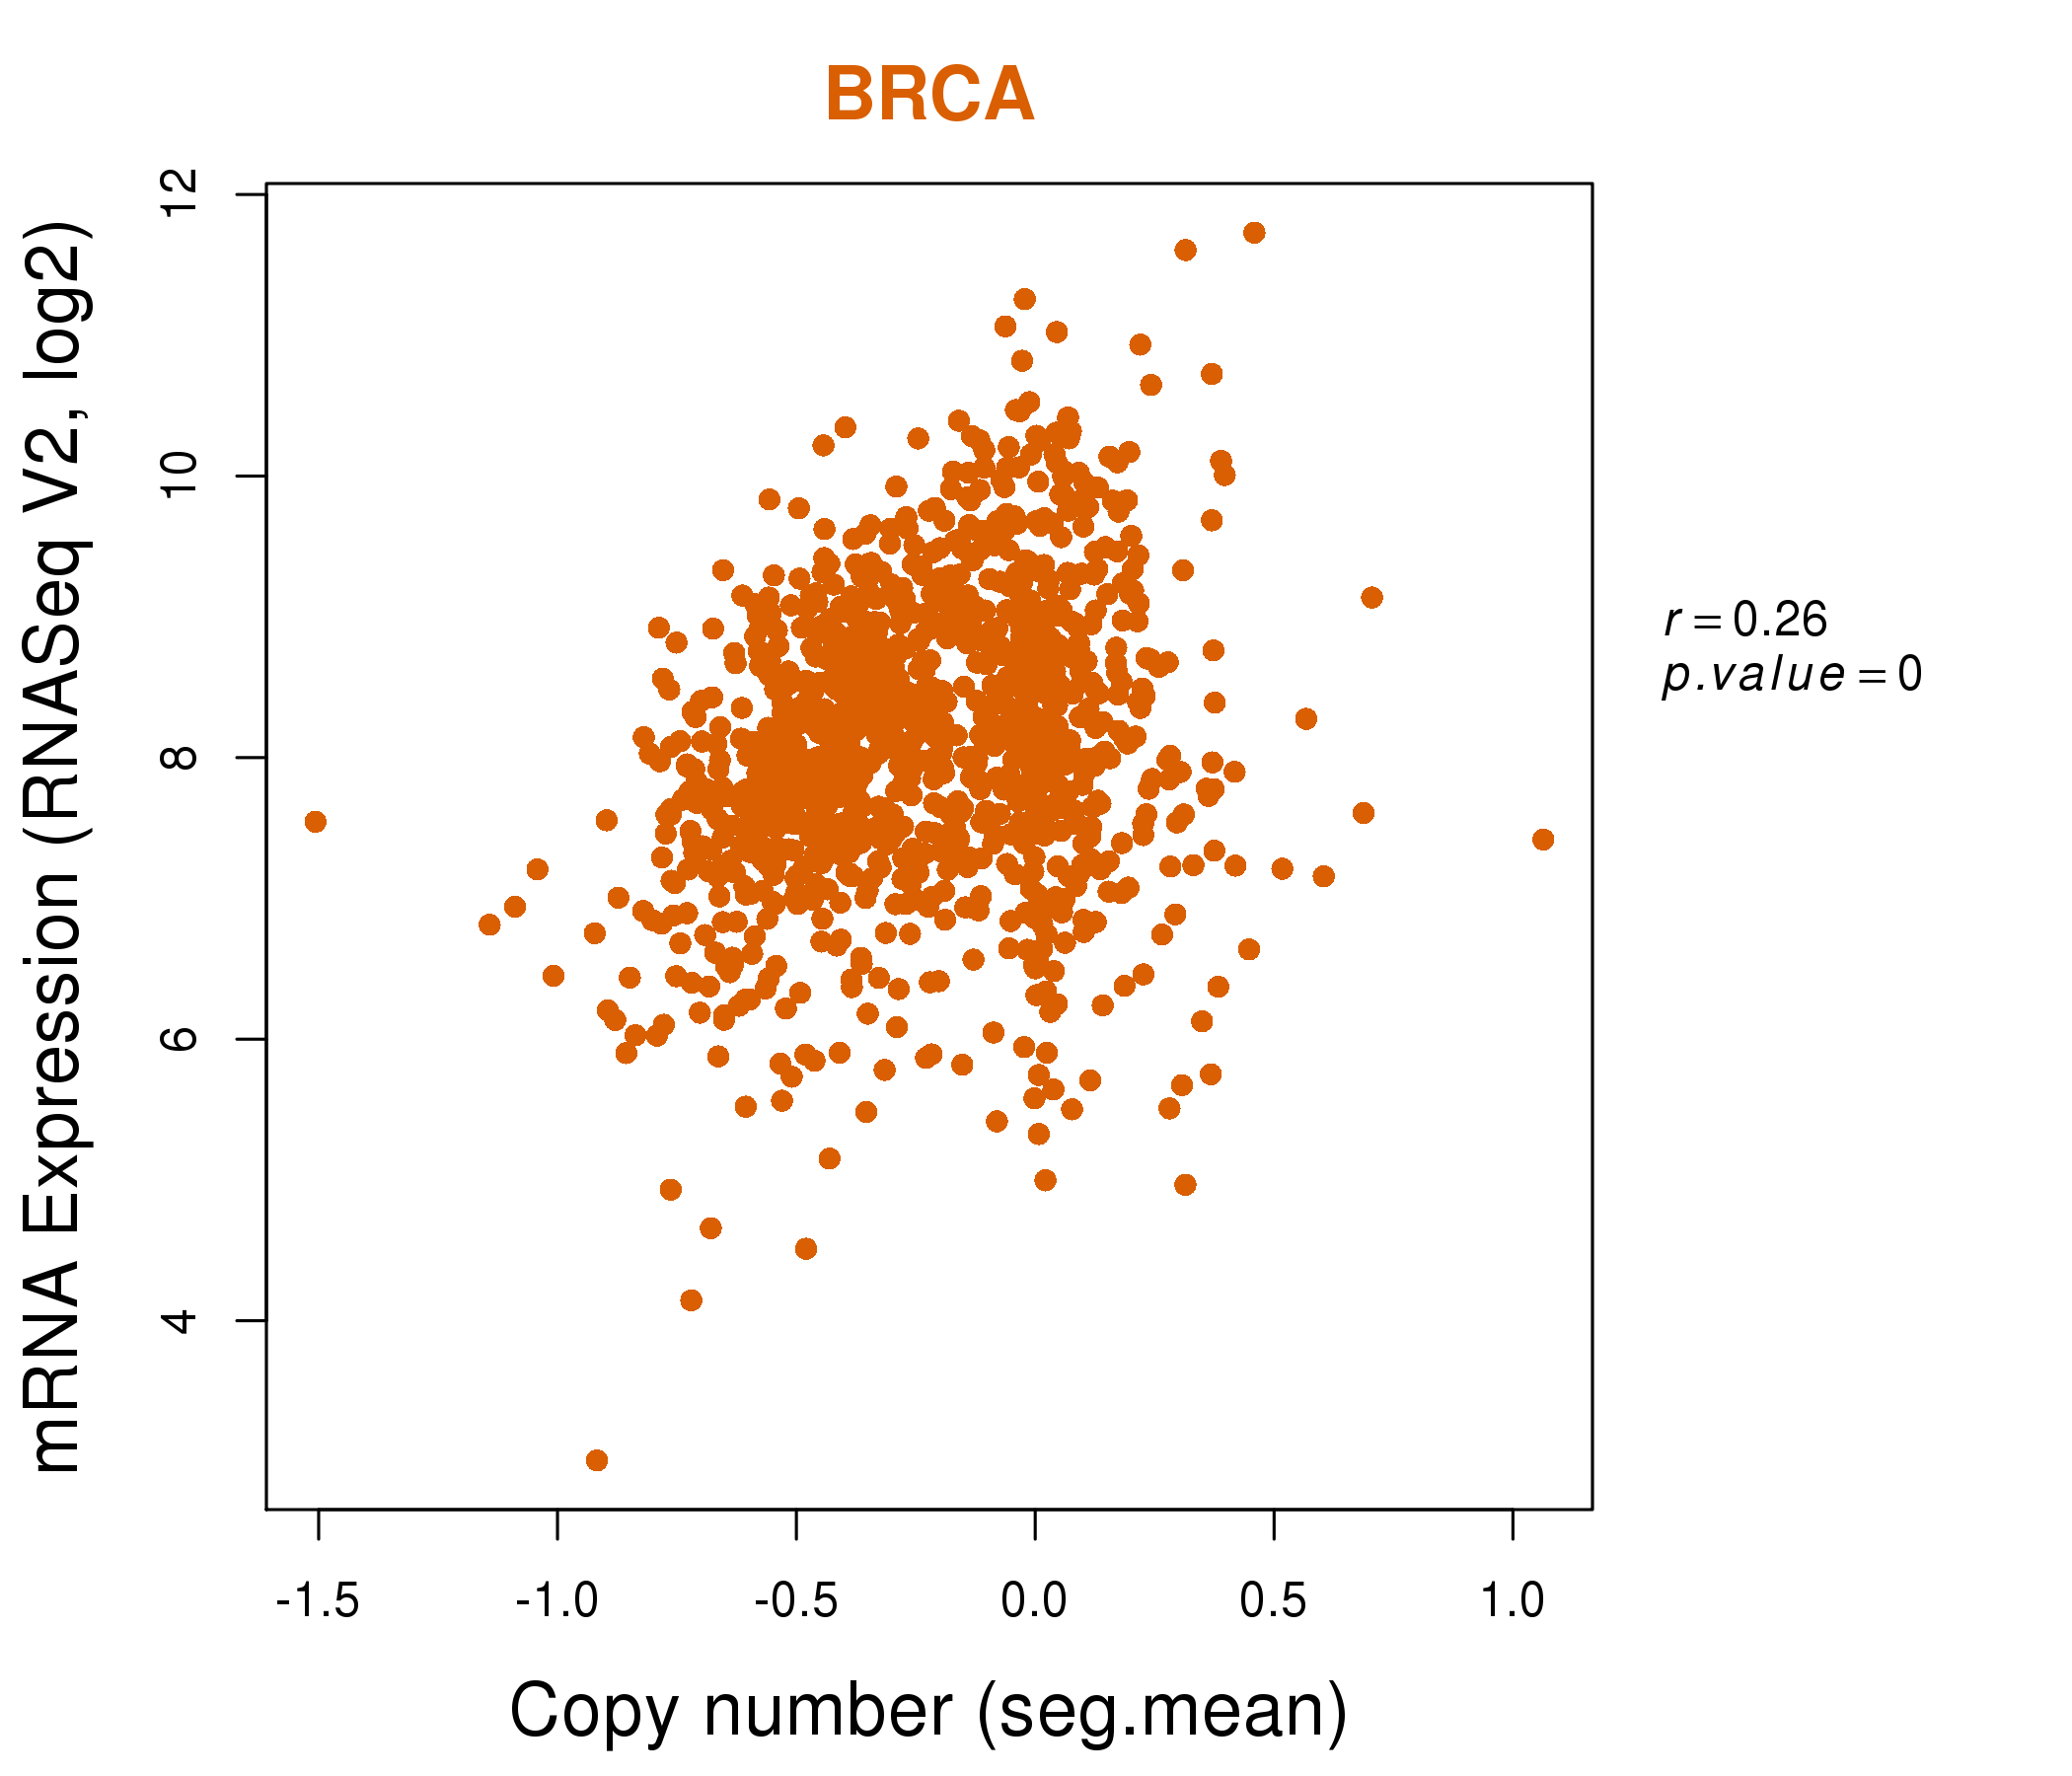
| * Normalized gene expression data of RNASeqV2 was extracted from TCGA using R package TCGA-Assembler. The URLs of all public data files on TCGA DCC data server were gathered at Jan-05-2015. Only eight cancer types have enough normal control samples for differential expression analysis. (t test, adjusted p<0.05 (using Benjamini-Hochberg FDR)) |
 |
| Top |
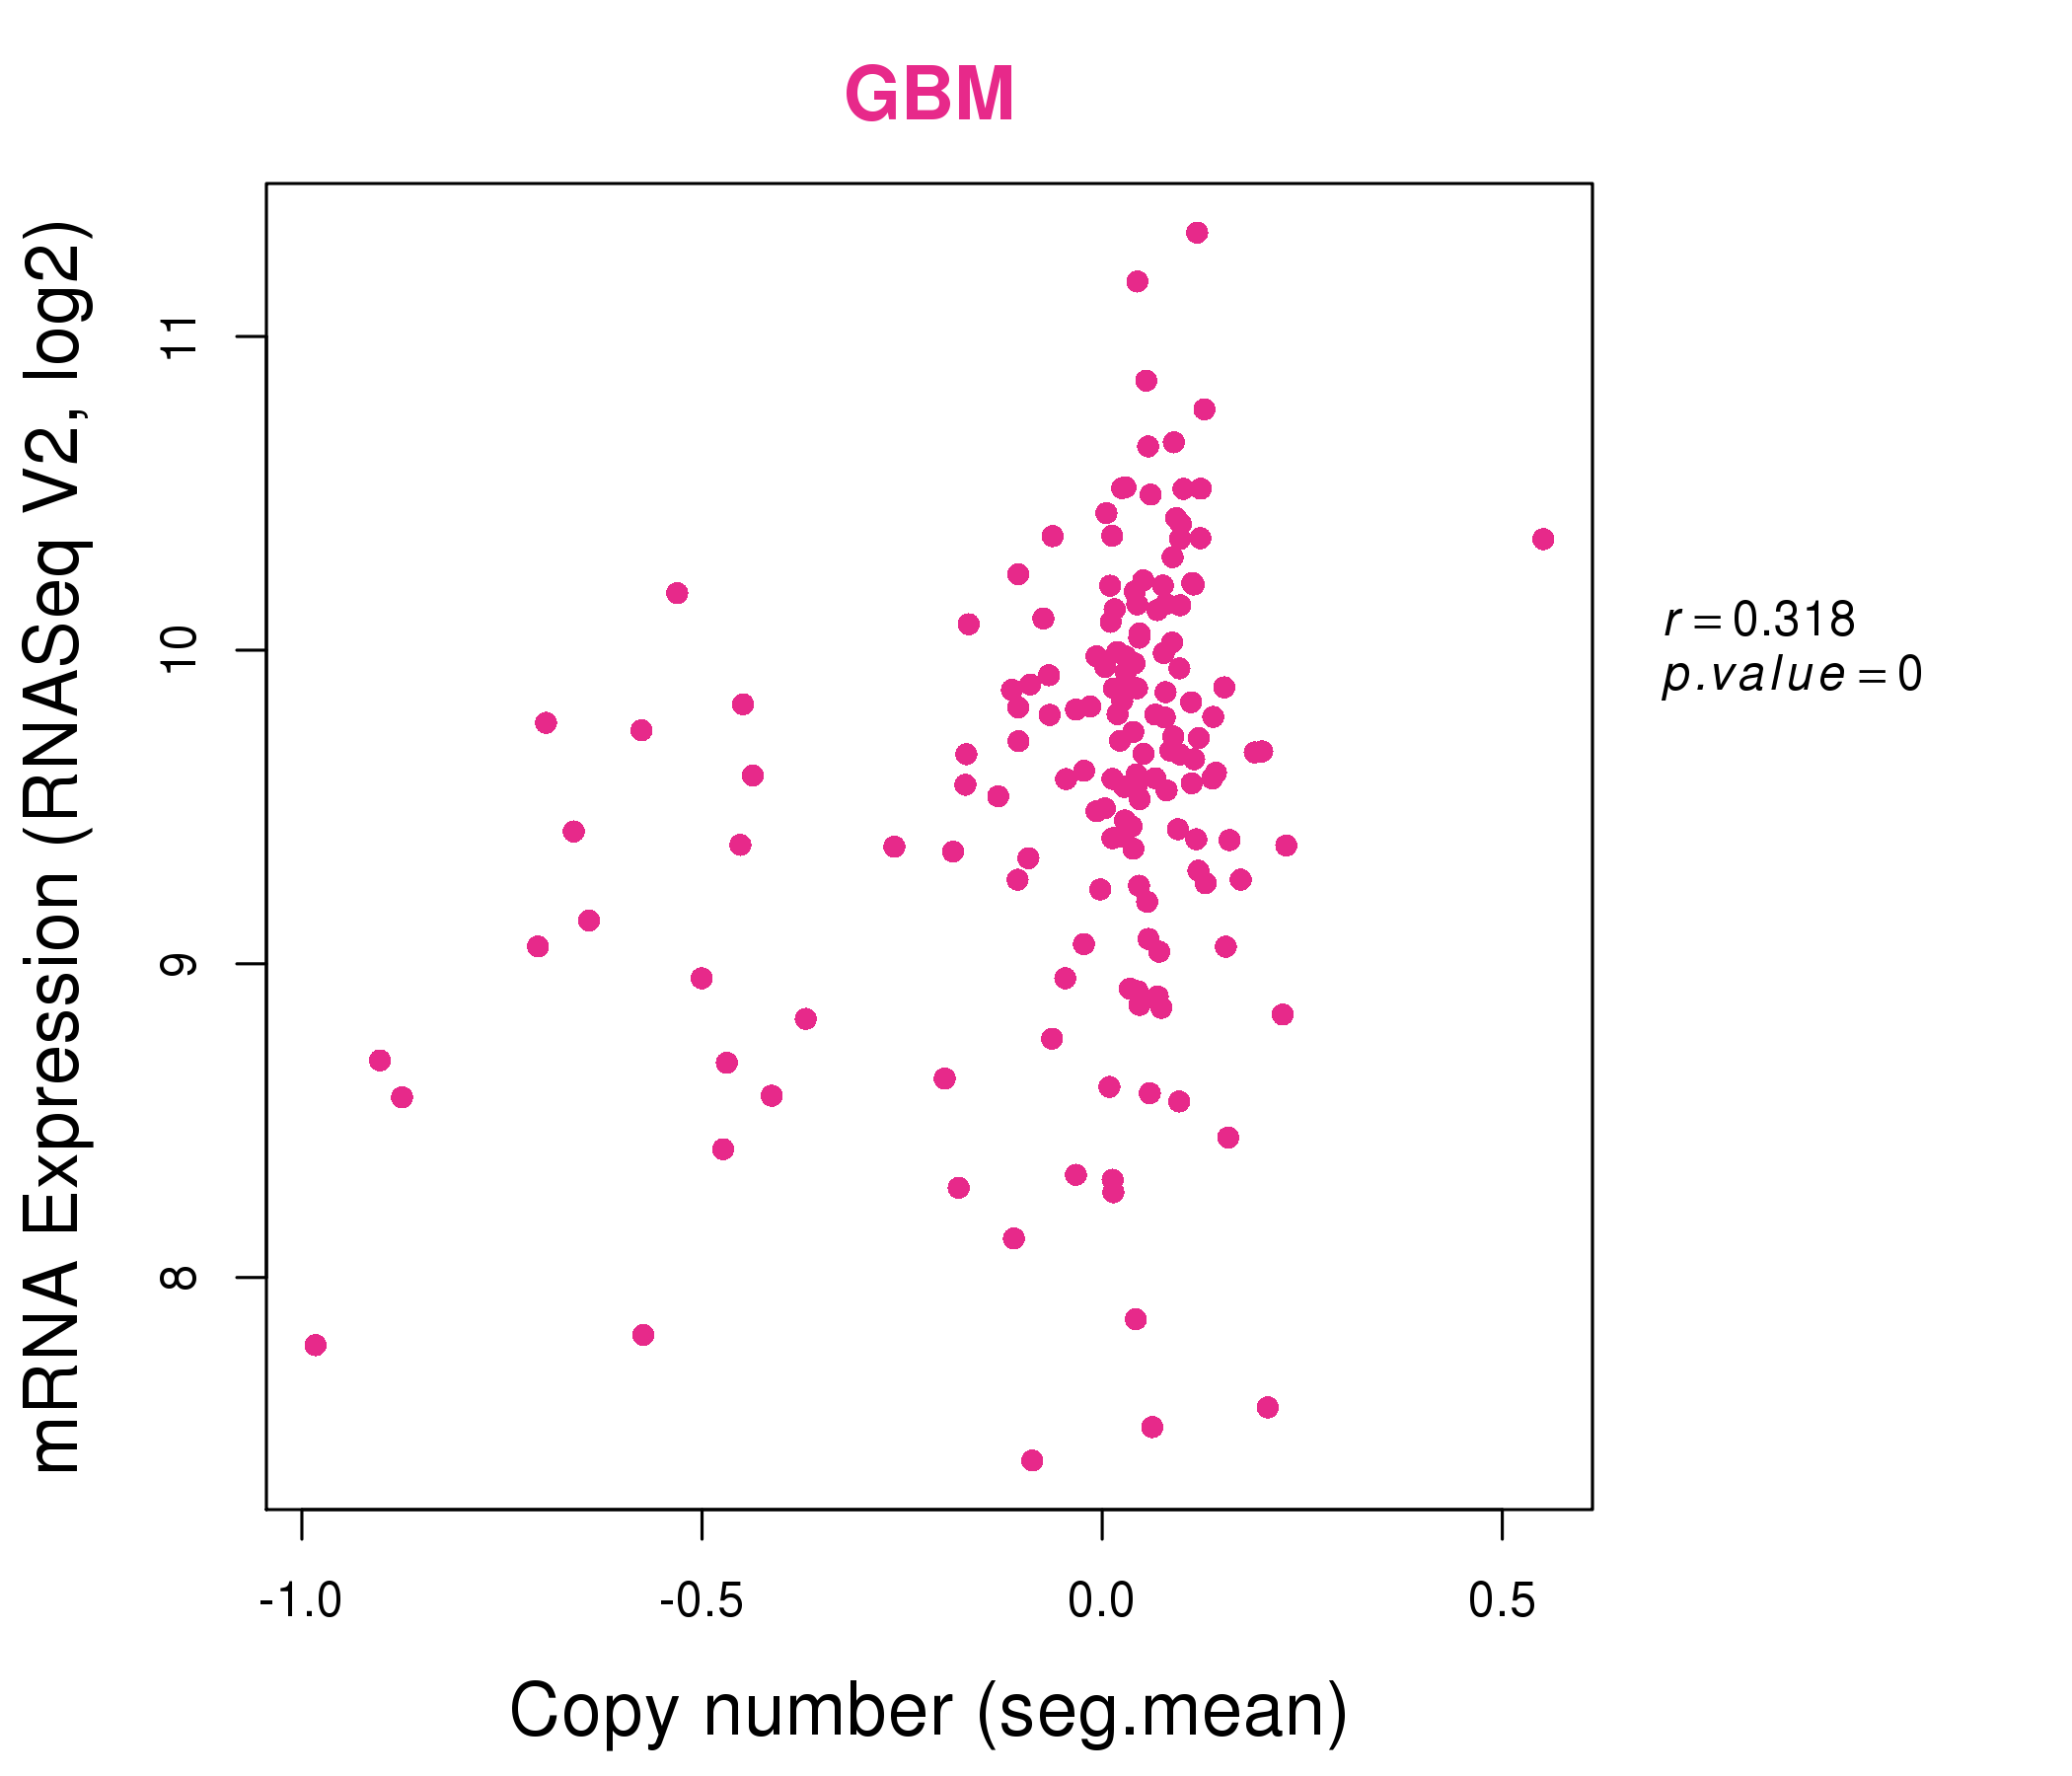
| * This plots show the correlation between CNV and gene expression. |
: Open all plots for all cancer types
 |
|
 |
|
| Top |
| Gene-Gene Network Information |
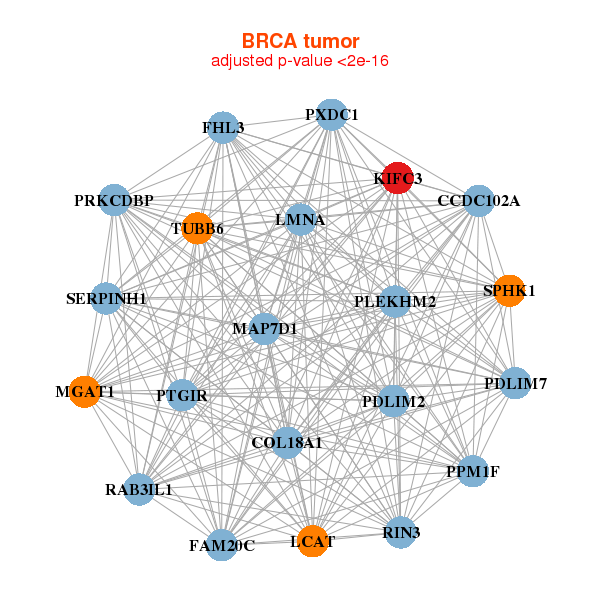
| * Co-Expression network figures were drawn using R package igraph. Only the top 20 genes with the highest correlations were shown. Red circle: input gene, orange circle: cell metabolism gene, sky circle: other gene |
: Open all plots for all cancer types
 |
|
| PXDC1,CCDC102A,COL18A1,FAM20C,FHL3,KIFC3,LCAT, LMNA,MAP7D1,MGAT1,PDLIM2,PDLIM7,PLEKHM2,PPM1F, PRKCDBP,PTGIR,RAB3IL1,RIN3,SERPINH1,SPHK1,TUBB6 | ASCC2,DBNL,EGLN2,EML3,FES,FURIN,INF2, KANK3,KIFC3,LRFN4,LZTR1,LZTS2,NUCB1,PHLDA3, PKN1,PPP1R12C,RNH1,RNPEPL1,RPS6KA4,TAOK2,ZDHHC8 |
 |
|
| BMP1,CERCAM,CFH,CHST15,COL18A1,COL6A2,GNAI2, KIFC3,LAMB2,LATS2,LEPRE1,LOXL1,MAP7D1,MAPK11, MMP14,MRC2,NXN,PRKCDBP,SLC12A4,TSPAN4,UBTD1 | ABCD1,ANGPTL4,CDR2L,CITED1,DFNA5,FTCD,HOXC11, KIFC3,MAOB,MGC45800,PHYHIPL,PMP22,RHOBTB2,SEC14L2, SFRP5,SFXN3,SH3GL1,SLC16A4,SUSD2,TIAM2,TMEM25 |
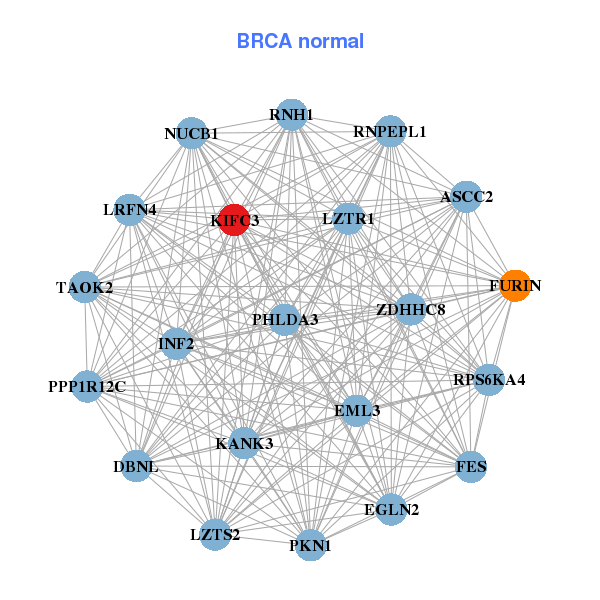
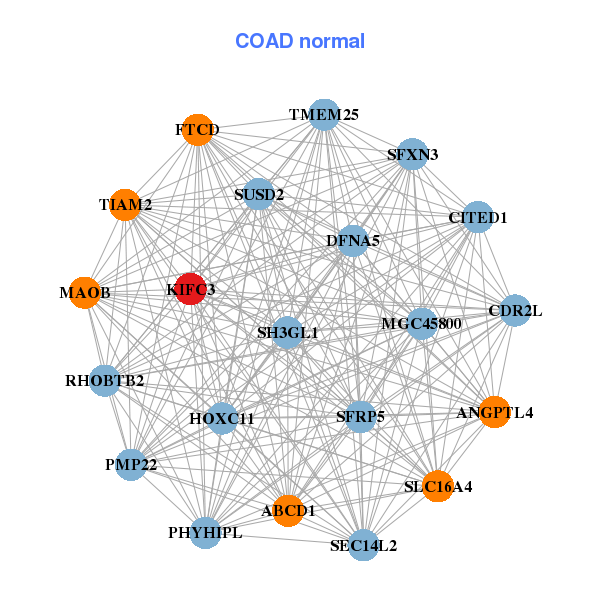
| * Co-Expression network figures were drawn using R package igraph. Only the top 20 genes with the highest correlations were shown. Red circle: input gene, orange circle: cell metabolism gene, sky circle: other gene |
: Open all plots for all cancer types
| Top |
: Open all interacting genes' information including KEGG pathway for all interacting genes from DAVID
| Top |
| Pharmacological Information for KIFC3 |
| There's no related Drug. |
| Top |
| Cross referenced IDs for KIFC3 |
| * We obtained these cross-references from Uniprot database. It covers 150 different DBs, 18 categories. http://www.uniprot.org/help/cross_references_section |
: Open all cross reference information
|
Copyright © 2016-Present - The Univsersity of Texas Health Science Center at Houston @ |