|
||||||||||||||||||||
| |
| Phenotypic Information (metabolism pathway, cancer, disease, phenome) |
| |
| |
| Gene-Gene Network Information: Co-Expression Network, Interacting Genes & KEGG |
| |
|


| Gene Summary for ARG1 |
| Basic gene info. | Gene symbol | ARG1 |
| Gene name | arginase 1 | |
| Synonyms | - | |
| Cytomap | UCSC genome browser: 6q23 | |
| Genomic location | chr6 :131894343-131905472 | |
| Type of gene | protein-coding | |
| RefGenes | NM_000045.3, NM_001244438.1, | |
| Ensembl id | ENSG00000118520 | |
| Description | arginase, liverarginase-1liver-type arginasetype I arginase | |
| Modification date | 20141219 | |
| dbXrefs | MIM : 608313 | |
| HGNC : HGNC | ||
| Ensembl : ENSG00000118520 | ||
| HPRD : 01947 | ||
| Vega : OTTHUMG00000015566 | ||
| Protein | UniProt: P05089 go to UniProt's Cross Reference DB Table | |
| Expression | CleanEX: HS_ARG1 | |
| BioGPS: 383 | ||
| Gene Expression Atlas: ENSG00000118520 | ||
| The Human Protein Atlas: ENSG00000118520 | ||
| Pathway | NCI Pathway Interaction Database: ARG1 | |
| KEGG: ARG1 | ||
| REACTOME: ARG1 | ||
| ConsensusPathDB | ||
| Pathway Commons: ARG1 | ||
| Metabolism | MetaCyc: ARG1 | |
| HUMANCyc: ARG1 | ||
| Regulation | Ensembl's Regulation: ENSG00000118520 | |
| miRBase: chr6 :131,894,343-131,905,472 | ||
| TargetScan: NM_000045 | ||
| cisRED: ENSG00000118520 | ||
| Context | iHOP: ARG1 | |
| cancer metabolism search in PubMed: ARG1 | ||
| UCL Cancer Institute: ARG1 | ||
| Assigned class in ccmGDB | A - This gene has a literature evidence and it belongs to cancer gene. | |
| References showing role of ARG1 in cancer cell metabolism | 1. Stenmark KR, Tuder RM, El Kasmi KC (2015) Metabolic Reprogramming and Inflammation Act in Concert to Control Vascular Remodeling in Hypoxic Pulmonary Hypertension. J Appl Physiol (1985): jap 00283 02015. doi: 10.1152/japplphysiol.00283.2015. go to article | |
| Top |
| Phenotypic Information for ARG1(metabolism pathway, cancer, disease, phenome) |
| Cancer | CGAP: ARG1 |
| Familial Cancer Database: ARG1 | |
| * This gene is included in those cancer gene databases. |
|
|
|
|
|
|
| ||||||||||||||
Oncogene 1 | Significant driver gene in | |||||||||||||||||||
| cf) number; DB name 1 Oncogene; http://nar.oxfordjournals.org/content/35/suppl_1/D721.long, 2 Tumor Suppressor gene; https://bioinfo.uth.edu/TSGene/, 3 Cancer Gene Census; http://www.nature.com/nrc/journal/v4/n3/abs/nrc1299.html, 4 CancerGenes; http://nar.oxfordjournals.org/content/35/suppl_1/D721.long, 5 Network of Cancer Gene; http://ncg.kcl.ac.uk/index.php, 1Therapeutic Vulnerabilities in Cancer; http://cbio.mskcc.org/cancergenomics/statius/ |
| KEGG_ARGININE_AND_PROLINE_METABOLISM REACTOME_METABOLISM_OF_AMINO_ACIDS_AND_DERIVATIVES | |
| OMIM | 207800; phenotype. 608313; gene. |
| Orphanet | 90; Argininemia. |
| Disease | KEGG Disease: ARG1 |
| MedGen: ARG1 (Human Medical Genetics with Condition) | |
| ClinVar: ARG1 | |
| Phenotype | MGI: ARG1 (International Mouse Phenotyping Consortium) |
| PhenomicDB: ARG1 | |
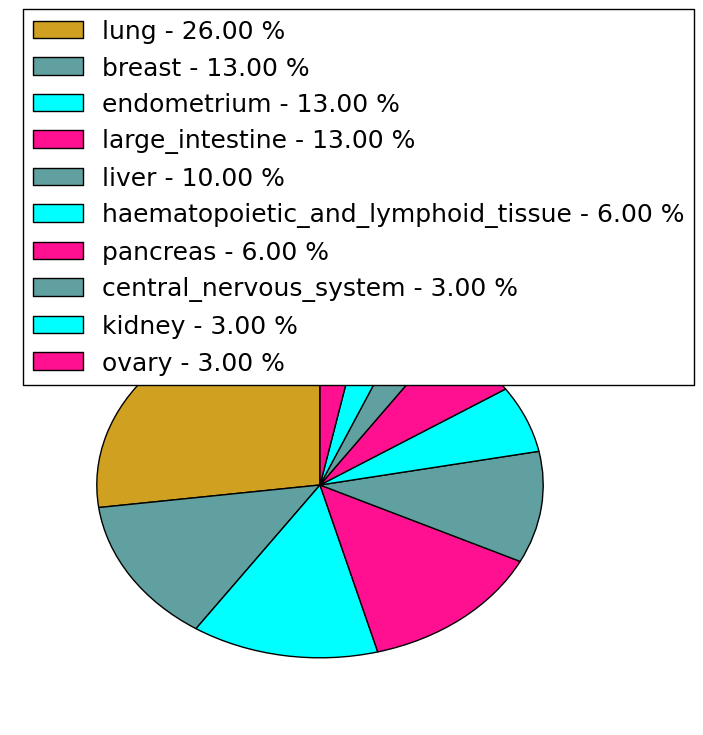
| Mutations for ARG1 |
| * Under tables are showing count per each tissue to give us broad intuition about tissue specific mutation patterns.You can go to the detailed page for each mutation database's web site. |
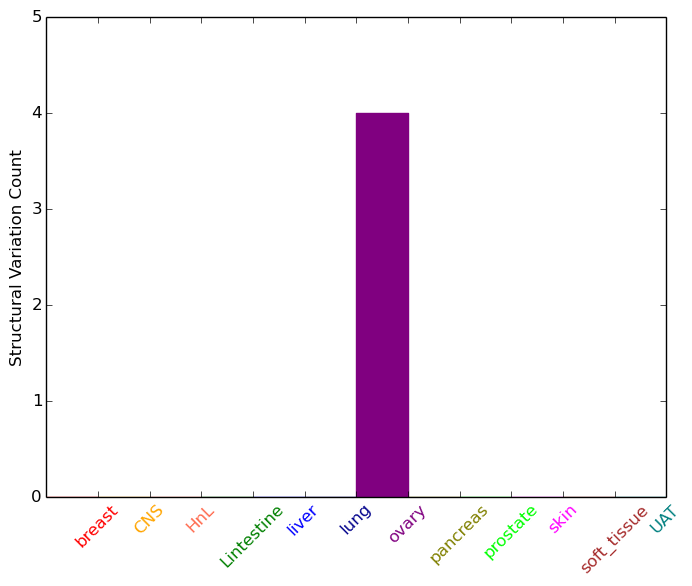
| - Statistics for Tissue and Mutation type | Top |
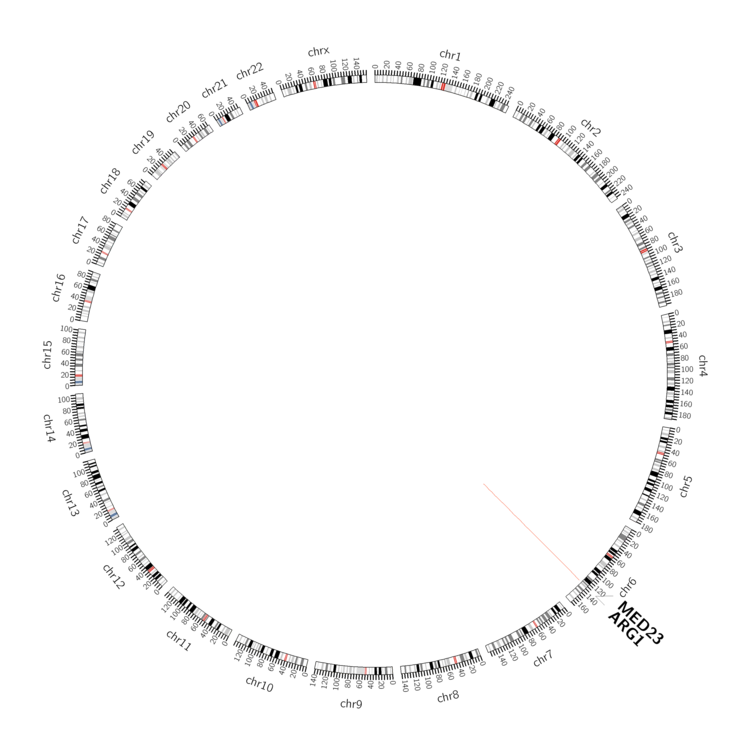 |
| - For Inter-chromosomal Variations |
| There's no inter-chromosomal structural variation. |
| - For Intra-chromosomal Variations |
| * Intra-chromosomal variantions includes 'intrachromosomal amplicon to amplicon', 'intrachromosomal amplicon to non-amplified dna', 'intrachromosomal deletion', 'intrachromosomal fold-back inversion', 'intrachromosomal inversion', 'intrachromosomal tandem duplication', 'Intrachromosomal unknown type', 'intrachromosomal with inverted orientation', 'intrachromosomal with non-inverted orientation'. |
 |
| Sample | Symbol_a | Chr_a | Start_a | End_a | Symbol_b | Chr_b | Start_b | End_b |
| ovary | ARG1 | chr6 | 131904653 | 131904673 | MED23 | chr6 | 131906140 | 131906160 |
| cf) Tissue number; Tissue name (1;Breast, 2;Central_nervous_system, 3;Haematopoietic_and_lymphoid_tissue, 4;Large_intestine, 5;Liver, 6;Lung, 7;Ovary, 8;Pancreas, 9;Prostate, 10;Skin, 11;Soft_tissue, 12;Upper_aerodigestive_tract) |
| * From mRNA Sanger sequences, Chitars2.0 arranged chimeric transcripts. This table shows ARG1 related fusion information. |
| ID | Head Gene | Tail Gene | Accession | Gene_a | qStart_a | qEnd_a | Chromosome_a | tStart_a | tEnd_a | Gene_a | qStart_a | qEnd_a | Chromosome_a | tStart_a | tEnd_a |
| Top |
| There's no copy number variation information in COSMIC data for this gene. |
| Top |
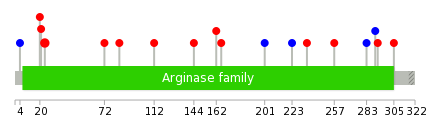
|
 |
| Top |
| Stat. for Non-Synonymous SNVs (# total SNVs=30) | (# total SNVs=4) |
 |  |
(# total SNVs=0) | (# total SNVs=0) |
| Top |
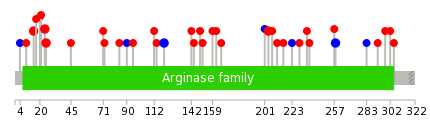
| * When you move the cursor on each content, you can see more deailed mutation information on the Tooltip. Those are primary_site,primary_histology,mutation(aa),pubmedID. |
| GRCh37 position | Mutation(aa) | Unique sampleID count |
| chr6:131904251-131904251 | p.D204E | 2 |
| chr6:131897815-131897815 | p.V24L | 2 |
| chr6:131902413-131902413 | p.V120V | 2 |
| chr6:131897818-131897818 | p.E25K | 2 |
| chr6:131894467-131894467 | p.F15L | 2 |
| chr6:131904603-131904603 | p.L258L | 2 |
| chr6:131902388-131902388 | p.A112V | 1 |
| chr6:131904242-131904242 | p.T201T | 1 |
| chr6:131897807-131897807 | p.R21Q | 1 |
| chr6:131904928-131904928 | p.G283G | 1 |
| Top |
|
 |
| Point Mutation/ Tissue ID | 1 | 2 | 3 | 4 | 5 | 6 | 7 | 8 | 9 | 10 | 11 | 12 | 13 | 14 | 15 | 16 | 17 | 18 | 19 | 20 |
| # sample | 2 | 3 | 3 | 1 | 2 | 2 | 4 | |||||||||||||
| # mutation | 2 | 3 | 3 | 1 | 2 | 2 | 5 | |||||||||||||
| nonsynonymous SNV | 2 | 2 | 2 | 1 | 1 | 2 | 4 | |||||||||||||
| synonymous SNV | 1 | 1 | 1 | 1 |
| cf) Tissue ID; Tissue type (1; BLCA[Bladder Urothelial Carcinoma], 2; BRCA[Breast invasive carcinoma], 3; CESC[Cervical squamous cell carcinoma and endocervical adenocarcinoma], 4; COAD[Colon adenocarcinoma], 5; GBM[Glioblastoma multiforme], 6; Glioma Low Grade, 7; HNSC[Head and Neck squamous cell carcinoma], 8; KICH[Kidney Chromophobe], 9; KIRC[Kidney renal clear cell carcinoma], 10; KIRP[Kidney renal papillary cell carcinoma], 11; LAML[Acute Myeloid Leukemia], 12; LUAD[Lung adenocarcinoma], 13; LUSC[Lung squamous cell carcinoma], 14; OV[Ovarian serous cystadenocarcinoma ], 15; PAAD[Pancreatic adenocarcinoma], 16; PRAD[Prostate adenocarcinoma], 17; SKCM[Skin Cutaneous Melanoma], 18:STAD[Stomach adenocarcinoma], 19:THCA[Thyroid carcinoma], 20:UCEC[Uterine Corpus Endometrial Carcinoma]) |
| Top |
| * We represented just top 10 SNVs. When you move the cursor on each content, you can see more deailed mutation information on the Tooltip. Those are primary_site, primary_histology, mutation(aa), pubmedID. |
| Genomic Position | Mutation(aa) | Unique sampleID count |
| chr6:131897815 | p.V24L,ARG1 | 2 |
| chr6:131904954 | p.P144L,ARG1 | 1 |
| chr6:131902388 | p.F162L,ARG1 | 1 |
| chr6:131904992 | p.T166I,ARG1 | 1 |
| chr6:131902484 | p.T201T,ARG1 | 1 |
| chr6:131903781 | p.K223K,ARG1 | 1 |
| chr6:131903792 | p.G235R,ARG1 | 1 |
| chr6:131904242 | p.G257S,ARG1 | 1 |
| chr6:131894434 | p.G283G,ARG1 | 1 |
| chr6:131904498 | p.T290T,ARG1 | 1 |
| * Copy number data were extracted from TCGA using R package TCGA-Assembler. The URLs of all public data files on TCGA DCC data server were gathered on Jan-05-2015. Function ProcessCNAData in TCGA-Assembler package was used to obtain gene-level copy number value which is calculated as the average copy number of the genomic region of a gene. |
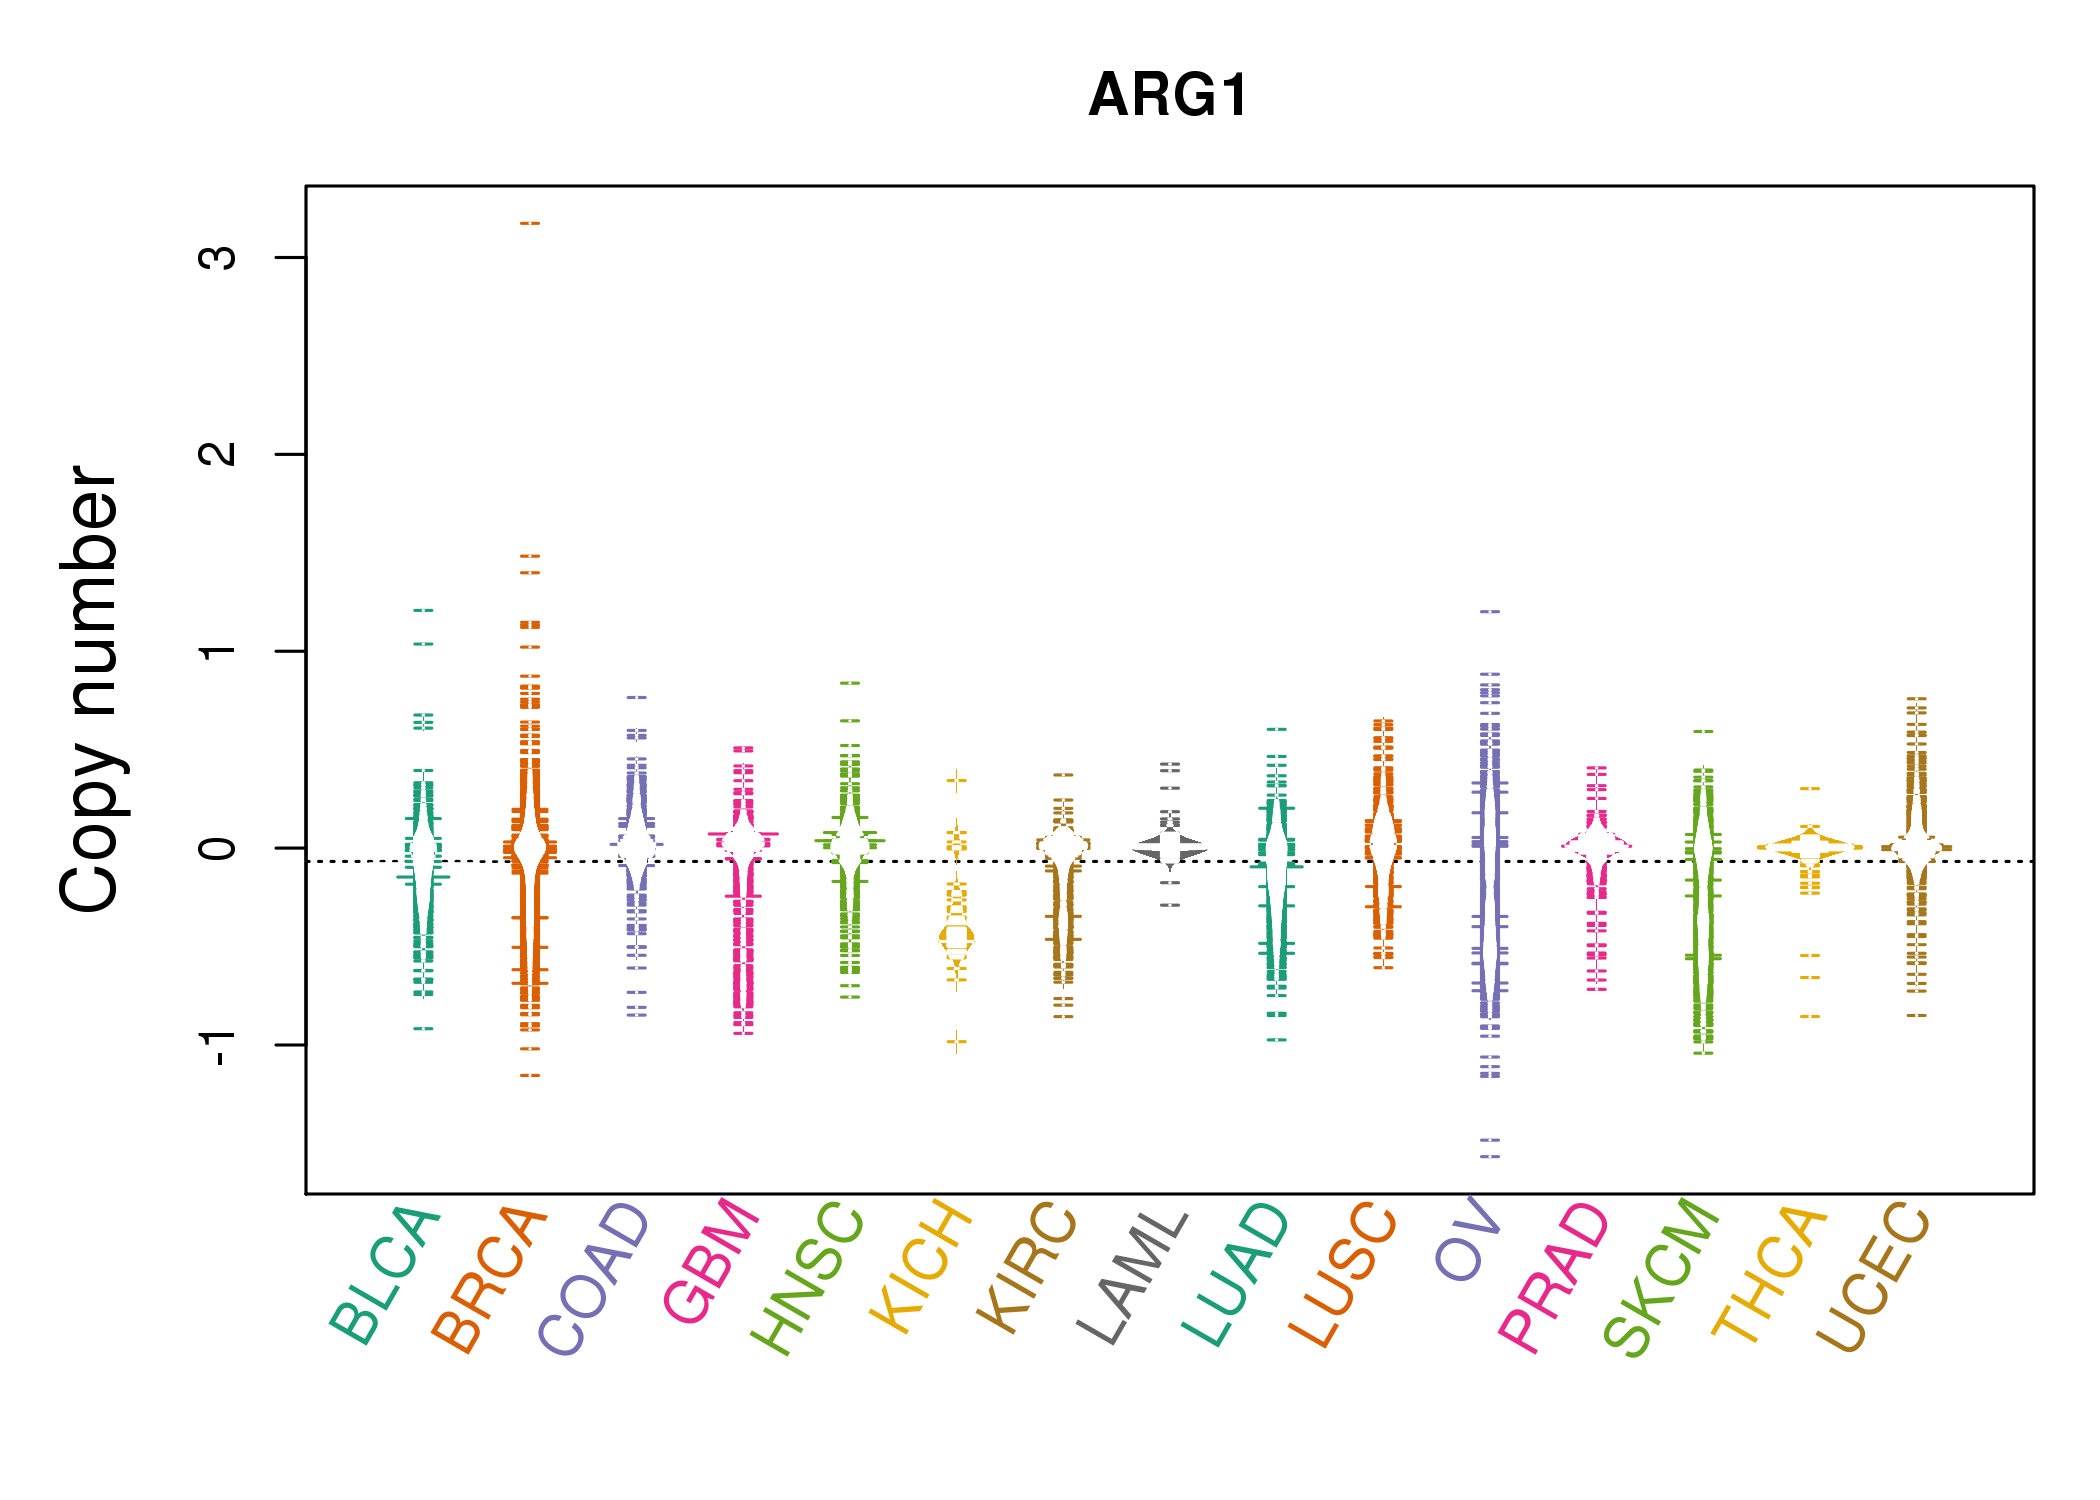 |
| cf) Tissue ID[Tissue type]: BLCA[Bladder Urothelial Carcinoma], BRCA[Breast invasive carcinoma], CESC[Cervical squamous cell carcinoma and endocervical adenocarcinoma], COAD[Colon adenocarcinoma], GBM[Glioblastoma multiforme], Glioma Low Grade, HNSC[Head and Neck squamous cell carcinoma], KICH[Kidney Chromophobe], KIRC[Kidney renal clear cell carcinoma], KIRP[Kidney renal papillary cell carcinoma], LAML[Acute Myeloid Leukemia], LUAD[Lung adenocarcinoma], LUSC[Lung squamous cell carcinoma], OV[Ovarian serous cystadenocarcinoma ], PAAD[Pancreatic adenocarcinoma], PRAD[Prostate adenocarcinoma], SKCM[Skin Cutaneous Melanoma], STAD[Stomach adenocarcinoma], THCA[Thyroid carcinoma], UCEC[Uterine Corpus Endometrial Carcinoma] |
| Top |
| Gene Expression for ARG1 |
| * CCLE gene expression data were extracted from CCLE_Expression_Entrez_2012-10-18.res: Gene-centric RMA-normalized mRNA expression data. |
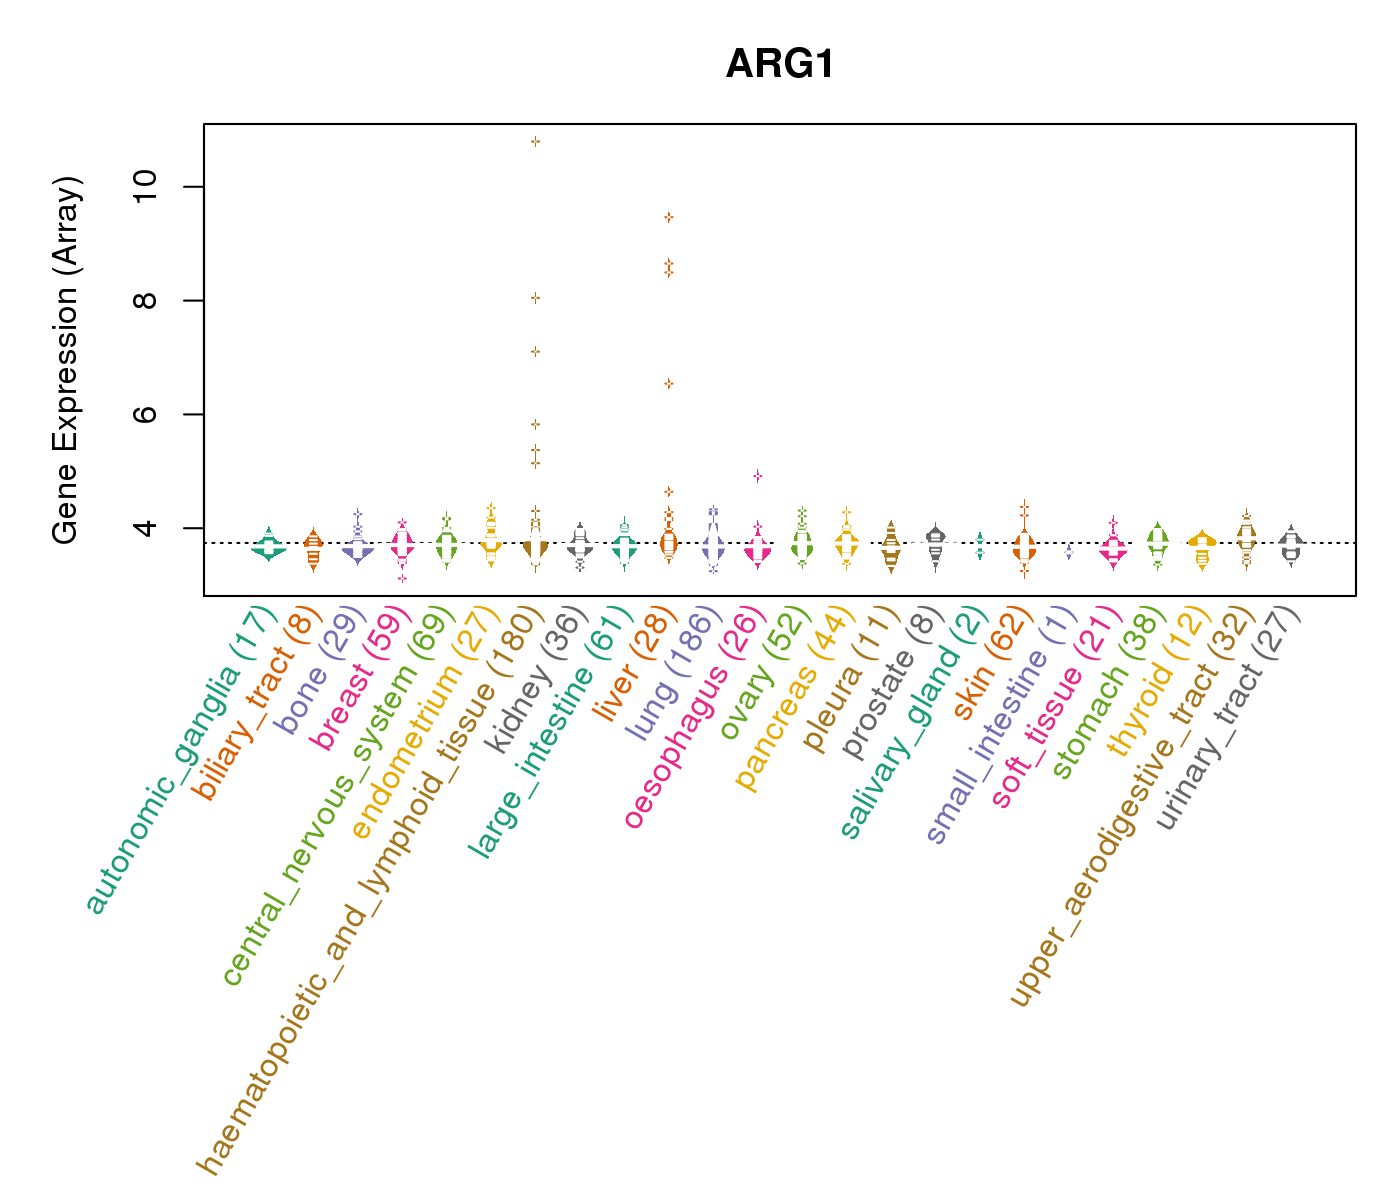 |
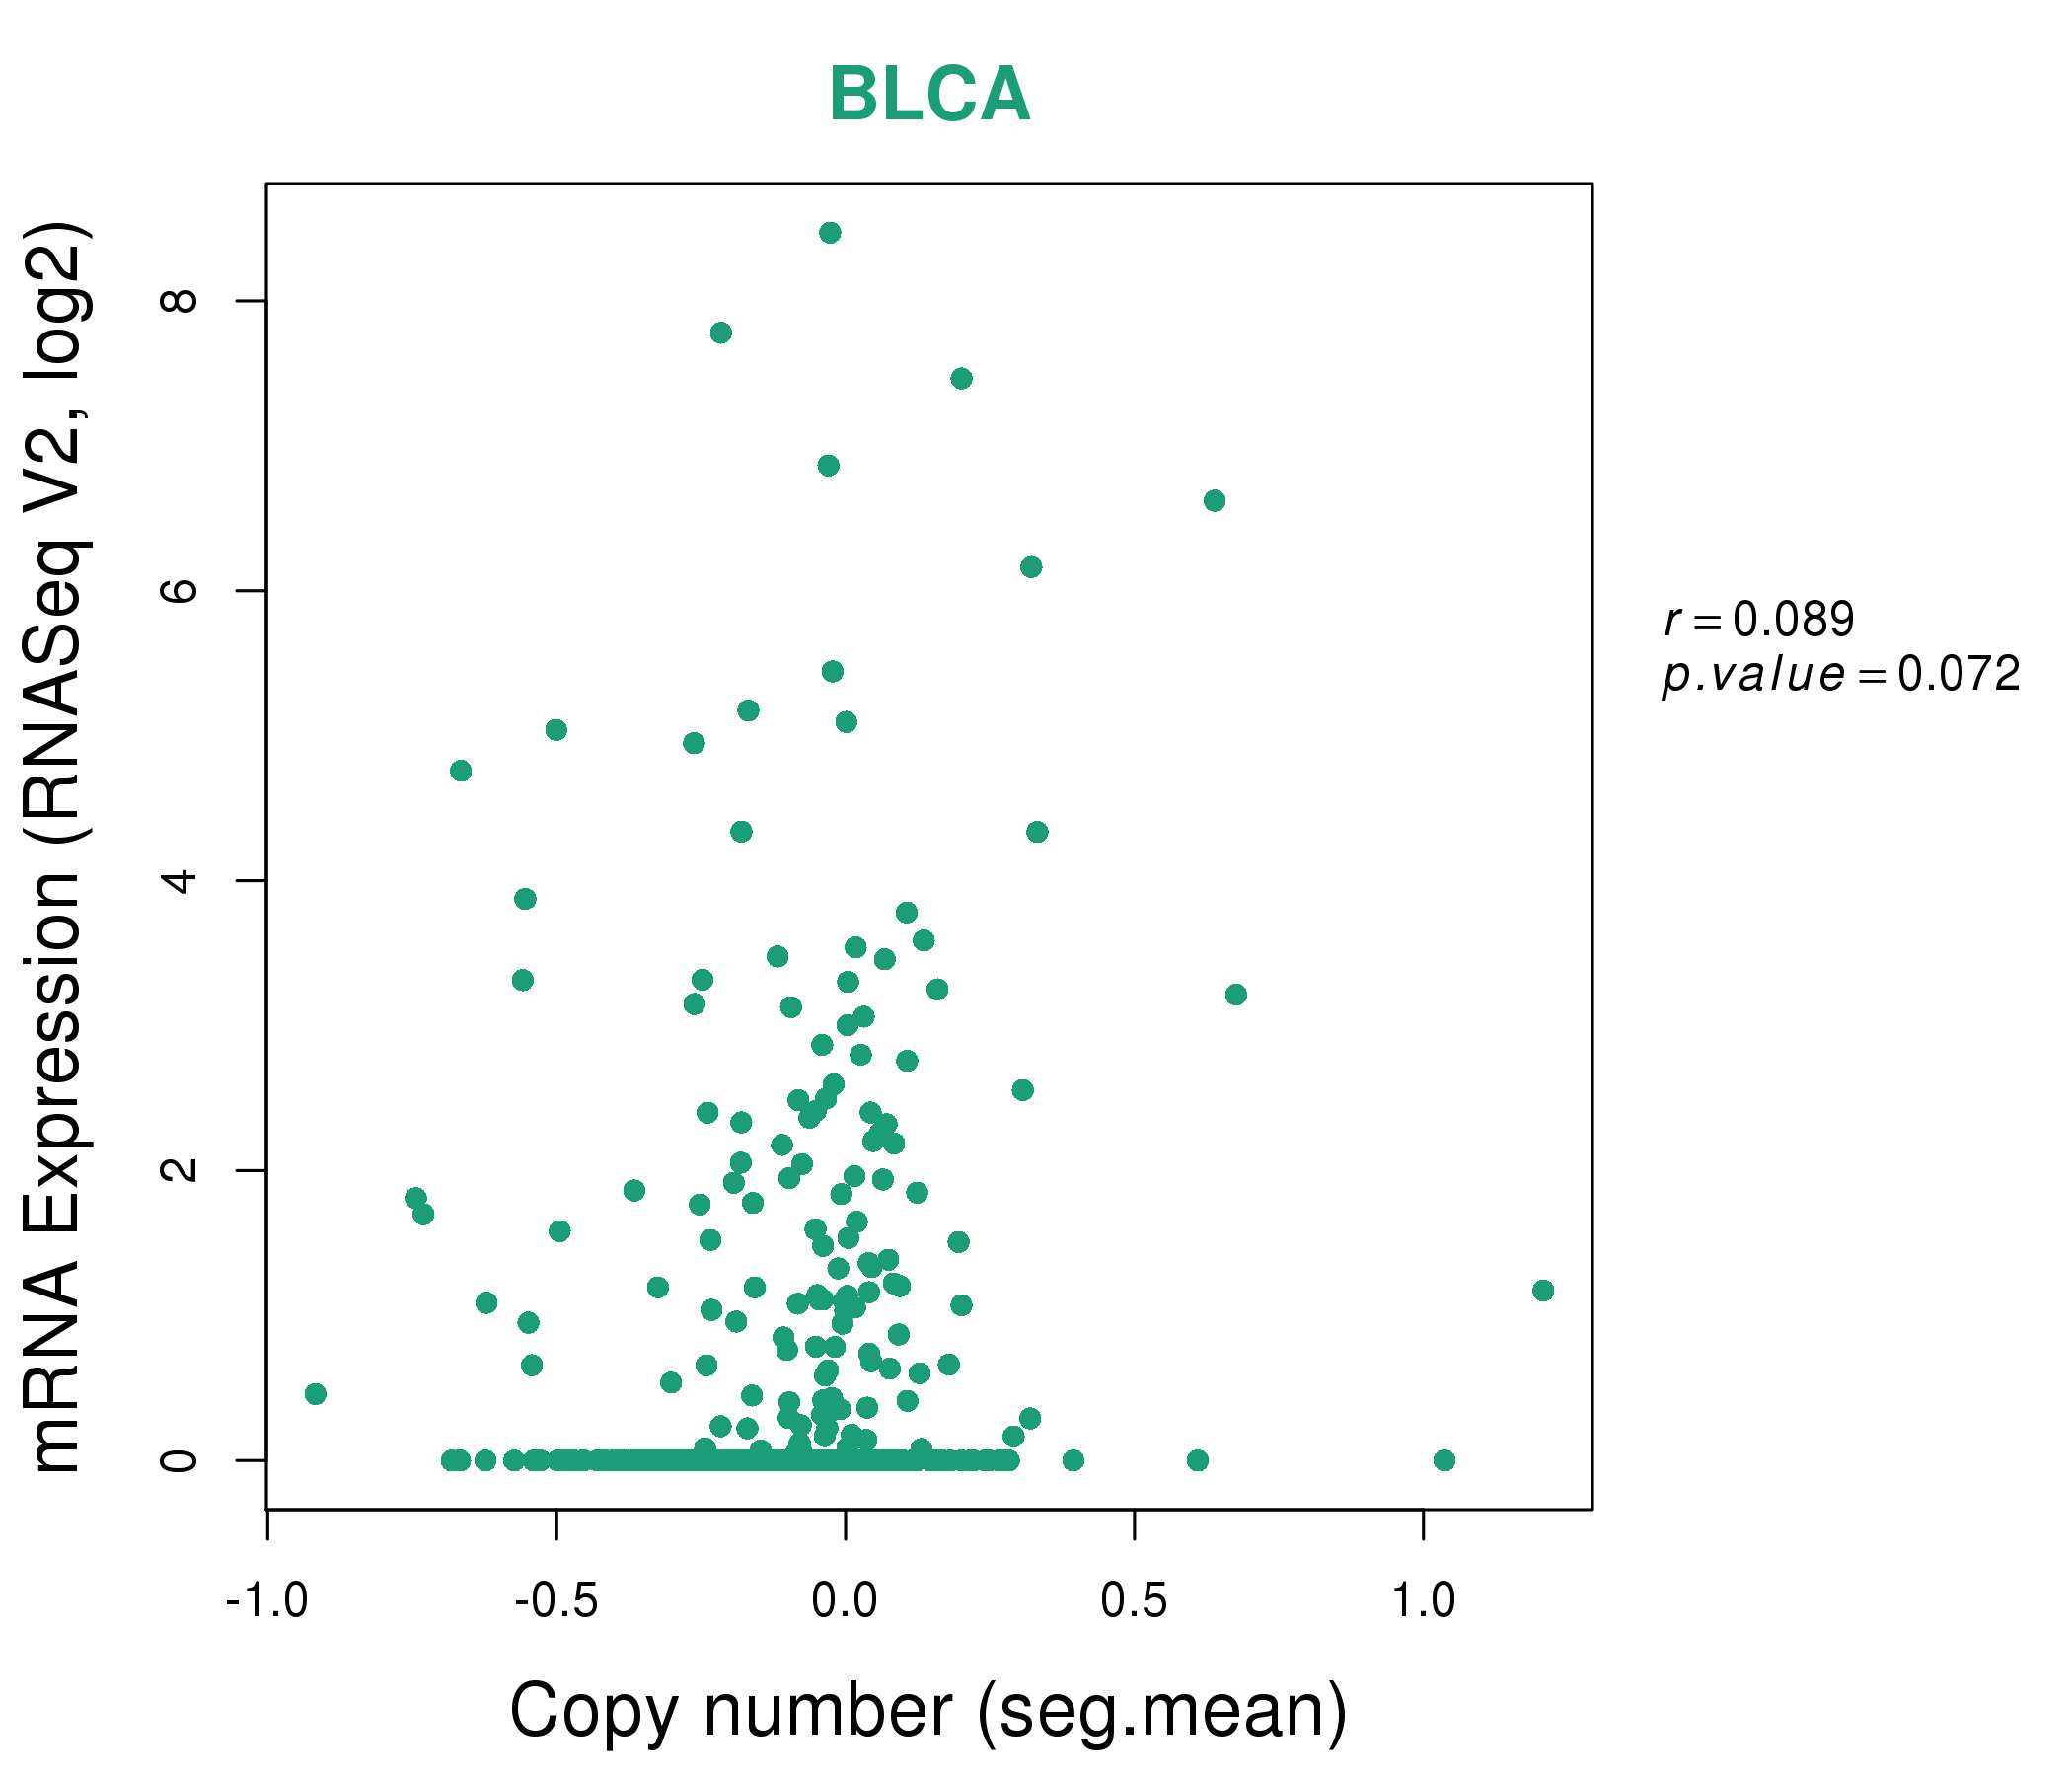
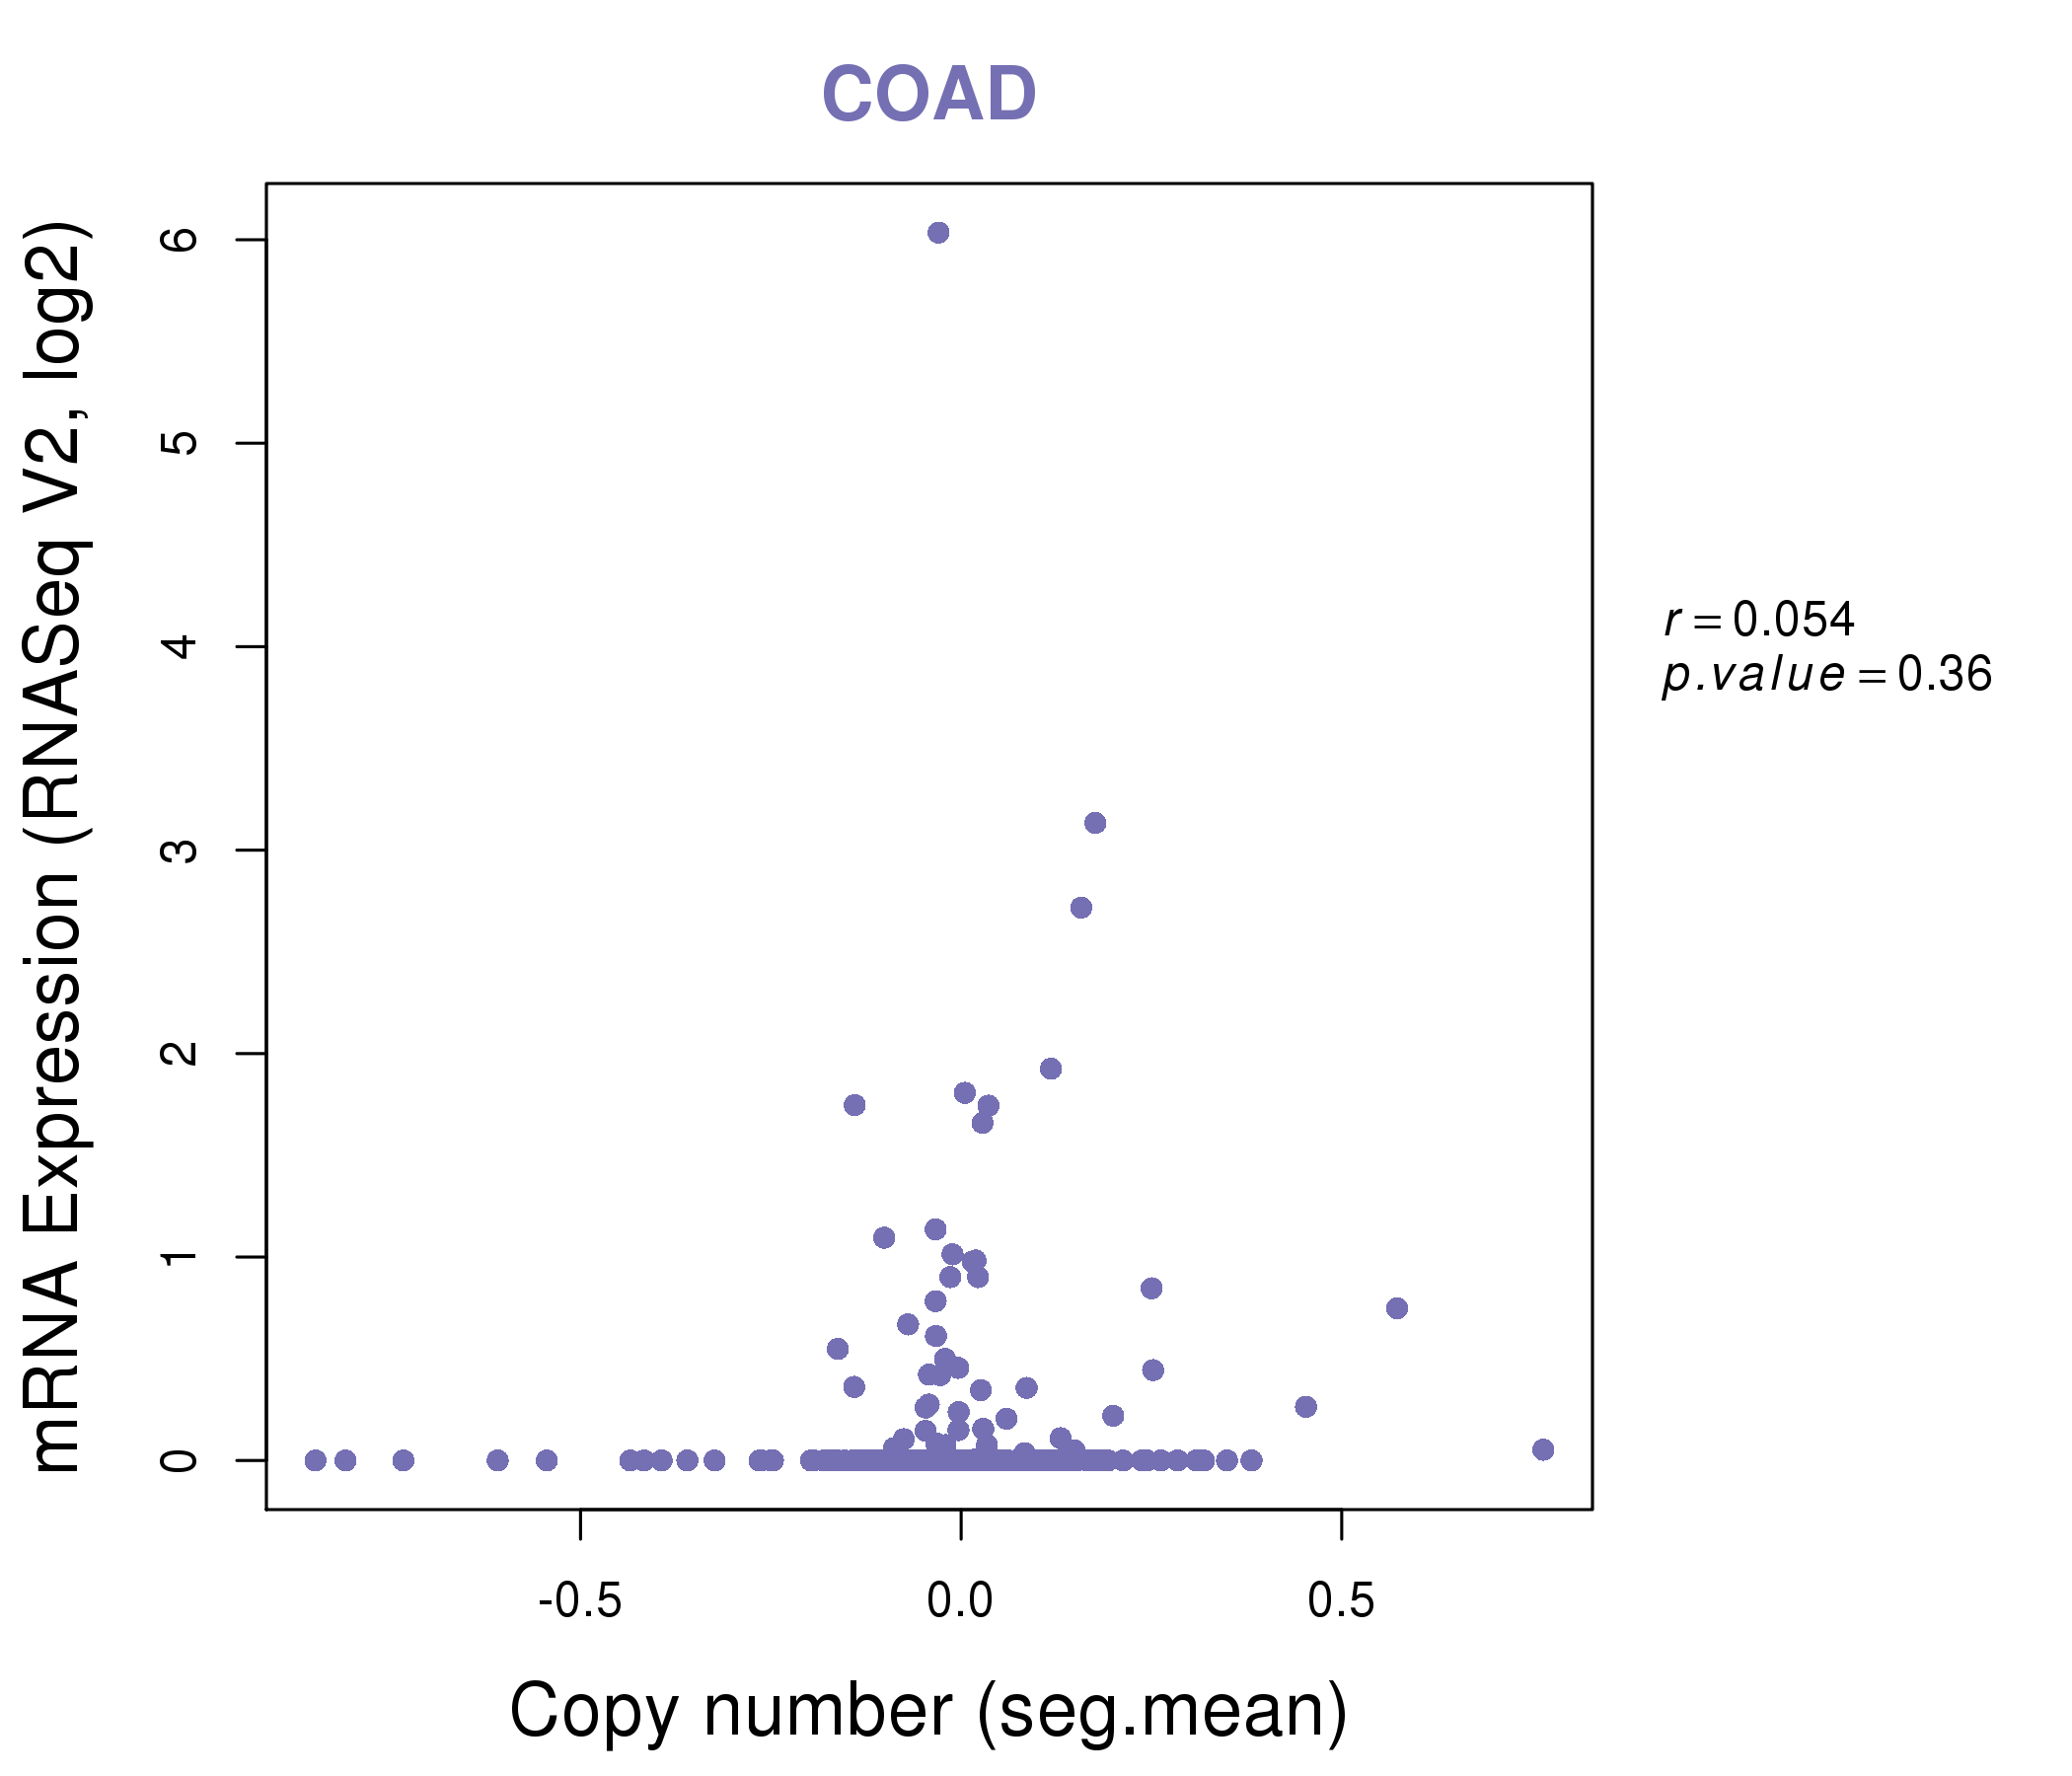
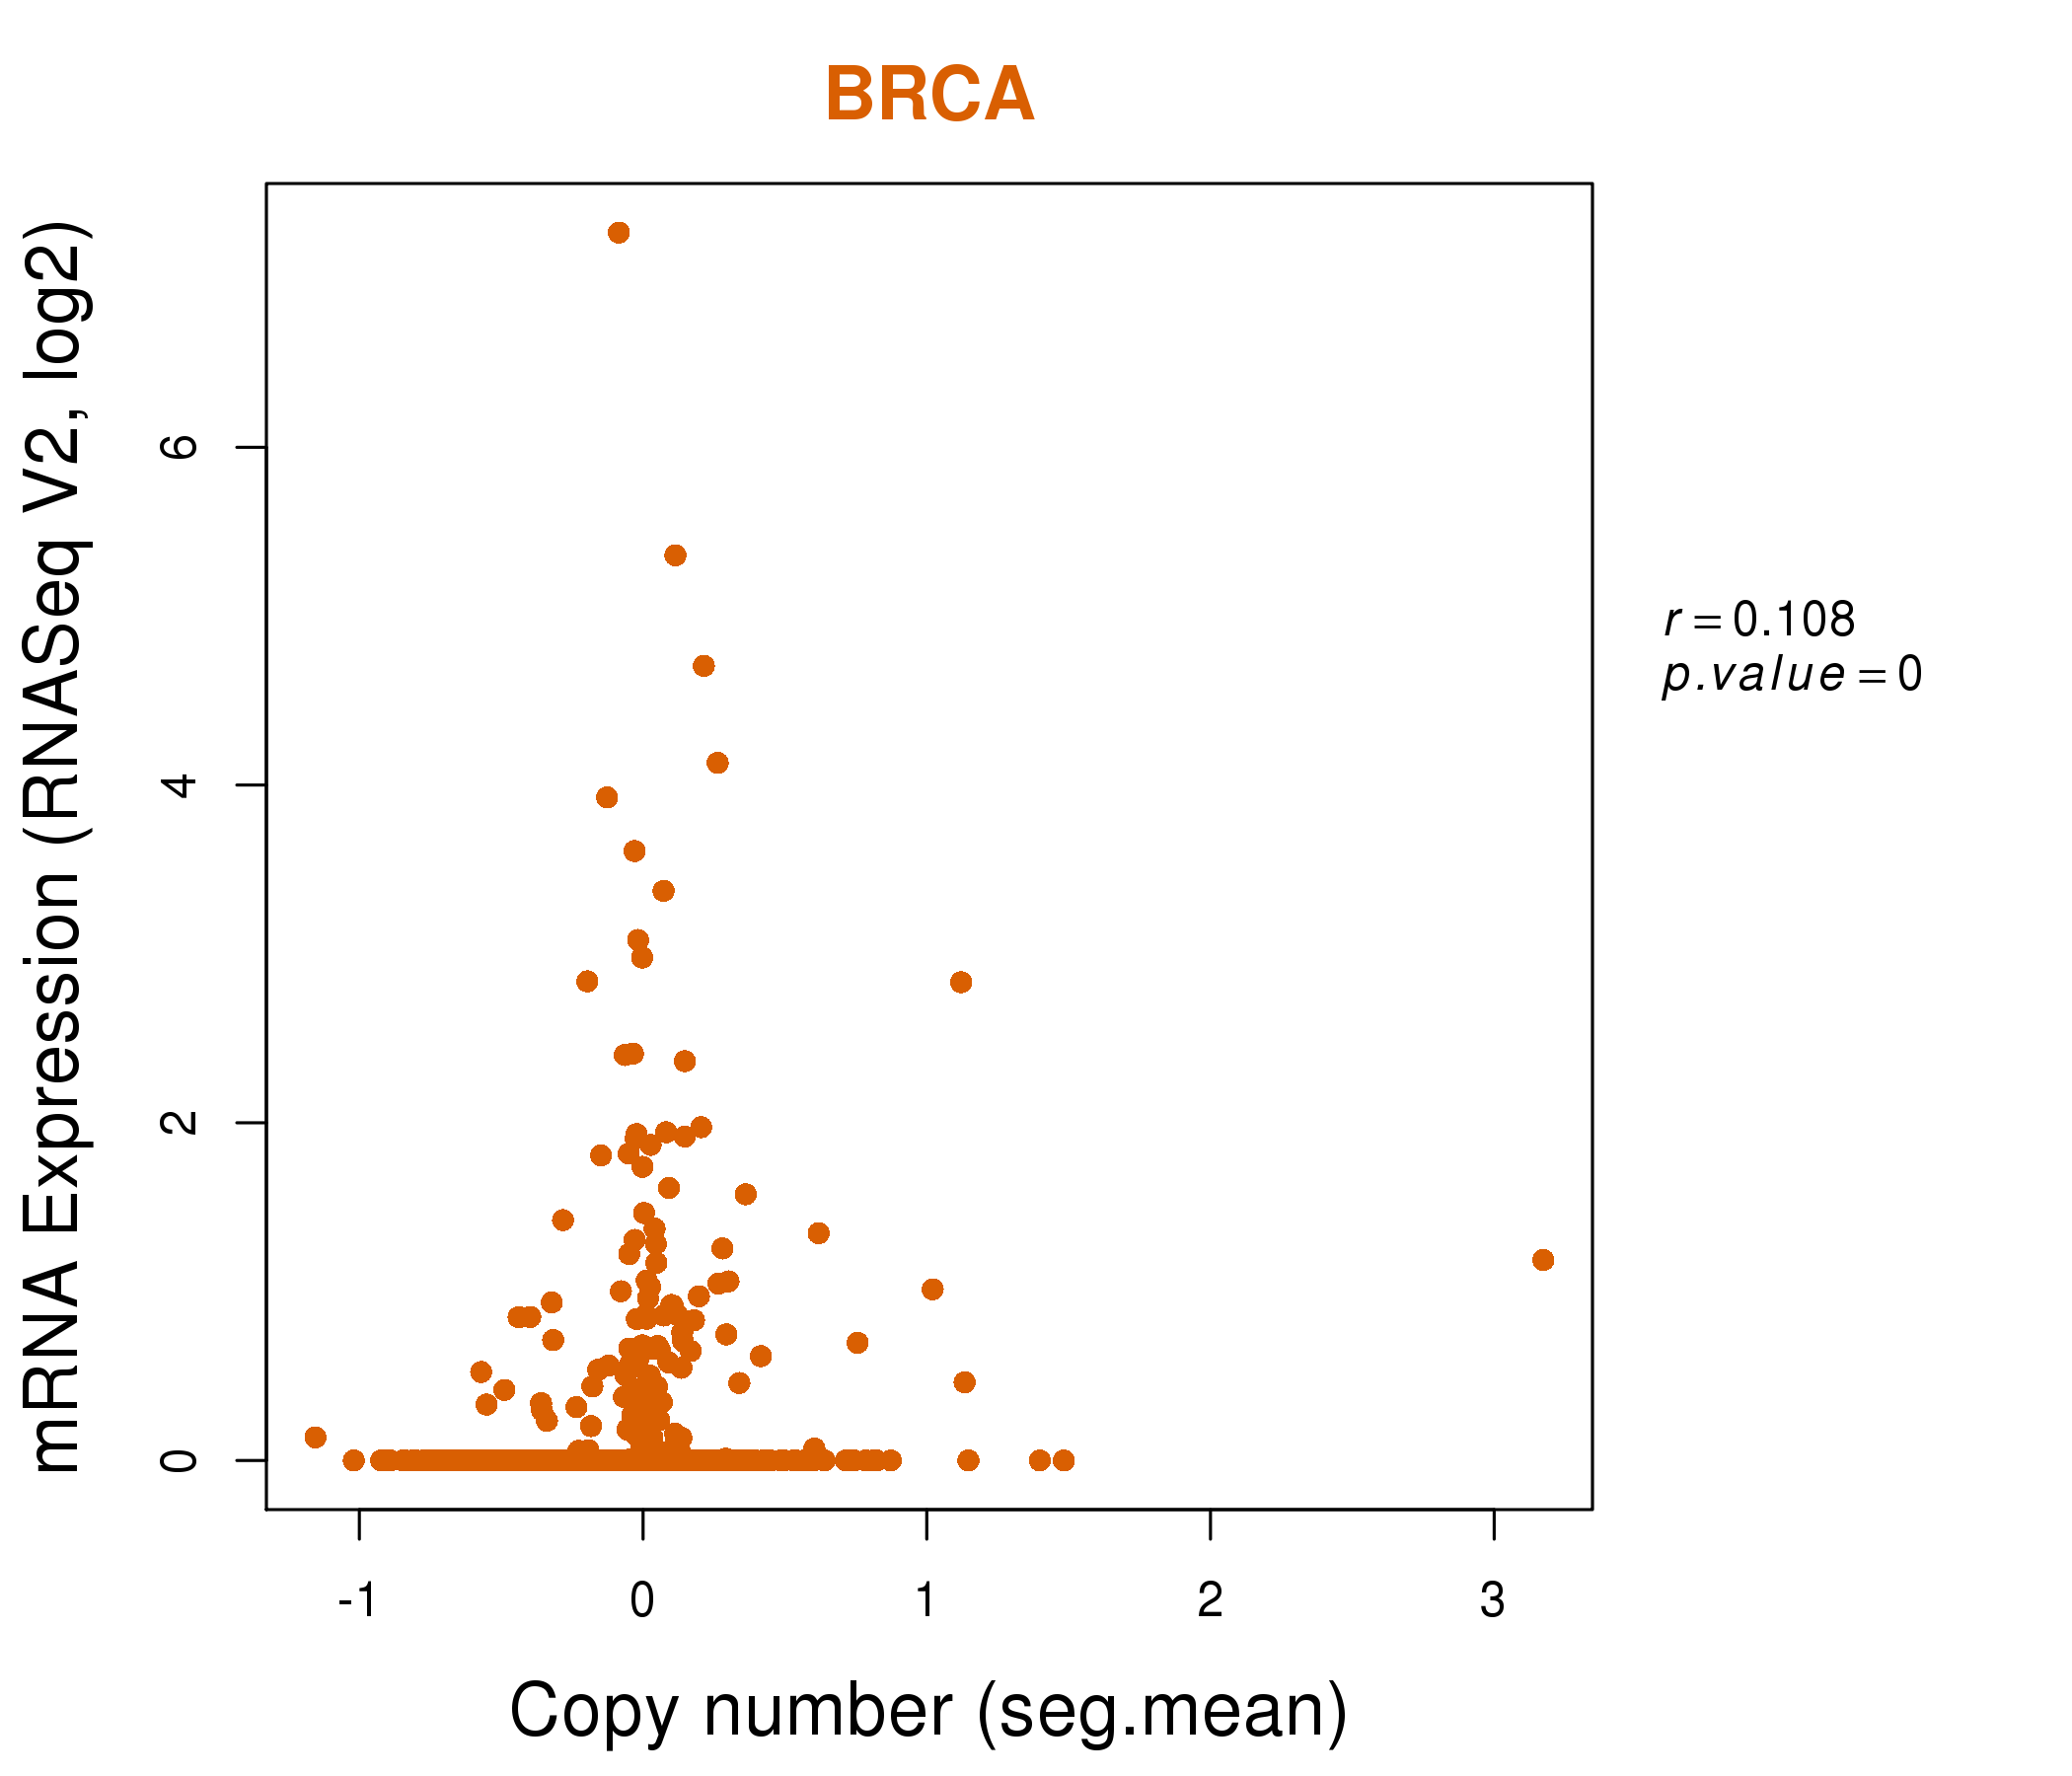
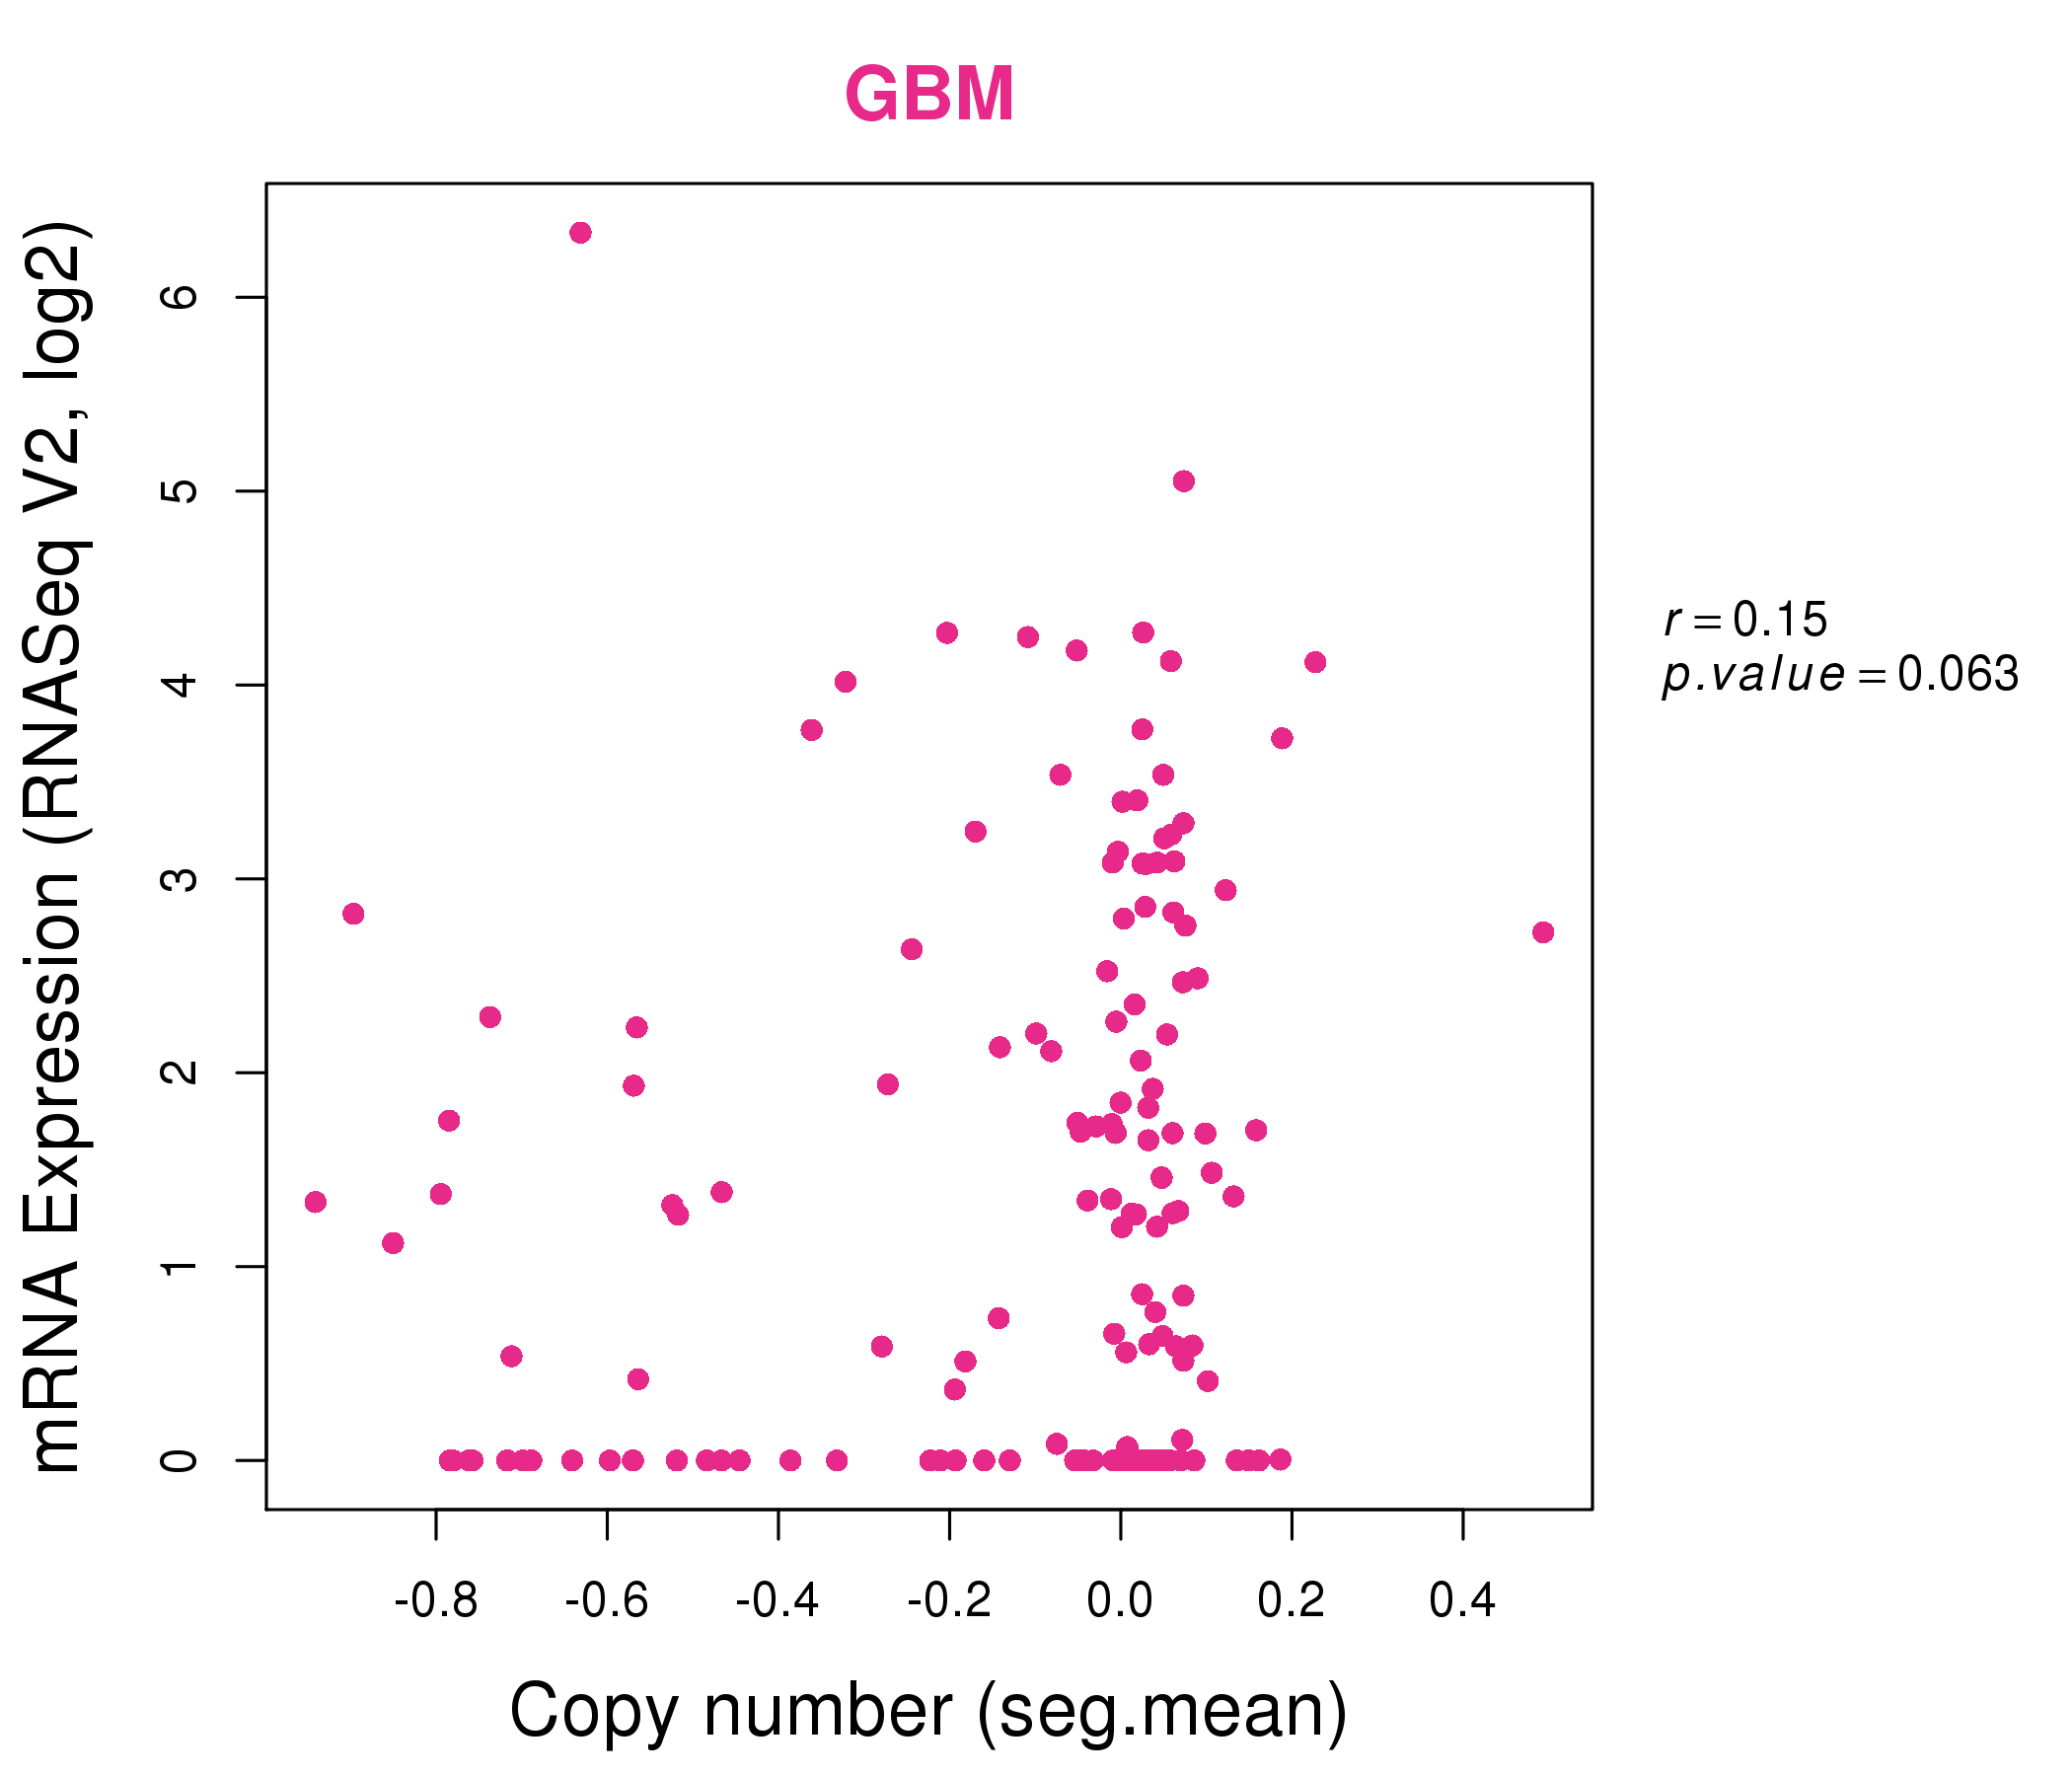
| * Normalized gene expression data of RNASeqV2 was extracted from TCGA using R package TCGA-Assembler. The URLs of all public data files on TCGA DCC data server were gathered at Jan-05-2015. Only eight cancer types have enough normal control samples for differential expression analysis. (t test, adjusted p<0.05 (using Benjamini-Hochberg FDR)) |
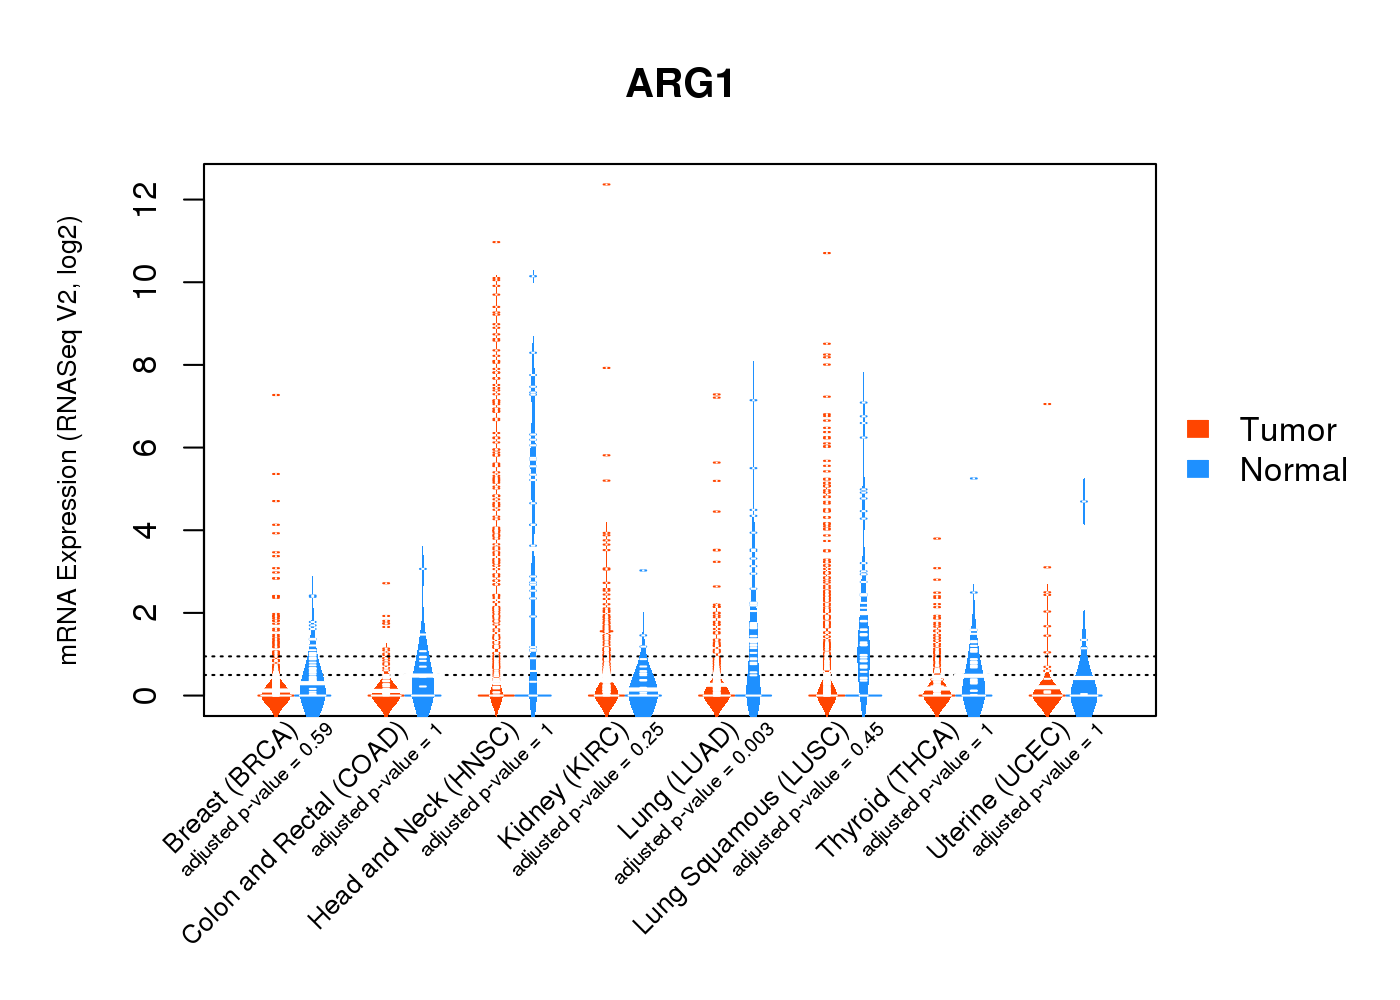 |
| Top |
| * This plots show the correlation between CNV and gene expression. |
: Open all plots for all cancer types
 |
|
 |
|
| Top |
| Gene-Gene Network Information |
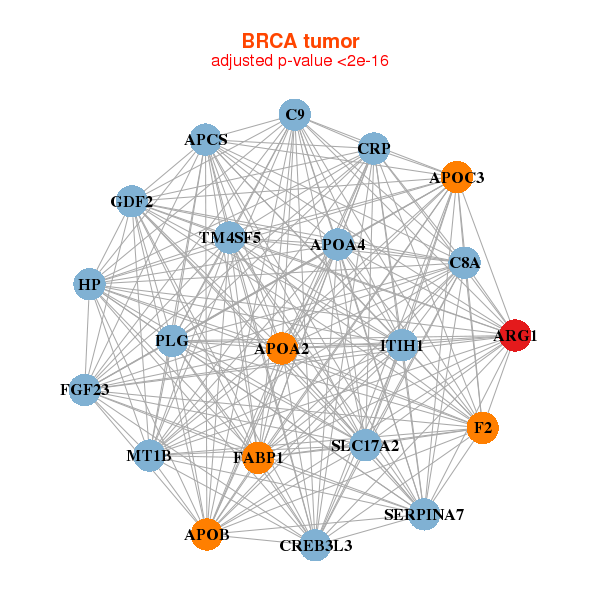
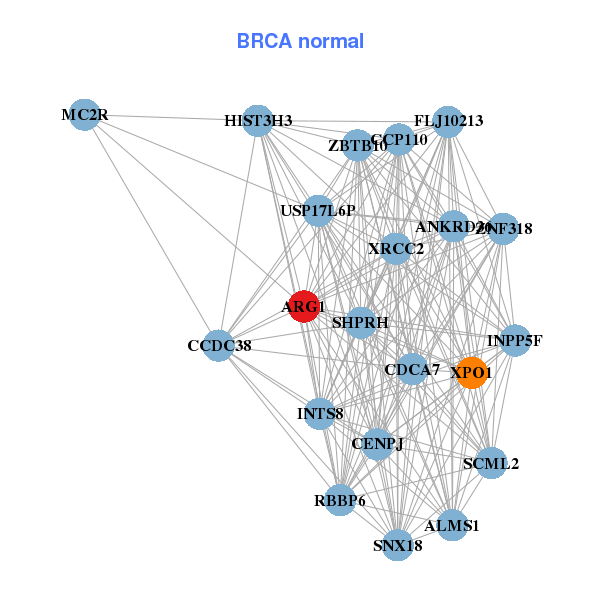
| * Co-Expression network figures were drawn using R package igraph. Only the top 20 genes with the highest correlations were shown. Red circle: input gene, orange circle: cell metabolism gene, sky circle: other gene |
: Open all plots for all cancer types
 |
| ||||
| APCS,APOA2,APOA4,APOB,APOC3,ARG1,C8A, C9,CREB3L3,CRP,F2,FABP1,FGF23,GDF2, HP,ITIH1,MT1B,PLG,SERPINA7,SLC17A2,TM4SF5 | ALMS1,ANKRD36,ARG1,CCDC38,CDCA7,CENPJ,CCP110, FLJ10213,HIST3H3,INPP5F,INTS8,MC2R,RBBP6,SCML2, SHPRH,SNX18,USP17L6P,XPO1,XRCC2,ZBTB10,ZNF318 | ||||
 |
| ||||
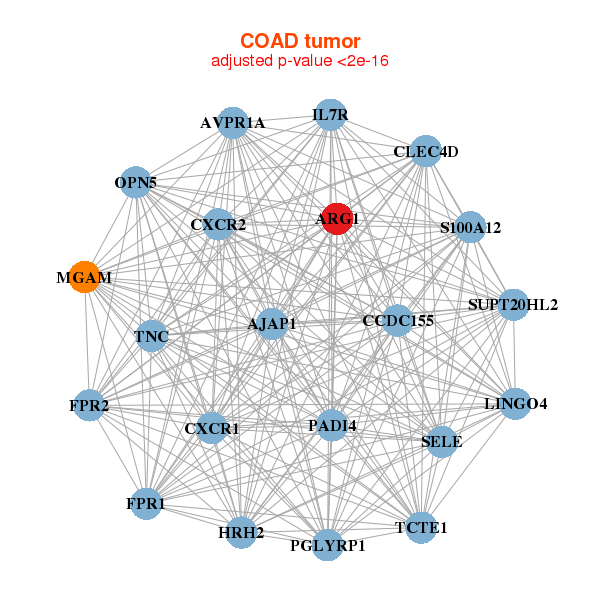
| AJAP1,ARG1,AVPR1A,CCDC155,CLEC4D,CXCR1,CXCR2, SUPT20HL2,FPR1,FPR2,HRH2,IL7R,LINGO4,MGAM, OPN5,PADI4,PGLYRP1,S100A12,SELE,TCTE1,TNC | SLC35G3,ARG1,BEND2,LINC00305,CMTM2,CXCR2,FAM74A4, GAGE10,LRIT1,NXF4,OR52E2,OR52E6,PADI4,PLCZ1, SELE,SLC22A24,SPRR2G,SSX5,STRA8,TREML4,ZNF735 |
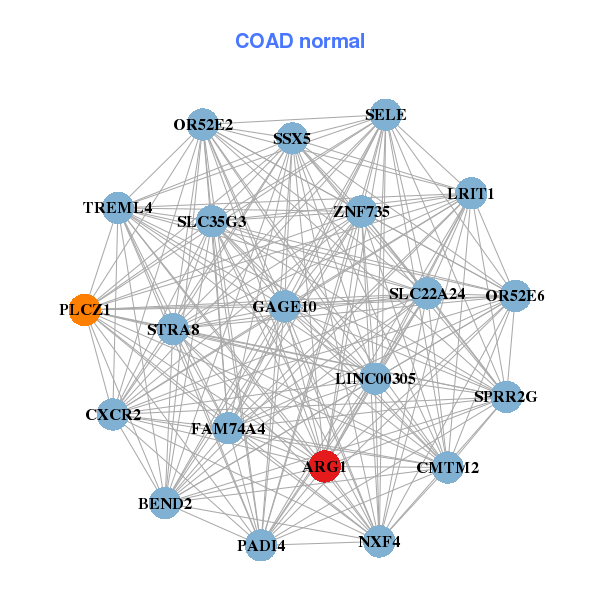
| * Co-Expression network figures were drawn using R package igraph. Only the top 20 genes with the highest correlations were shown. Red circle: input gene, orange circle: cell metabolism gene, sky circle: other gene |
: Open all plots for all cancer types
| Top |
: Open all interacting genes' information including KEGG pathway for all interacting genes from DAVID
| Top |
| Pharmacological Information for ARG1 |
| DB Category | DB Name | DB's ID and Url link |
| Chemistry | BindingDB | P05089; -. |
| Chemistry | ChEMBL | CHEMBL1075097; -. |
| Organism-specific databases | PharmGKB | PA24947; -. |
| Organism-specific databases | CTD | 383; -. |
| * Gene Centered Interaction Network. |
 |
| * Drug Centered Interaction Network. |
| DrugBank ID | Target Name | Drug Groups | Generic Name | Drug Centered Network | Drug Structure |
| DB00129 | arginase, liver | approved; nutraceutical | L-Ornithine | 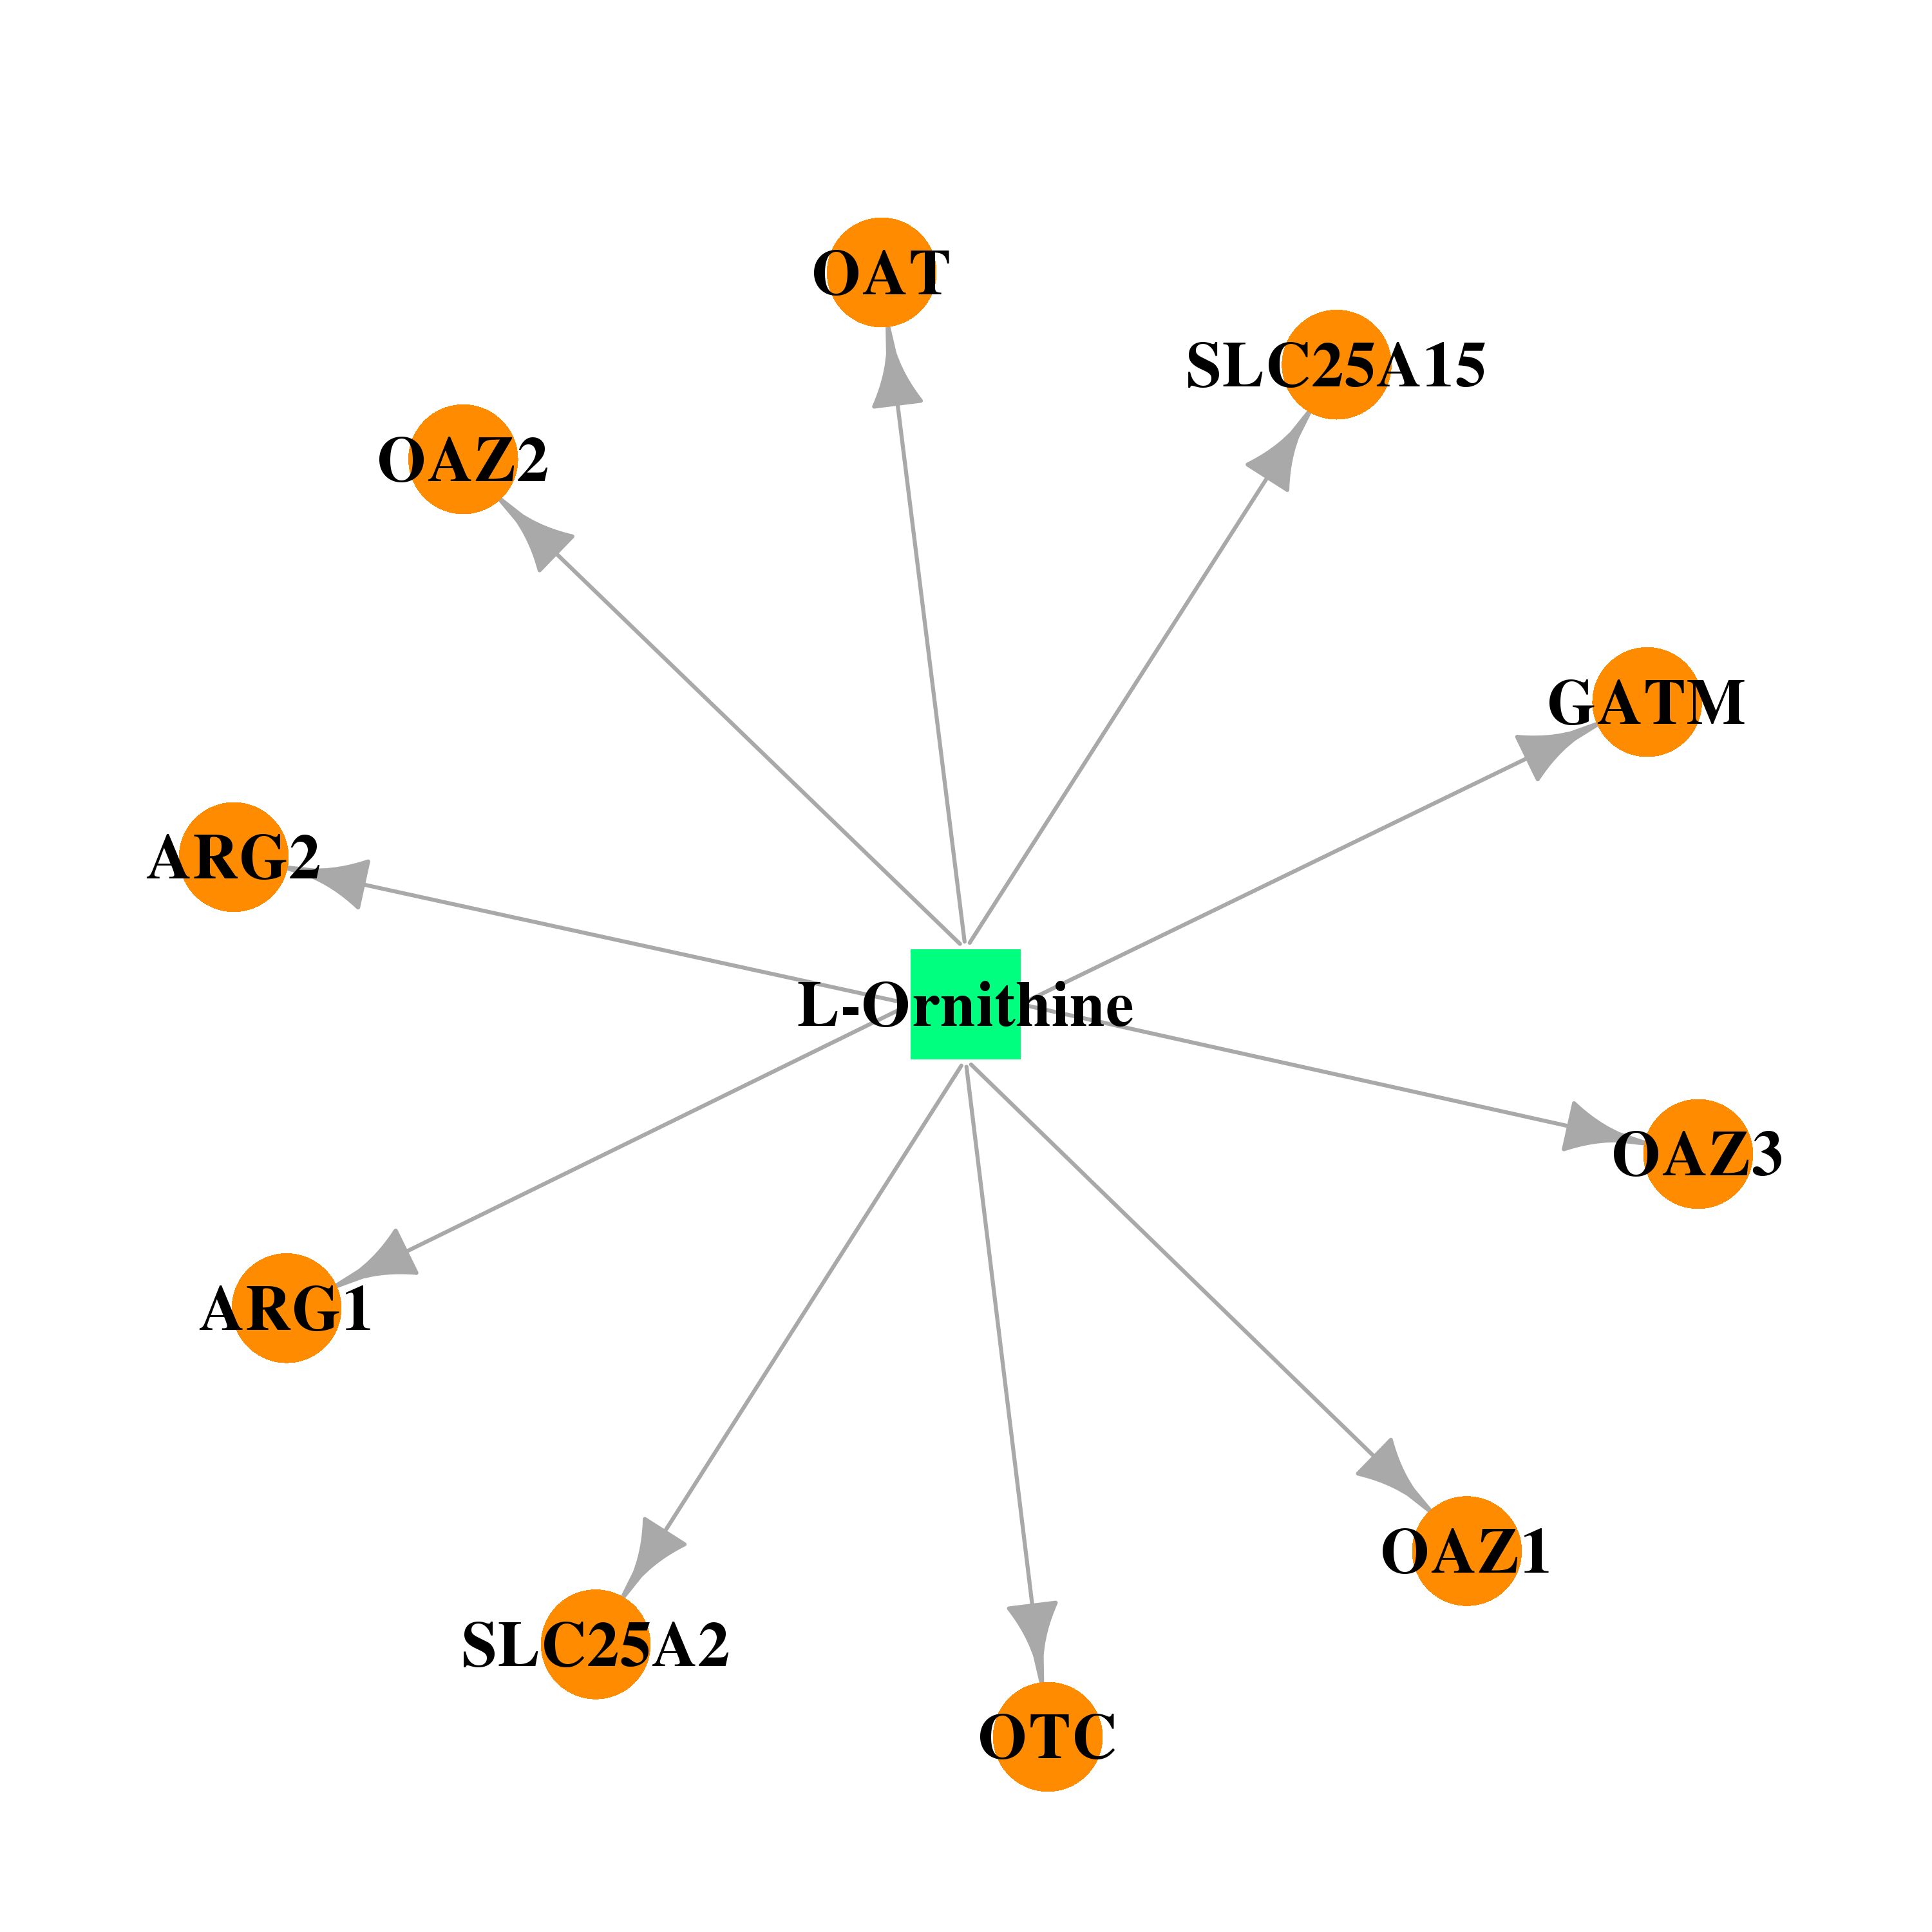 | 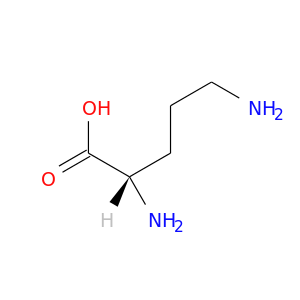 |
| DB01983 | arginase, liver | experimental | 2(S)-Amino-6-Boronohexanoic Acid | 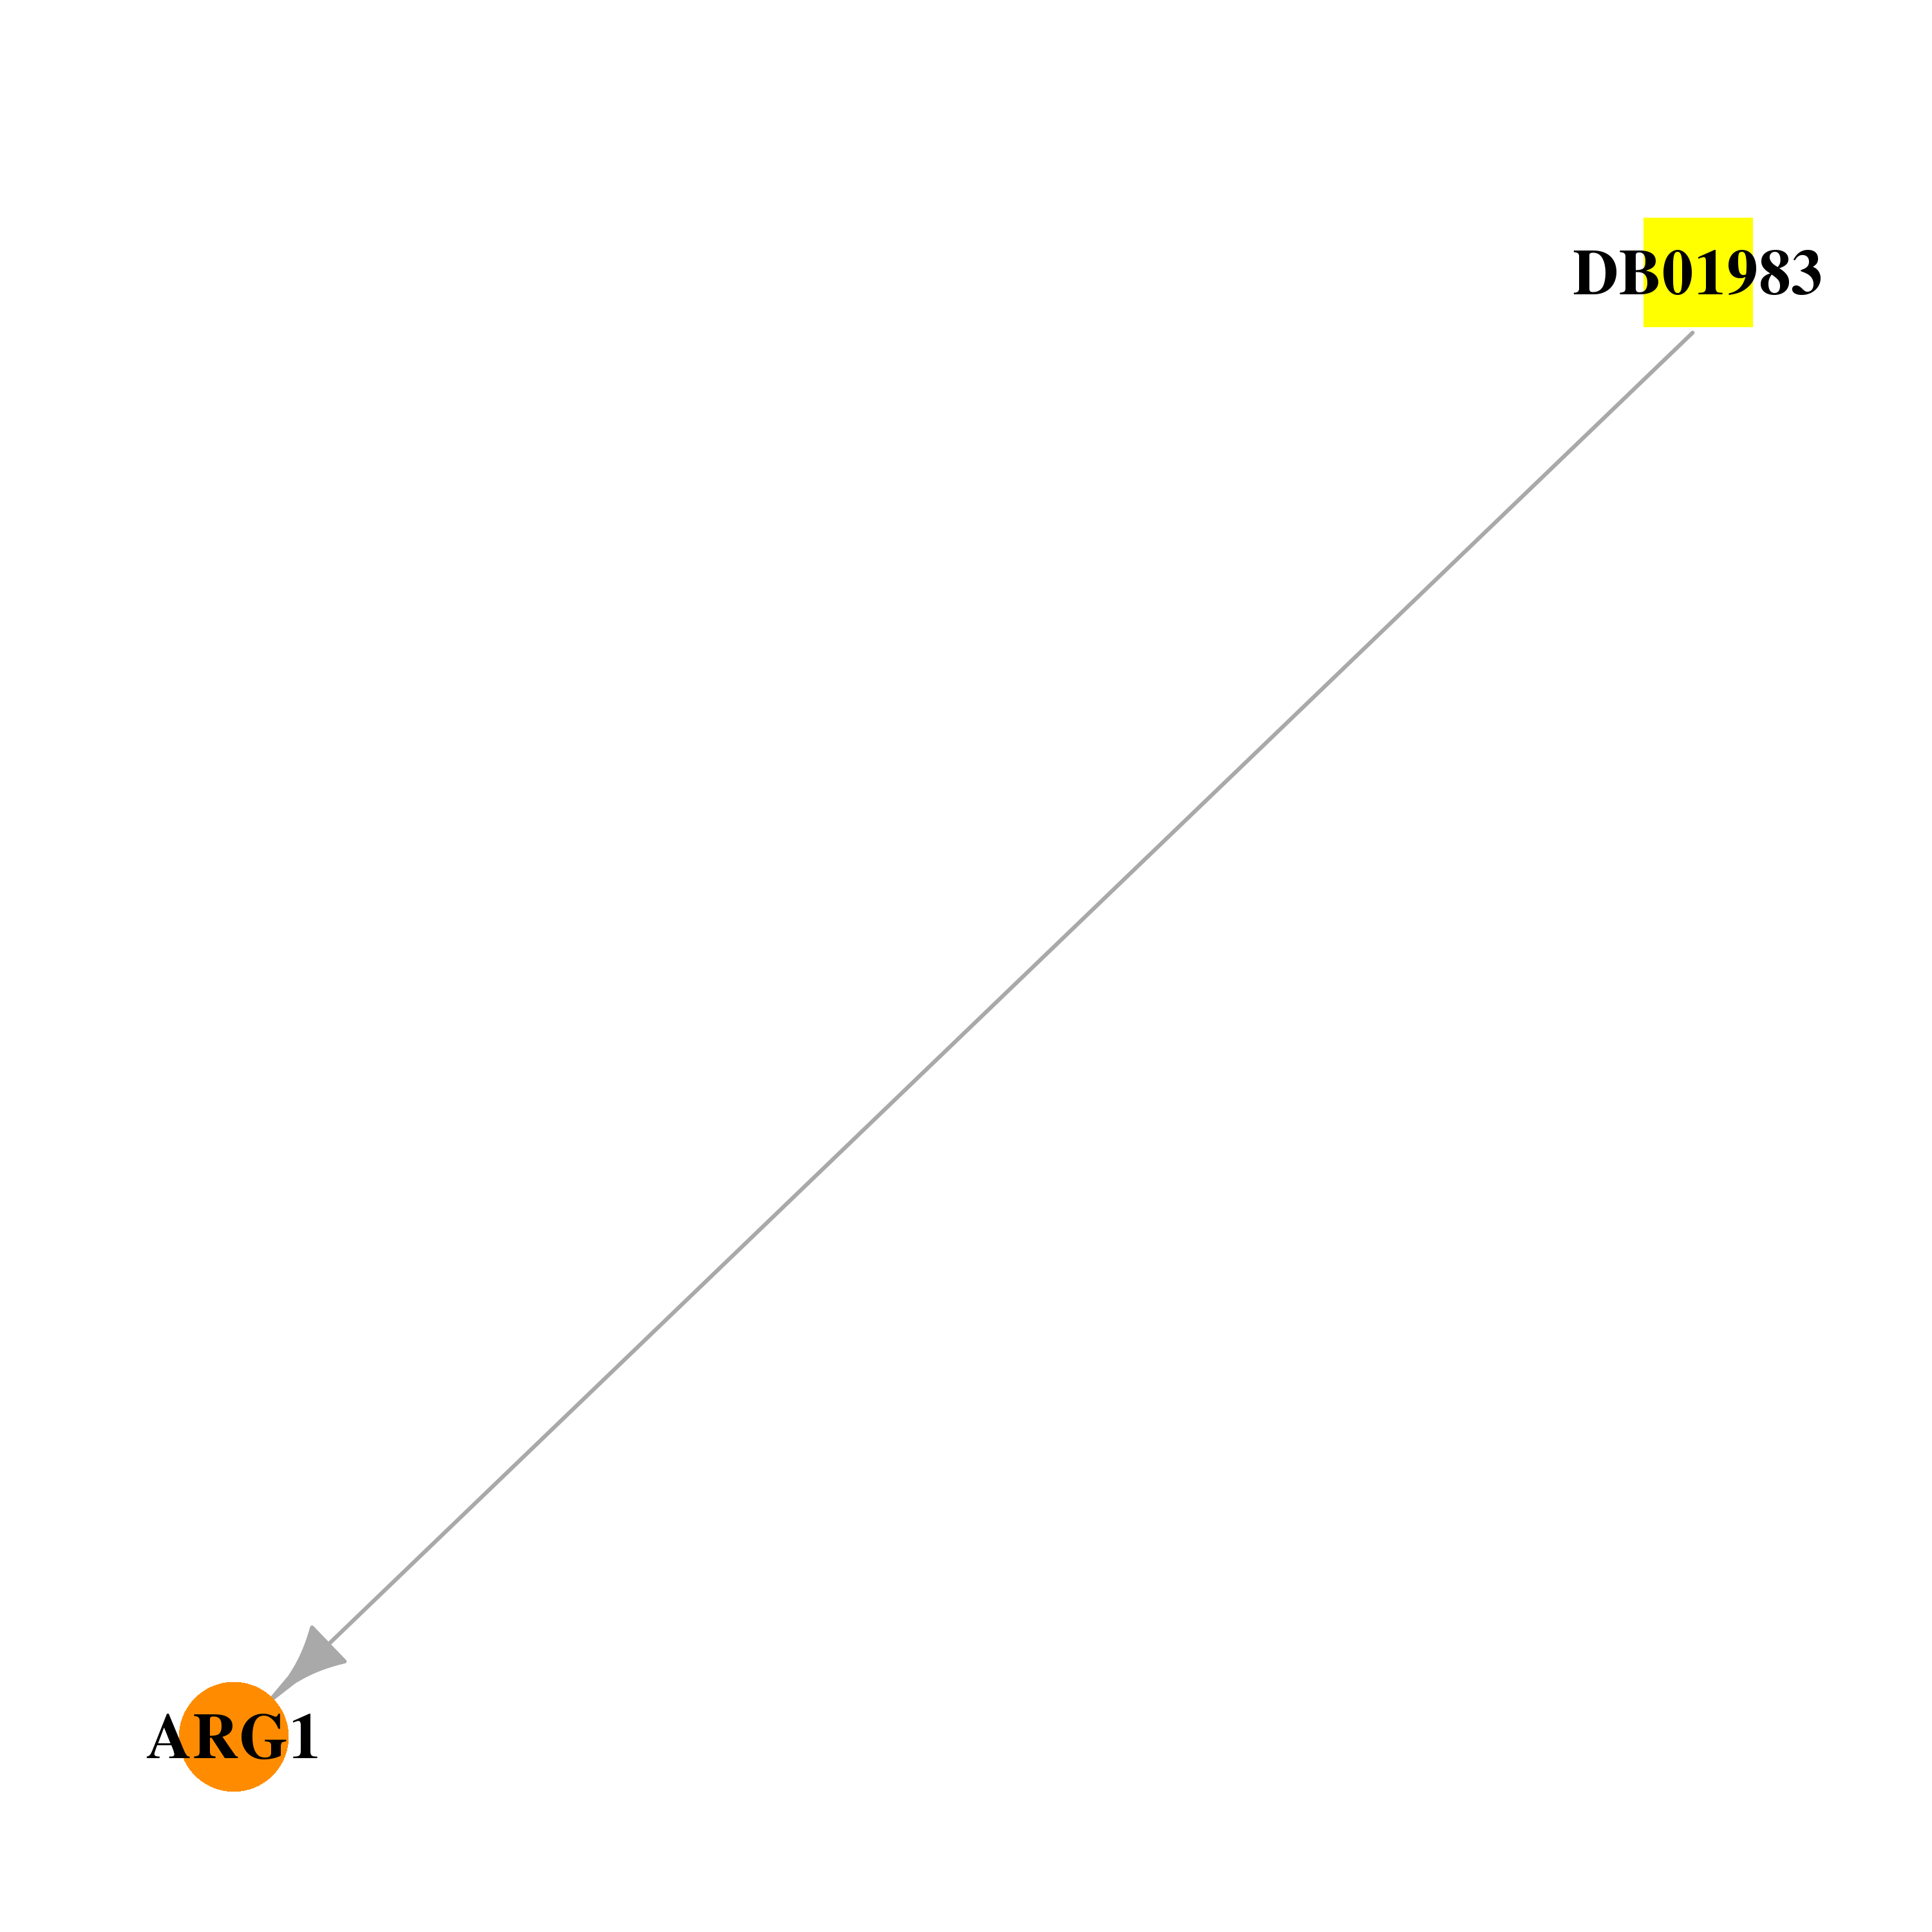 | 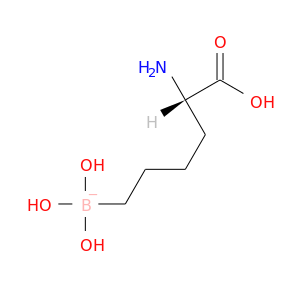 |
| DB02381 | arginase, liver | experimental | Nor-N-Omega-Hydroxy-L-Arginine | 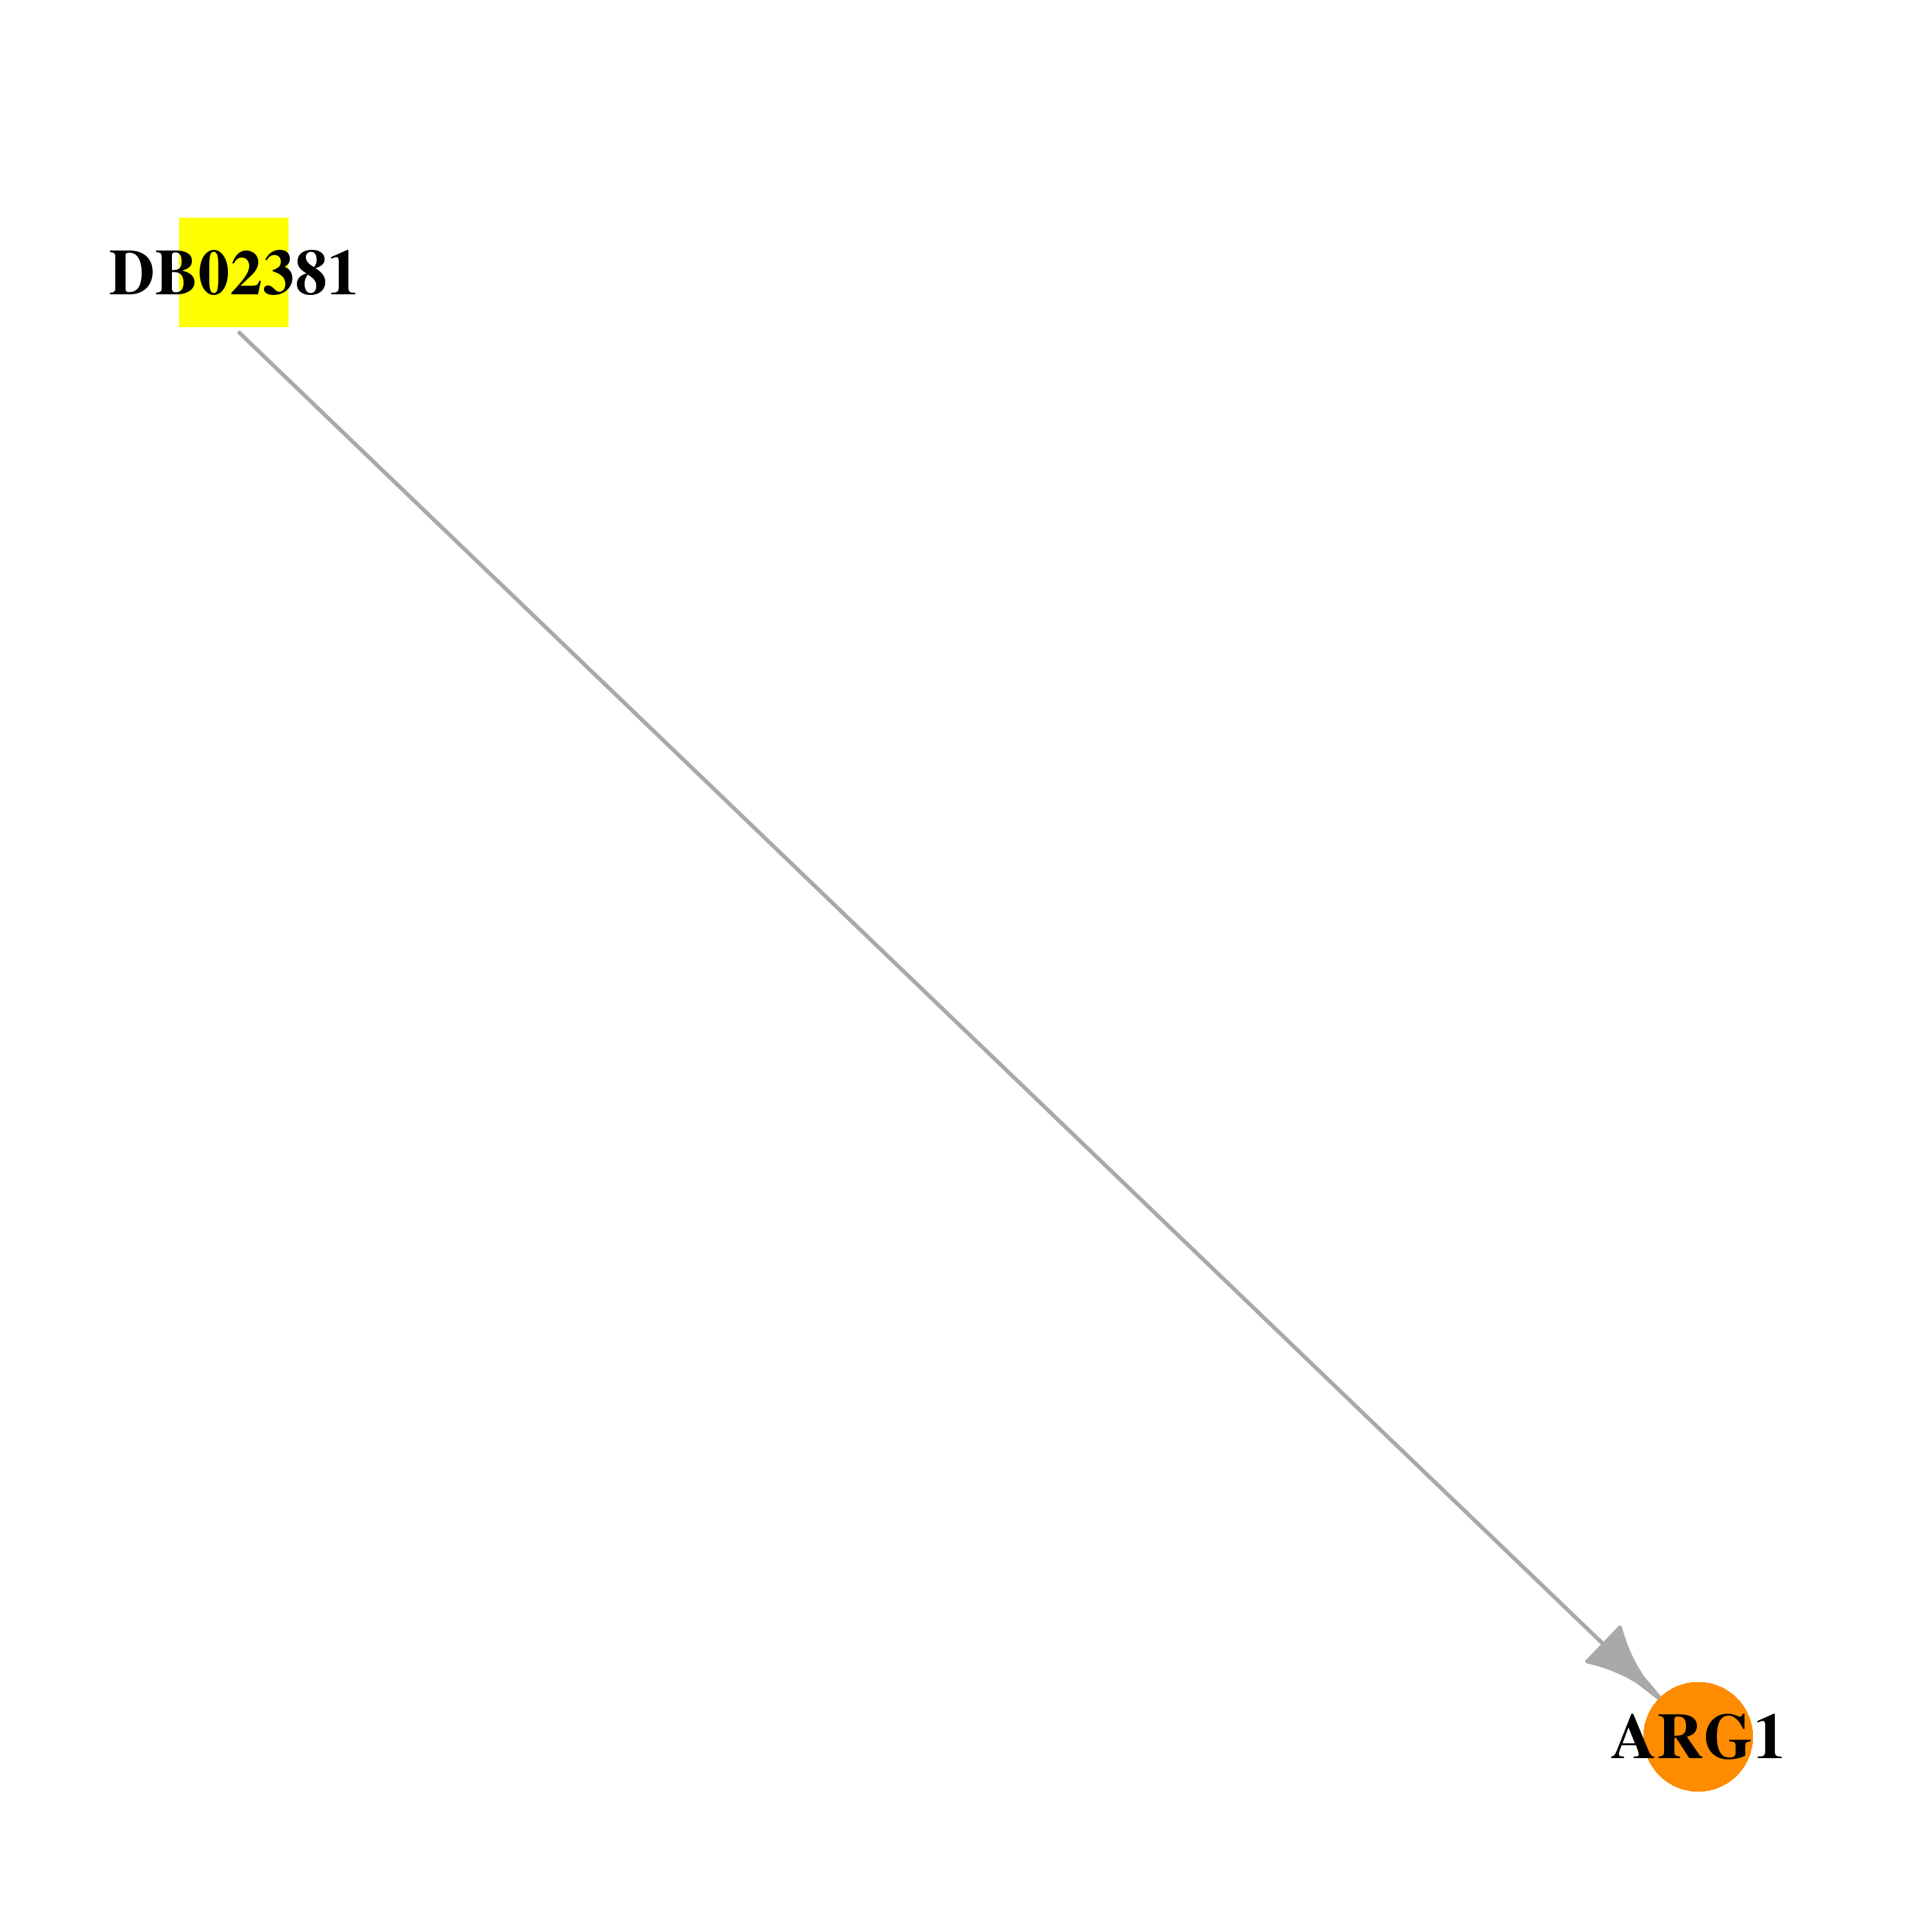 | 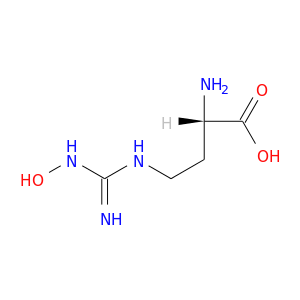 |
| DB02499 | arginase, liver | experimental | Dinor-N(Omega)-Hydroxy-L-Arginine |  | 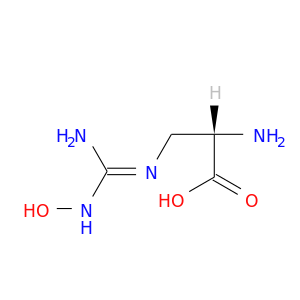 |
| DB02689 | arginase, liver | experimental | S-{2-[Amino(Dihydroxy)-Lambda~4~-Sulfanyl]Ethyl}-D-Cysteine |  | 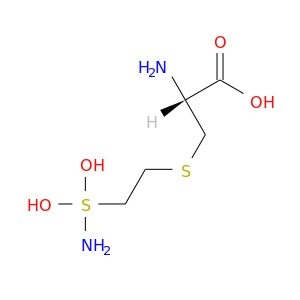 |
| DB03144 | arginase, liver | experimental | N-Omega-Hydroxy-L-Arginine | 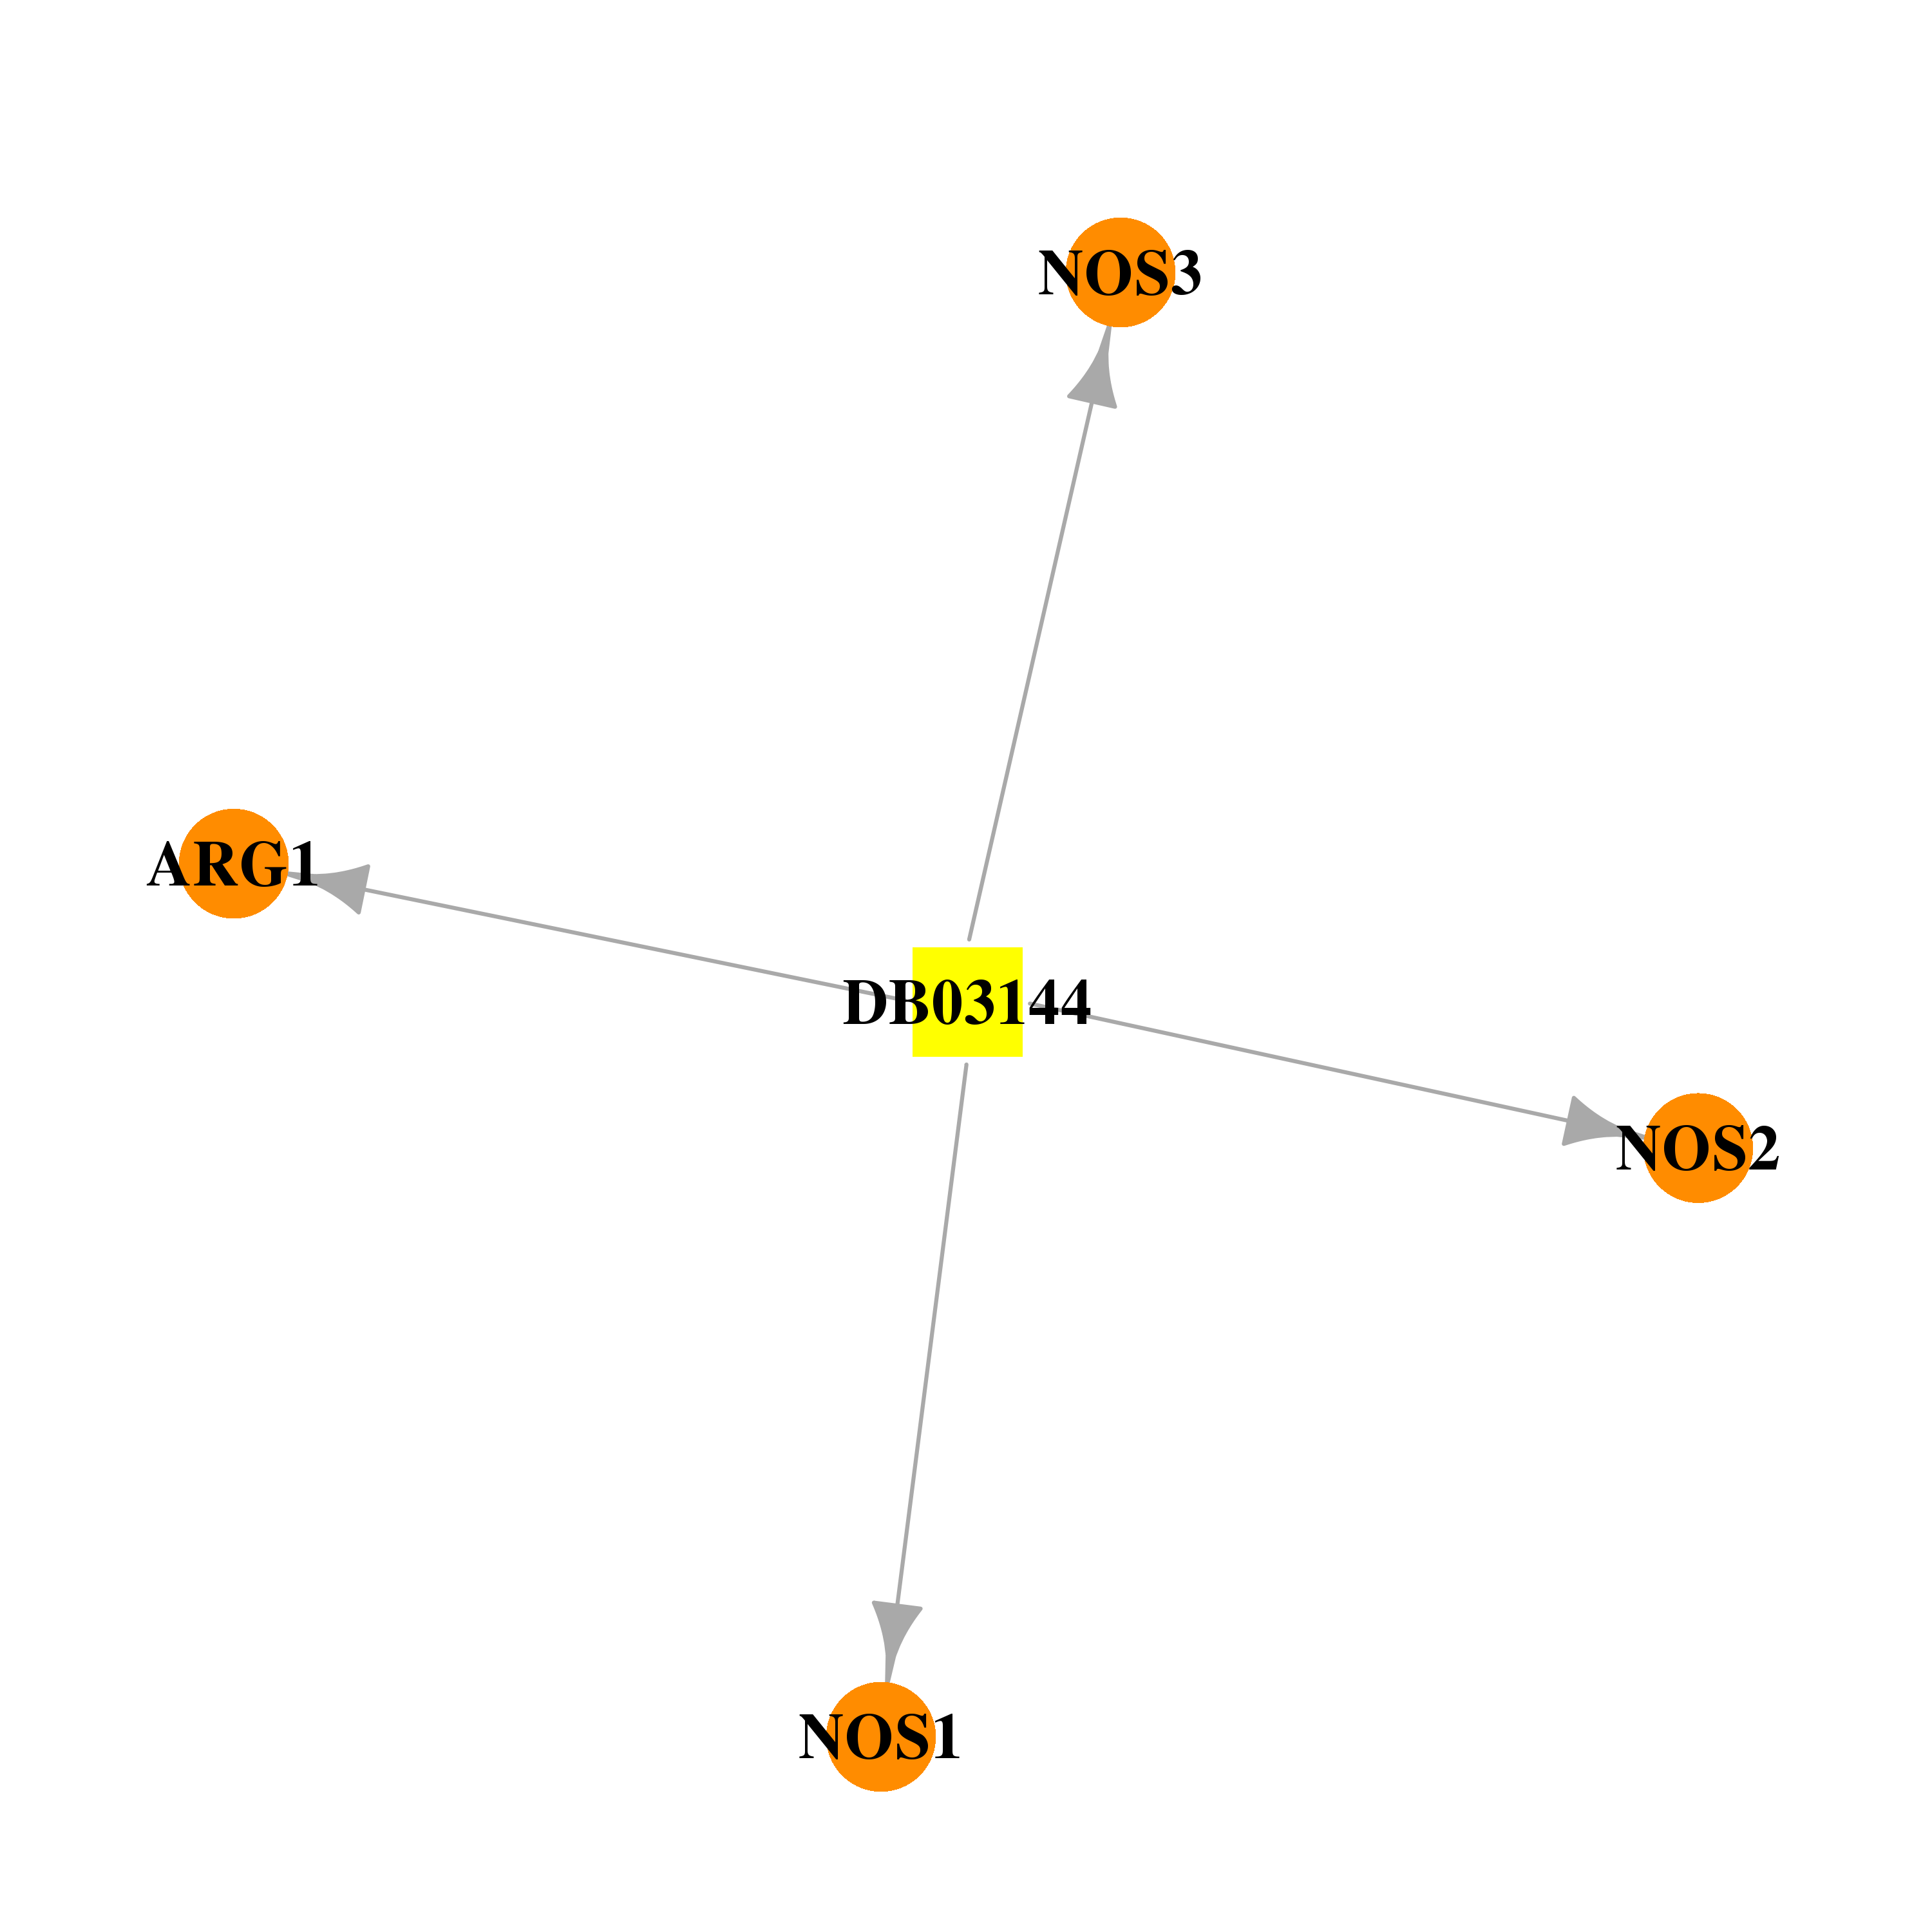 | 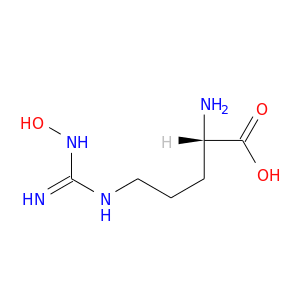 |
| DB03731 | arginase, liver | experimental | S-2-(Boronoethyl)-L-Cysteine |  | 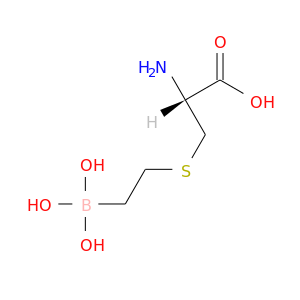 |
| DB03904 | arginase, liver | experimental | Urea |  | 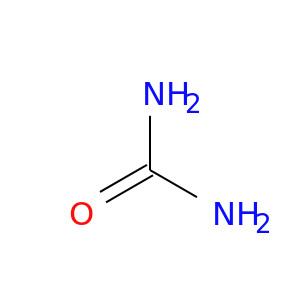 |
| DB04197 | arginase, liver | experimental | Descarboxy-nor-N(Omega)-Hydroxy-L-Arginine | 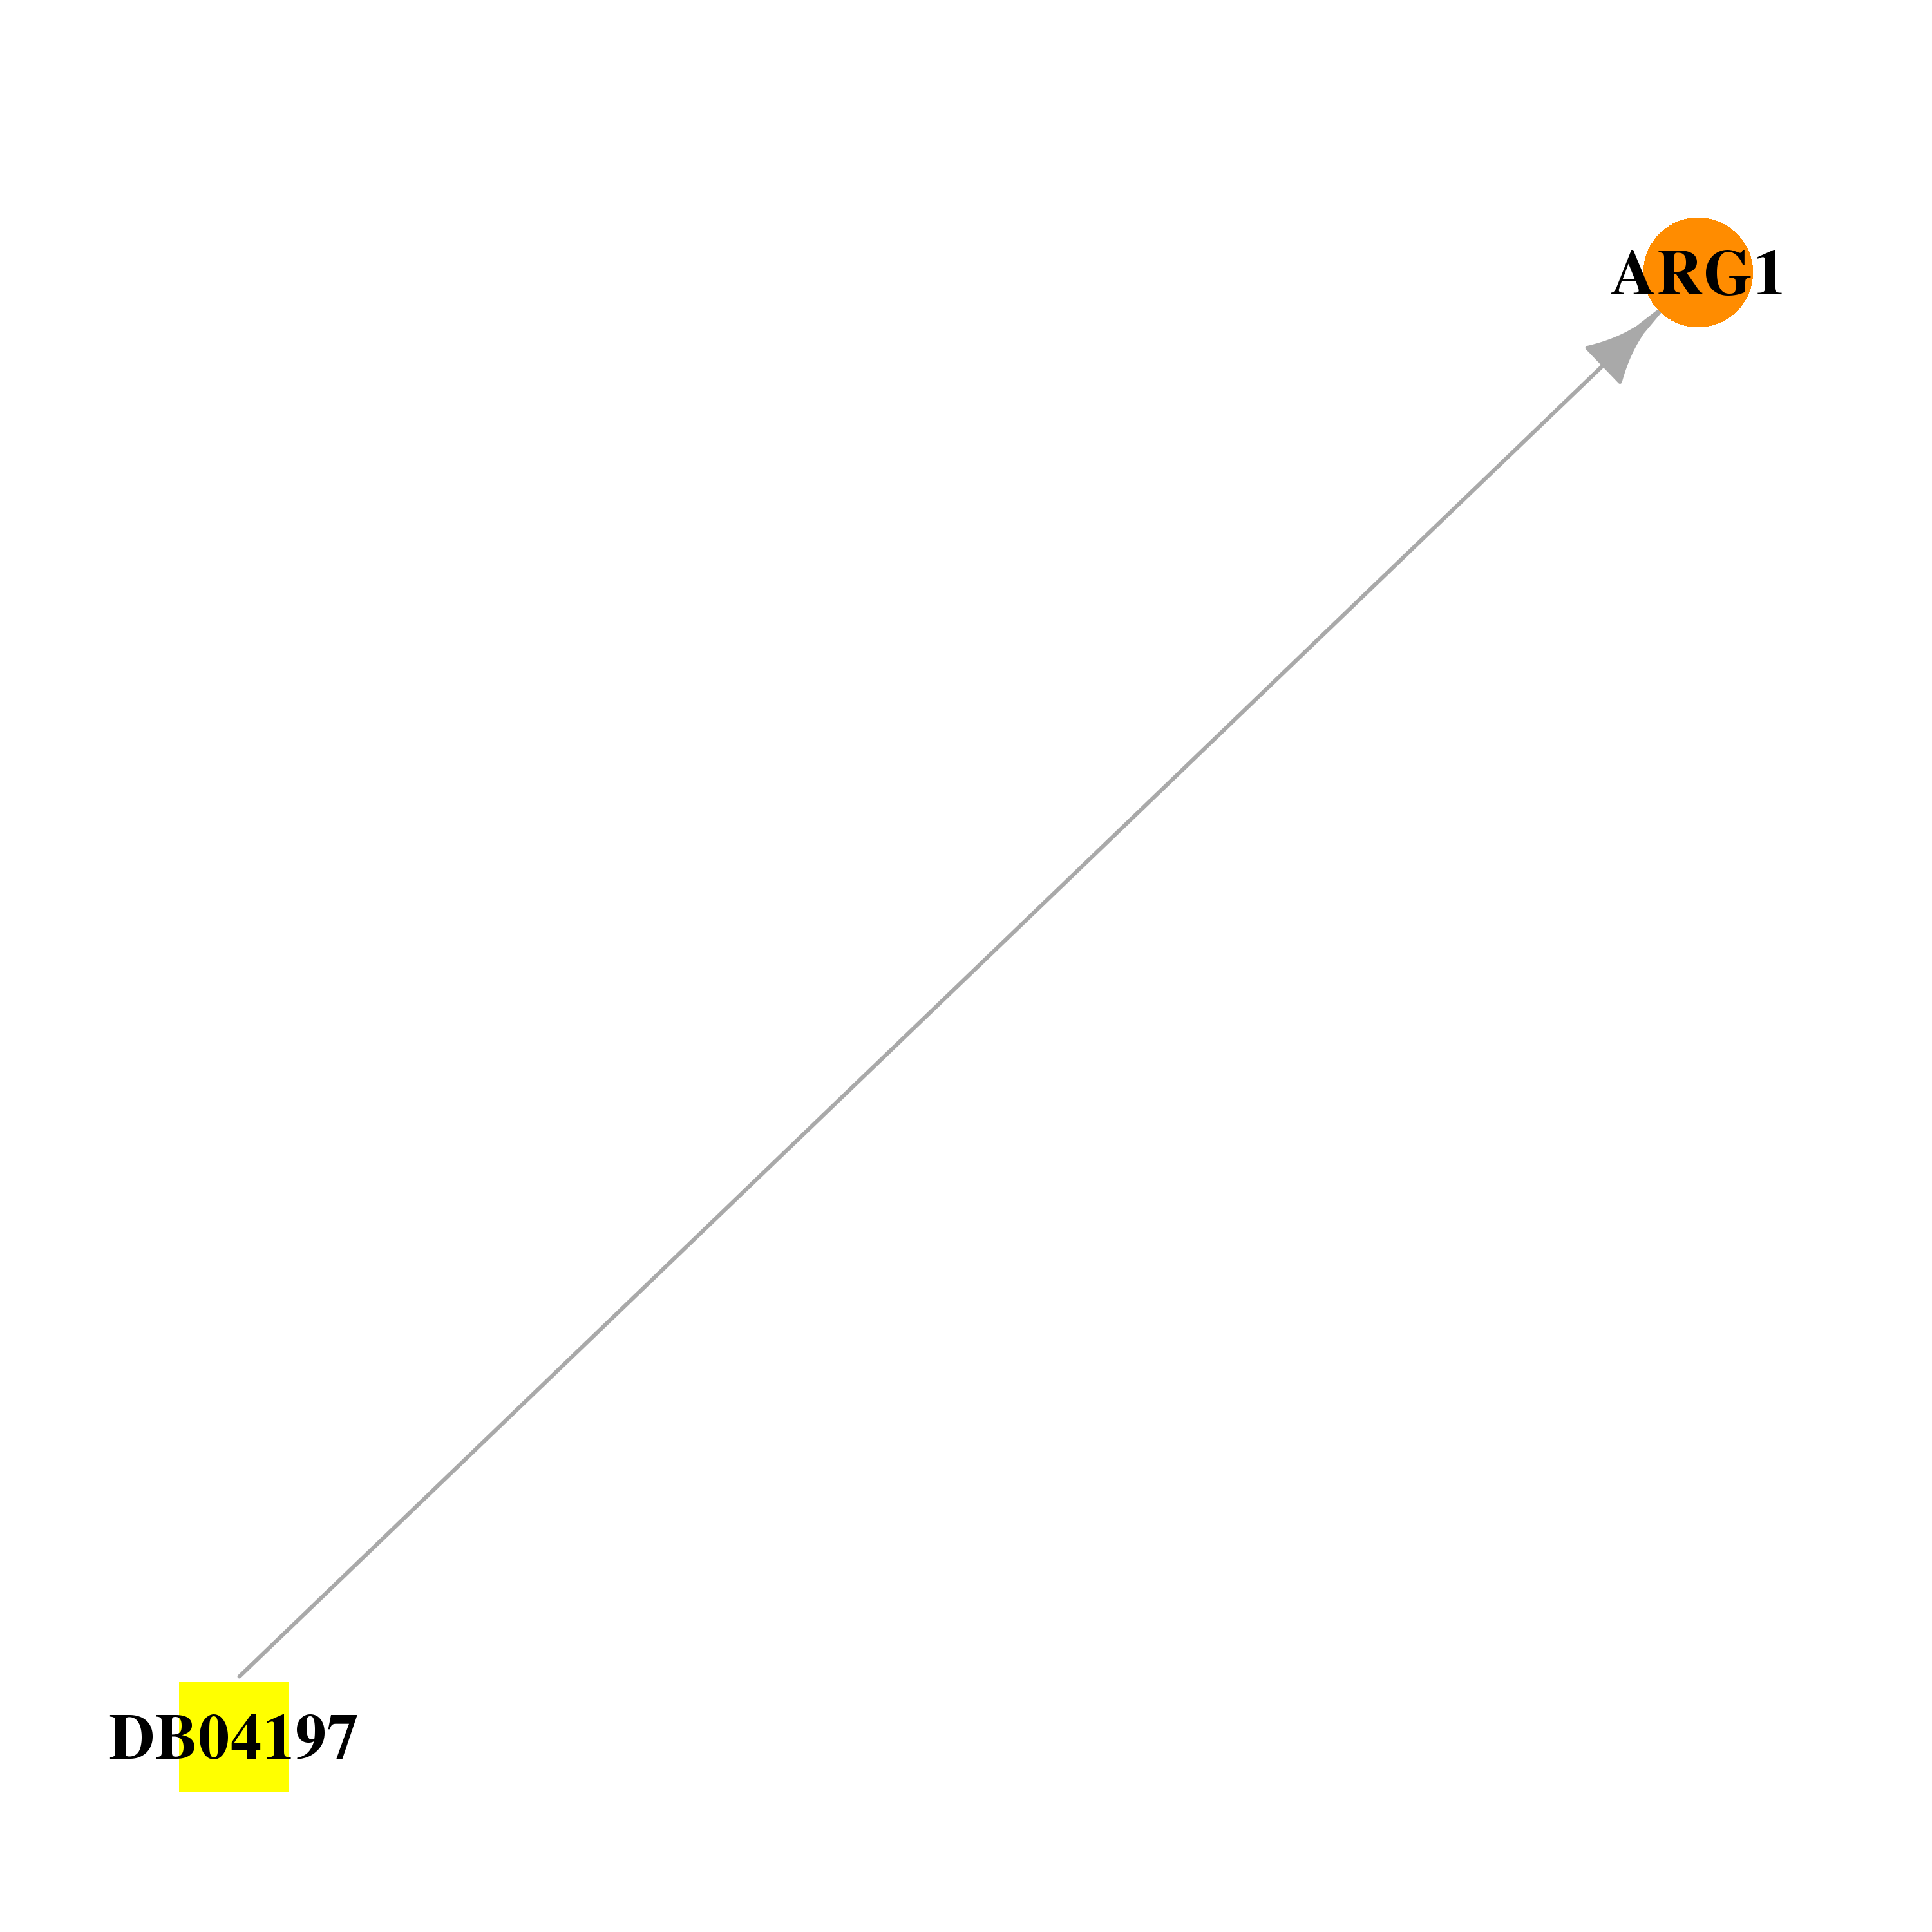 | 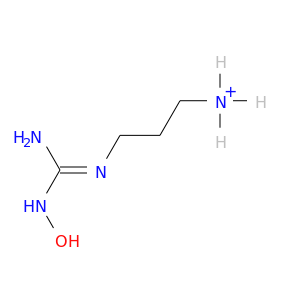 |
| DB04530 | arginase, liver | experimental | S,S-(2-Hydroxyethyl)Thiocysteine | 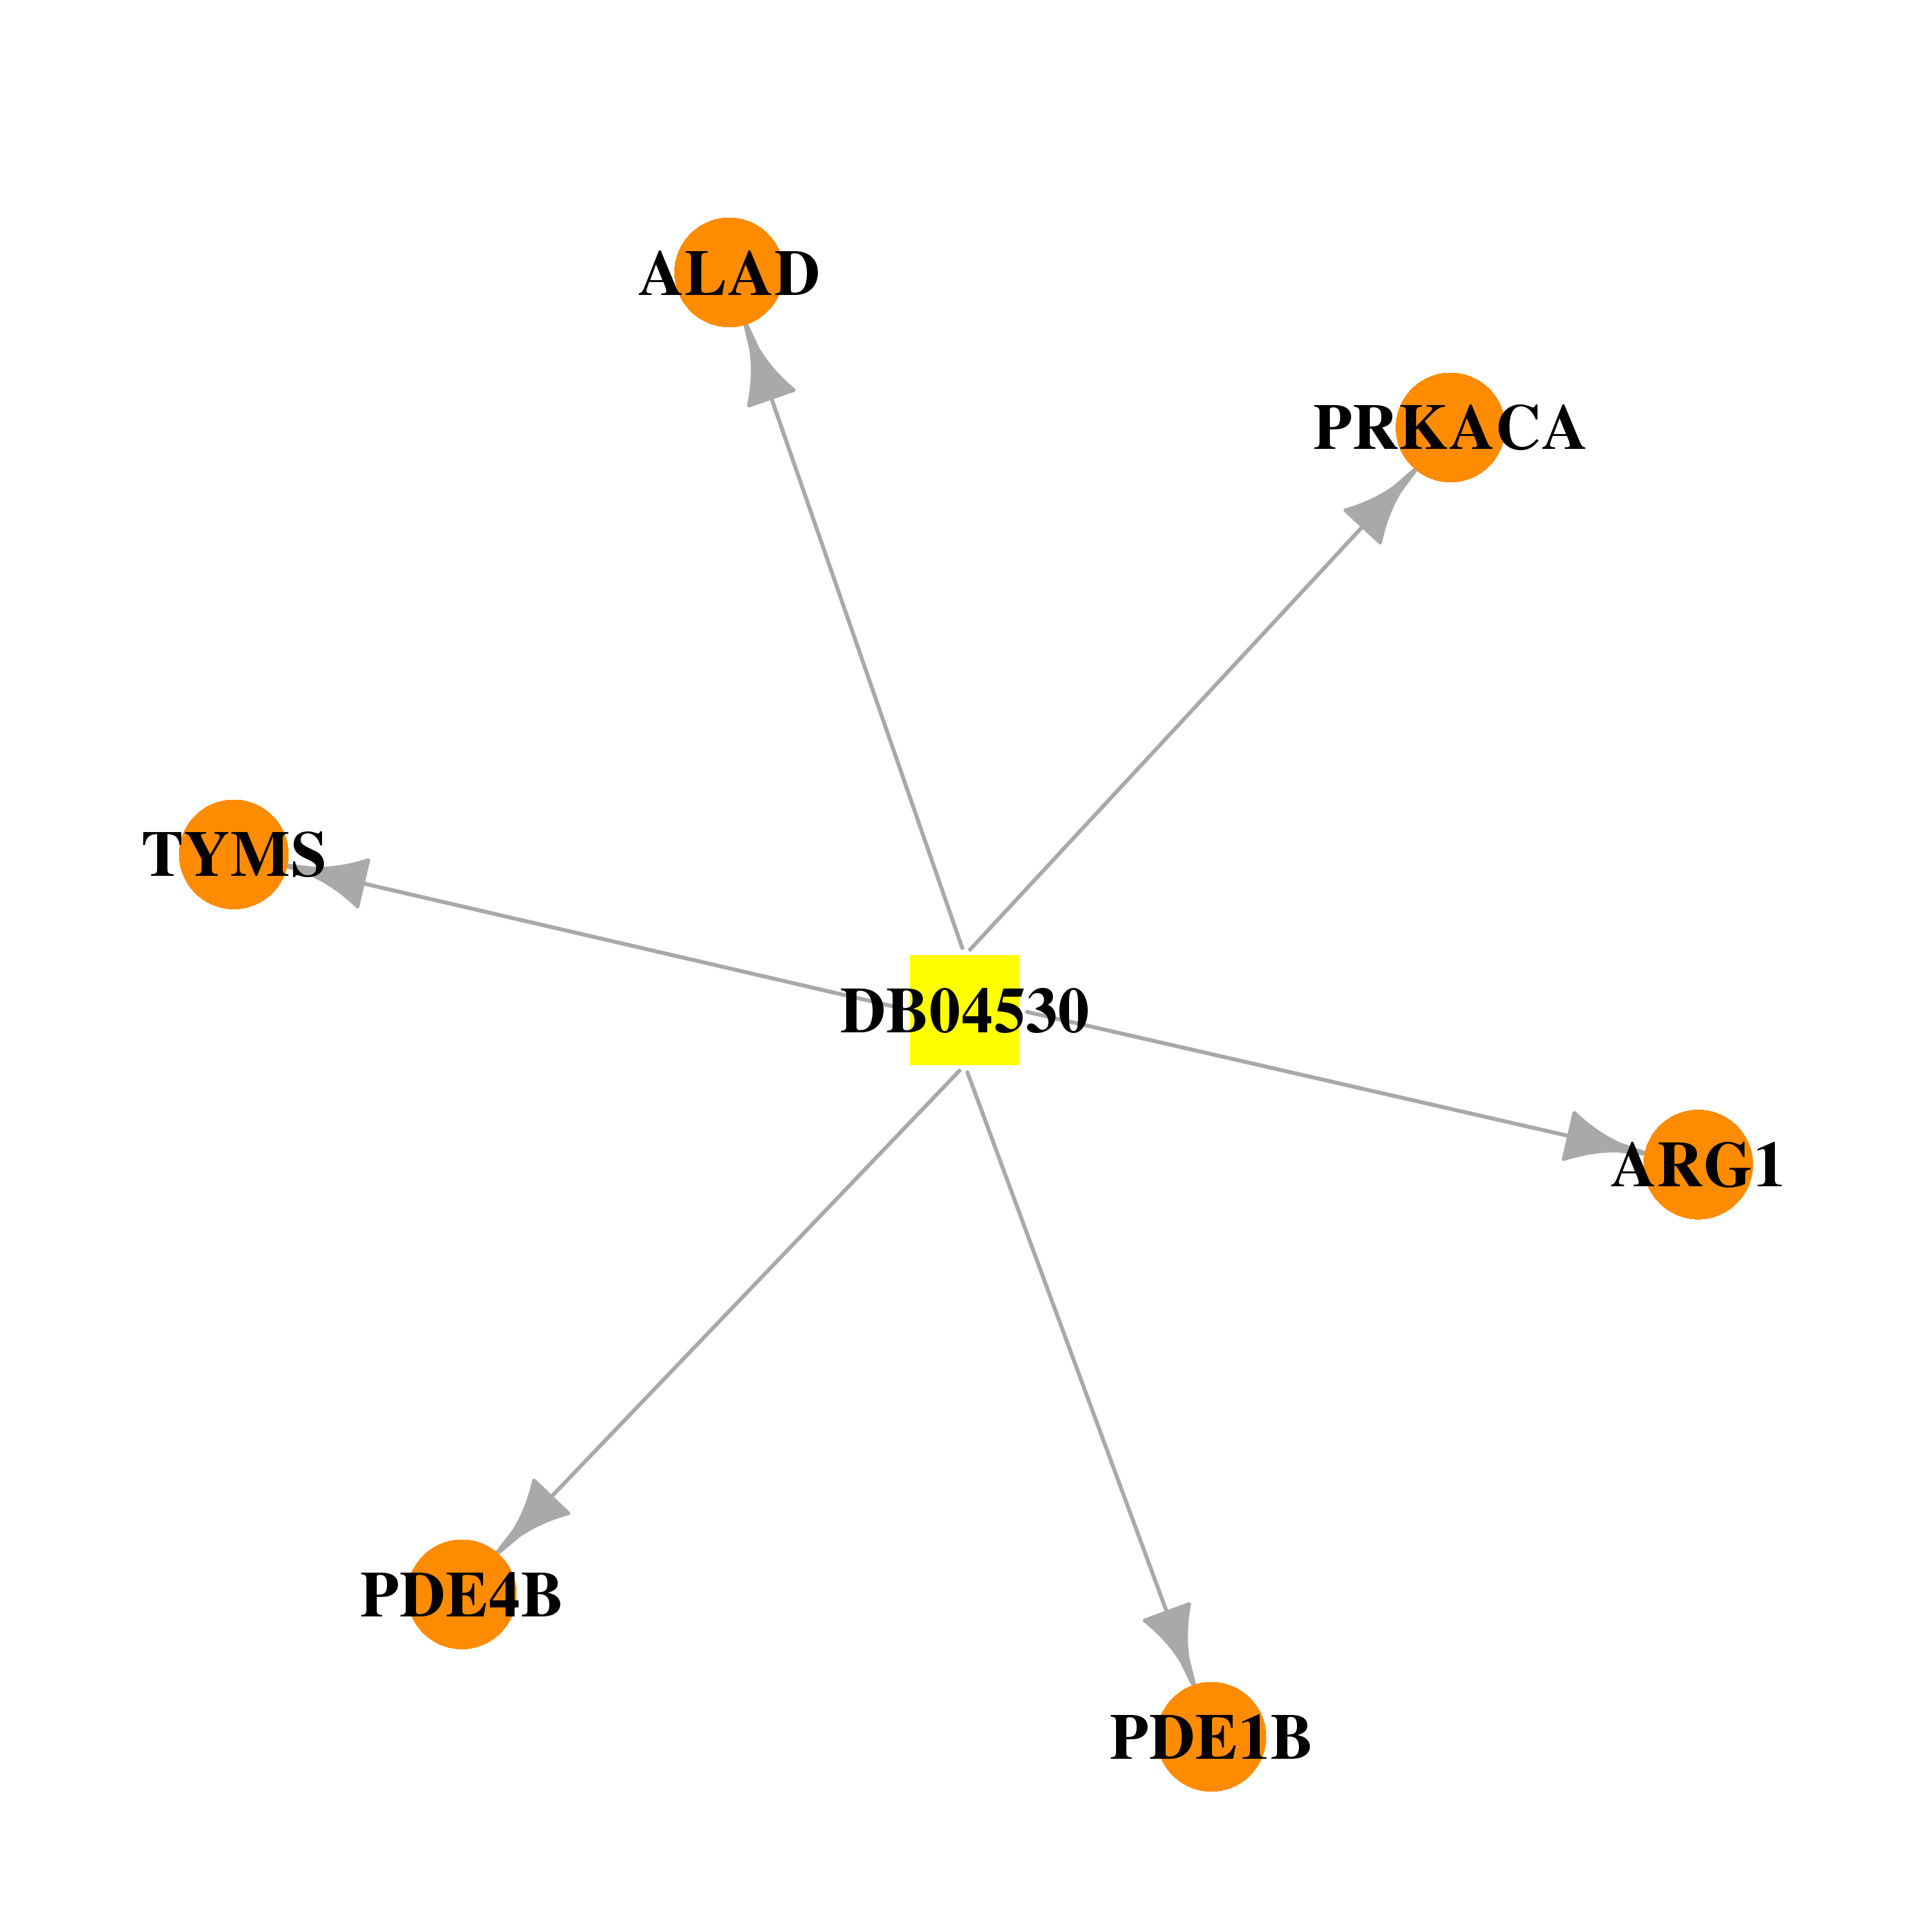 | 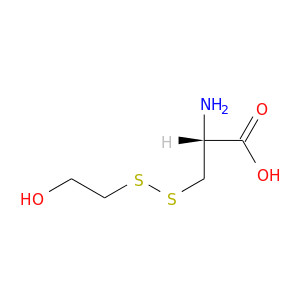 |
| DB04585 | arginase, liver | experimental | DEHYDRO-2(S)-AMINO-6-BORONOHEXANOIC ACID | 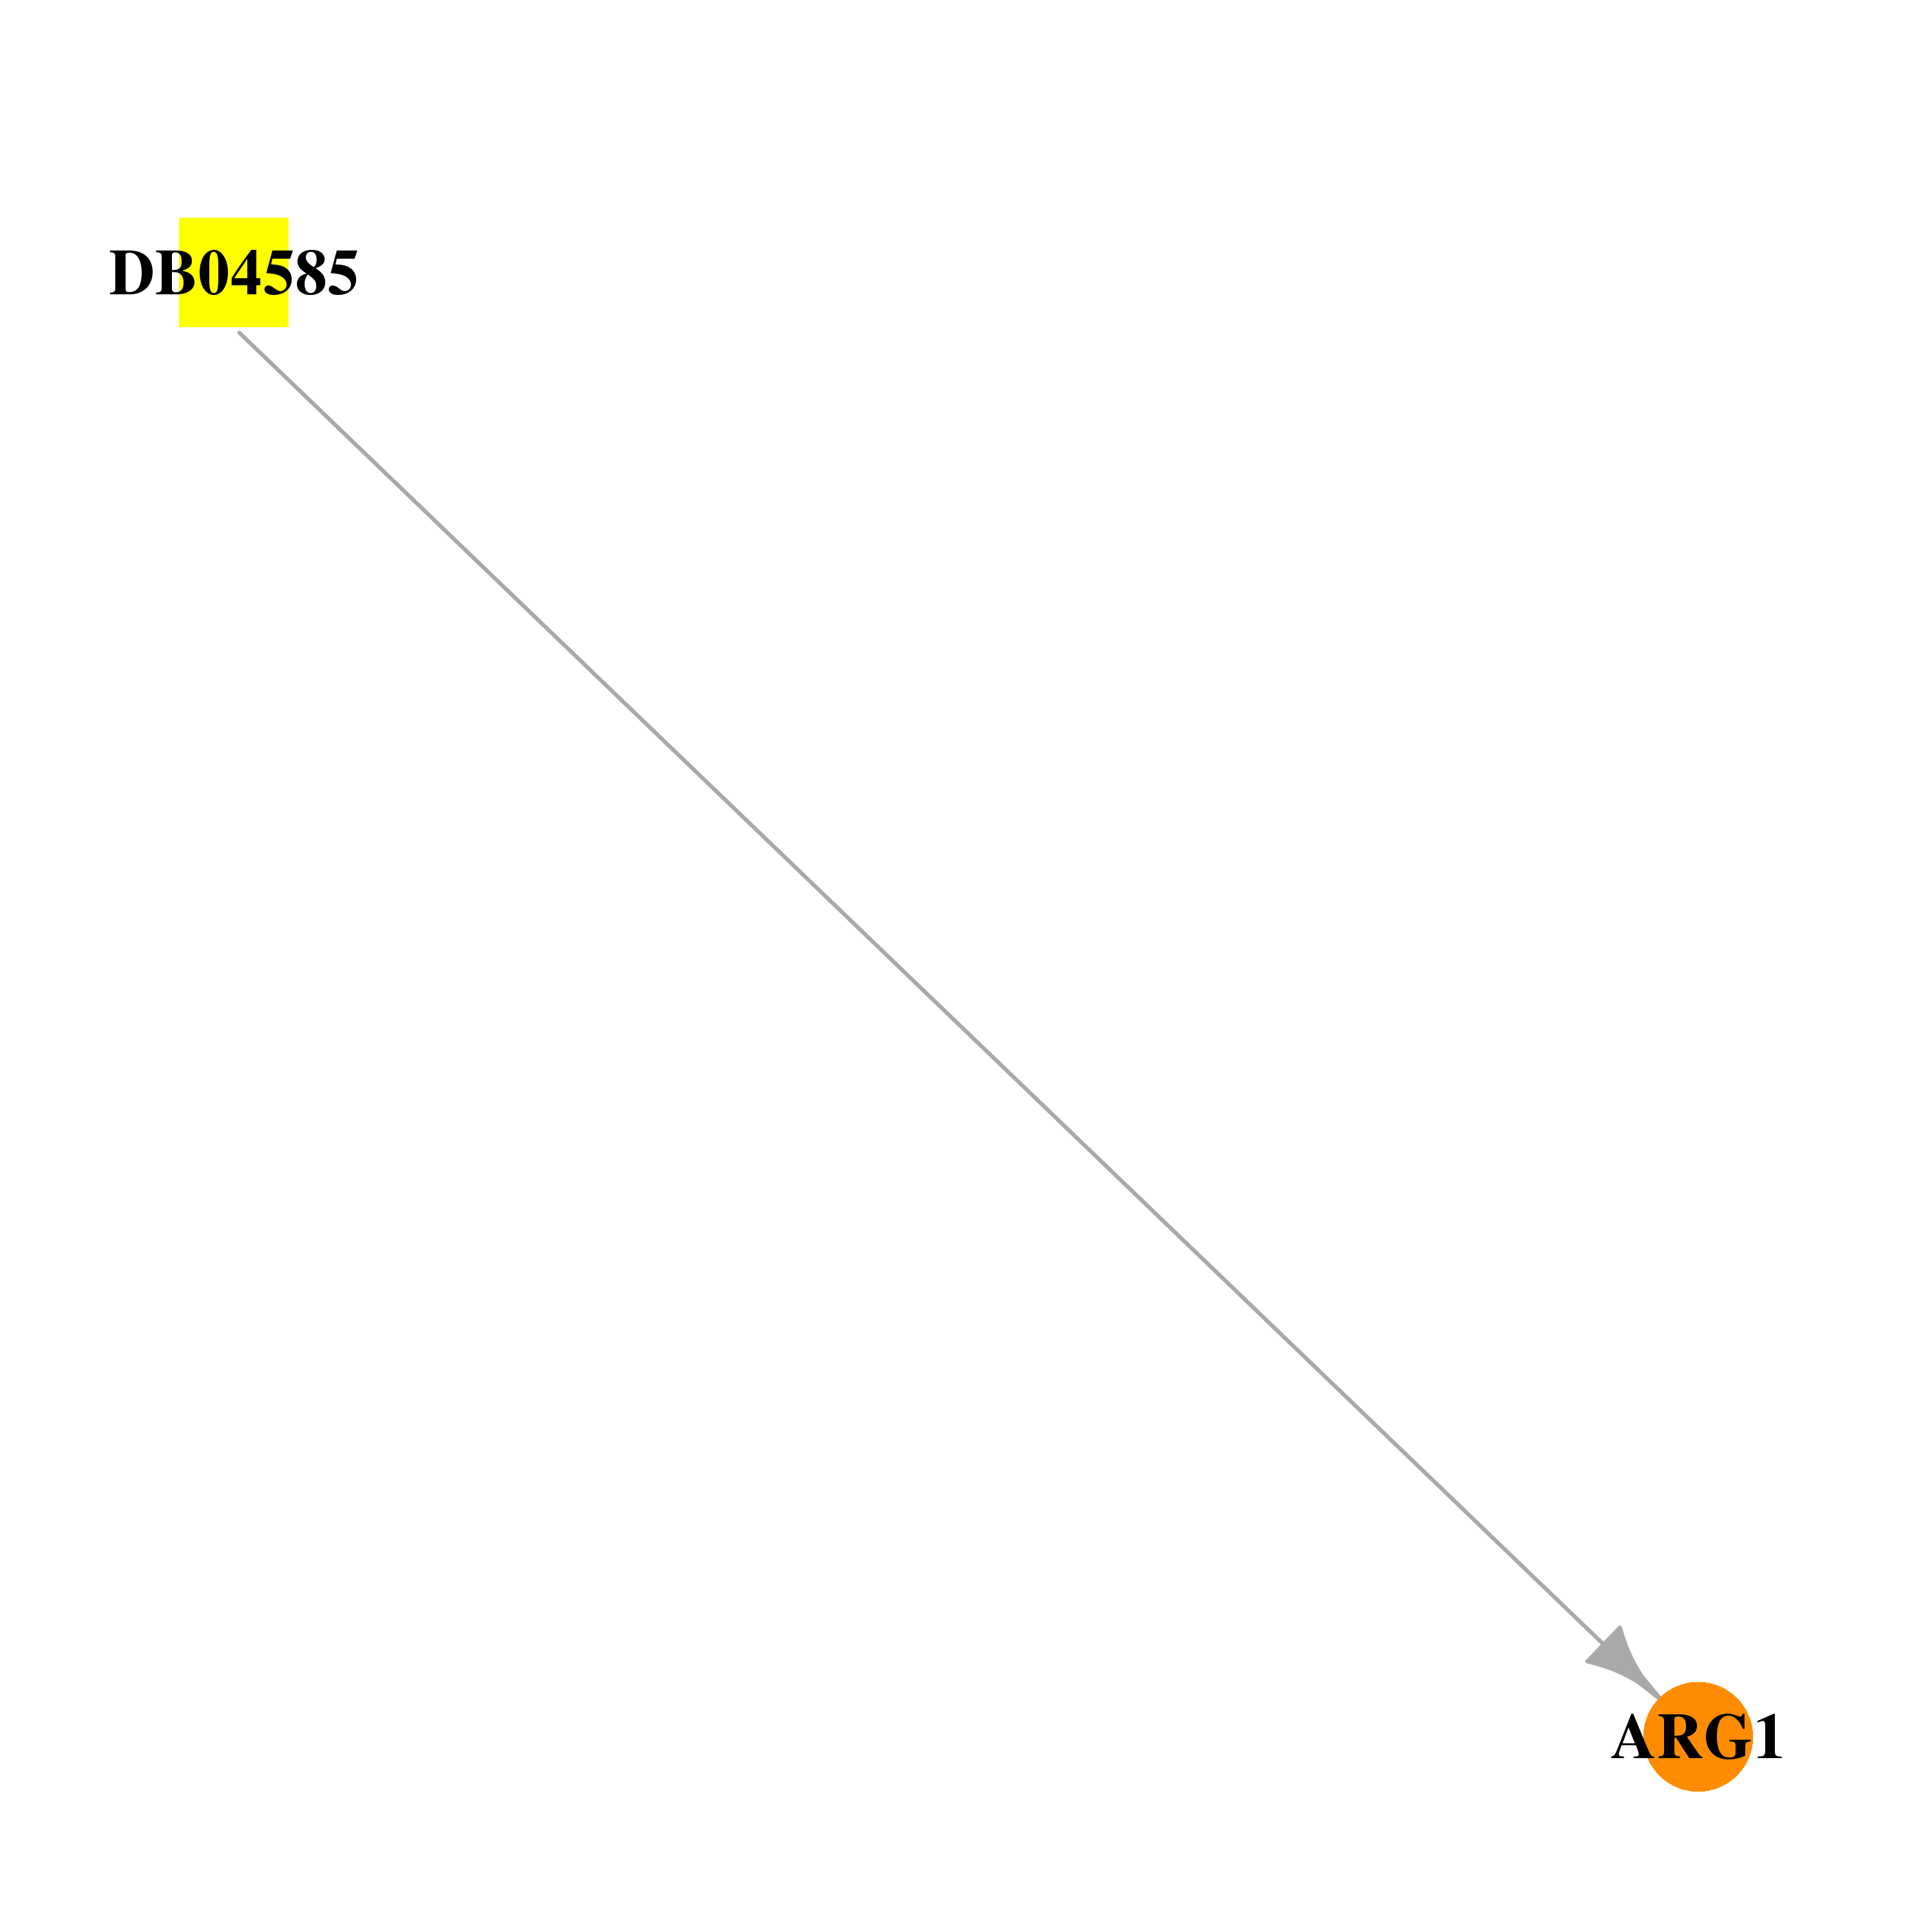 | 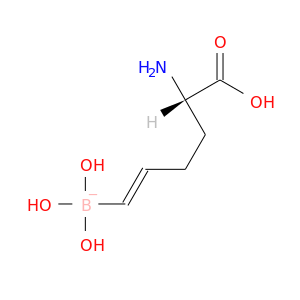 |
| DB04648 | arginase, liver | experimental | S-propylamine-L-cysteine | 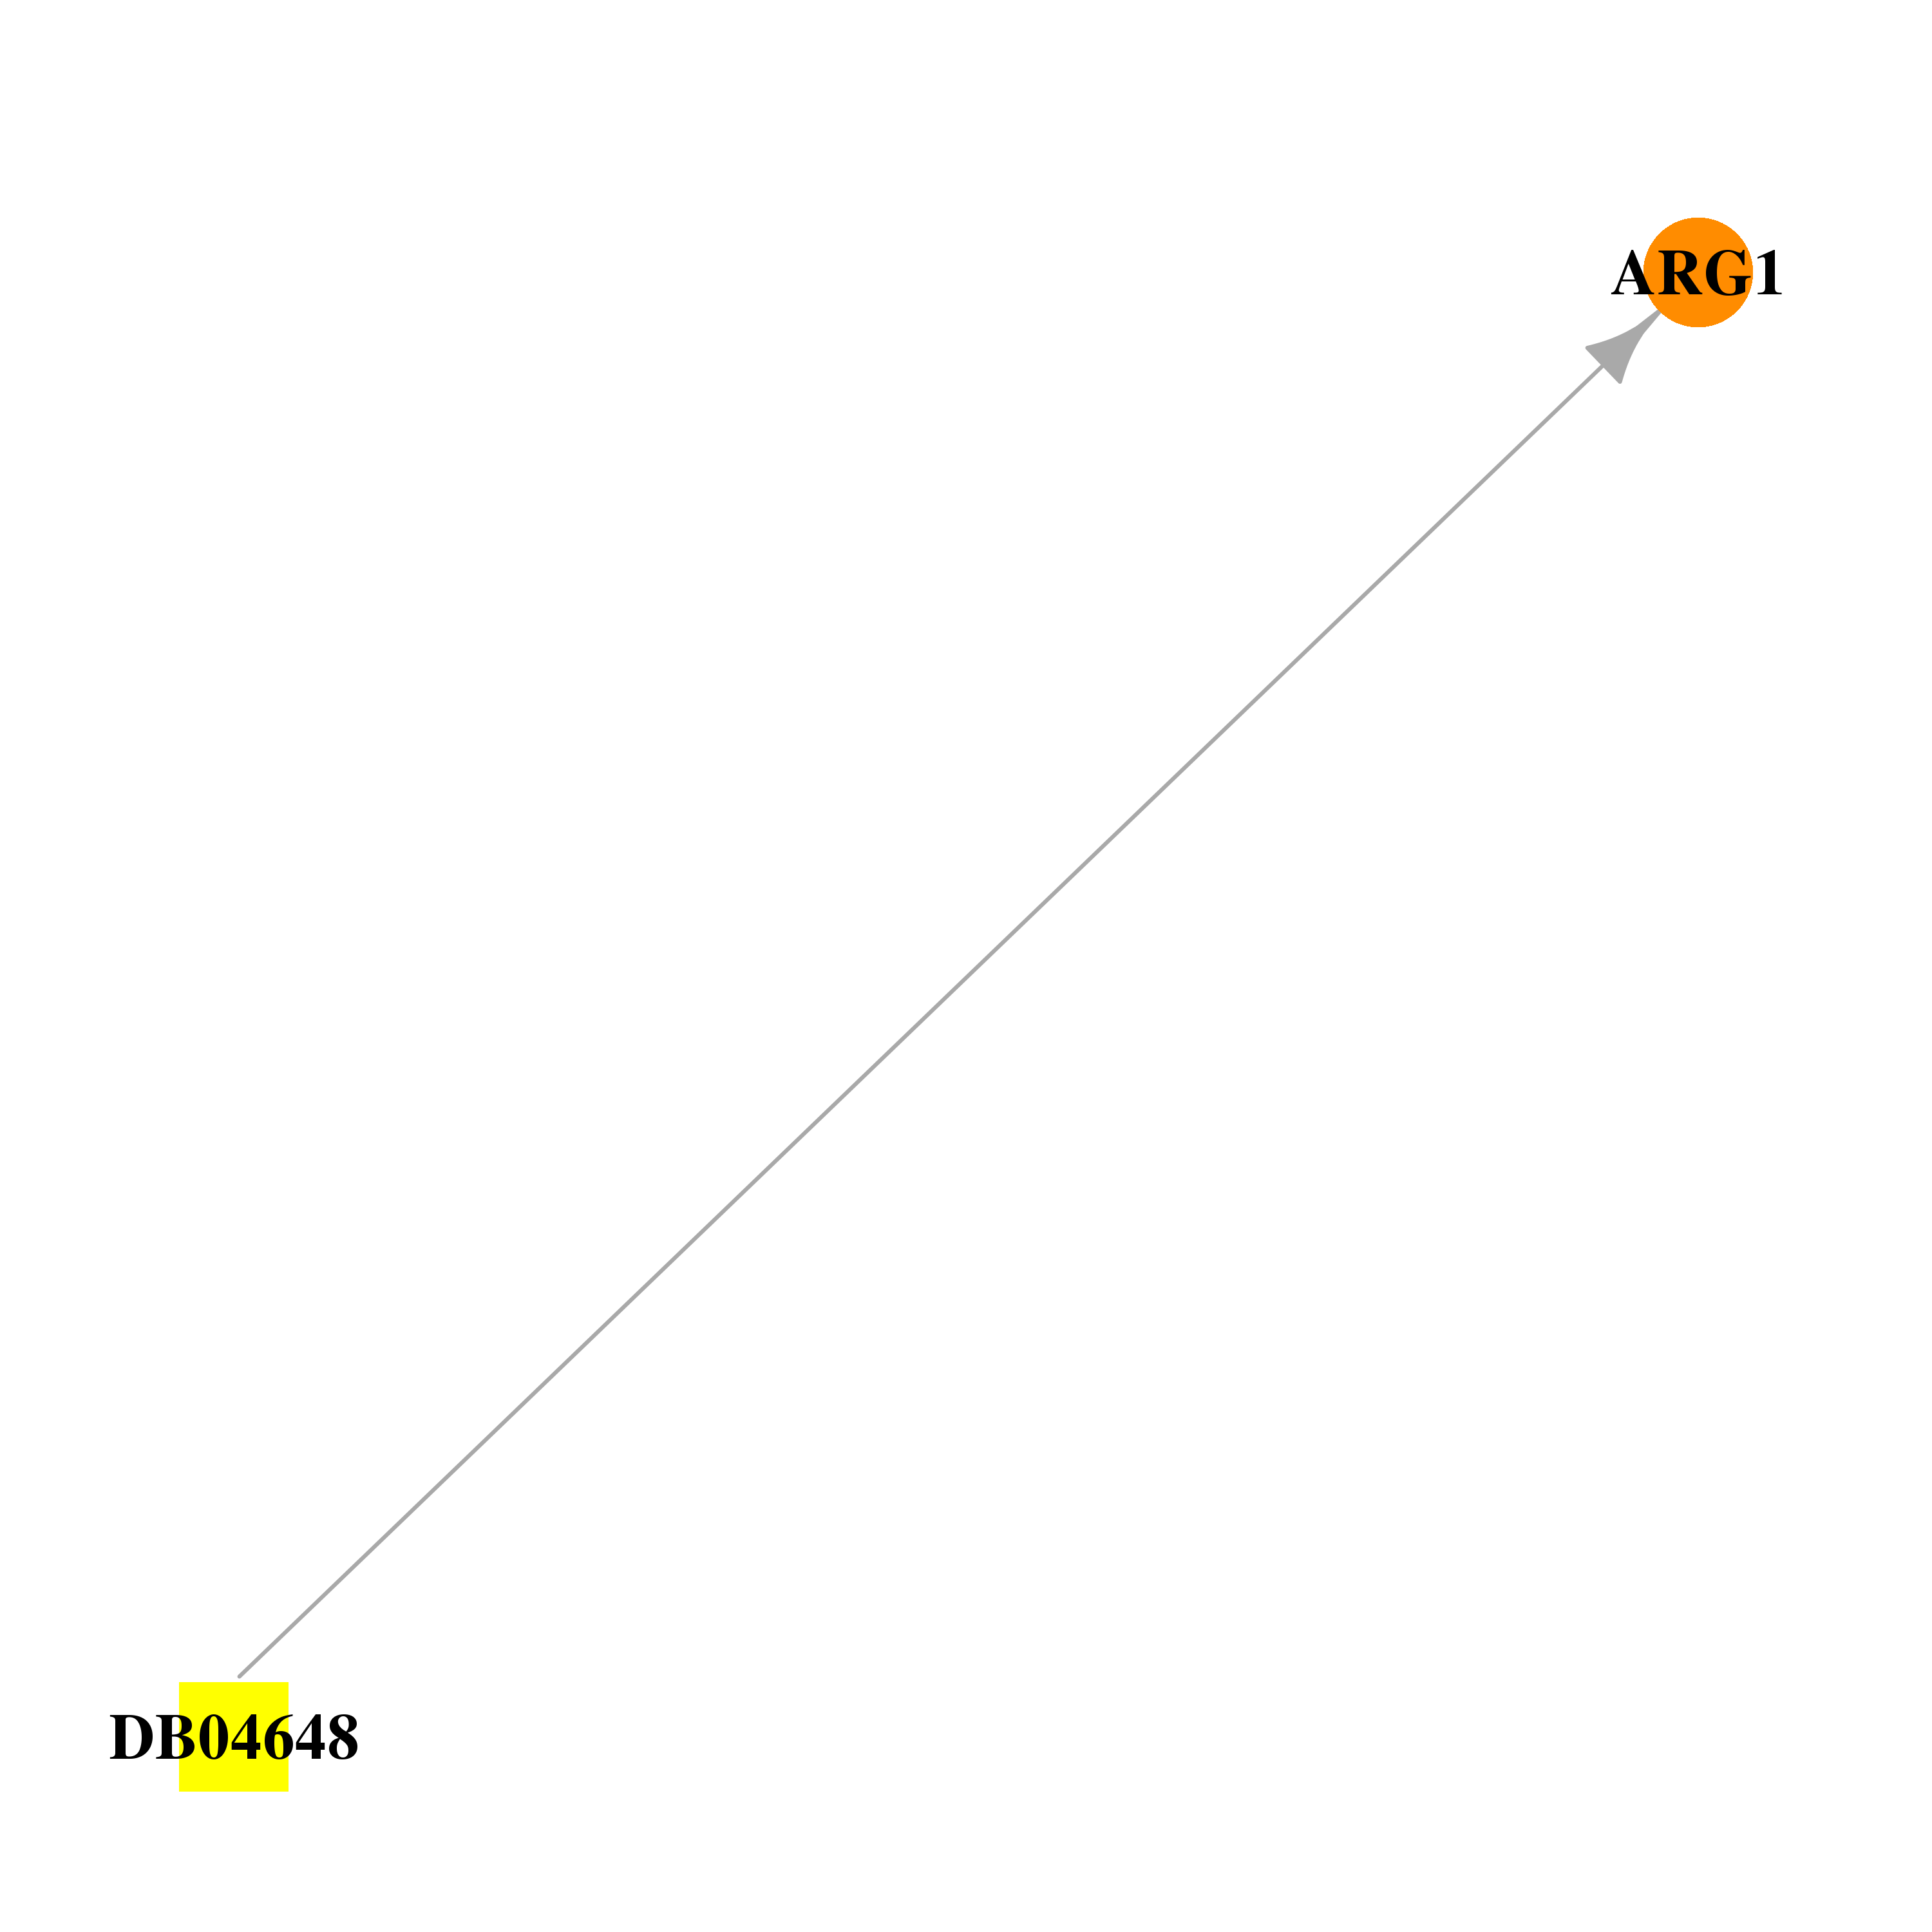 | 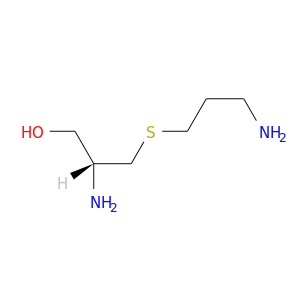 |
| DB01222 | arginase, liver | approved; investigational | Budesonide |  |  |
| DB00588 | arginase, liver | approved; investigational | Fluticasone Propionate | 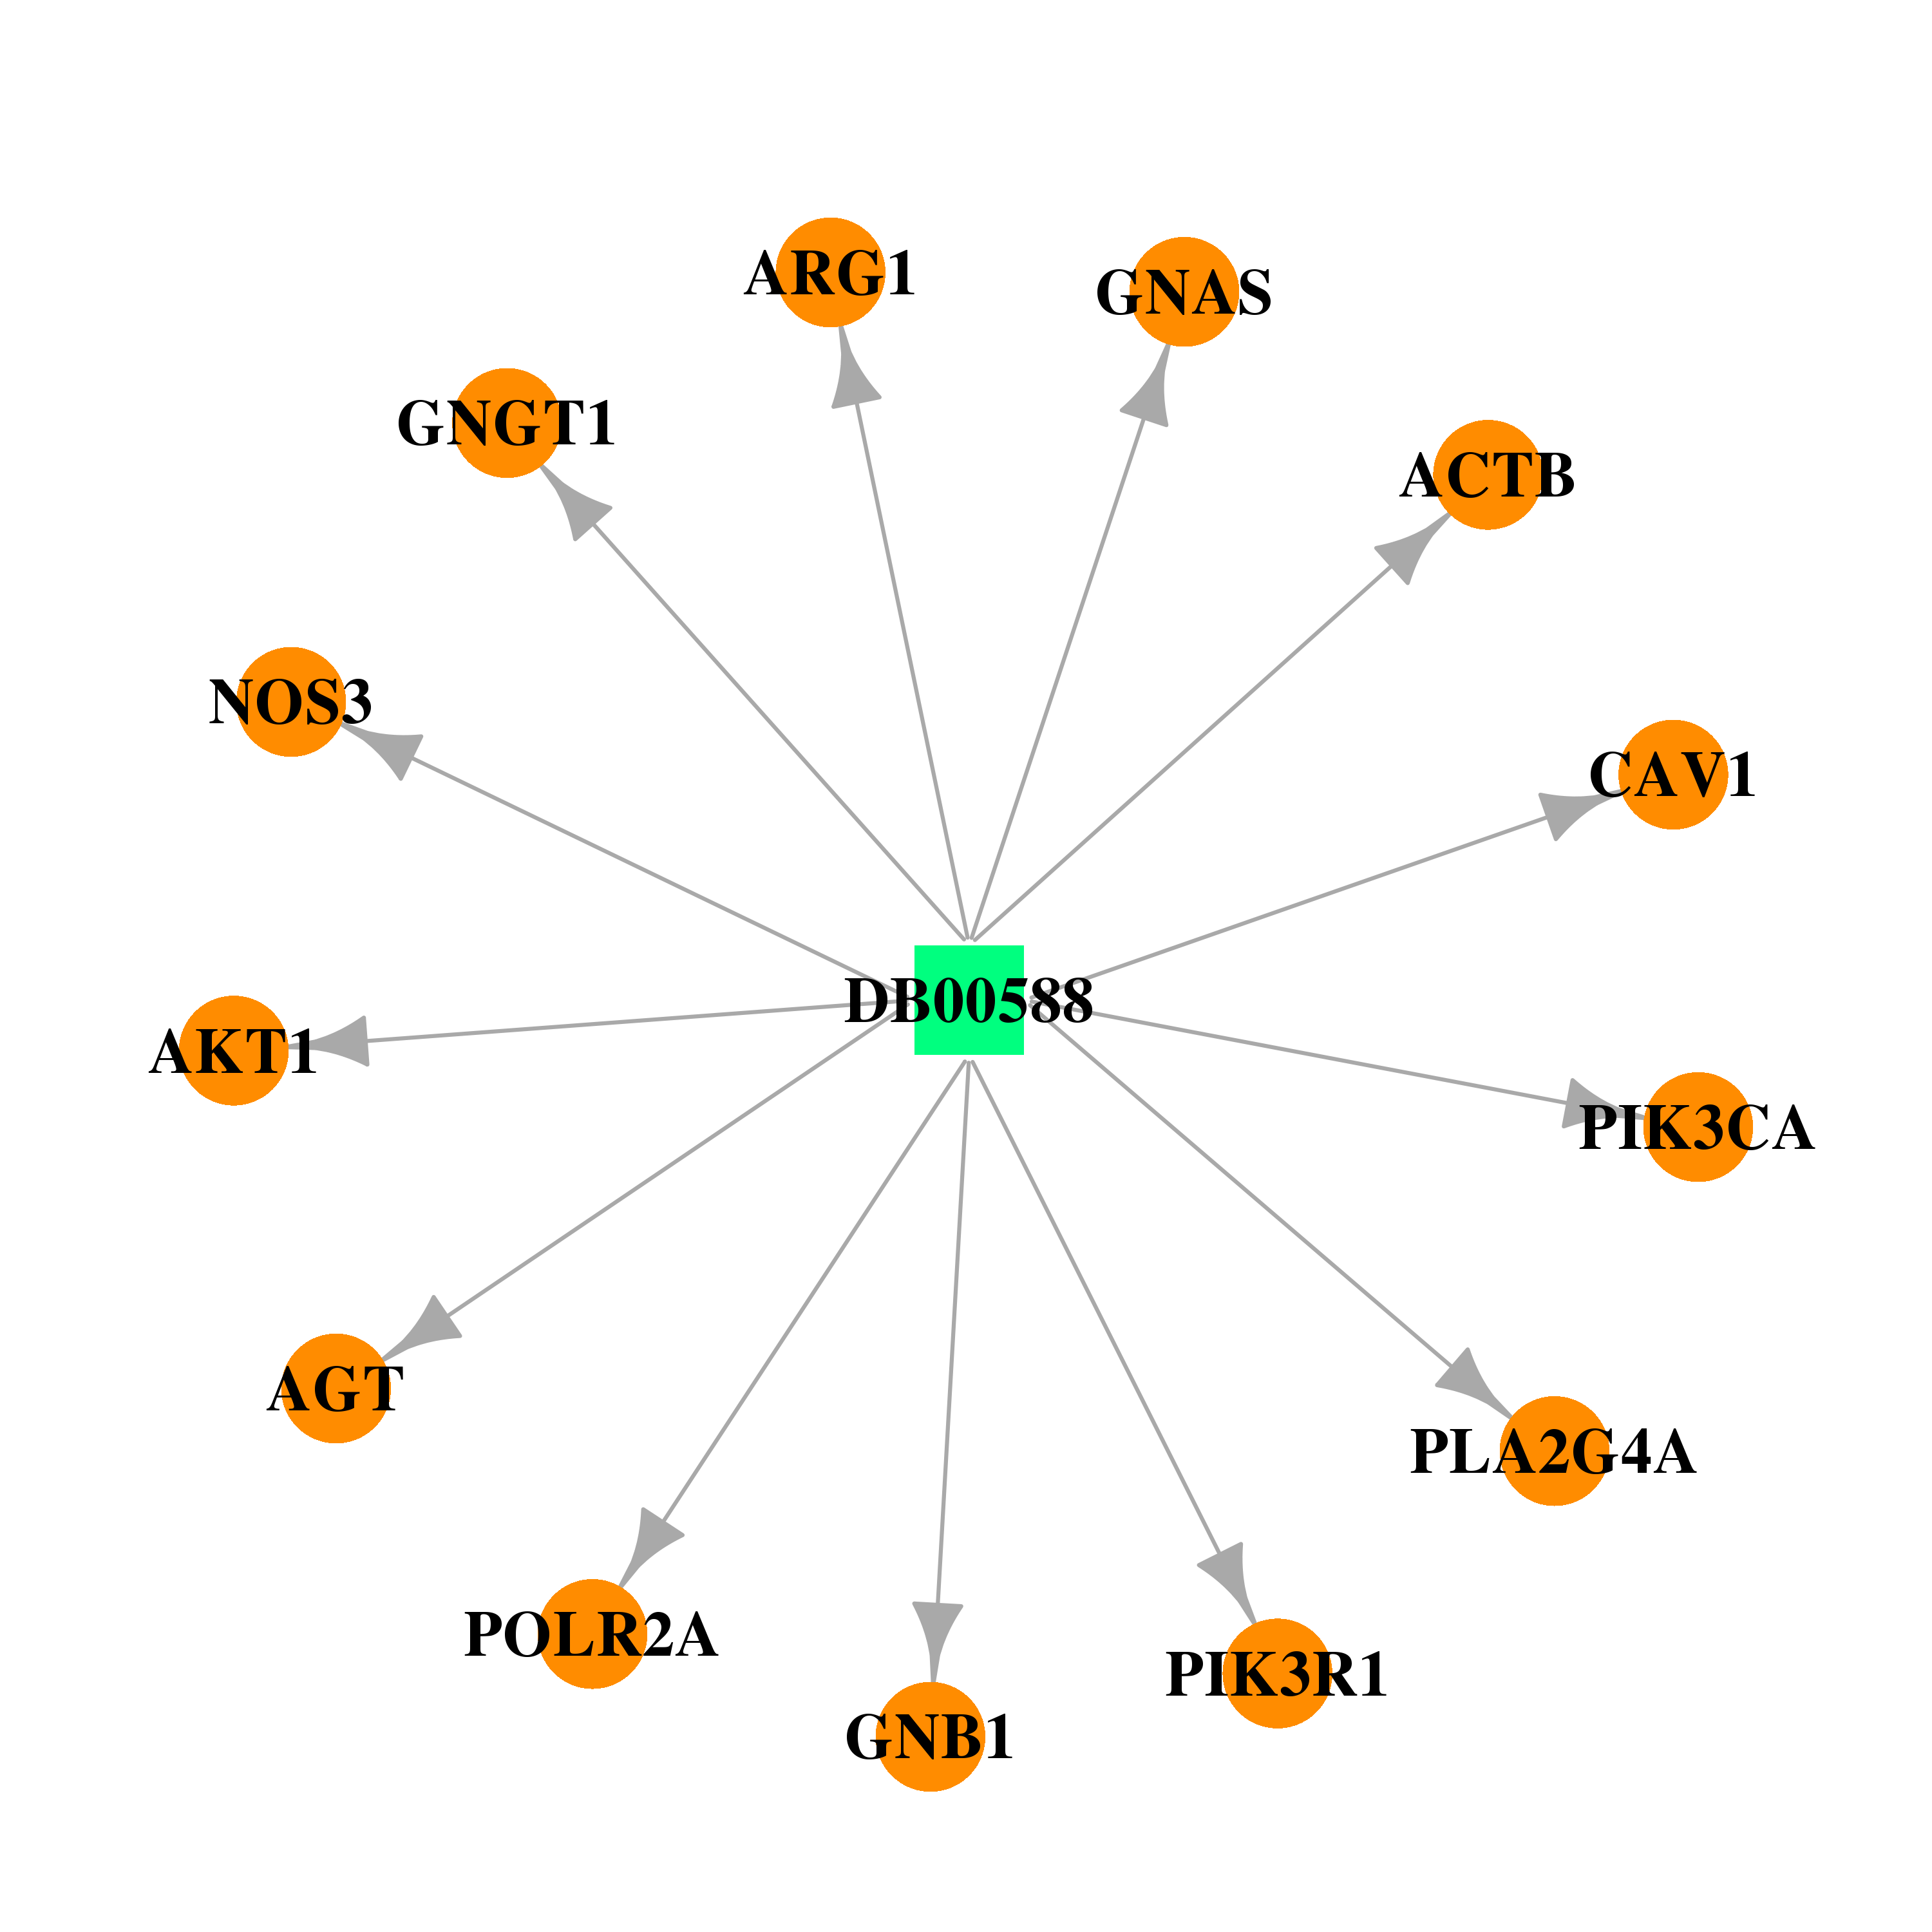 |  |
| DB00716 | arginase, liver | approved | Nedocromil |  |  |
| DB01001 | arginase, liver | approved | Salbutamol |  | 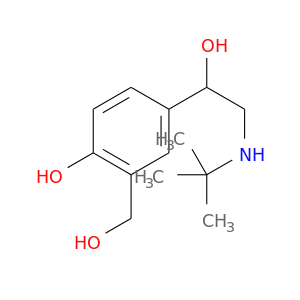 |
| DB00125 | arginase, liver | approved; nutraceutical | L-Arginine |  |  |
| Top |
| Cross referenced IDs for ARG1 |
| * We obtained these cross-references from Uniprot database. It covers 150 different DBs, 18 categories. http://www.uniprot.org/help/cross_references_section |
: Open all cross reference information
|
Copyright © 2016-Present - The Univsersity of Texas Health Science Center at Houston @ |