|
||||||||||||||||||||
| |
| Phenotypic Information (metabolism pathway, cancer, disease, phenome) |
| |
| |
| Gene-Gene Network Information: Co-Expression Network, Interacting Genes & KEGG |
| |
|


| Gene Summary for ARG2 |
| Basic gene info. | Gene symbol | ARG2 |
| Gene name | arginase 2 | |
| Synonyms | - | |
| Cytomap | UCSC genome browser: 14q24.1 | |
| Genomic location | chr14 :68086578-68118436 | |
| Type of gene | protein-coding | |
| RefGenes | NM_001172.3, | |
| Ensembl id | ENSG00000081181 | |
| Description | L-arginine amidinohydrolaseL-arginine ureahydrolasearginase, type IIarginase-2, mitochondrialkidney arginasekidney-type arginasenon-hepatic arginasenonhepatic arginasetype II arginase | |
| Modification date | 20141207 | |
| dbXrefs | MIM : 107830 | |
| HGNC : HGNC | ||
| Ensembl : ENSG00000081181 | ||
| HPRD : 00143 | ||
| Vega : OTTHUMG00000171807 | ||
| Protein | UniProt: go to UniProt's Cross Reference DB Table | |
| Expression | CleanEX: HS_ARG2 | |
| BioGPS: 384 | ||
| Gene Expression Atlas: ENSG00000081181 | ||
| The Human Protein Atlas: ENSG00000081181 | ||
| Pathway | NCI Pathway Interaction Database: ARG2 | |
| KEGG: ARG2 | ||
| REACTOME: ARG2 | ||
| ConsensusPathDB | ||
| Pathway Commons: ARG2 | ||
| Metabolism | MetaCyc: ARG2 | |
| HUMANCyc: ARG2 | ||
| Regulation | Ensembl's Regulation: ENSG00000081181 | |
| miRBase: chr14 :68,086,578-68,118,436 | ||
| TargetScan: NM_001172 | ||
| cisRED: ENSG00000081181 | ||
| Context | iHOP: ARG2 | |
| cancer metabolism search in PubMed: ARG2 | ||
| UCL Cancer Institute: ARG2 | ||
| Assigned class in ccmGDB | C | |
| Top |
| Phenotypic Information for ARG2(metabolism pathway, cancer, disease, phenome) |
| Cancer | CGAP: ARG2 |
| Familial Cancer Database: ARG2 | |
| * This gene is included in those cancer gene databases. |
|
|
|
|
|
|
| ||||||||||||||
Oncogene 1 | Significant driver gene in | |||||||||||||||||||
| cf) number; DB name 1 Oncogene; http://nar.oxfordjournals.org/content/35/suppl_1/D721.long, 2 Tumor Suppressor gene; https://bioinfo.uth.edu/TSGene/, 3 Cancer Gene Census; http://www.nature.com/nrc/journal/v4/n3/abs/nrc1299.html, 4 CancerGenes; http://nar.oxfordjournals.org/content/35/suppl_1/D721.long, 5 Network of Cancer Gene; http://ncg.kcl.ac.uk/index.php, 1Therapeutic Vulnerabilities in Cancer; http://cbio.mskcc.org/cancergenomics/statius/ |
| KEGG_ARGININE_AND_PROLINE_METABOLISM REACTOME_METABOLISM_OF_AMINO_ACIDS_AND_DERIVATIVES | |
| OMIM | |
| Orphanet | |
| Disease | KEGG Disease: ARG2 |
| MedGen: ARG2 (Human Medical Genetics with Condition) | |
| ClinVar: ARG2 | |
| Phenotype | MGI: ARG2 (International Mouse Phenotyping Consortium) |
| PhenomicDB: ARG2 | |
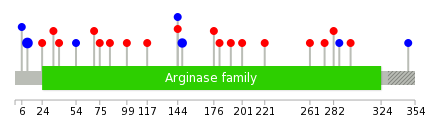
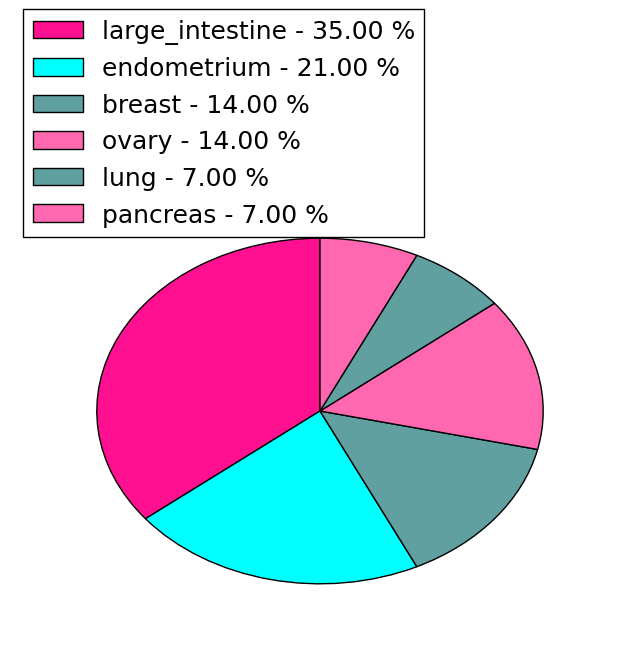
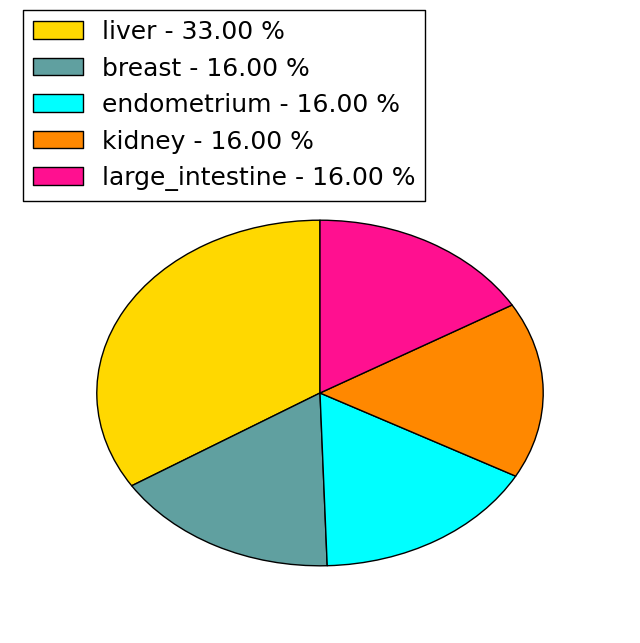
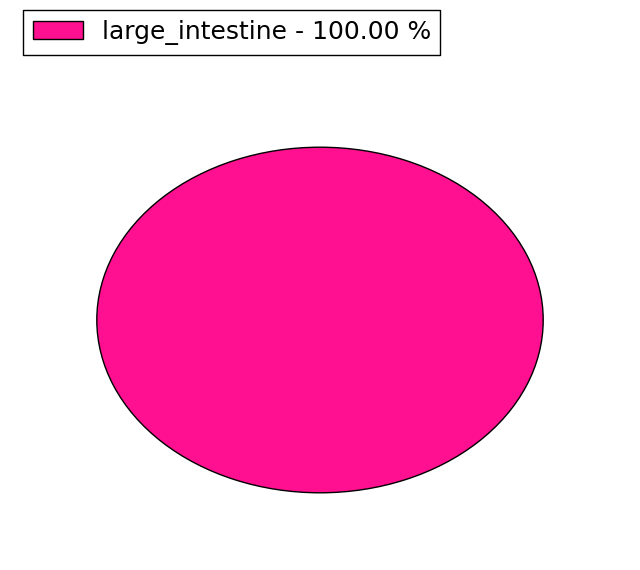
| Mutations for ARG2 |
| * Under tables are showing count per each tissue to give us broad intuition about tissue specific mutation patterns.You can go to the detailed page for each mutation database's web site. |
| There's no structural variation information in COSMIC data for this gene. |
| * From mRNA Sanger sequences, Chitars2.0 arranged chimeric transcripts. This table shows ARG2 related fusion information. |
| ID | Head Gene | Tail Gene | Accession | Gene_a | qStart_a | qEnd_a | Chromosome_a | tStart_a | tEnd_a | Gene_a | qStart_a | qEnd_a | Chromosome_a | tStart_a | tEnd_a |
| AI656563 | EMILIN1 | 13 | 176 | 2 | 27309108 | 27309271 | ARG2 | 166 | 346 | 14 | 68116886 | 68117066 | |
| Top |
| There's no copy number variation information in COSMIC data for this gene. |
| Top |
|
 |
| Top |
| Stat. for Non-Synonymous SNVs (# total SNVs=14) | (# total SNVs=6) |
 |  |
(# total SNVs=1) | (# total SNVs=0) |
 |
| Top |
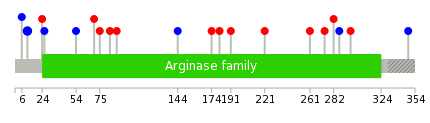
| * When you move the cursor on each content, you can see more deailed mutation information on the Tooltip. Those are primary_site,primary_histology,mutation(aa),pubmedID. |
| GRCh37 position | Mutation(aa) | Unique sampleID count |
| chr14:68086727-68086727 | p.L11L | 4 |
| chr14:68112441-68112441 | p.I148I | 2 |
| chr14:68086712-68086712 | p.S6S | 1 |
| chr14:68109067-68109069 | p.G117delG | 1 |
| chr14:68114822-68114822 | p.P261S | 1 |
| chr14:68112428-68112428 | p.A144V | 1 |
| chr14:68114862-68114862 | p.R274Q | 1 |
| chr14:68086765-68086765 | p.H24P | 1 |
| chr14:68112429-68112429 | p.A144A | 1 |
| chr14:68114885-68114885 | p.E282K | 1 |
| Top |
|
 |
| Point Mutation/ Tissue ID | 1 | 2 | 3 | 4 | 5 | 6 | 7 | 8 | 9 | 10 | 11 | 12 | 13 | 14 | 15 | 16 | 17 | 18 | 19 | 20 |
| # sample | 2 | 2 | 5 | 2 | 1 | 1 | 2 | 1 | 4 | |||||||||||
| # mutation | 2 | 2 | 5 | 2 | 1 | 1 | 2 | 1 | 4 | |||||||||||
| nonsynonymous SNV | 1 | 1 | 4 | 1 | 1 | 1 | 3 | |||||||||||||
| synonymous SNV | 1 | 1 | 1 | 1 | 1 | 1 | 1 | 1 |
| cf) Tissue ID; Tissue type (1; BLCA[Bladder Urothelial Carcinoma], 2; BRCA[Breast invasive carcinoma], 3; CESC[Cervical squamous cell carcinoma and endocervical adenocarcinoma], 4; COAD[Colon adenocarcinoma], 5; GBM[Glioblastoma multiforme], 6; Glioma Low Grade, 7; HNSC[Head and Neck squamous cell carcinoma], 8; KICH[Kidney Chromophobe], 9; KIRC[Kidney renal clear cell carcinoma], 10; KIRP[Kidney renal papillary cell carcinoma], 11; LAML[Acute Myeloid Leukemia], 12; LUAD[Lung adenocarcinoma], 13; LUSC[Lung squamous cell carcinoma], 14; OV[Ovarian serous cystadenocarcinoma ], 15; PAAD[Pancreatic adenocarcinoma], 16; PRAD[Prostate adenocarcinoma], 17; SKCM[Skin Cutaneous Melanoma], 18:STAD[Stomach adenocarcinoma], 19:THCA[Thyroid carcinoma], 20:UCEC[Uterine Corpus Endometrial Carcinoma]) |
| Top |
| * We represented just top 10 SNVs. When you move the cursor on each content, you can see more deailed mutation information on the Tooltip. Those are primary_site, primary_histology, mutation(aa), pubmedID. |
| Genomic Position | Mutation(aa) | Unique sampleID count |
| chr14:68086727 | p.L11L | 2 |
| chr14:68086712 | p.S6S | 1 |
| chr14:68113381 | p.E282K | 1 |
| chr14:68113409 | p.G287G | 1 |
| chr14:68086765 | p.H24P | 1 |
| chr14:68113681 | p.V297A | 1 |
| chr14:68086772 | p.V26V | 1 |
| chr14:68114822 | p.N348N | 1 |
| chr14:68087661 | p.L54L | 1 |
| chr14:68114862 | p.D70Y | 1 |
| * Copy number data were extracted from TCGA using R package TCGA-Assembler. The URLs of all public data files on TCGA DCC data server were gathered on Jan-05-2015. Function ProcessCNAData in TCGA-Assembler package was used to obtain gene-level copy number value which is calculated as the average copy number of the genomic region of a gene. |
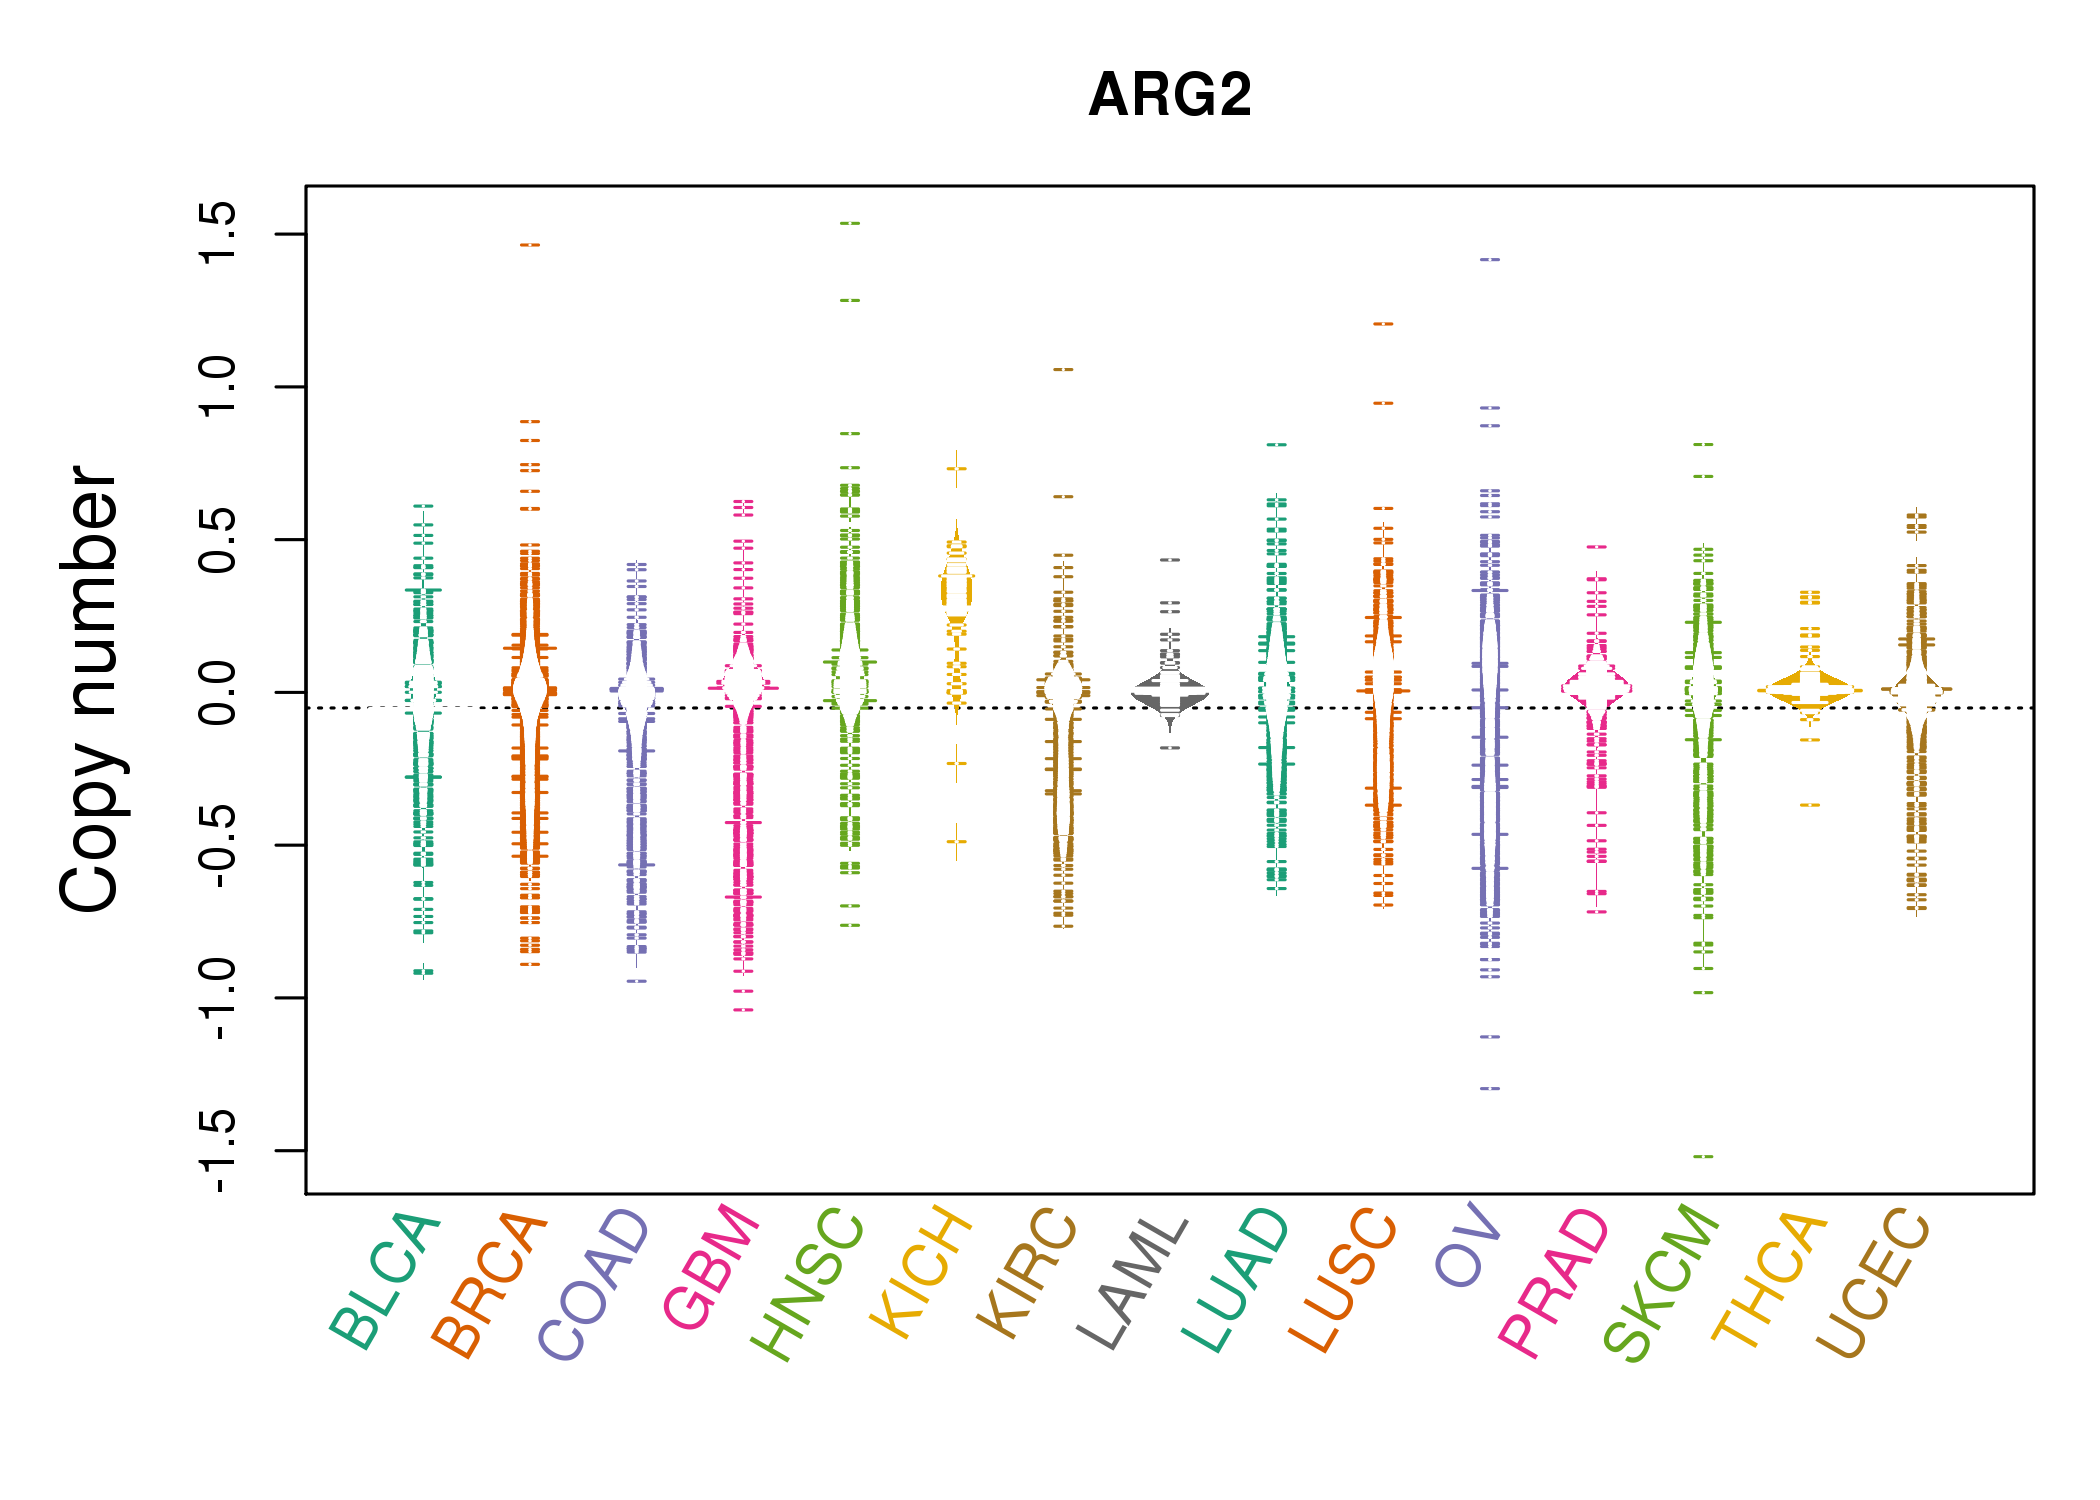 |
| cf) Tissue ID[Tissue type]: BLCA[Bladder Urothelial Carcinoma], BRCA[Breast invasive carcinoma], CESC[Cervical squamous cell carcinoma and endocervical adenocarcinoma], COAD[Colon adenocarcinoma], GBM[Glioblastoma multiforme], Glioma Low Grade, HNSC[Head and Neck squamous cell carcinoma], KICH[Kidney Chromophobe], KIRC[Kidney renal clear cell carcinoma], KIRP[Kidney renal papillary cell carcinoma], LAML[Acute Myeloid Leukemia], LUAD[Lung adenocarcinoma], LUSC[Lung squamous cell carcinoma], OV[Ovarian serous cystadenocarcinoma ], PAAD[Pancreatic adenocarcinoma], PRAD[Prostate adenocarcinoma], SKCM[Skin Cutaneous Melanoma], STAD[Stomach adenocarcinoma], THCA[Thyroid carcinoma], UCEC[Uterine Corpus Endometrial Carcinoma] |
| Top |
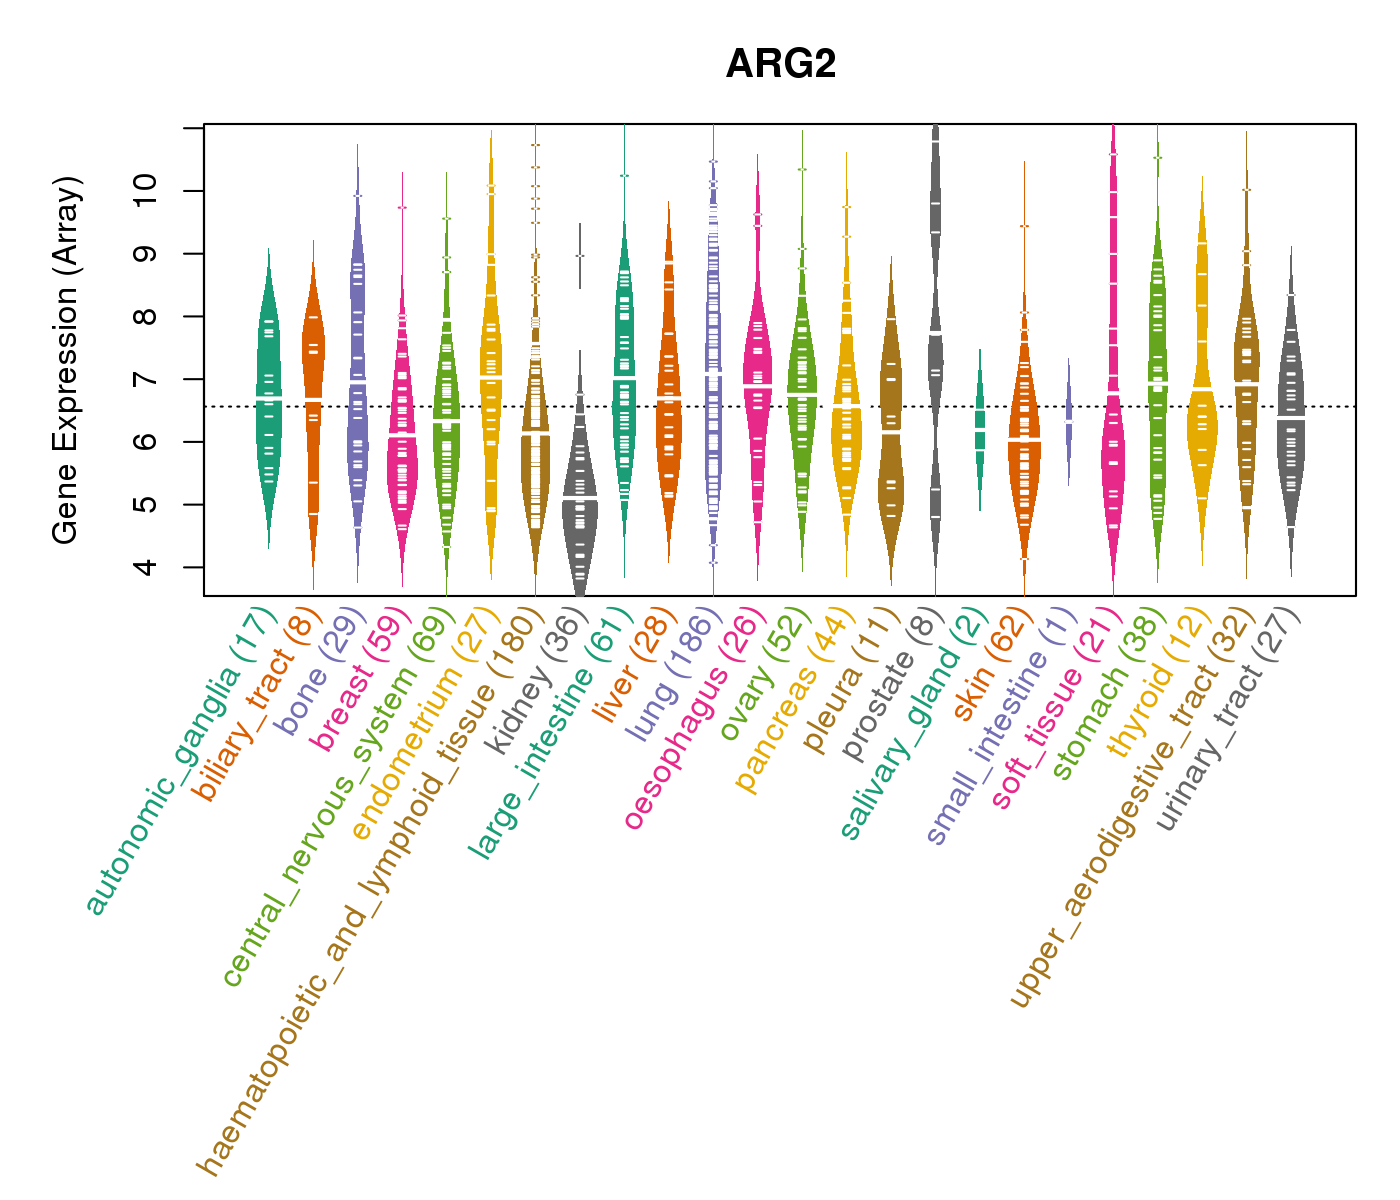
| Gene Expression for ARG2 |
| * CCLE gene expression data were extracted from CCLE_Expression_Entrez_2012-10-18.res: Gene-centric RMA-normalized mRNA expression data. |
 |
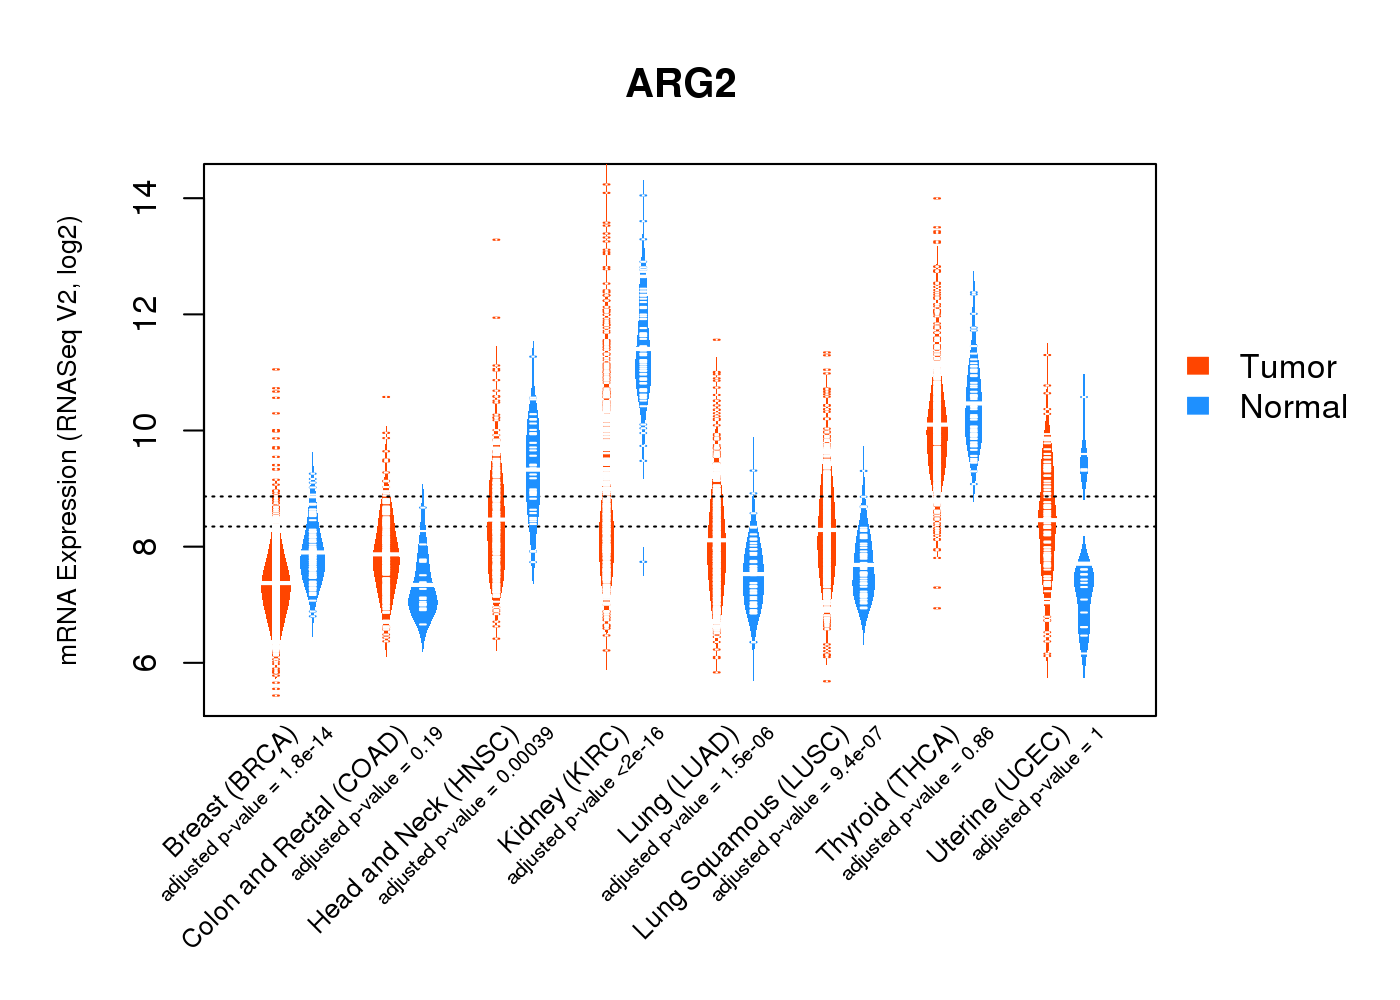
| * Normalized gene expression data of RNASeqV2 was extracted from TCGA using R package TCGA-Assembler. The URLs of all public data files on TCGA DCC data server were gathered at Jan-05-2015. Only eight cancer types have enough normal control samples for differential expression analysis. (t test, adjusted p<0.05 (using Benjamini-Hochberg FDR)) |
 |
| Top |
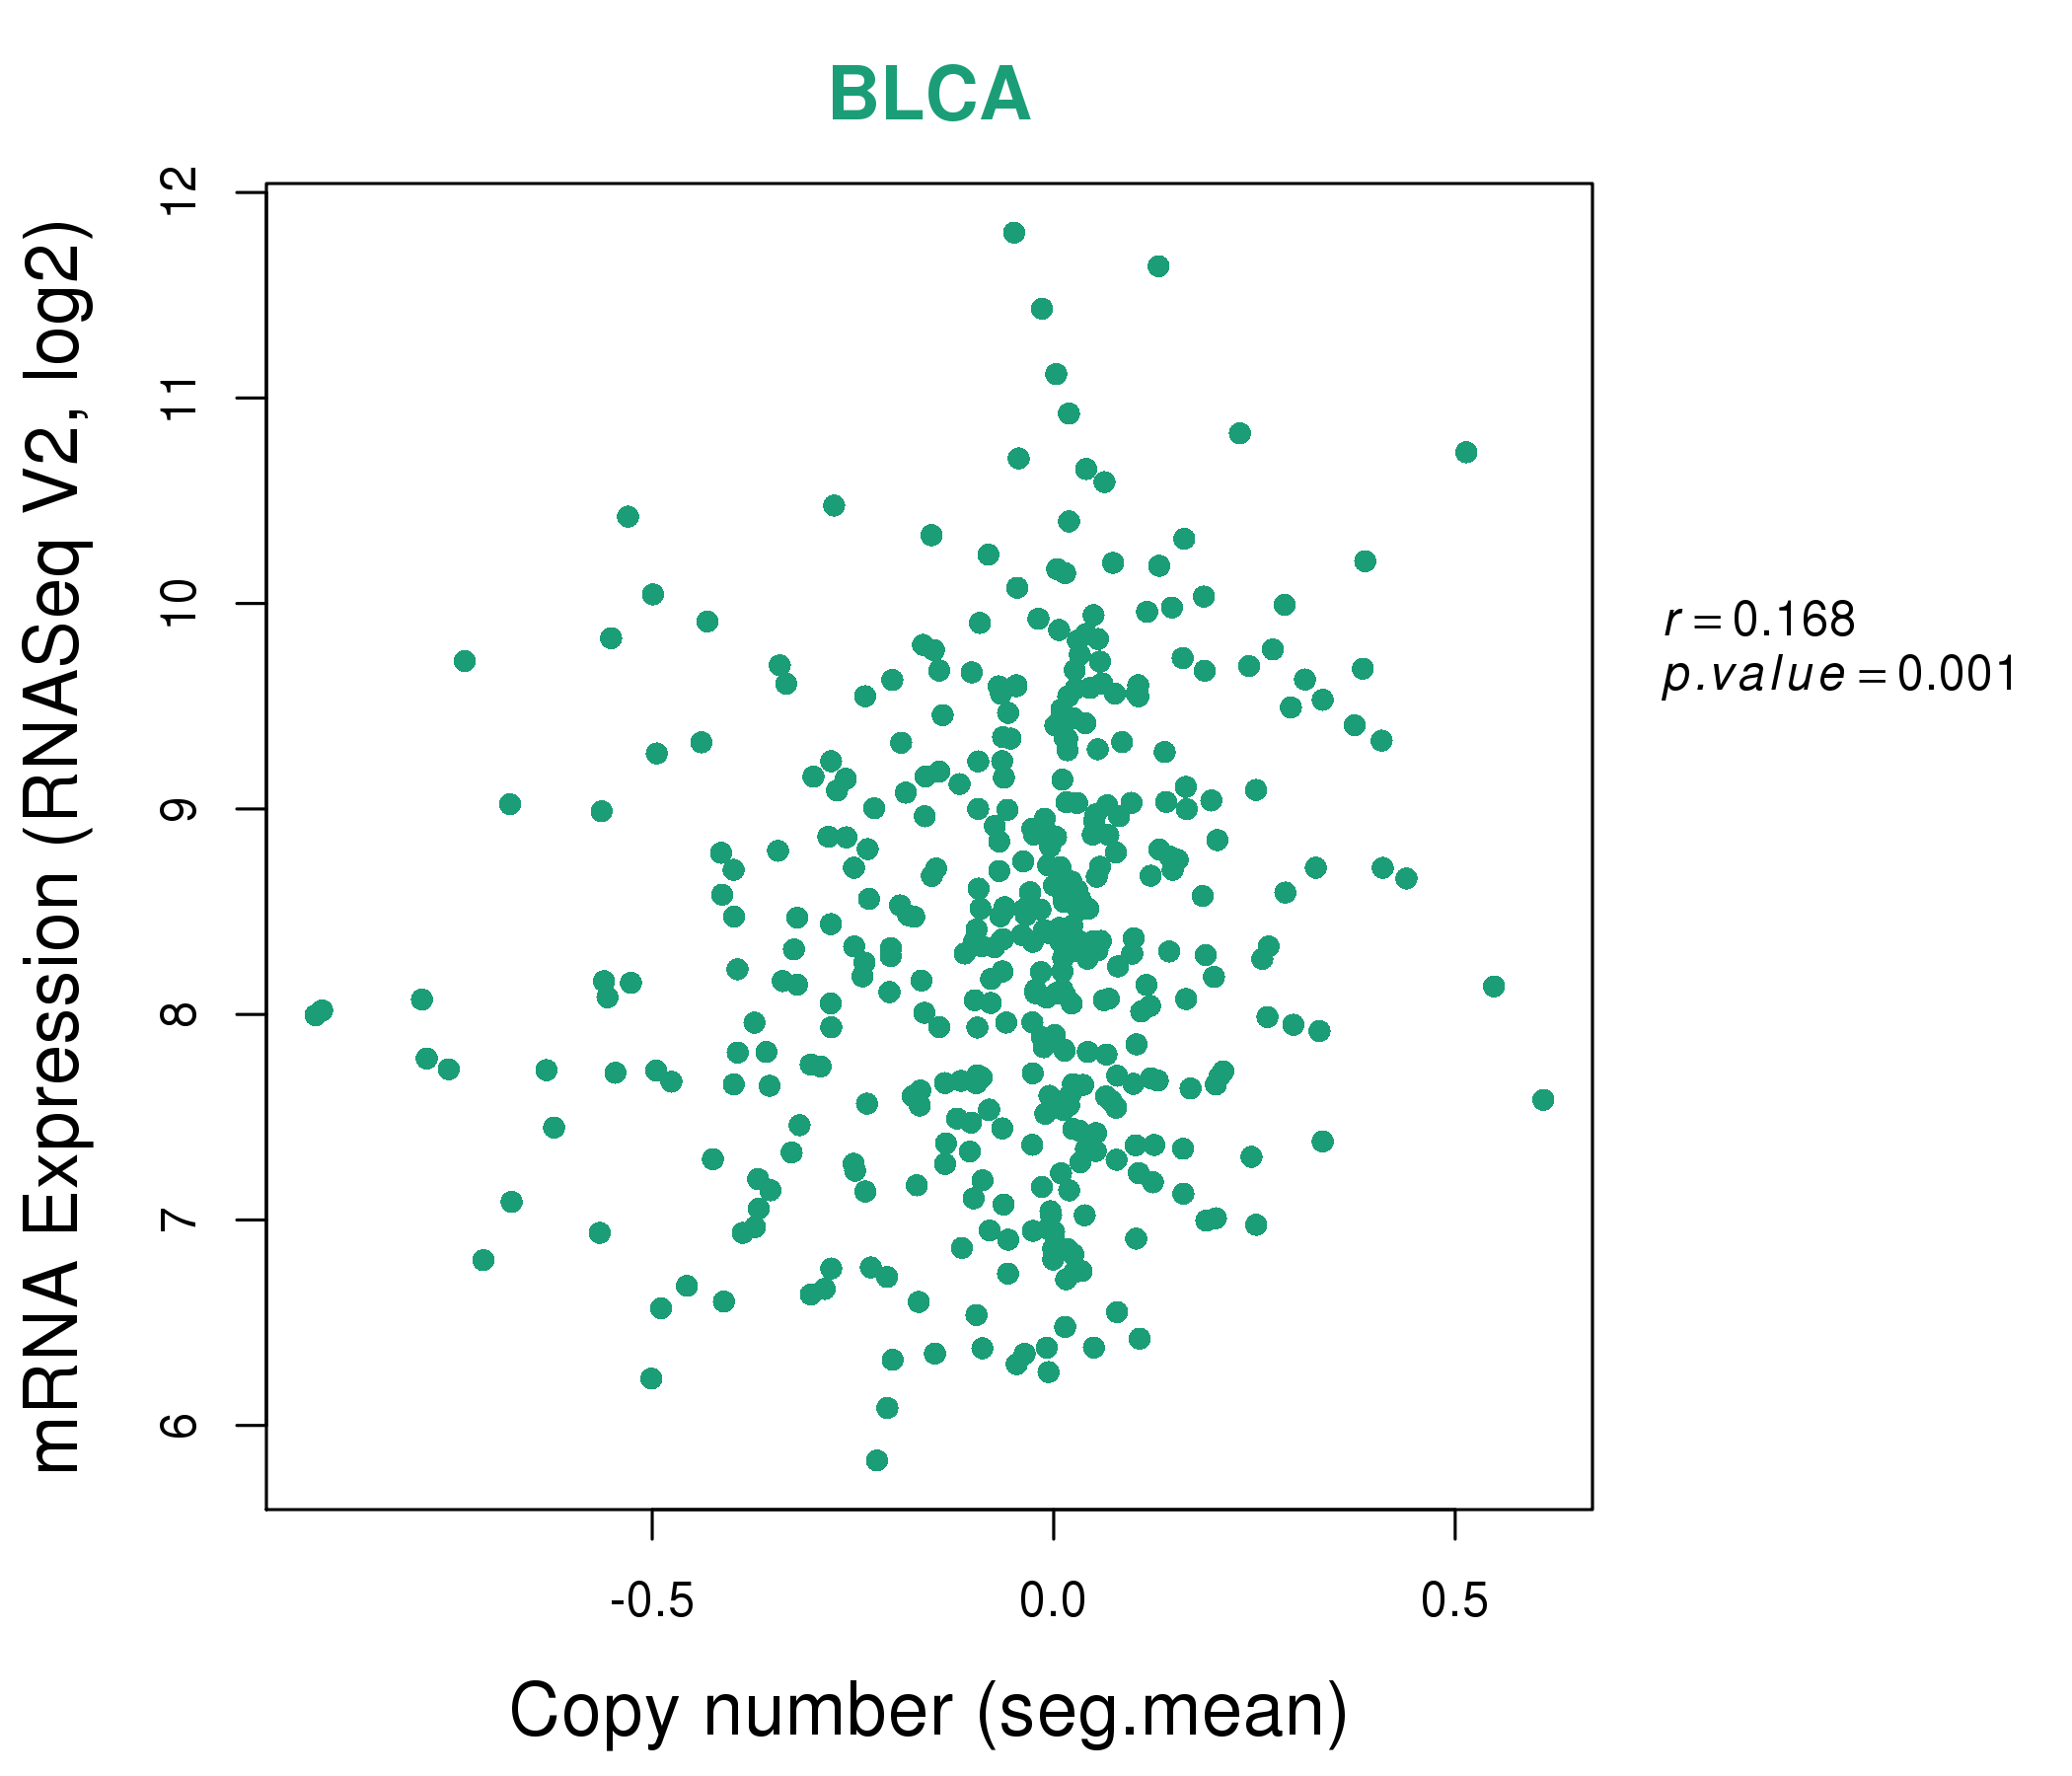
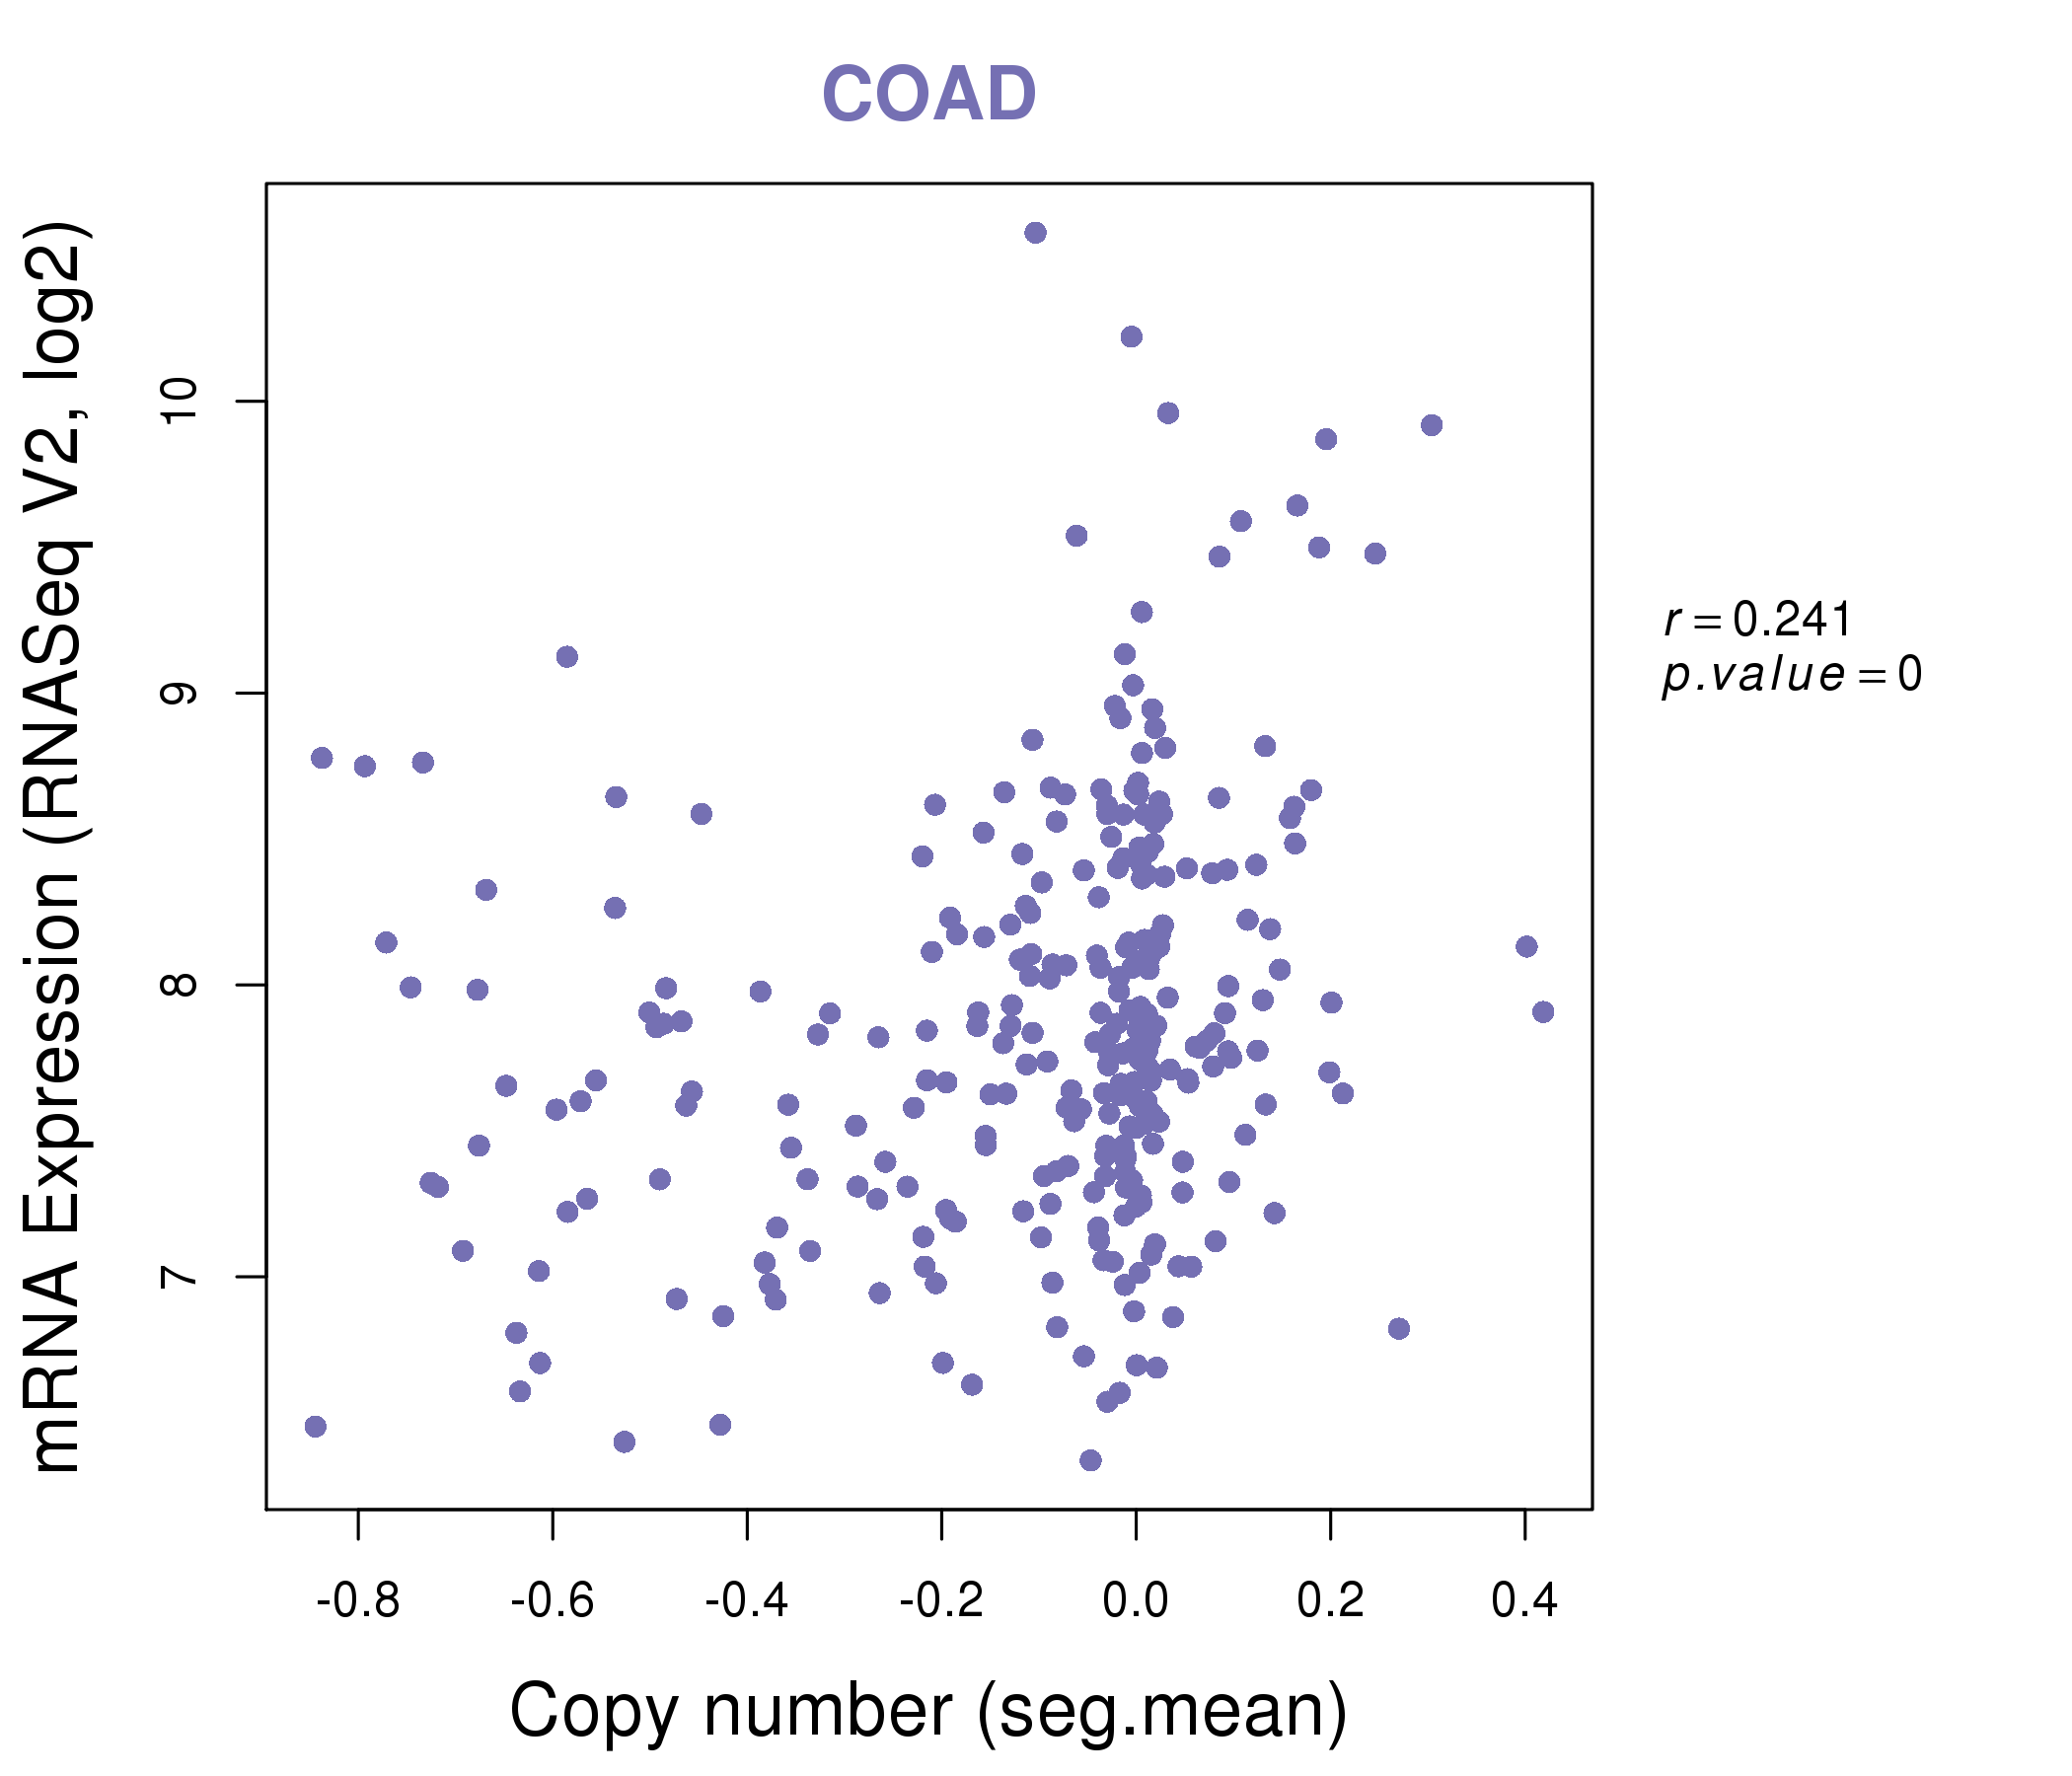
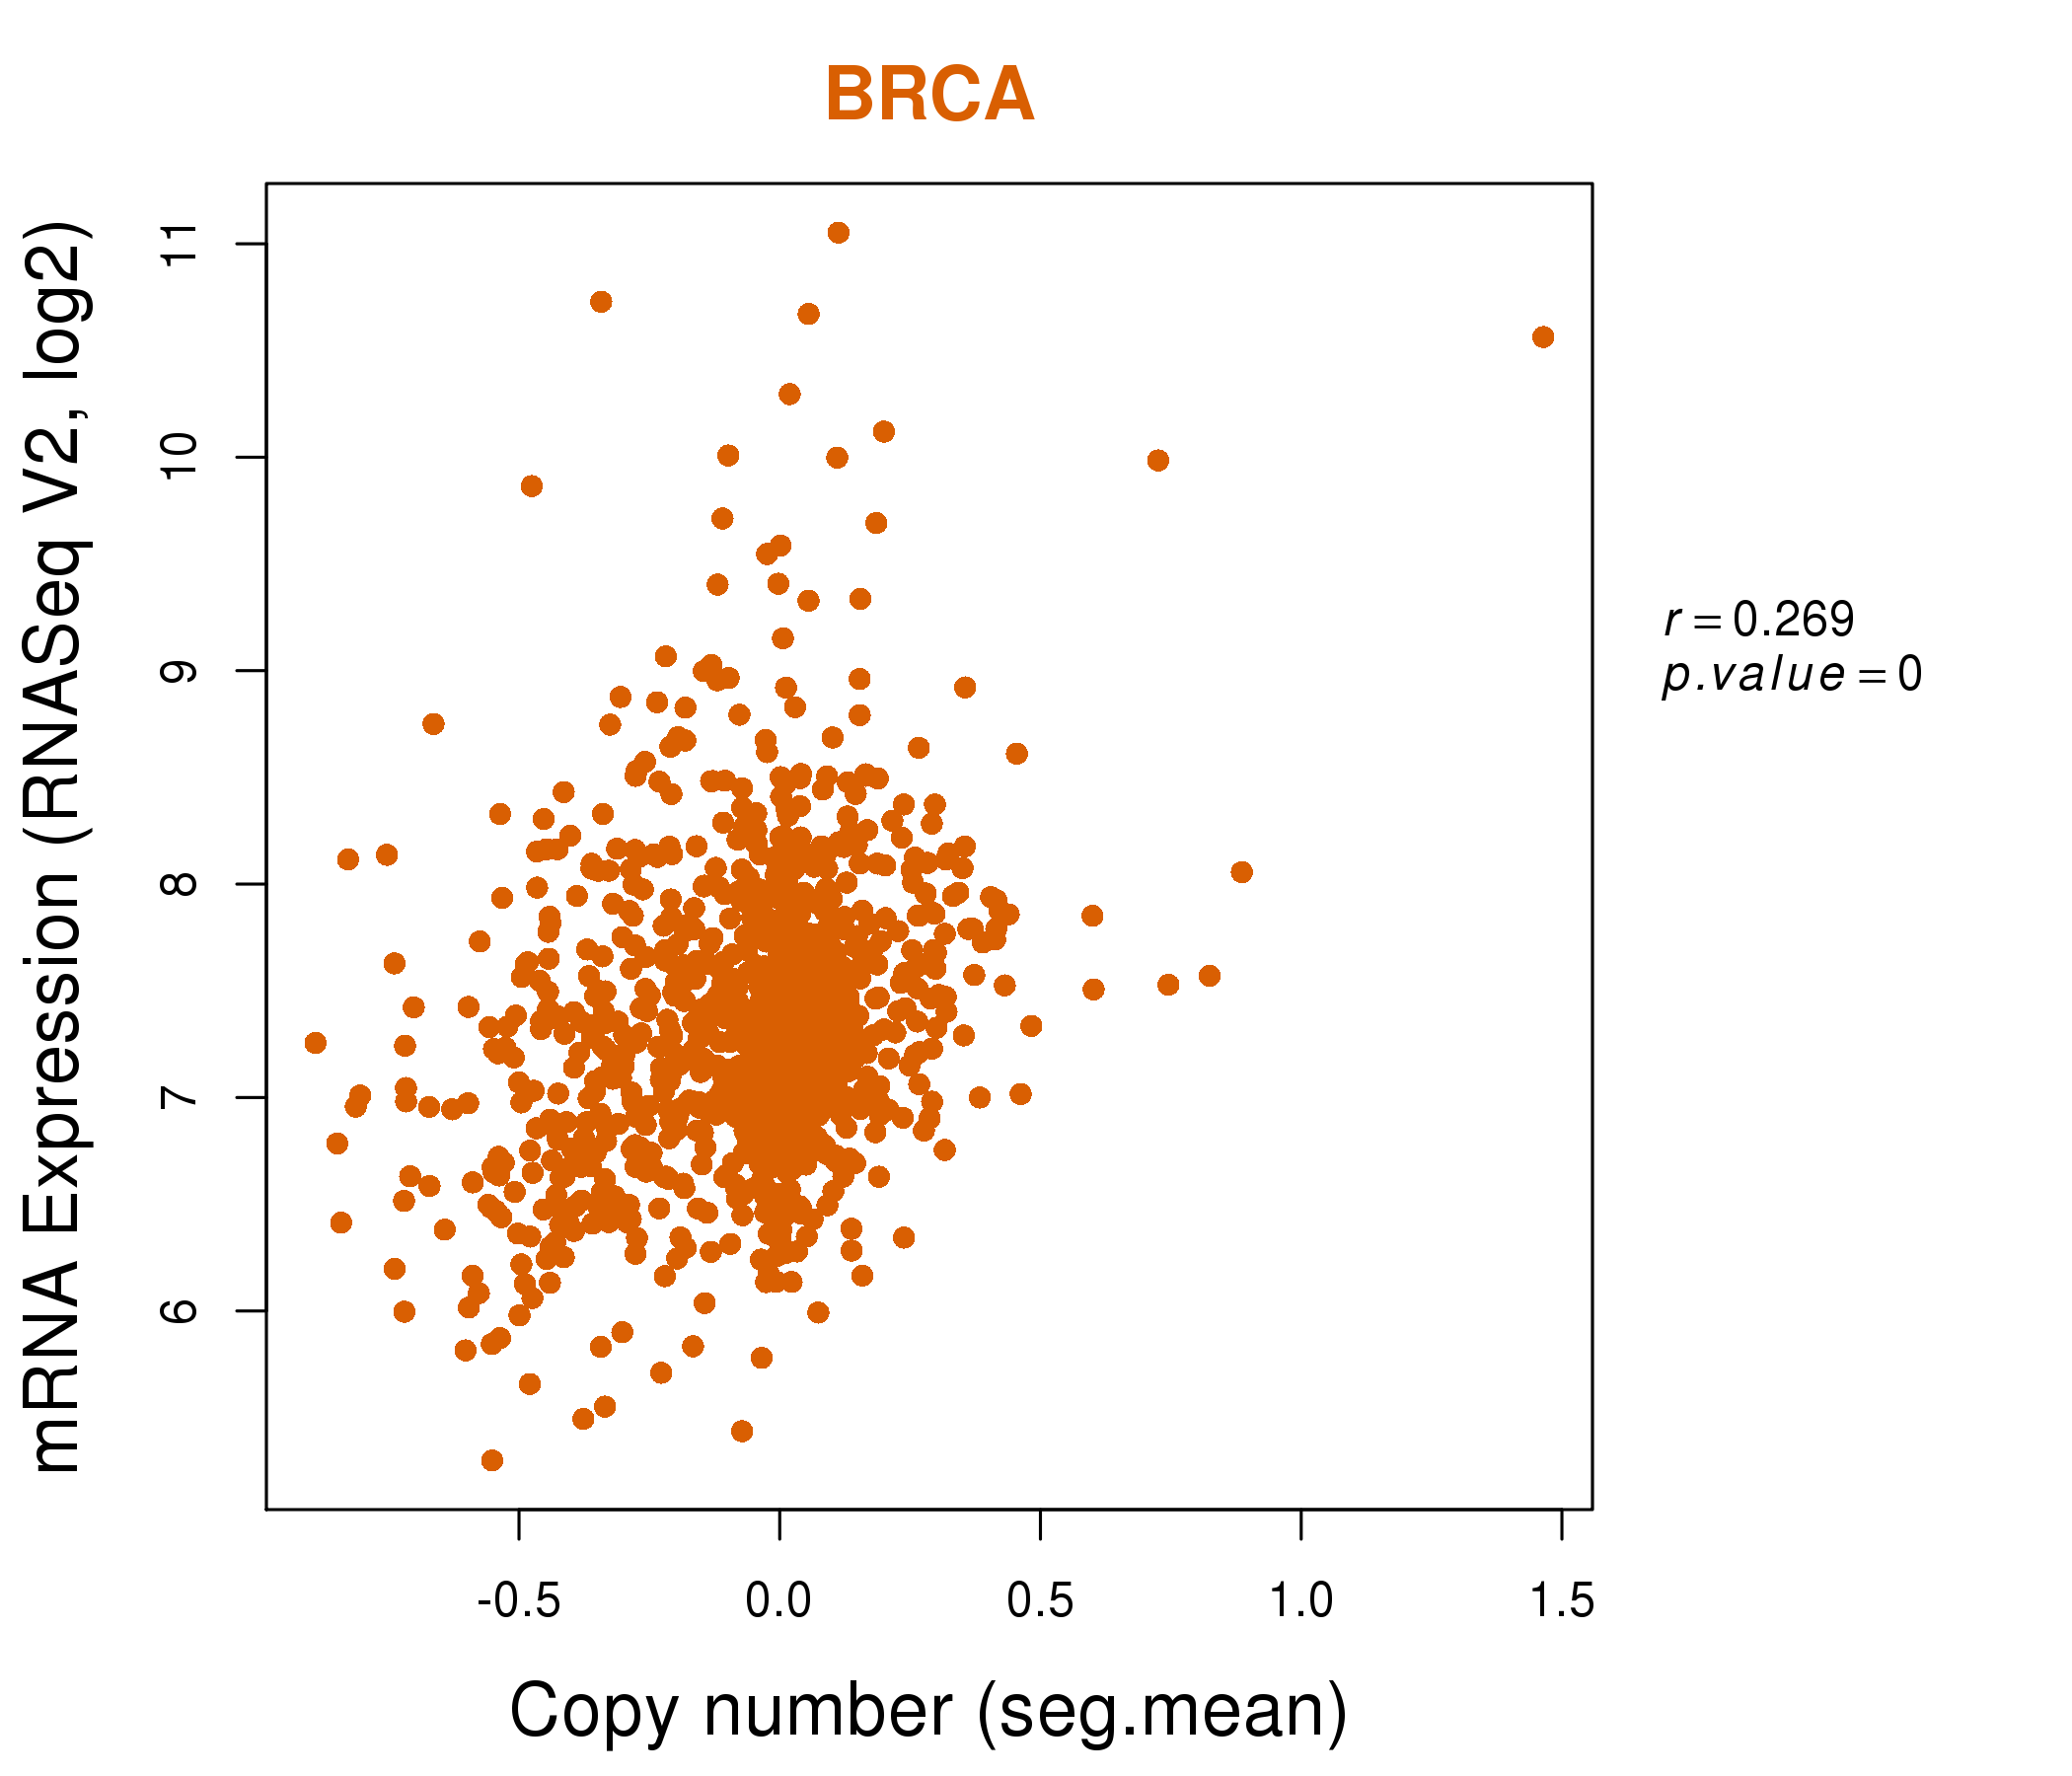
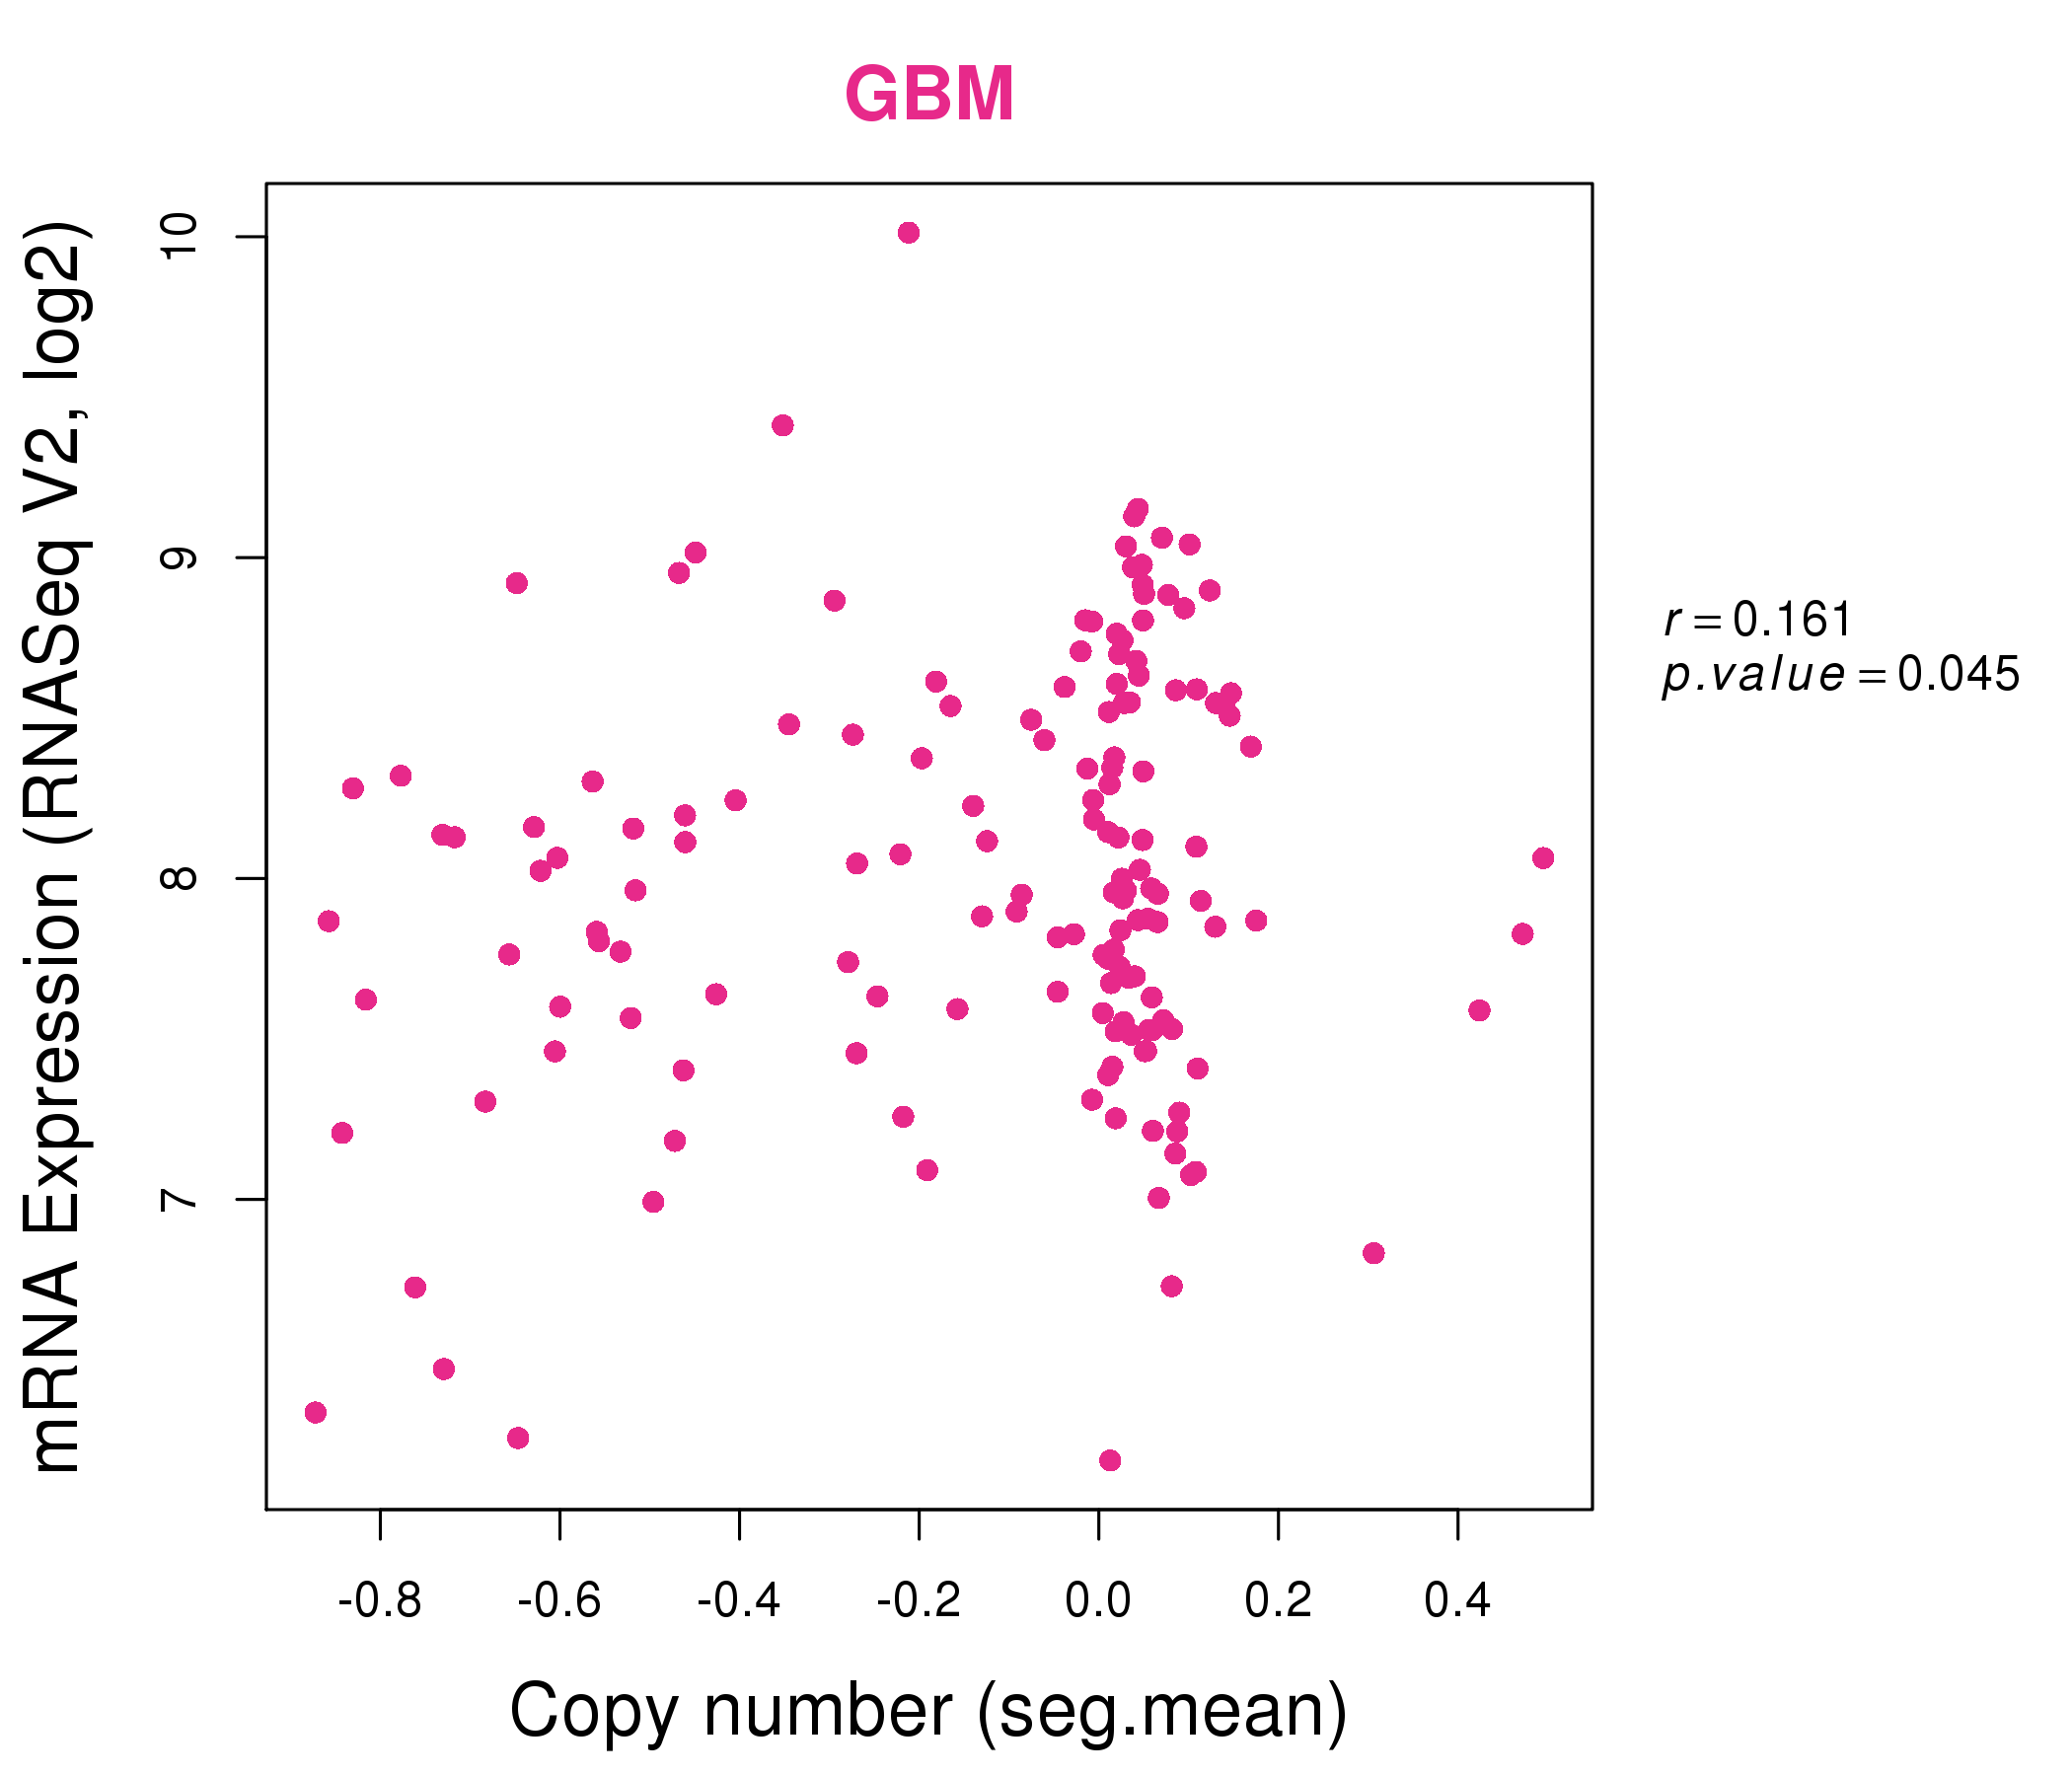
| * This plots show the correlation between CNV and gene expression. |
: Open all plots for all cancer types
 |
|
 |
|
| Top |
| Gene-Gene Network Information |
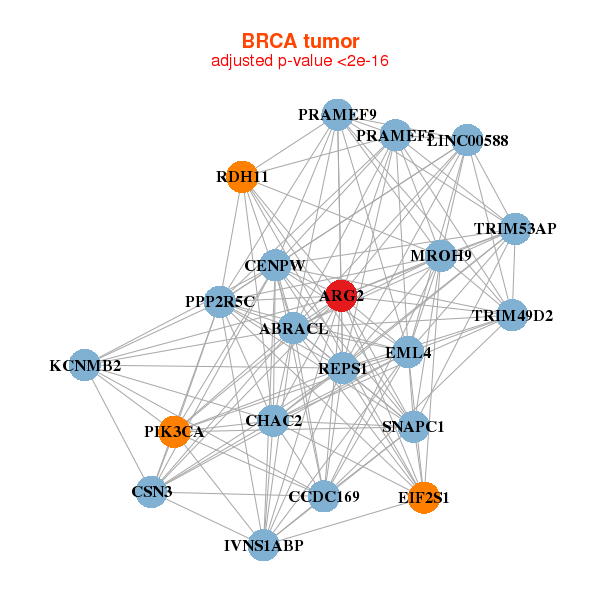
| * Co-Expression network figures were drawn using R package igraph. Only the top 20 genes with the highest correlations were shown. Red circle: input gene, orange circle: cell metabolism gene, sky circle: other gene |
: Open all plots for all cancer types
 |
| ||||
| ARG2,CCDC169,MROH9,ABRACL,LINC00588,CENPW,CHAC2, CSN3,EIF2S1,EML4,IVNS1ABP,KCNMB2,PIK3CA,PPP2R5C, PRAMEF5,PRAMEF9,RDH11,REPS1,SNAPC1,TRIM49D2,TRIM53AP | ANO6,ARG2,AZI2,CAT,GPATCH11,COL4A3BP,DDHD2, EIF4EBP2,FBXL5,GHR,MTMR10,OXCT1,PCYOX1,PDE3B, PEX19,PTPLB,RHOBTB3,SIK2,SLC25A16,SORT1,TRHDE | ||||
 |
| ||||
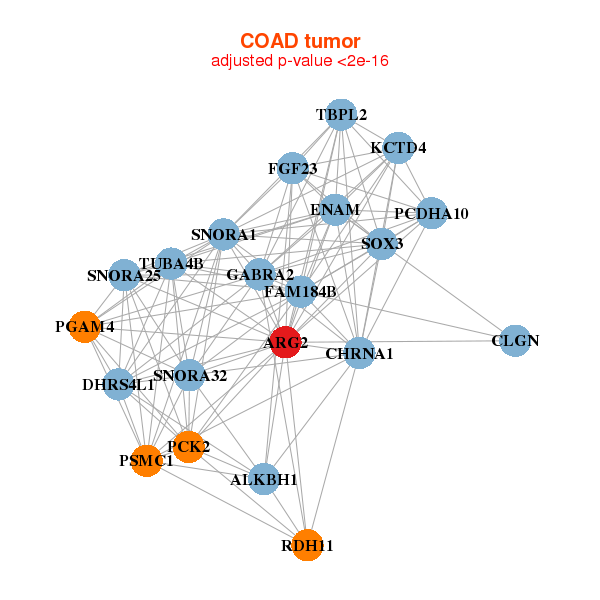
| ALKBH1,ARG2,CHRNA1,CLGN,DHRS4L1,ENAM,FAM184B, FGF23,GABRA2,KCTD4,PCDHA10,PCK2,PGAM4,PSMC1, RDH11,SNORA1,SNORA25,SNORA32,SOX3,TBPL2,TUBA4B | ARG2,C1orf105,TMEM252,CYP2C9,FLVCR1,GBA3,SLC52A1, HOXC8,HOXC9,MEP1B,NAT8B,OTC,PEPD,PTGR1, SLC23A1,SLC2A9,SLC6A4,SULT1E1,SULT2B1,AGMO,TMEM229A |

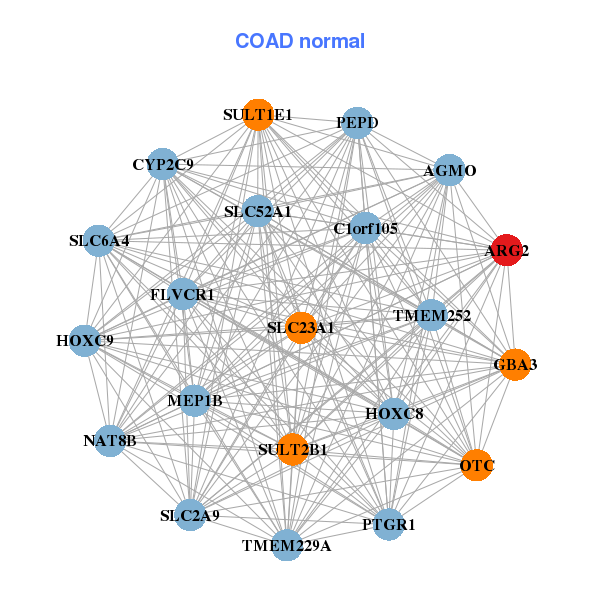
| * Co-Expression network figures were drawn using R package igraph. Only the top 20 genes with the highest correlations were shown. Red circle: input gene, orange circle: cell metabolism gene, sky circle: other gene |
: Open all plots for all cancer types
| Top |
: Open all interacting genes' information including KEGG pathway for all interacting genes from DAVID
| Top |
| Pharmacological Information for ARG2 |
| DB Category | DB Name | DB's ID and Url link |
| * Gene Centered Interaction Network. |
 |
| * Drug Centered Interaction Network. |
| DrugBank ID | Target Name | Drug Groups | Generic Name | Drug Centered Network | Drug Structure |
| DB00125 | arginase 2 | approved; nutraceutical | L-Arginine |  |  |
| DB00129 | arginase 2 | approved; nutraceutical | L-Ornithine | 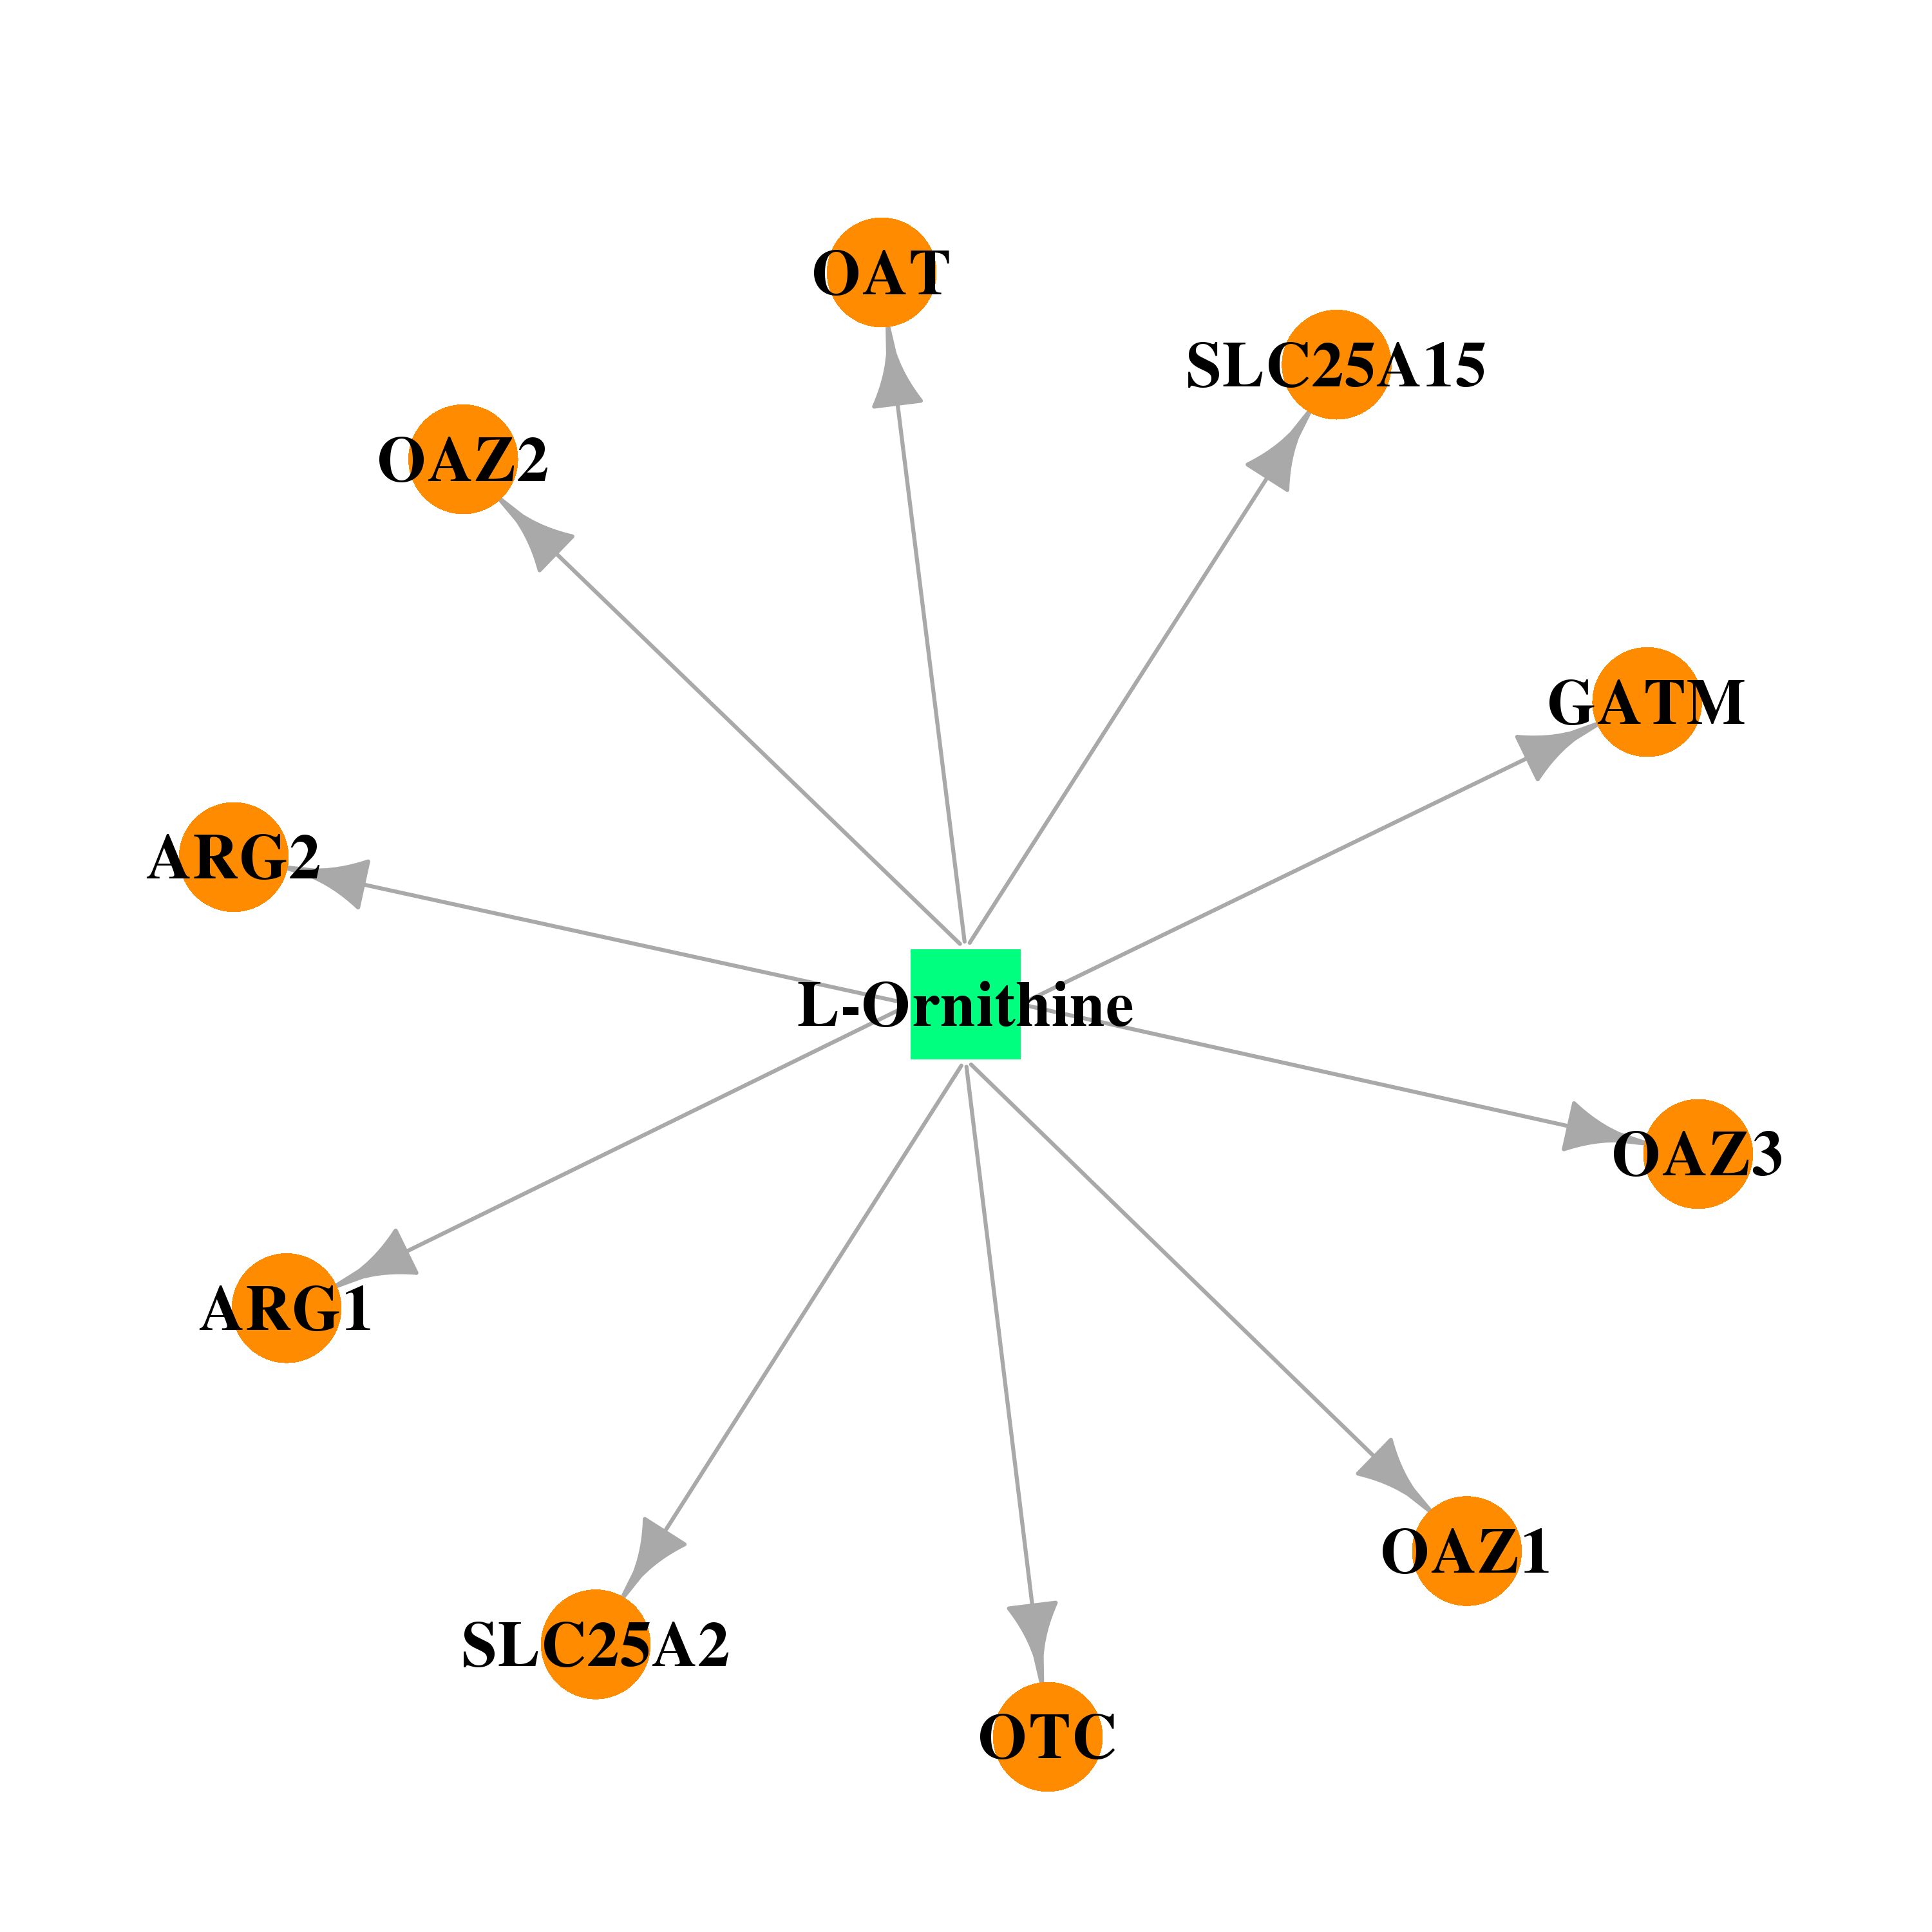 |  |
| DB03731 | arginase 2 | experimental | S-2-(Boronoethyl)-L-Cysteine |  |  |
| Top |
| Cross referenced IDs for ARG2 |
| * We obtained these cross-references from Uniprot database. It covers 150 different DBs, 18 categories. http://www.uniprot.org/help/cross_references_section |
: Open all cross reference information
|
Copyright © 2016-Present - The Univsersity of Texas Health Science Center at Houston @ |