|
|||||||||||||||||||||||||||||||||||||||||||||||||||||||||||||||||||||||||||||||||||||||||||||||||||||||||||||||||||||||||||||||||||||||||||||||||||||||||||||||||||||||||||||||||||||||||||||||||||||||||||||||||||||||||||||||||||||||||||||||||||||||||||||||||||||||||||||||||||||||||||||||||||||||||||||||||||||||||||||||||||||||||||||||||||||||||||||||||||||||||||||||||||||||||||||||||||||||||
| |
| Phenotypic Information (metabolism pathway, cancer, disease, phenome) |
| |
| |
| Gene-Gene Network Information: Co-Expression Network, Interacting Genes & KEGG |
| |
|


| Gene Summary for LCT |
| Basic gene info. | Gene symbol | LCT |
| Gene name | lactase | |
| Synonyms | LAC|LPH|LPH1 | |
| Cytomap | UCSC genome browser: 2q21 | |
| Genomic location | chr2 :136545414-136594750 | |
| Type of gene | protein-coding | |
| RefGenes | NM_002299.2, | |
| Ensembl id | ENSG00000115850 | |
| Description | lactase-glycosylceramidaselactase-phlorizin hydrolaselactase-phlorizin hydrolase-1 | |
| Modification date | 20141207 | |
| dbXrefs | MIM : 603202 | |
| HGNC : HGNC | ||
| Ensembl : ENSG00000115850 | ||
| HPRD : 04437 | ||
| Vega : OTTHUMG00000131738 | ||
| Protein | UniProt: go to UniProt's Cross Reference DB Table | |
| Expression | CleanEX: HS_LCT | |
| BioGPS: 3938 | ||
| Gene Expression Atlas: ENSG00000115850 | ||
| The Human Protein Atlas: ENSG00000115850 | ||
| Pathway | NCI Pathway Interaction Database: LCT | |
| KEGG: LCT | ||
| REACTOME: LCT | ||
| ConsensusPathDB | ||
| Pathway Commons: LCT | ||
| Metabolism | MetaCyc: LCT | |
| HUMANCyc: LCT | ||
| Regulation | Ensembl's Regulation: ENSG00000115850 | |
| miRBase: chr2 :136,545,414-136,594,750 | ||
| TargetScan: NM_002299 | ||
| cisRED: ENSG00000115850 | ||
| Context | iHOP: LCT | |
| cancer metabolism search in PubMed: LCT | ||
| UCL Cancer Institute: LCT | ||
| Assigned class in ccmGDB | C | |
| Top |
| Phenotypic Information for LCT(metabolism pathway, cancer, disease, phenome) |
| Cancer | CGAP: LCT |
| Familial Cancer Database: LCT | |
| * This gene is included in those cancer gene databases. |
|
|
|
|
|
| . | |||||||||||||||||||||||||||||||||||||||||||||||||||||||||||||||||||||||||||||||||||||||||||||||||||||||||||||||||||||||||||||||||||||||||||||||||||||||||||||||||||||||||||||||||||||||||||||||||||||||||||||||||||||||||||||||||||||||||||||||||||||||||||||||||||||||||||||||||||||||||||||||||||||||||||||||||||||||||||||||||||||||||||||||||||||||||||||||||||||||||||||||||||||||||||||||||||
Oncogene 1 | Significant driver gene in | ||||||||||||||||||||||||||||||||||||||||||||||||||||||||||||||||||||||||||||||||||||||||||||||||||||||||||||||||||||||||||||||||||||||||||||||||||||||||||||||||||||||||||||||||||||||||||||||||||||||||||||||||||||||||||||||||||||||||||||||||||||||||||||||||||||||||||||||||||||||||||||||||||||||||||||||||||||||||||||||||||||||||||||||||||||||||||||||||||||||||||||||||||||||||||||||||||||||||
| cf) number; DB name 1 Oncogene; http://nar.oxfordjournals.org/content/35/suppl_1/D721.long, 2 Tumor Suppressor gene; https://bioinfo.uth.edu/TSGene/, 3 Cancer Gene Census; http://www.nature.com/nrc/journal/v4/n3/abs/nrc1299.html, 4 CancerGenes; http://nar.oxfordjournals.org/content/35/suppl_1/D721.long, 5 Network of Cancer Gene; http://ncg.kcl.ac.uk/index.php, 1Therapeutic Vulnerabilities in Cancer; http://cbio.mskcc.org/cancergenomics/statius/ |
| KEGG_GALACTOSE_METABOLISM REACTOME_METABOLISM_OF_CARBOHYDRATES | |
| OMIM | |
| Orphanet | |
| Disease | KEGG Disease: LCT |
| MedGen: LCT (Human Medical Genetics with Condition) | |
| ClinVar: LCT | |
| Phenotype | MGI: LCT (International Mouse Phenotyping Consortium) |
| PhenomicDB: LCT | |
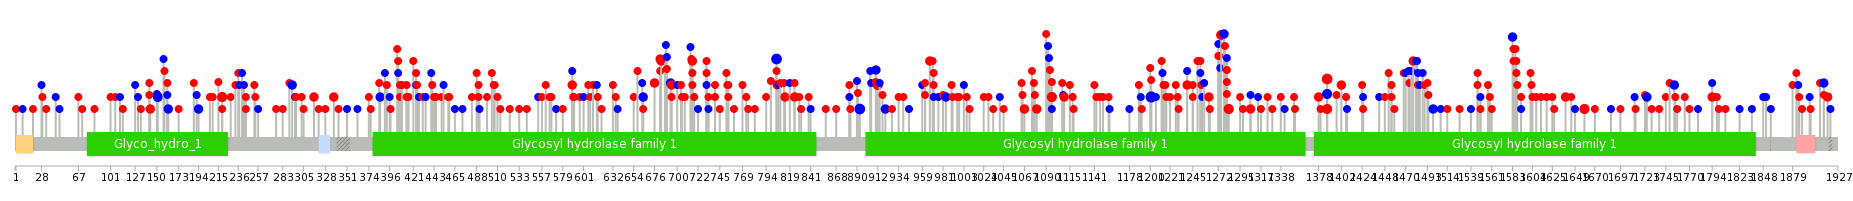
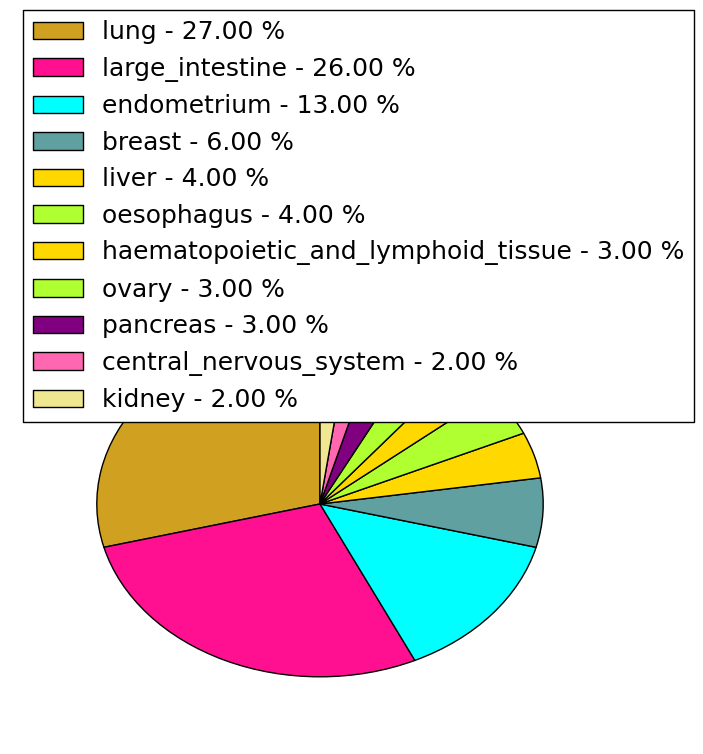
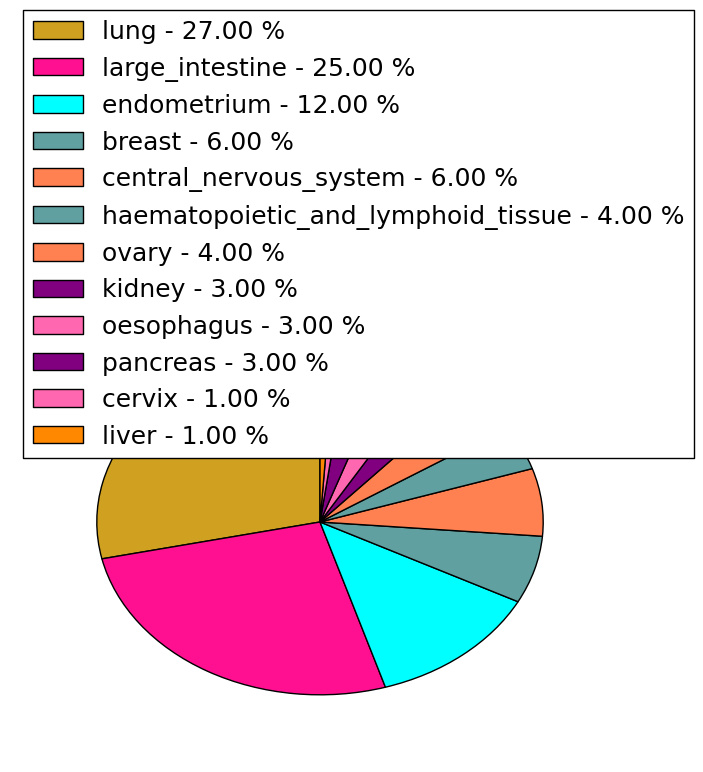
| Mutations for LCT |
| * Under tables are showing count per each tissue to give us broad intuition about tissue specific mutation patterns.You can go to the detailed page for each mutation database's web site. |
| There's no structural variation information in COSMIC data for this gene. |
| * From mRNA Sanger sequences, Chitars2.0 arranged chimeric transcripts. This table shows LCT related fusion information. |
| ID | Head Gene | Tail Gene | Accession | Gene_a | qStart_a | qEnd_a | Chromosome_a | tStart_a | tEnd_a | Gene_a | qStart_a | qEnd_a | Chromosome_a | tStart_a | tEnd_a |
| AY191611 | LCT | 1 | 3508 | 2 | 136551907 | 136570529 | MBTPS1 | 3509 | 3628 | 16 | 84115913 | 84116032 | |
| BF929873 | SSH2 | 14 | 439 | 17 | 27995097 | 27995522 | LCT | 439 | 473 | 2 | 136554299 | 136554353 | |
| Top |
| Mutation type/ Tissue ID | brca | cns | cerv | endome | haematopo | kidn | Lintest | liver | lung | ns | ovary | pancre | prost | skin | stoma | thyro | urina | |||
| Total # sample | 1 | |||||||||||||||||||
| GAIN (# sample) | ||||||||||||||||||||
| LOSS (# sample) | 1 |
| cf) Tissue ID; Tissue type (1; Breast, 2; Central_nervous_system, 3; Cervix, 4; Endometrium, 5; Haematopoietic_and_lymphoid_tissue, 6; Kidney, 7; Large_intestine, 8; Liver, 9; Lung, 10; NS, 11; Ovary, 12; Pancreas, 13; Prostate, 14; Skin, 15; Stomach, 16; Thyroid, 17; Urinary_tract) |
| Top |
|
 |
| Top |
| Stat. for Non-Synonymous SNVs (# total SNVs=251) | (# total SNVs=93) |
 |  |
(# total SNVs=4) | (# total SNVs=2) |
 |  |
| Top |
| * When you move the cursor on each content, you can see more deailed mutation information on the Tooltip. Those are primary_site,primary_histology,mutation(aa),pubmedID. |
| GRCh37 position | Mutation(aa) | Unique sampleID count |
| chr2:136567502-136567502 | p.F805F | 5 |
| chr2:136566314-136566314 | p.A1201A | 5 |
| chr2:136564712-136564712 | p.S1387P | 4 |
| chr2:136567238-136567238 | p.F893F | 4 |
| chr2:136570190-136570190 | p.G682S | 3 |
| chr2:136564711-136564711 | p.S1387F | 3 |
| chr2:136594287-136594287 | p.F151F | 3 |
| chr2:136570467-136570467 | p.H589H | 3 |
| chr2:136555599-136555599 | p.R1659Q | 3 |
| chr2:136566094-136566094 | p.G1275R | 3 |
| Top |
|
 |
| Point Mutation/ Tissue ID | 1 | 2 | 3 | 4 | 5 | 6 | 7 | 8 | 9 | 10 | 11 | 12 | 13 | 14 | 15 | 16 | 17 | 18 | 19 | 20 |
| # sample | 5 | 11 | 3 | 43 | 5 | 11 | 4 | 1 | 43 | 22 | 7 | 48 | 21 | 2 | 23 | |||||
| # mutation | 5 | 11 | 3 | 48 | 5 | 11 | 4 | 1 | 50 | 23 | 7 | 69 | 26 | 2 | 42 | |||||
| nonsynonymous SNV | 4 | 9 | 2 | 34 | 3 | 8 | 2 | 1 | 40 | 17 | 7 | 40 | 16 | 1 | 30 | |||||
| synonymous SNV | 1 | 2 | 1 | 14 | 2 | 3 | 2 | 10 | 6 | 29 | 10 | 1 | 12 |
| cf) Tissue ID; Tissue type (1; BLCA[Bladder Urothelial Carcinoma], 2; BRCA[Breast invasive carcinoma], 3; CESC[Cervical squamous cell carcinoma and endocervical adenocarcinoma], 4; COAD[Colon adenocarcinoma], 5; GBM[Glioblastoma multiforme], 6; Glioma Low Grade, 7; HNSC[Head and Neck squamous cell carcinoma], 8; KICH[Kidney Chromophobe], 9; KIRC[Kidney renal clear cell carcinoma], 10; KIRP[Kidney renal papillary cell carcinoma], 11; LAML[Acute Myeloid Leukemia], 12; LUAD[Lung adenocarcinoma], 13; LUSC[Lung squamous cell carcinoma], 14; OV[Ovarian serous cystadenocarcinoma ], 15; PAAD[Pancreatic adenocarcinoma], 16; PRAD[Prostate adenocarcinoma], 17; SKCM[Skin Cutaneous Melanoma], 18:STAD[Stomach adenocarcinoma], 19:THCA[Thyroid carcinoma], 20:UCEC[Uterine Corpus Endometrial Carcinoma]) |
| Top |
| * We represented just top 10 SNVs. When you move the cursor on each content, you can see more deailed mutation information on the Tooltip. Those are primary_site, primary_histology, mutation(aa), pubmedID. |
| Genomic Position | Mutation(aa) | Unique sampleID count |
| chr2:136564712 | p.S1387P | 4 |
| chr2:136566094 | p.G1275R | 3 |
| chr2:136567238 | p.S1387S | 3 |
| chr2:136564710 | p.F893L | 3 |
| chr2:136567006 | p.D1478N | 2 |
| chr2:136567182 | p.F386F | 2 |
| chr2:136570087 | p.D824N | 2 |
| chr2:136564885 | p.G1546S | 2 |
| chr2:136567187 | p.G731E | 2 |
| chr2:136567447 | p.L683M | 2 |
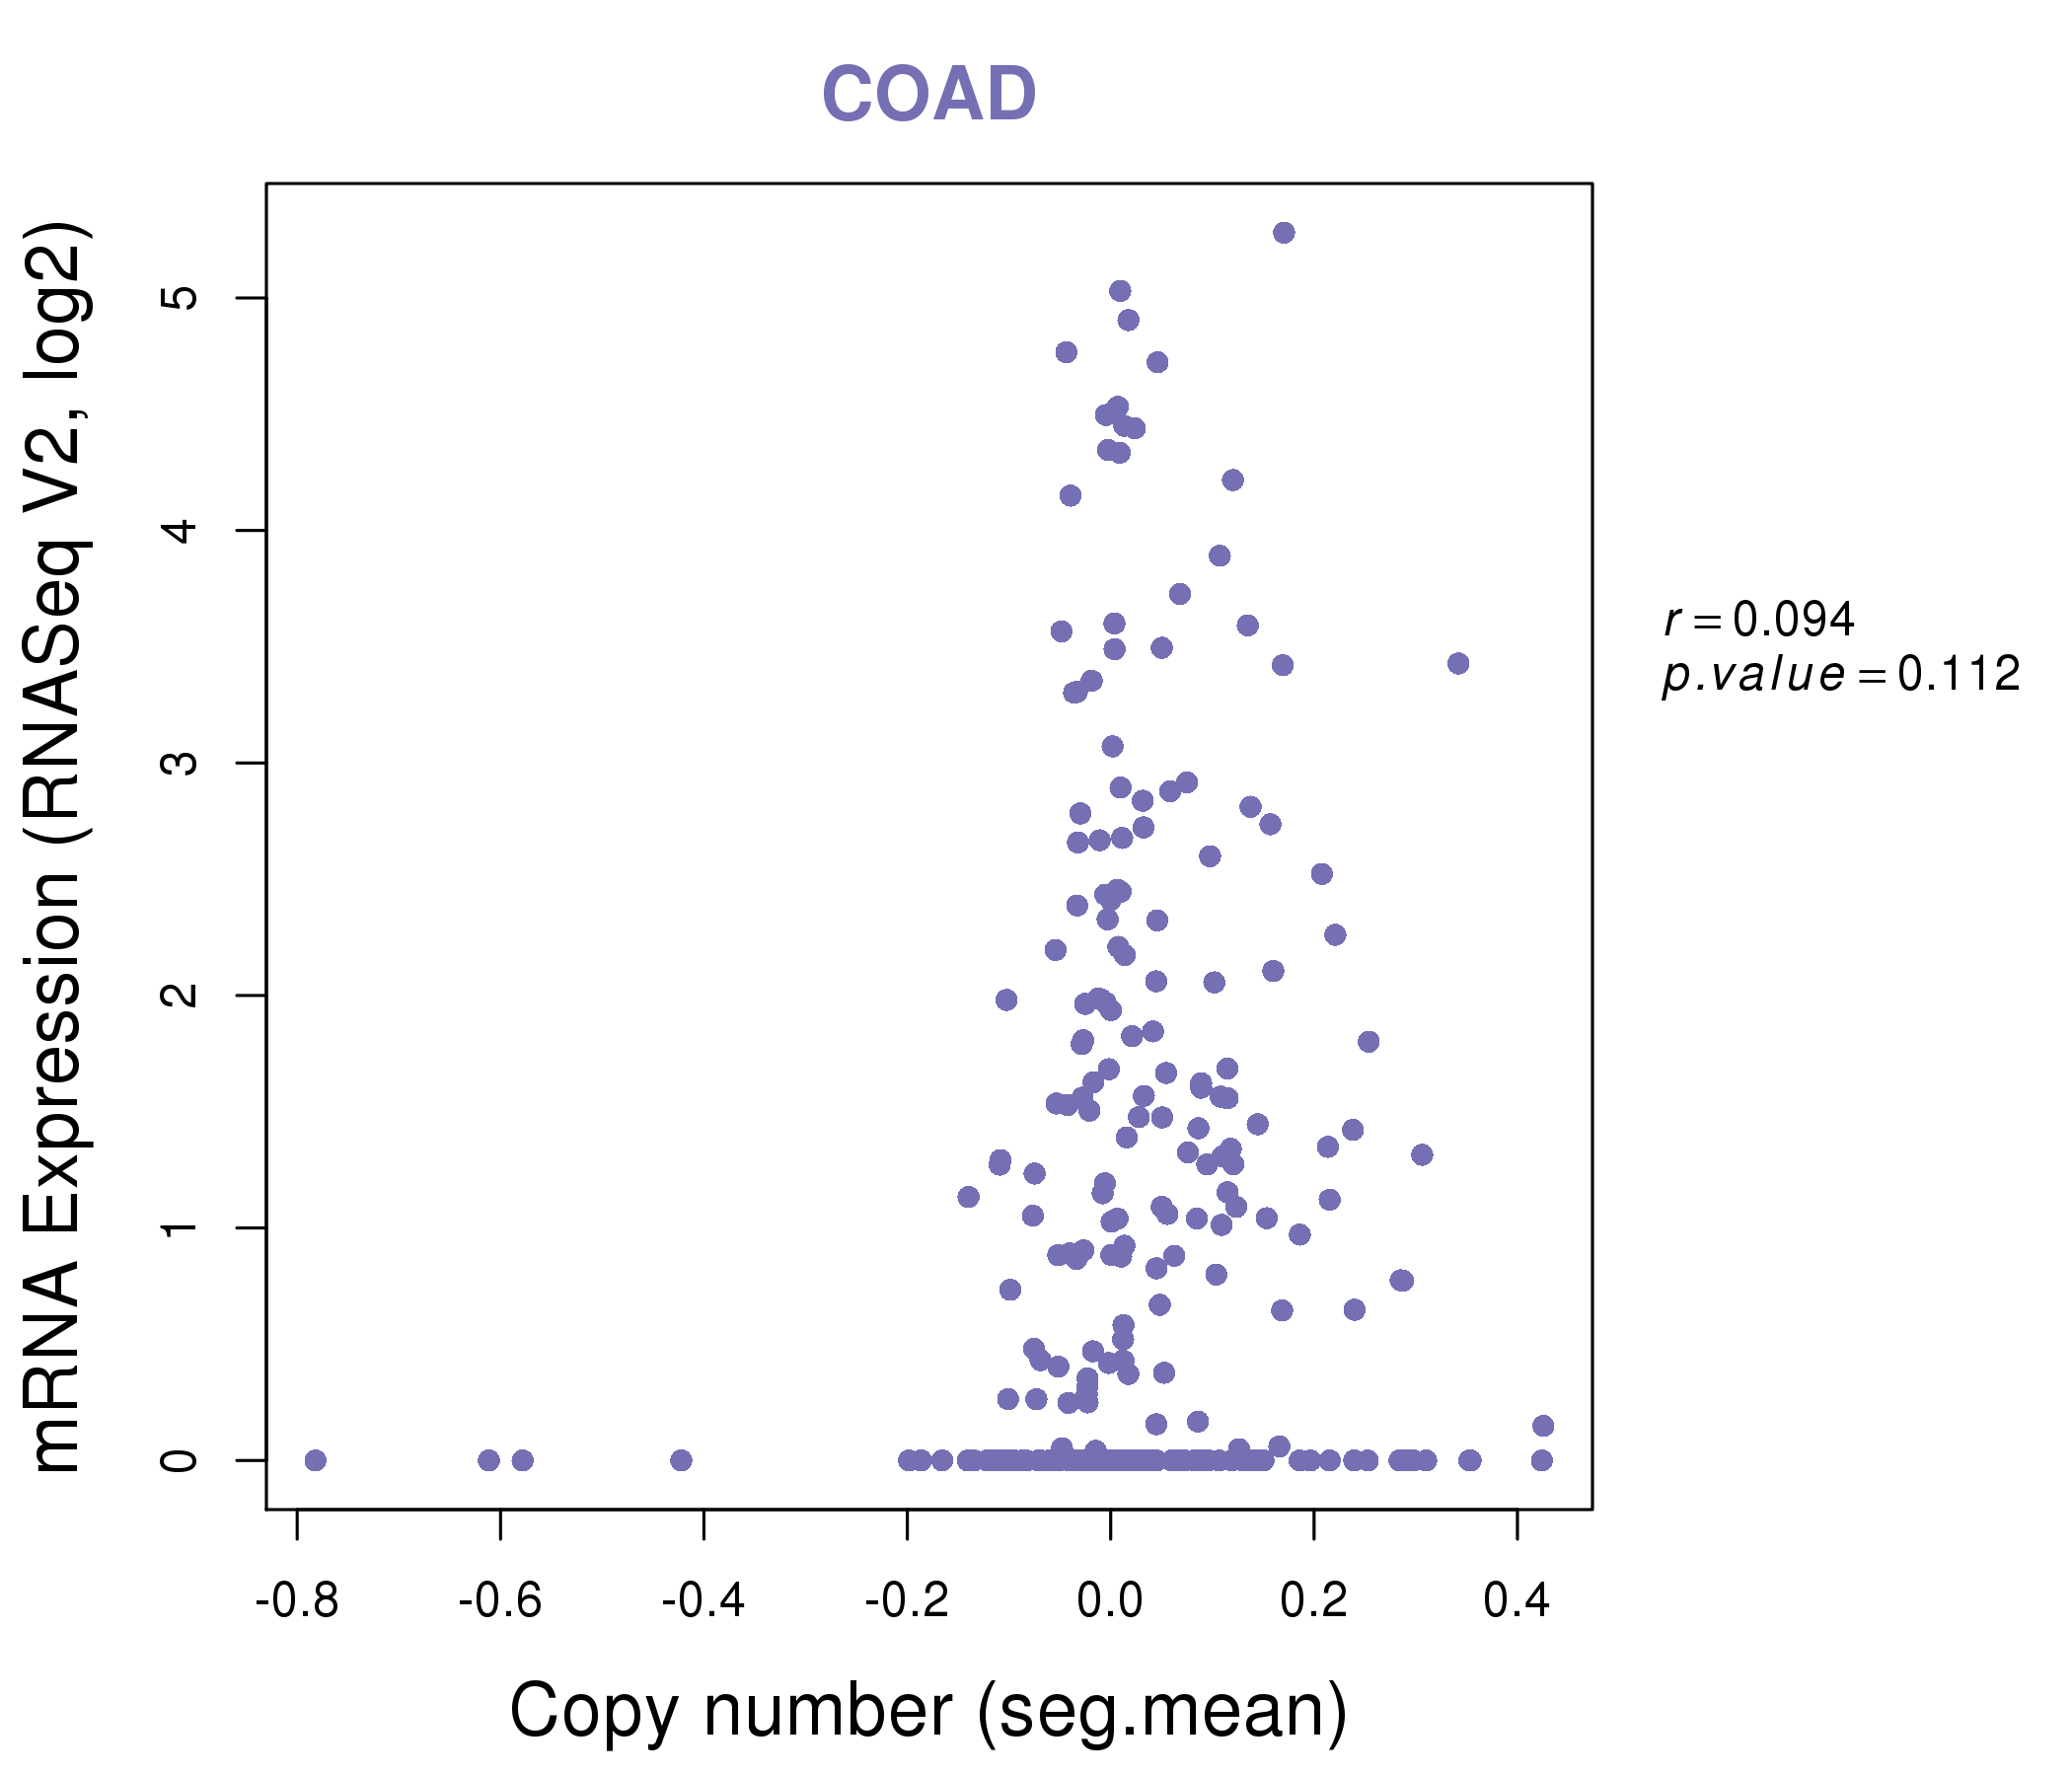
| * Copy number data were extracted from TCGA using R package TCGA-Assembler. The URLs of all public data files on TCGA DCC data server were gathered on Jan-05-2015. Function ProcessCNAData in TCGA-Assembler package was used to obtain gene-level copy number value which is calculated as the average copy number of the genomic region of a gene. |
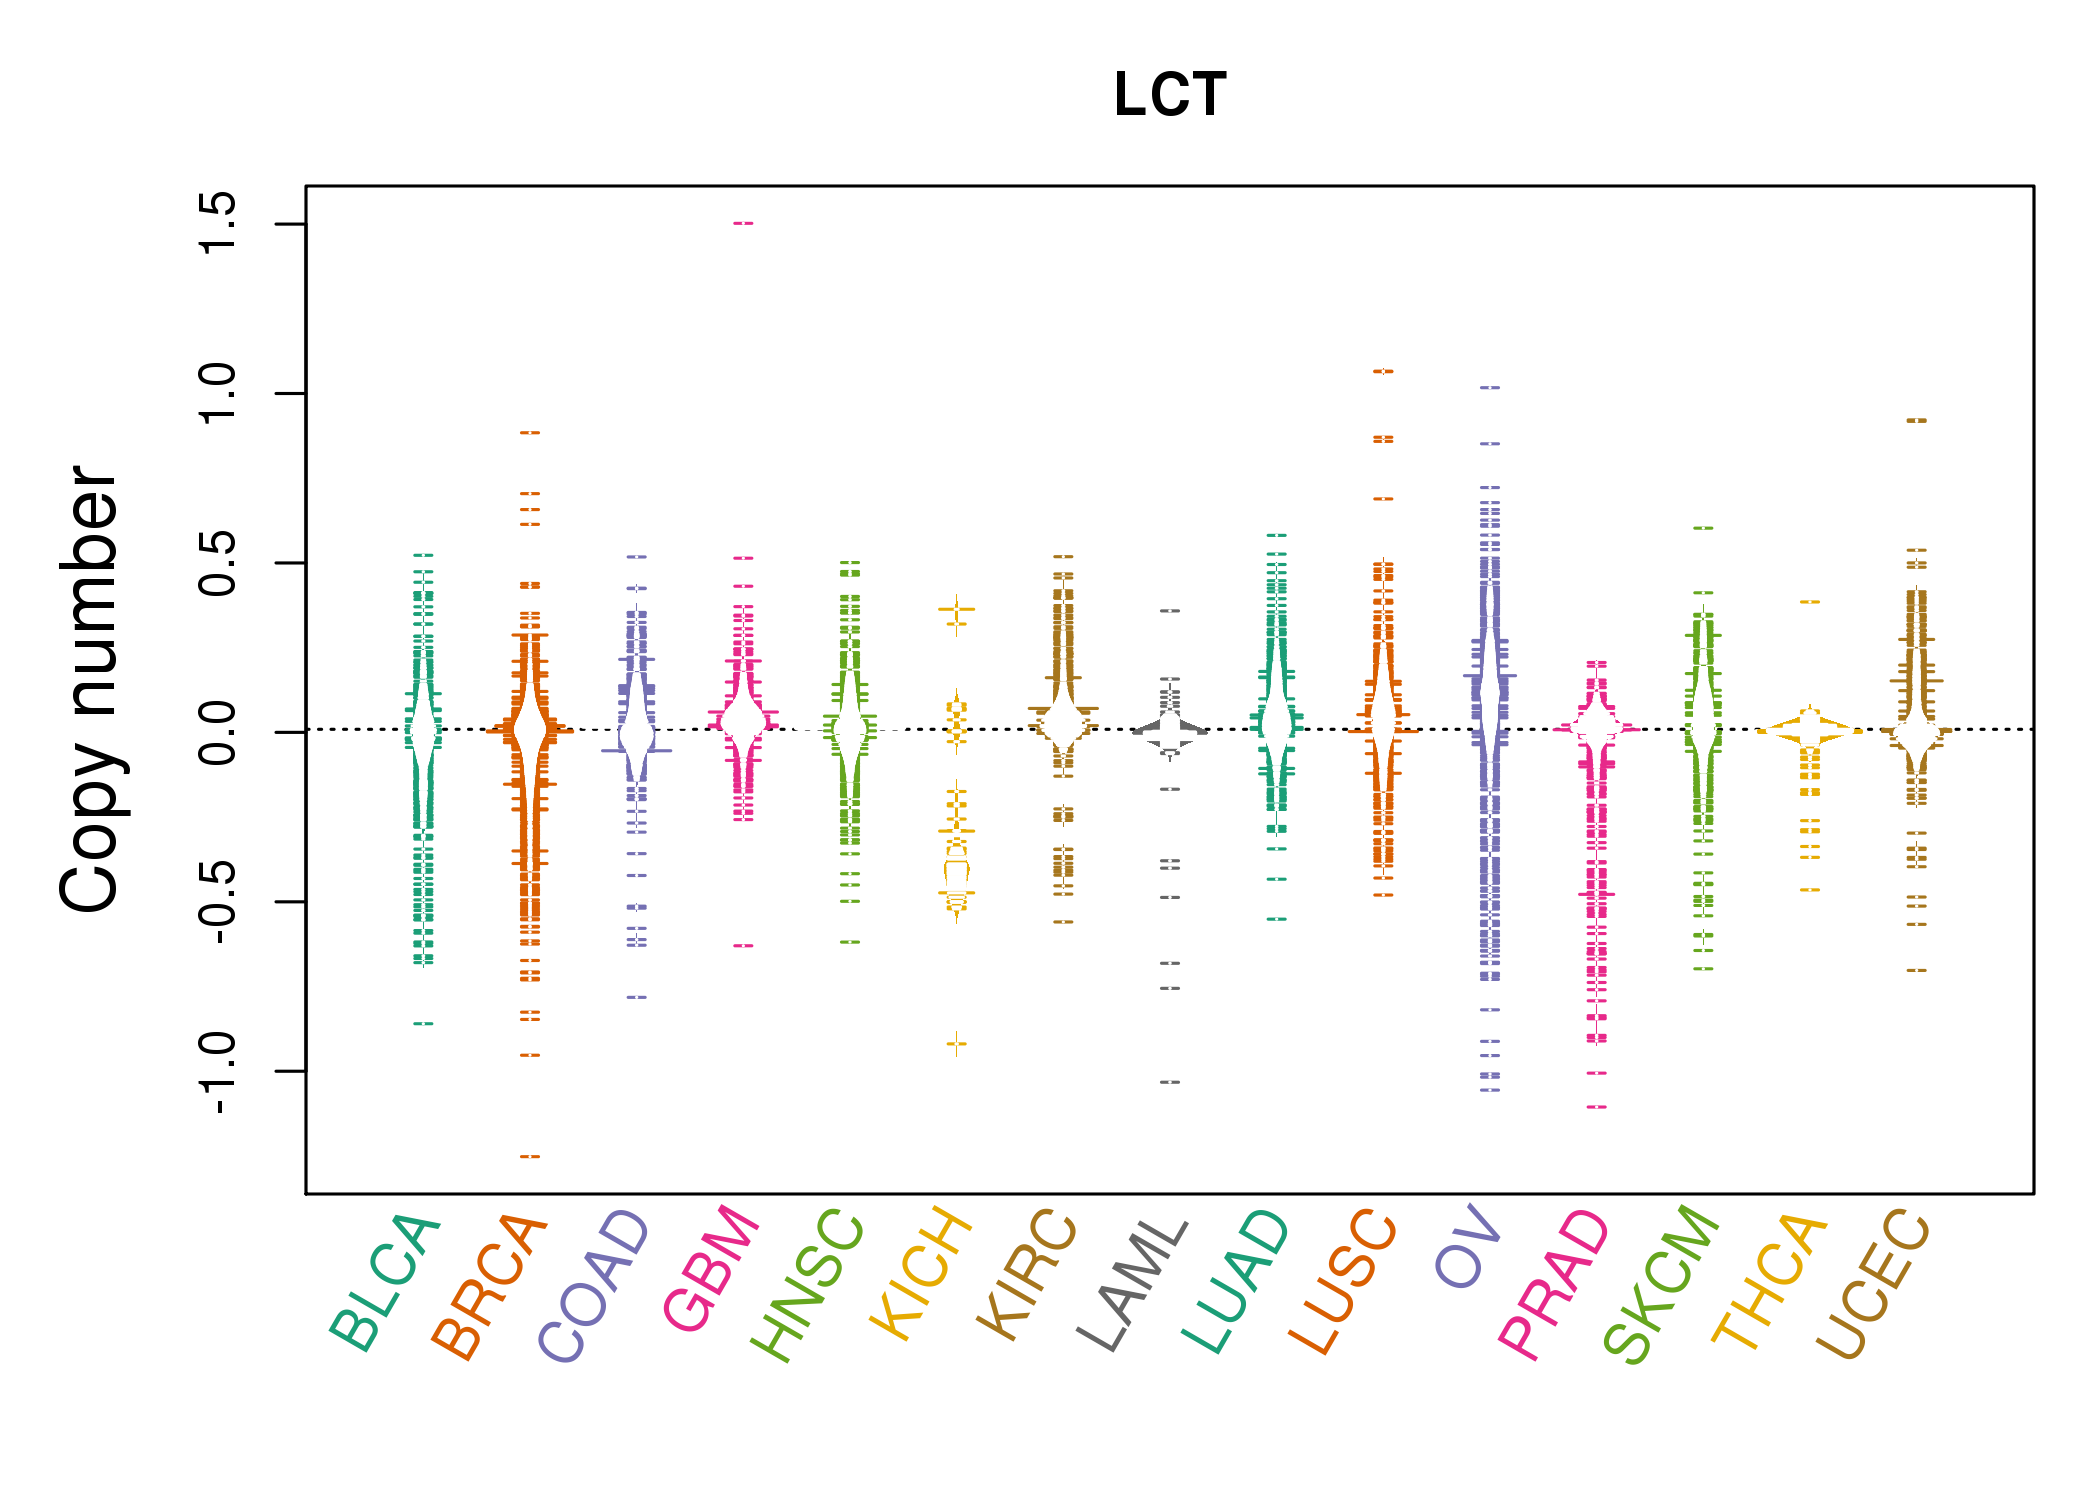 |
| cf) Tissue ID[Tissue type]: BLCA[Bladder Urothelial Carcinoma], BRCA[Breast invasive carcinoma], CESC[Cervical squamous cell carcinoma and endocervical adenocarcinoma], COAD[Colon adenocarcinoma], GBM[Glioblastoma multiforme], Glioma Low Grade, HNSC[Head and Neck squamous cell carcinoma], KICH[Kidney Chromophobe], KIRC[Kidney renal clear cell carcinoma], KIRP[Kidney renal papillary cell carcinoma], LAML[Acute Myeloid Leukemia], LUAD[Lung adenocarcinoma], LUSC[Lung squamous cell carcinoma], OV[Ovarian serous cystadenocarcinoma ], PAAD[Pancreatic adenocarcinoma], PRAD[Prostate adenocarcinoma], SKCM[Skin Cutaneous Melanoma], STAD[Stomach adenocarcinoma], THCA[Thyroid carcinoma], UCEC[Uterine Corpus Endometrial Carcinoma] |
| Top |
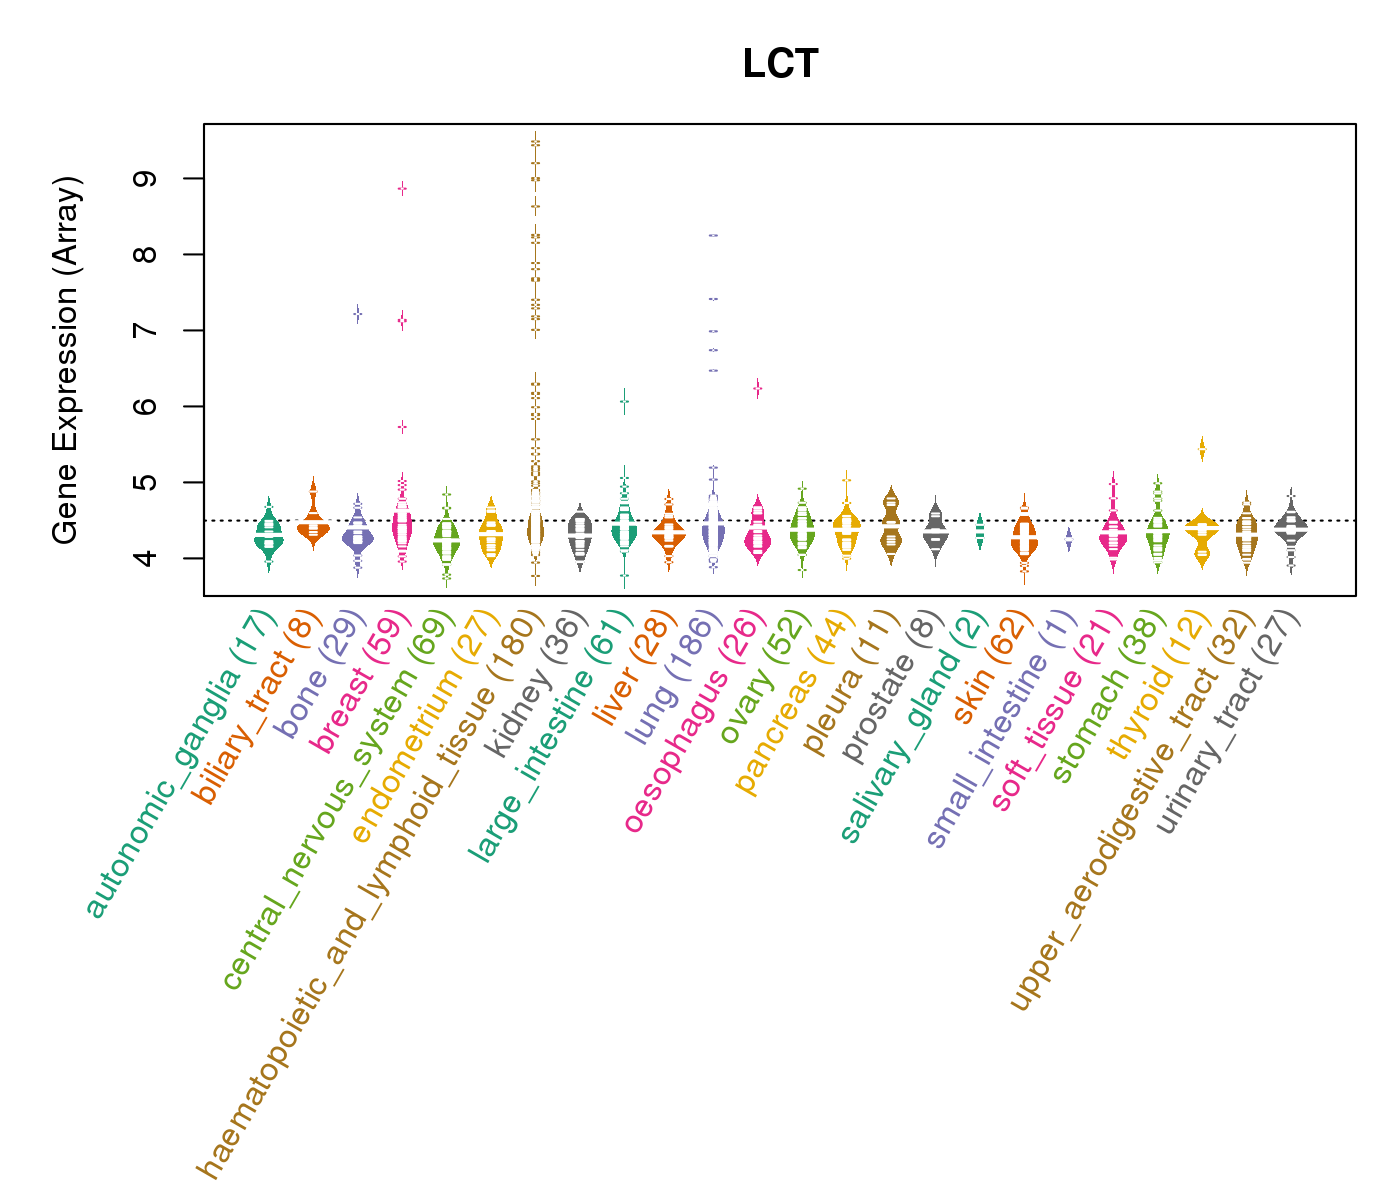
| Gene Expression for LCT |
| * CCLE gene expression data were extracted from CCLE_Expression_Entrez_2012-10-18.res: Gene-centric RMA-normalized mRNA expression data. |
 |
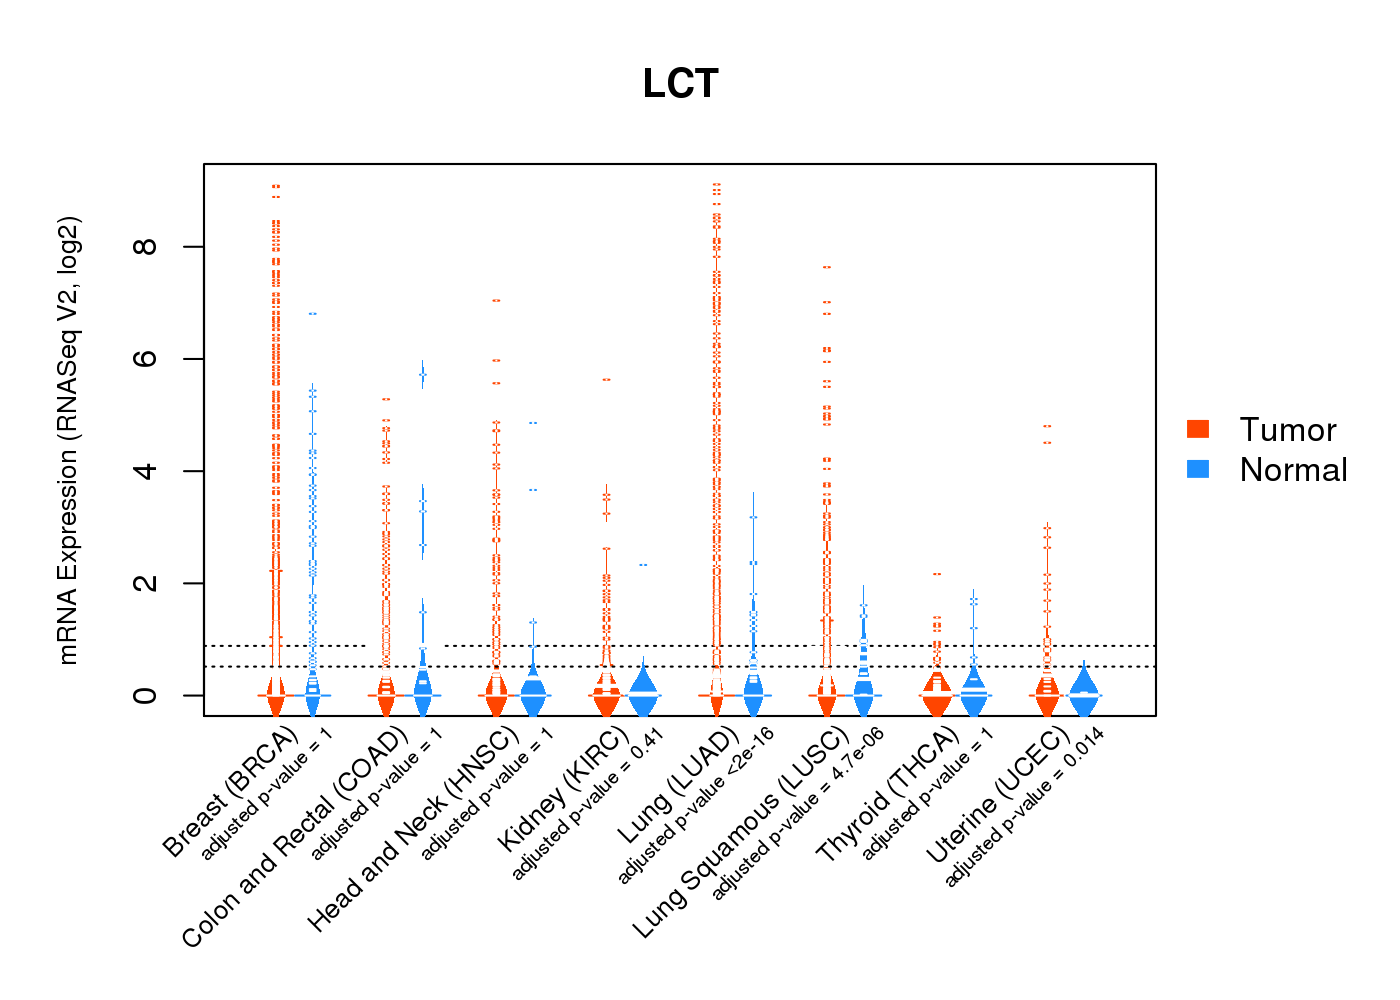
| * Normalized gene expression data of RNASeqV2 was extracted from TCGA using R package TCGA-Assembler. The URLs of all public data files on TCGA DCC data server were gathered at Jan-05-2015. Only eight cancer types have enough normal control samples for differential expression analysis. (t test, adjusted p<0.05 (using Benjamini-Hochberg FDR)) |
 |
| Top |
| * This plots show the correlation between CNV and gene expression. |
: Open all plots for all cancer types
 |
|
 |
|


| Top |
| Gene-Gene Network Information |
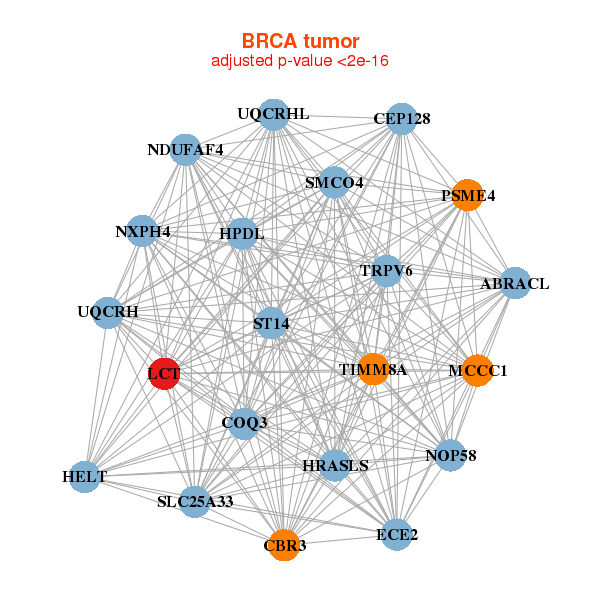
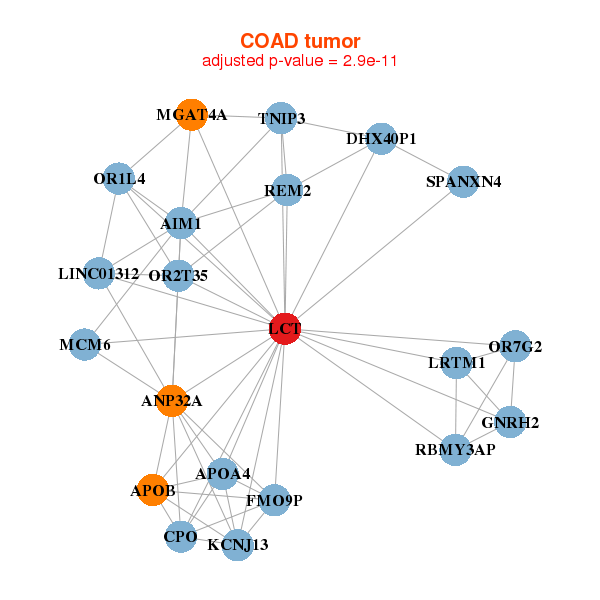
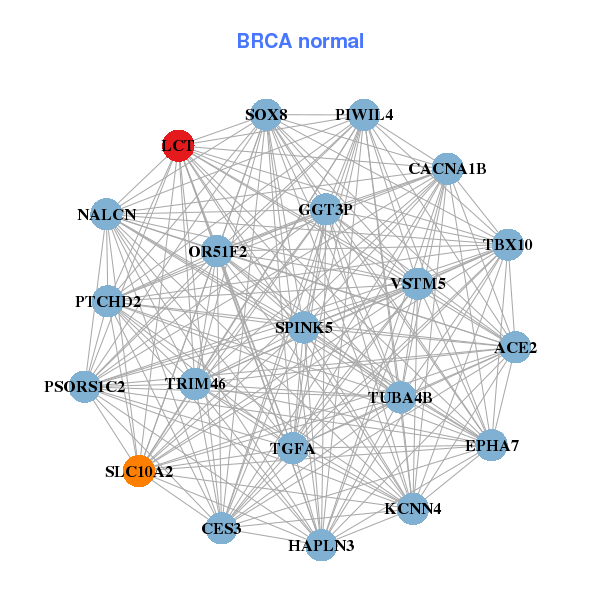
| * Co-Expression network figures were drawn using R package igraph. Only the top 20 genes with the highest correlations were shown. Red circle: input gene, orange circle: cell metabolism gene, sky circle: other gene |
: Open all plots for all cancer types
 |
| ||||
| SMCO4,CEP128,ABRACL,CBR3,COQ3,ECE2,HELT, HPDL,HRASLS,LCT,MCCC1,NDUFAF4,NOP58,NXPH4, PSME4,SLC25A33,ST14,TIMM8A,TRPV6,UQCRH,UQCRHL | ACE2,VSTM5,CACNA1B,CES3,EPHA7,GGT3P,HAPLN3, KCNN4,LCT,NALCN,OR51F2,PIWIL4,PSORS1C2,PTCHD2, SLC10A2,SOX8,SPINK5,TBX10,TGFA,TRIM46,TUBA4B | ||||
 |
| ||||
| AIM1,ANP32A,APOA4,APOB,CPO,DHX40P1,FMO9P, GNRH2,KCNJ13,LCT,LRTM1,MCM6,MGAT4A,LINC01312, OR1L4,OR2T35,OR7G2,RBMY3AP,REM2,SPANXN4,TNIP3 | AGT,GGT1,GGT3P,GGTLC1,HEATR4,HTR4,KCP, LAMB4,LCT,LEMD1,LPGAT1,OSBPL6,OSR2,PAEP, RGS7BP,SEC16B,SERPINF2,SLC34A2,SSPO,UNC5CL,ZP2 |
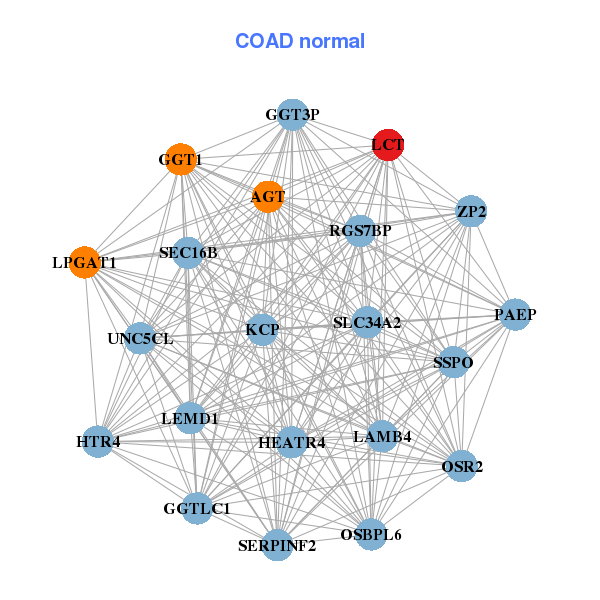
| * Co-Expression network figures were drawn using R package igraph. Only the top 20 genes with the highest correlations were shown. Red circle: input gene, orange circle: cell metabolism gene, sky circle: other gene |
: Open all plots for all cancer types
| Top |
: Open all interacting genes' information including KEGG pathway for all interacting genes from DAVID
| Top |
| Pharmacological Information for LCT |
| DB Category | DB Name | DB's ID and Url link |
| * Gene Centered Interaction Network. |
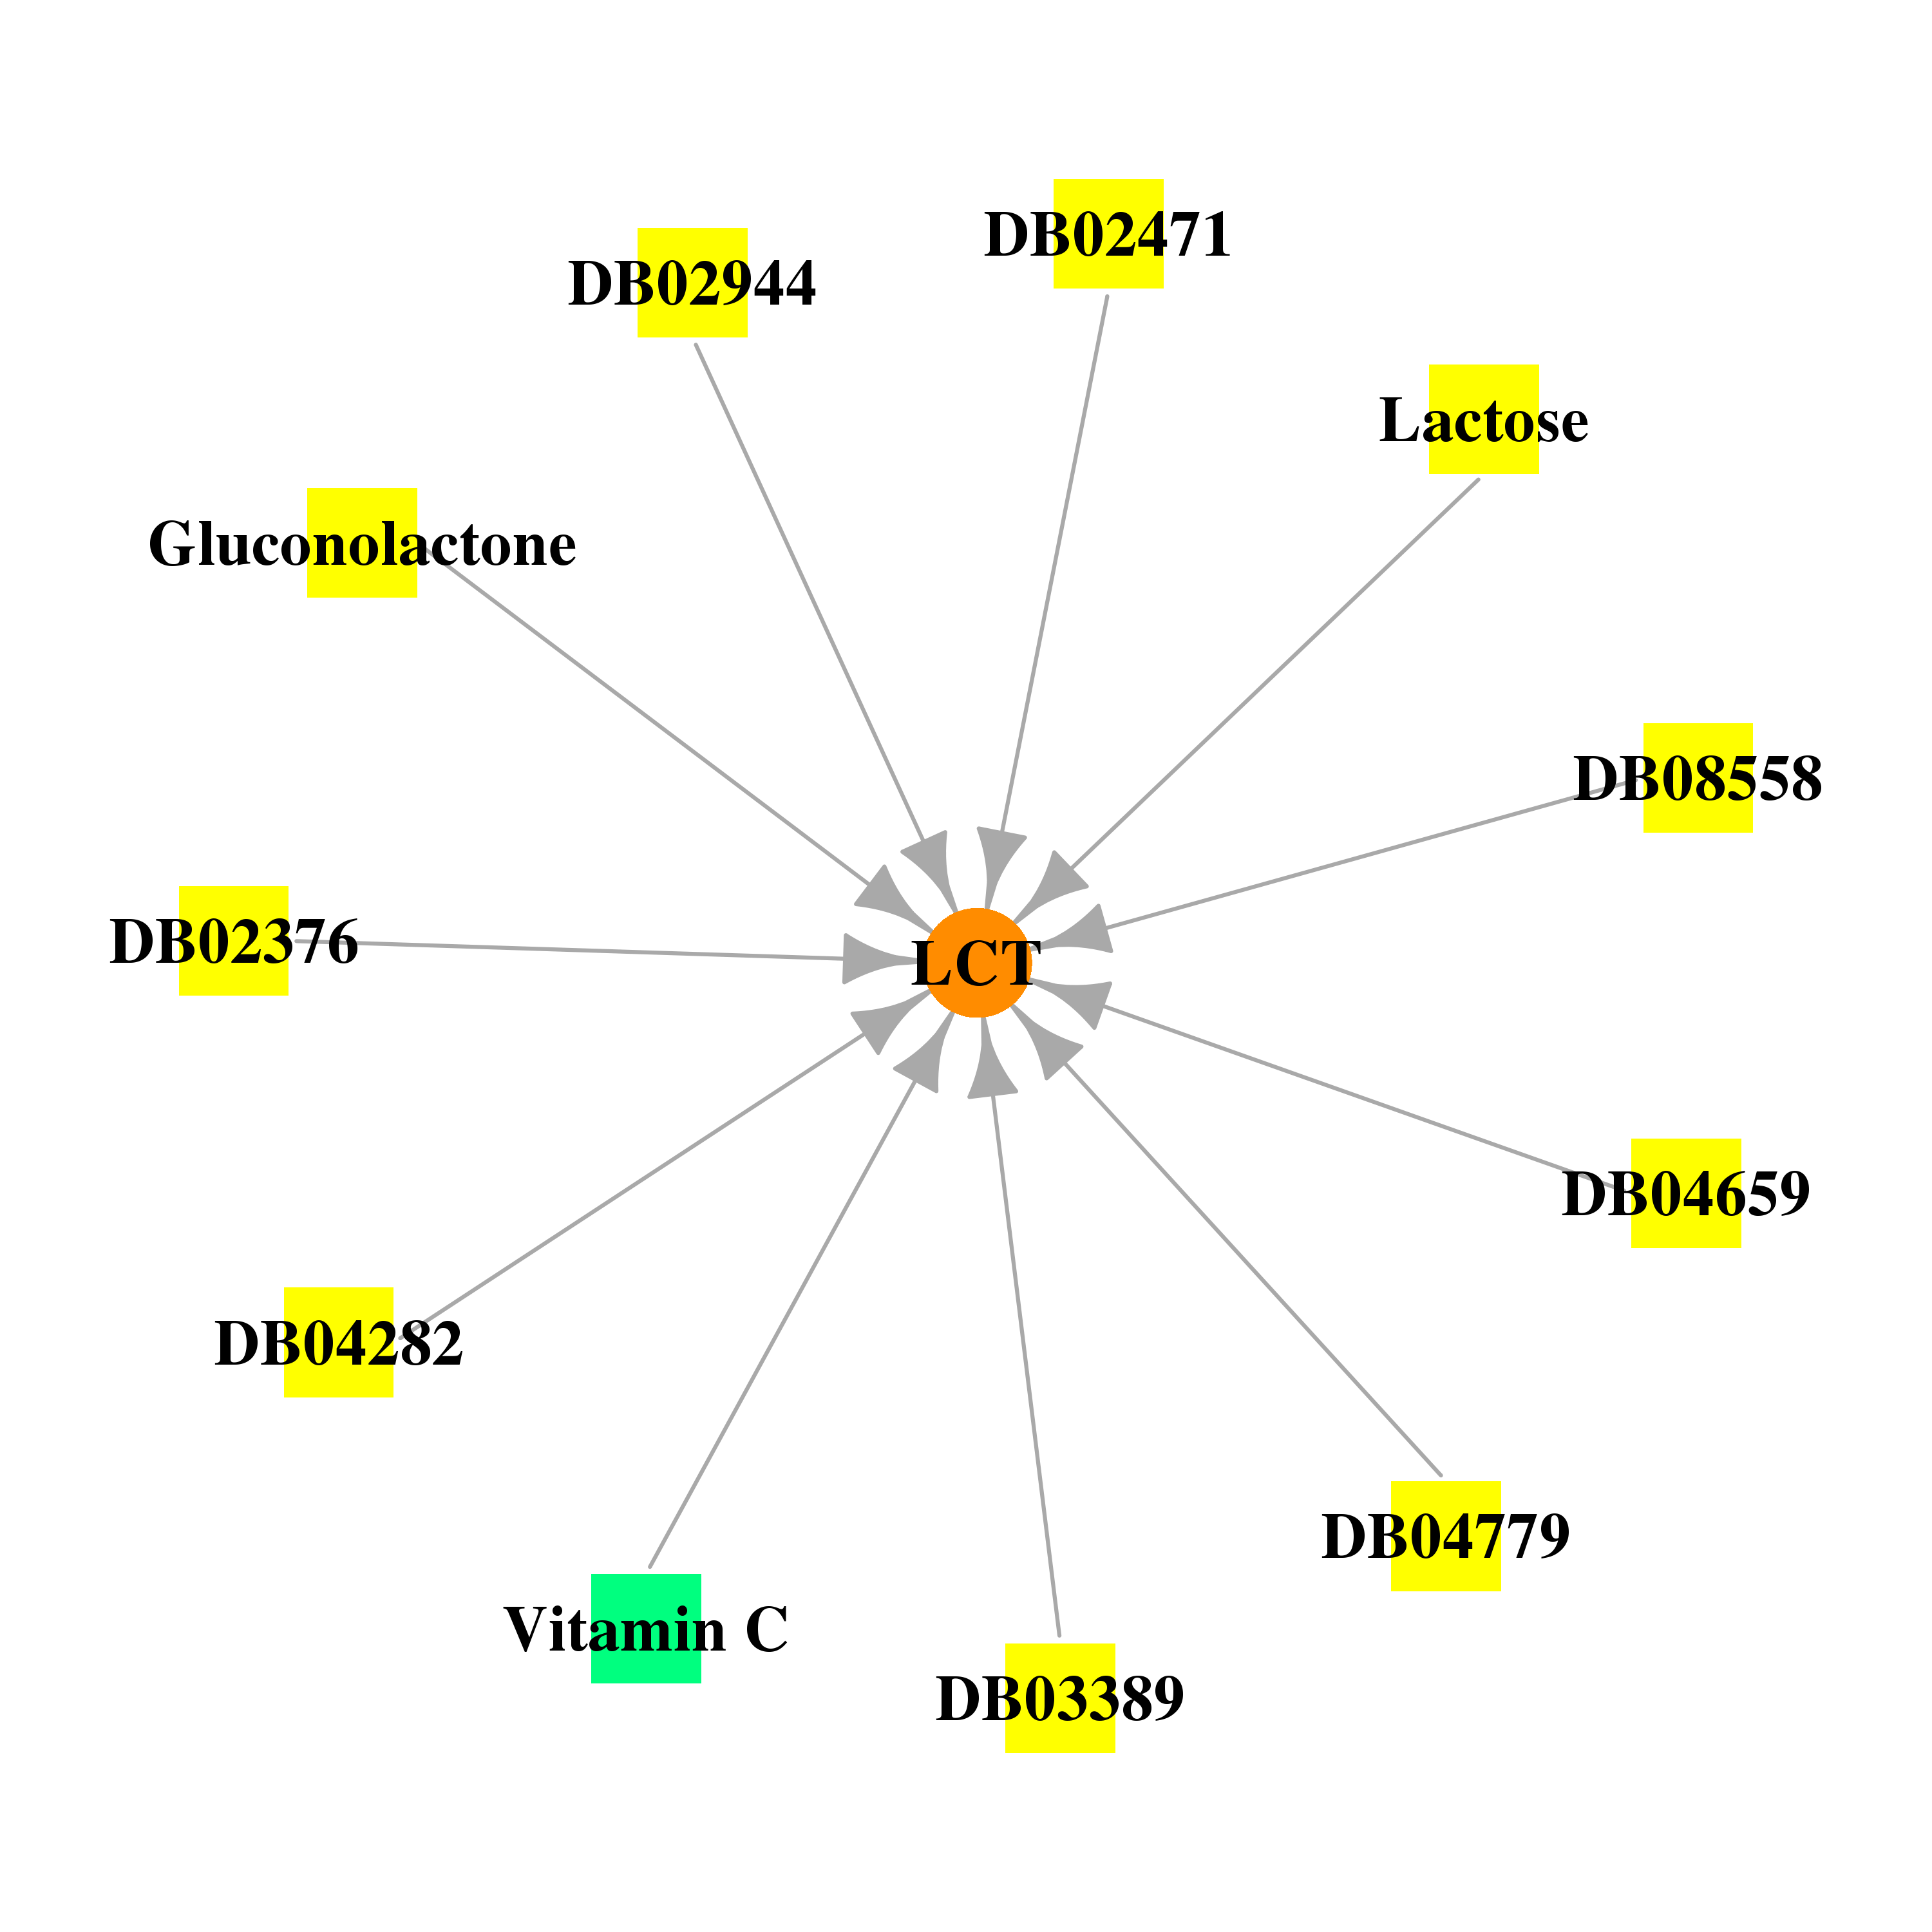 |
| * Drug Centered Interaction Network. |
| DrugBank ID | Target Name | Drug Groups | Generic Name | Drug Centered Network | Drug Structure |
| DB00126 | lactase | approved; nutraceutical | Vitamin C | 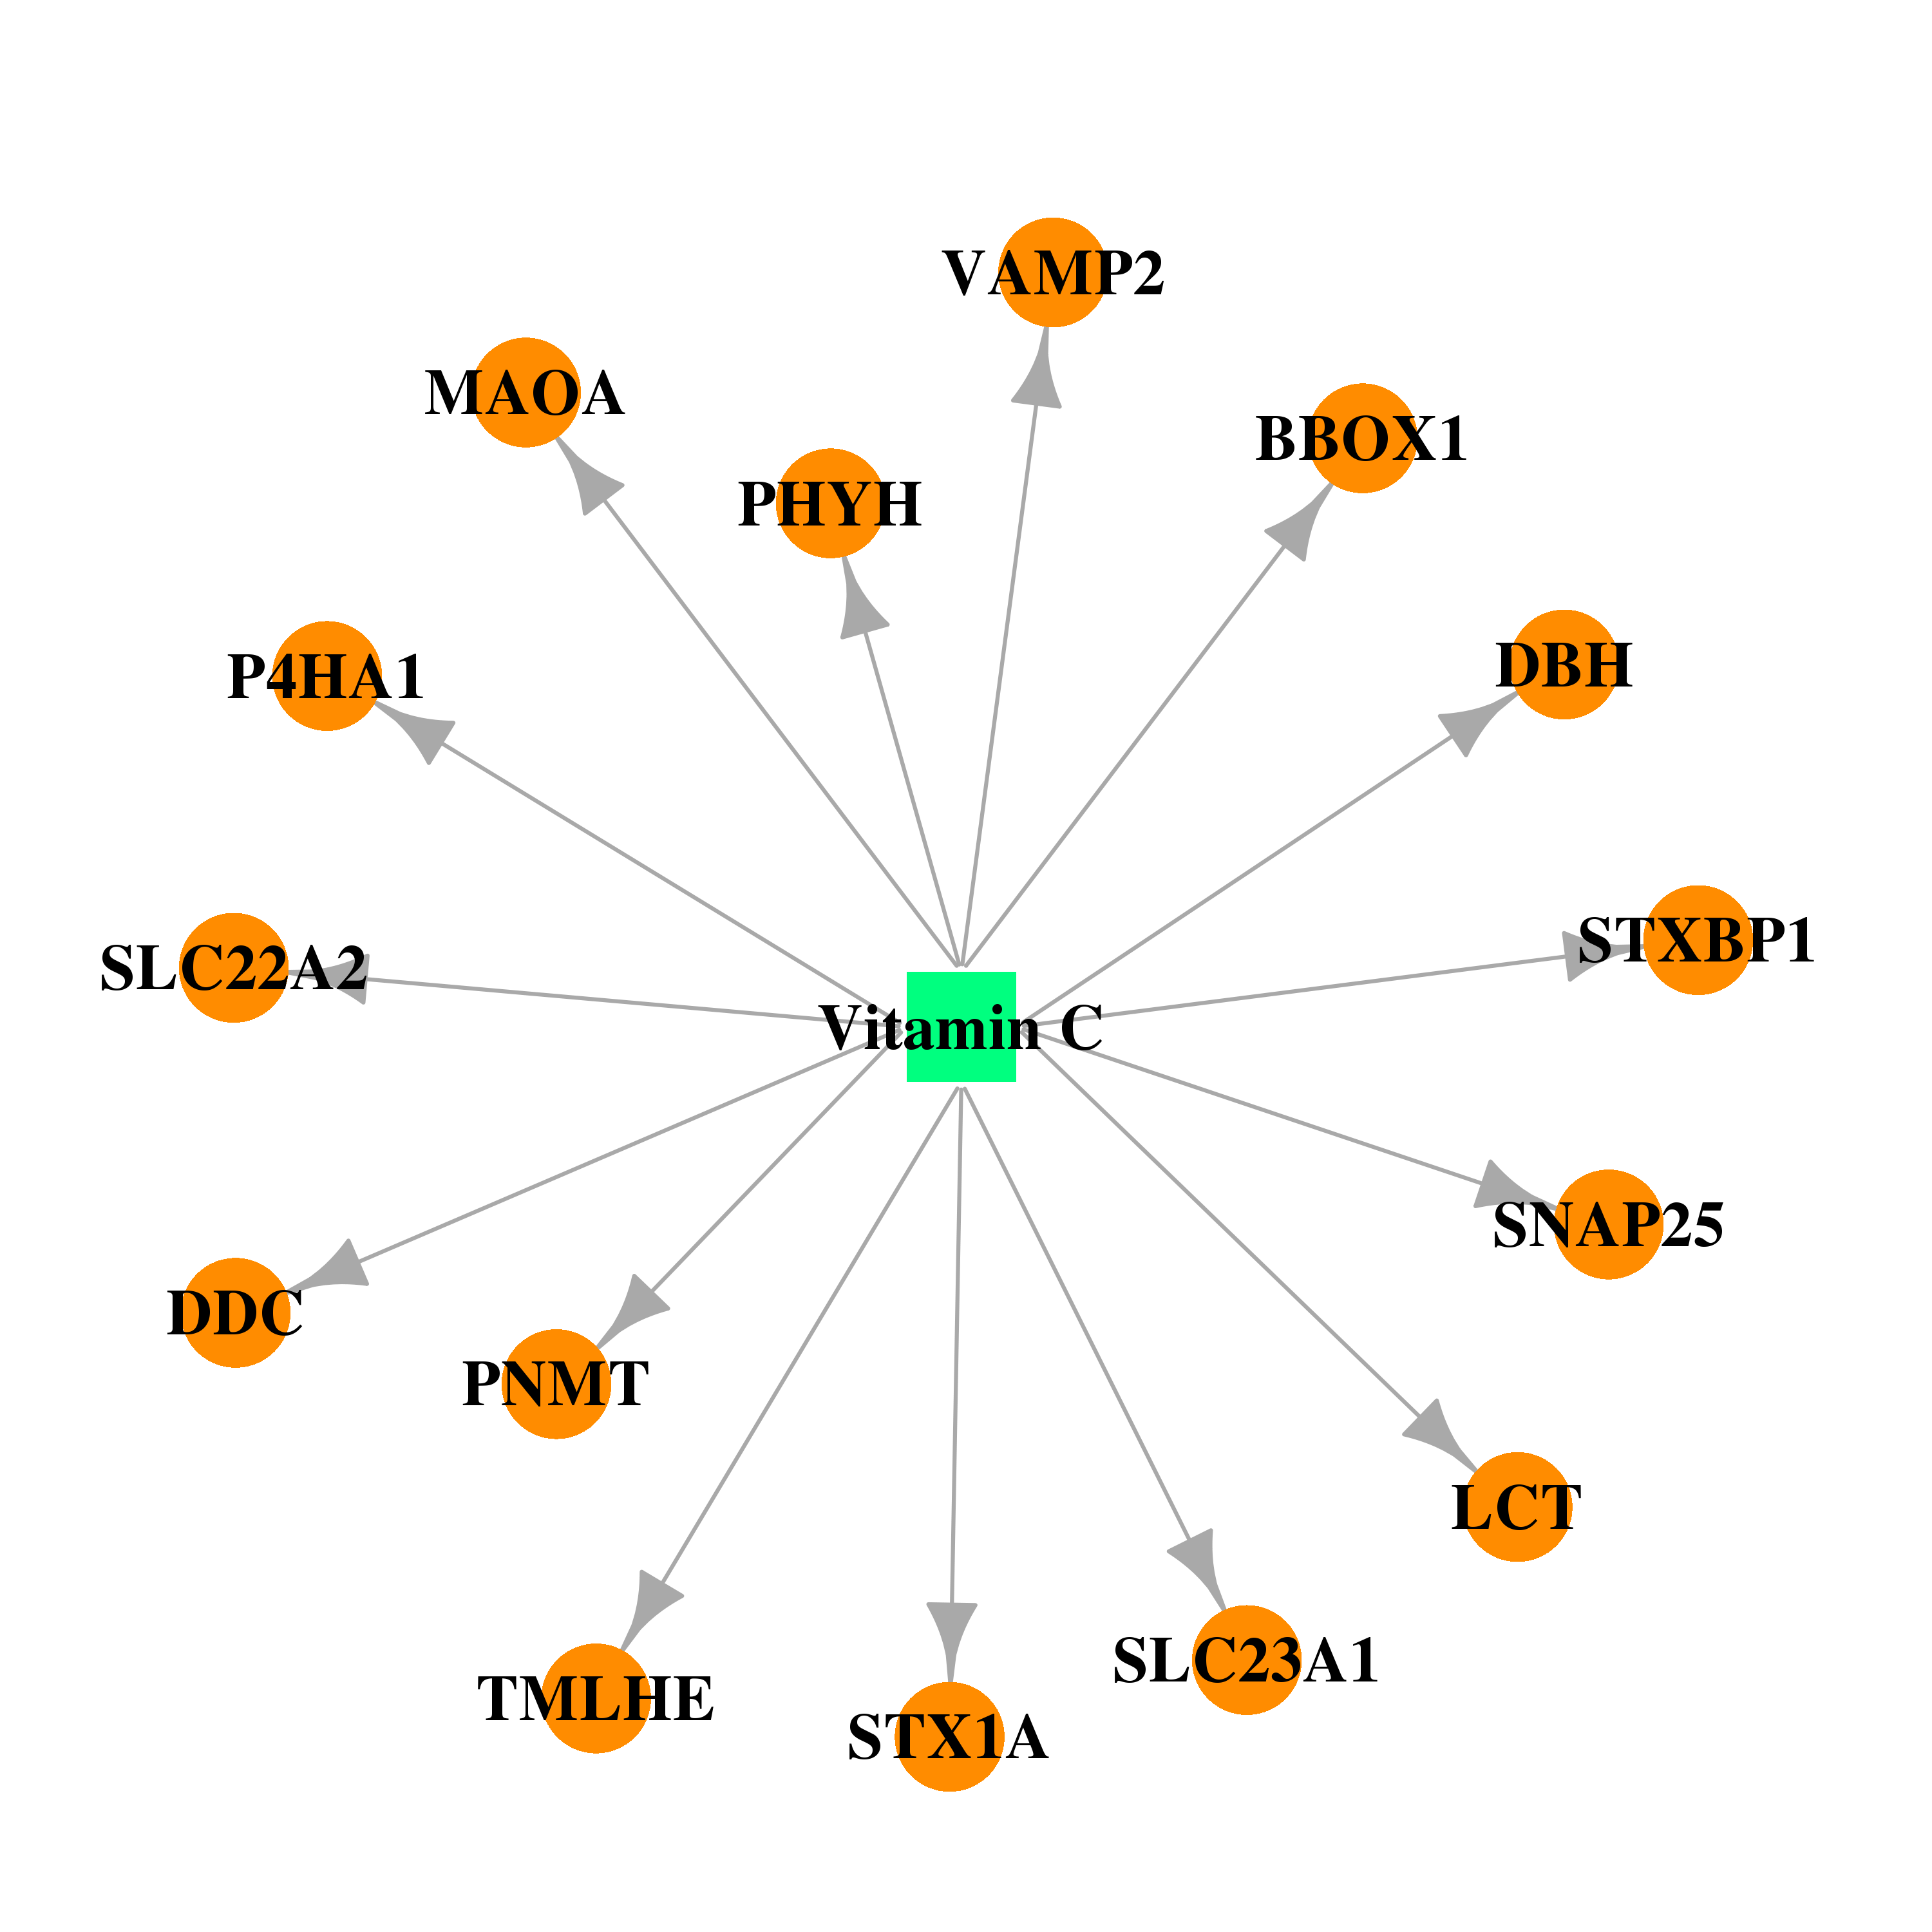 | 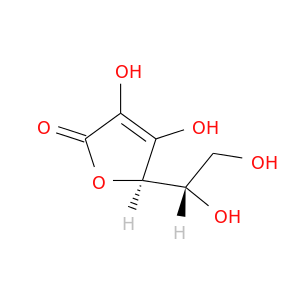 |
| DB02376 | lactase | experimental | D-Gluconhydroximo-1,5-Lactam | 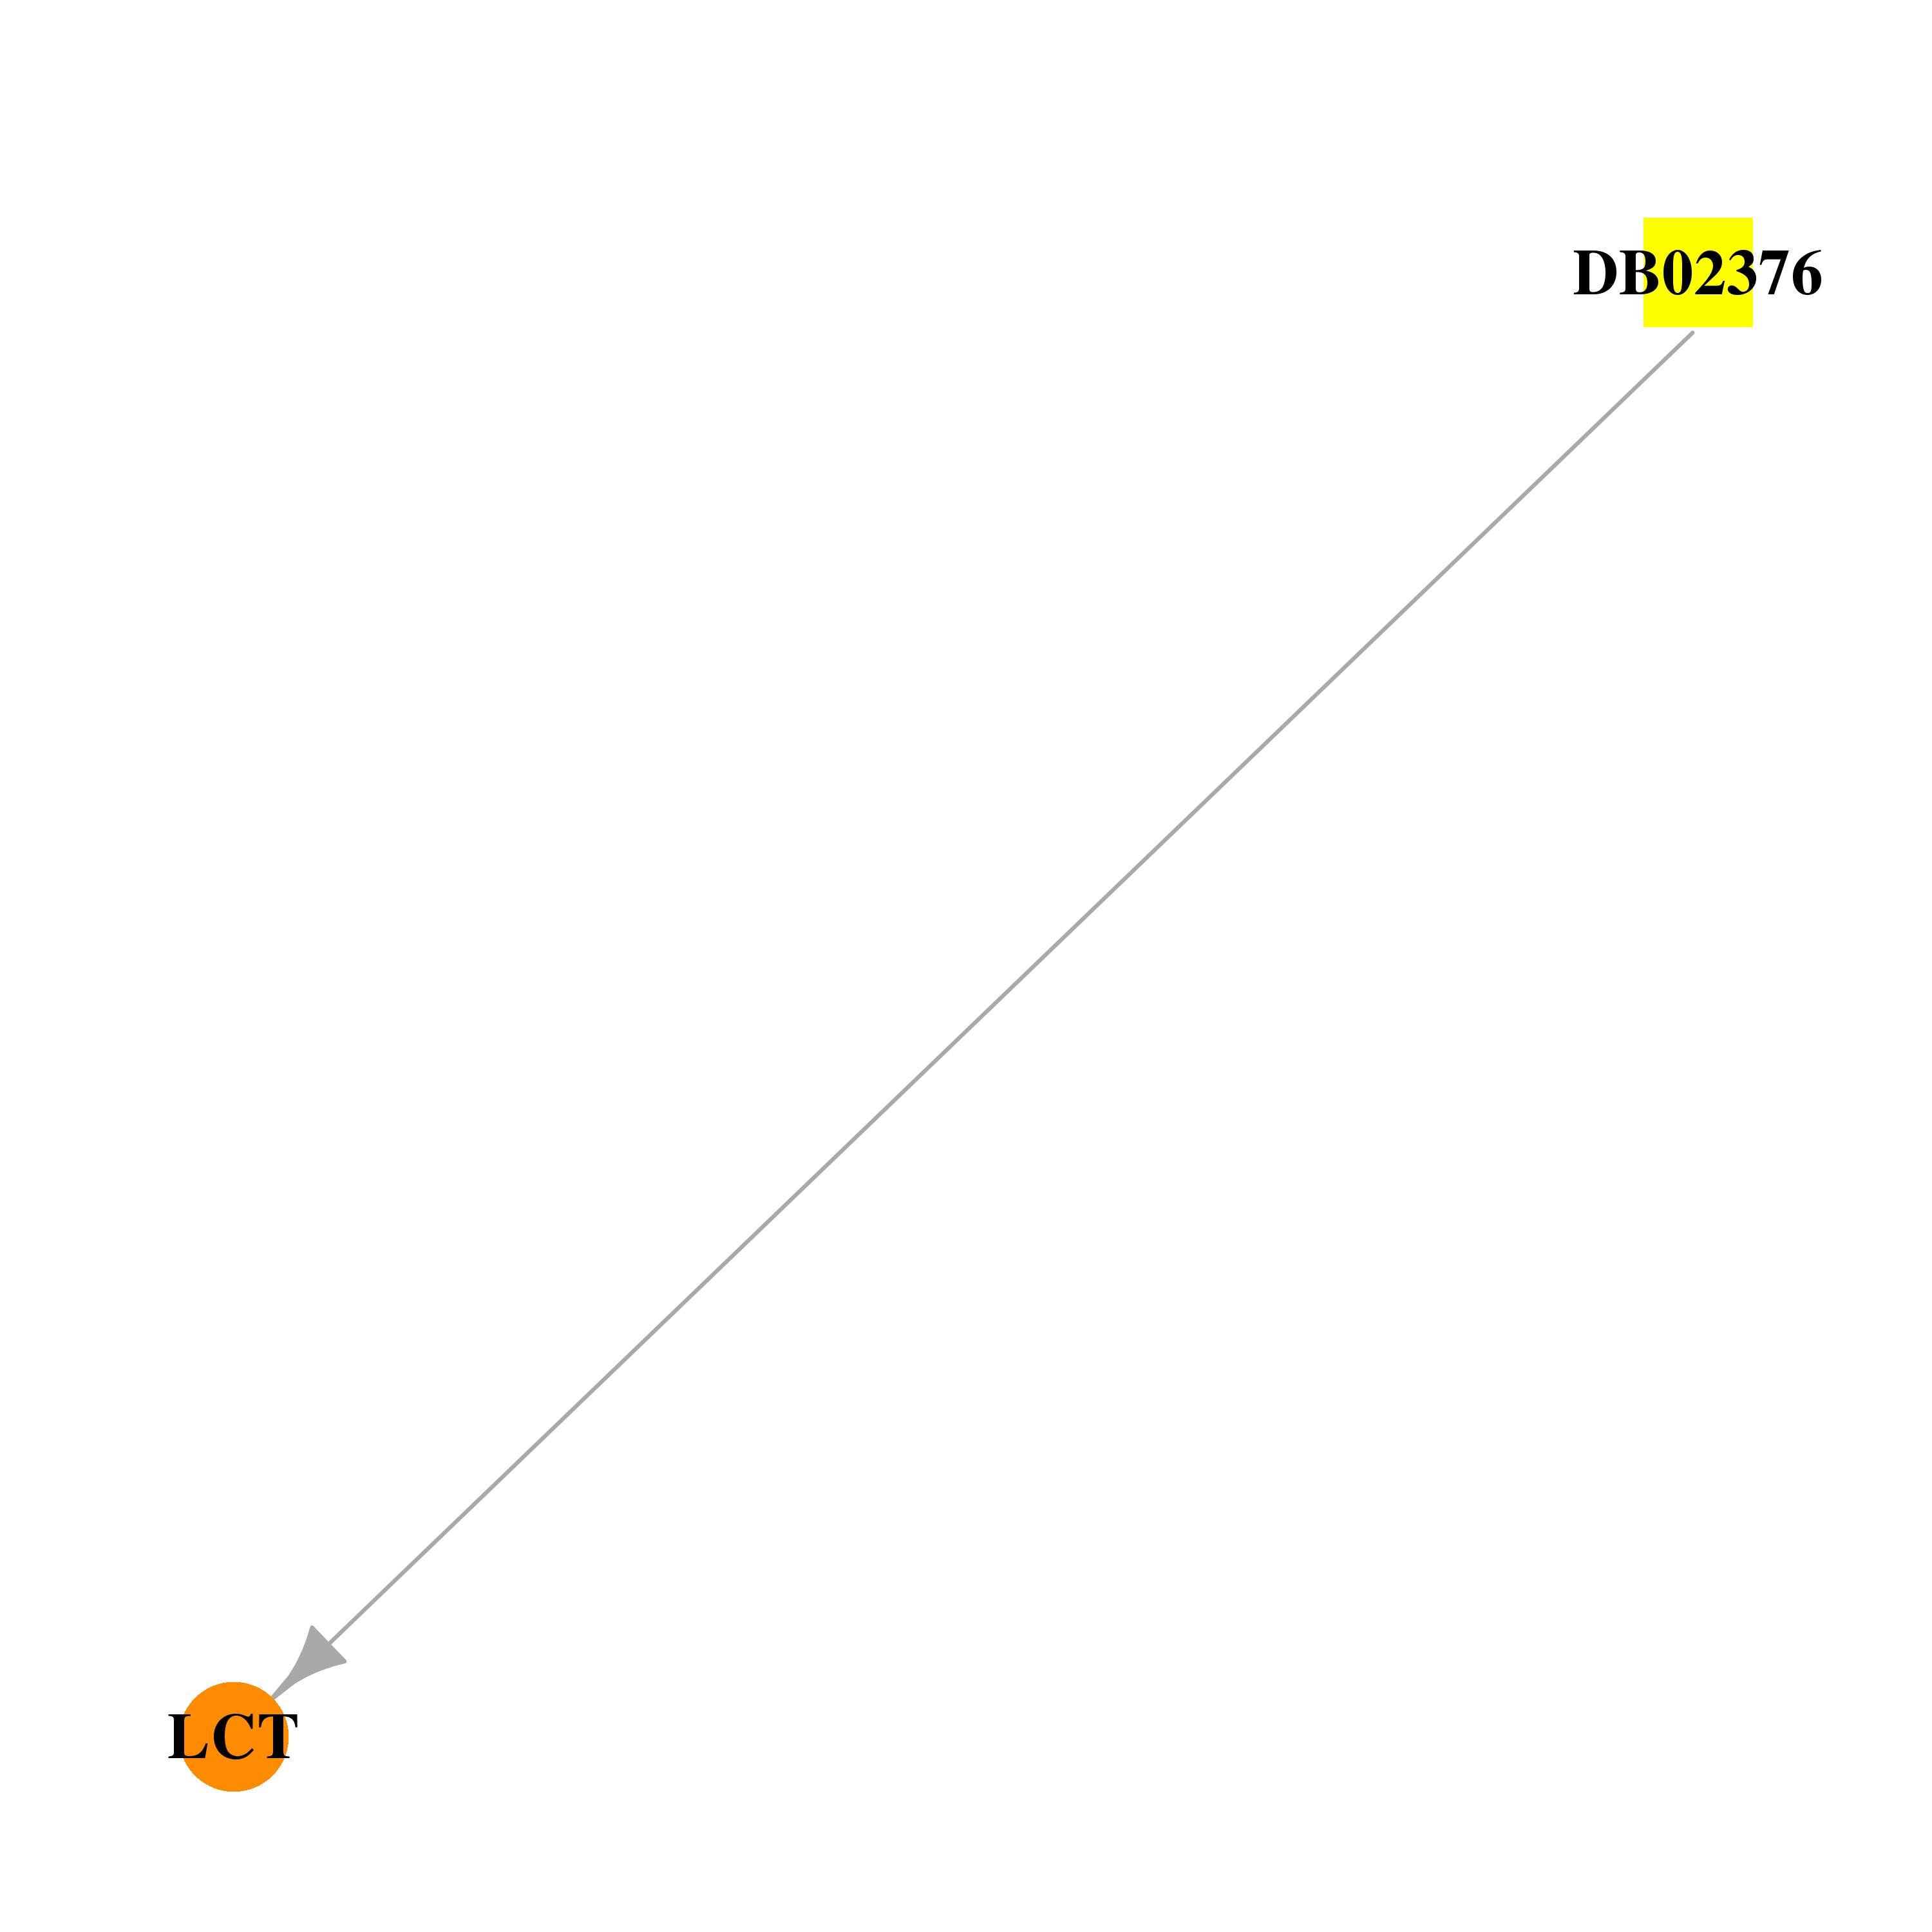 | 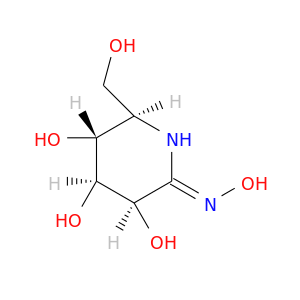 |
| DB02471 | lactase | experimental | Nojirimycine Tetrazole | 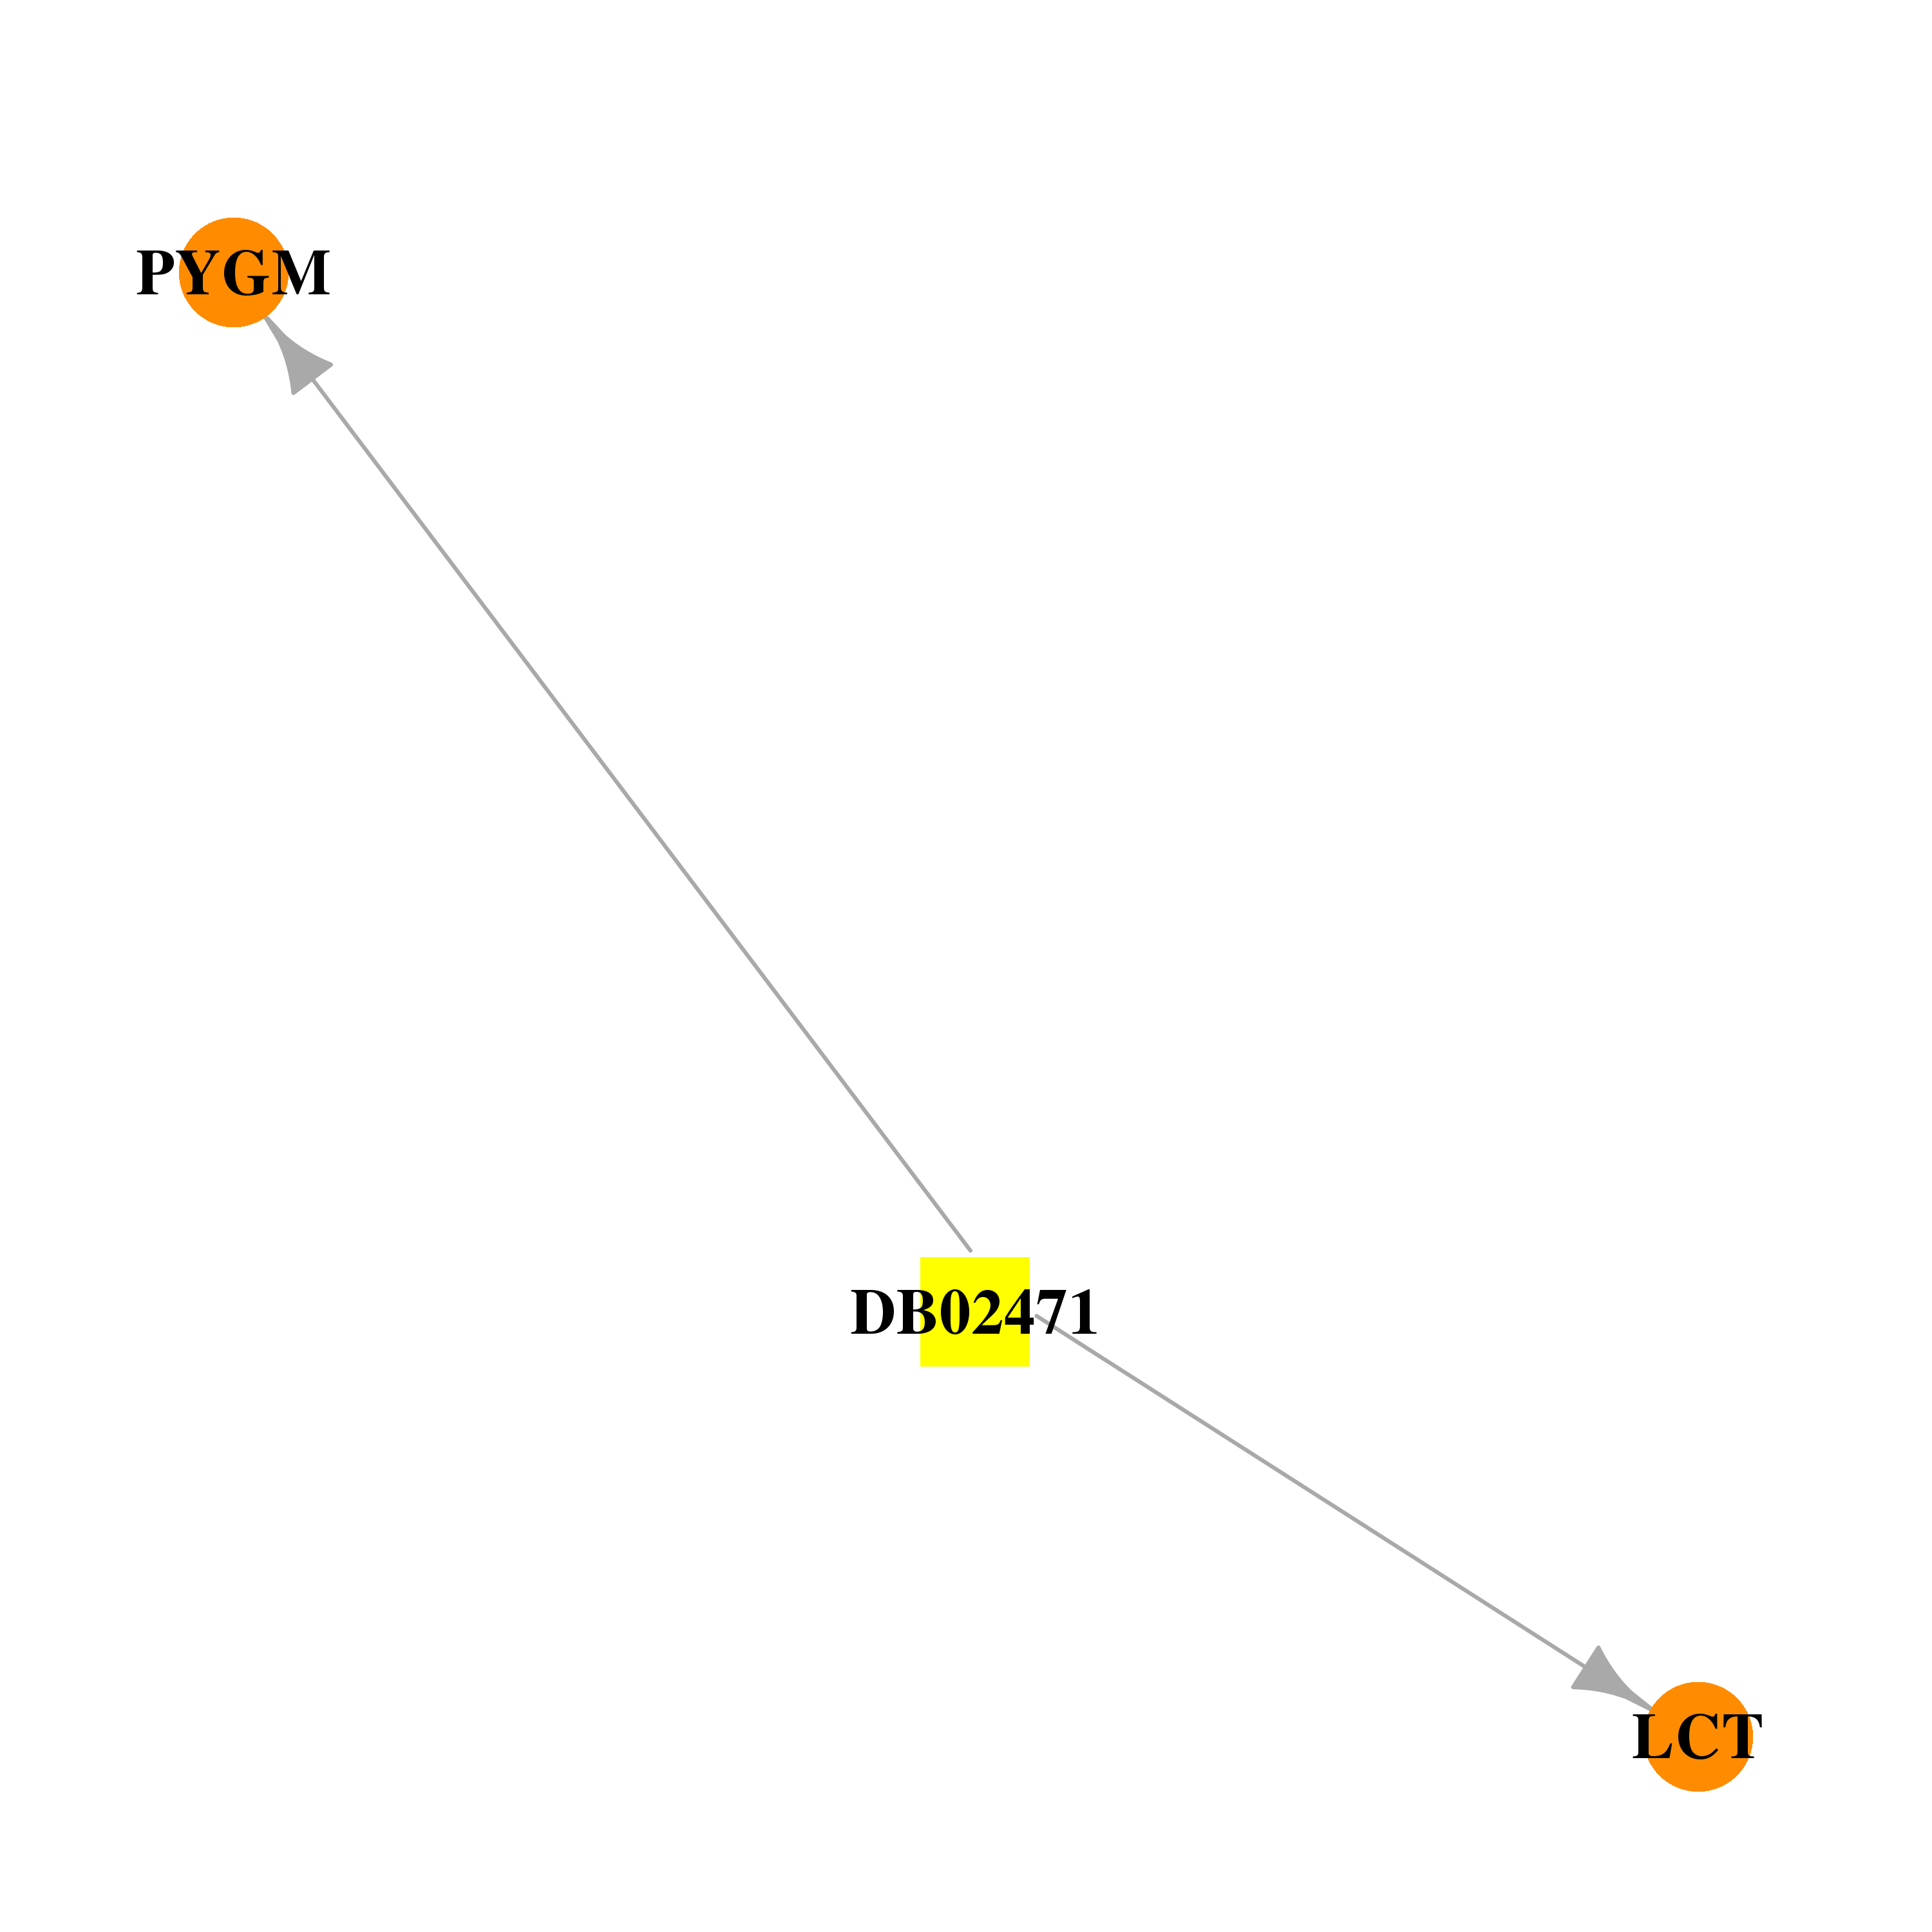 | 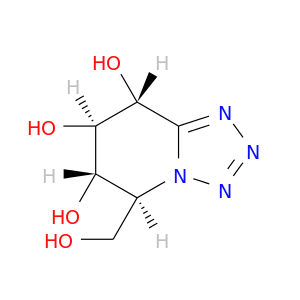 |
| DB02944 | lactase | experimental | Alpha-D-Mannose |  |  |
| DB03389 | lactase | experimental | alpha-D-Xylopyranose | 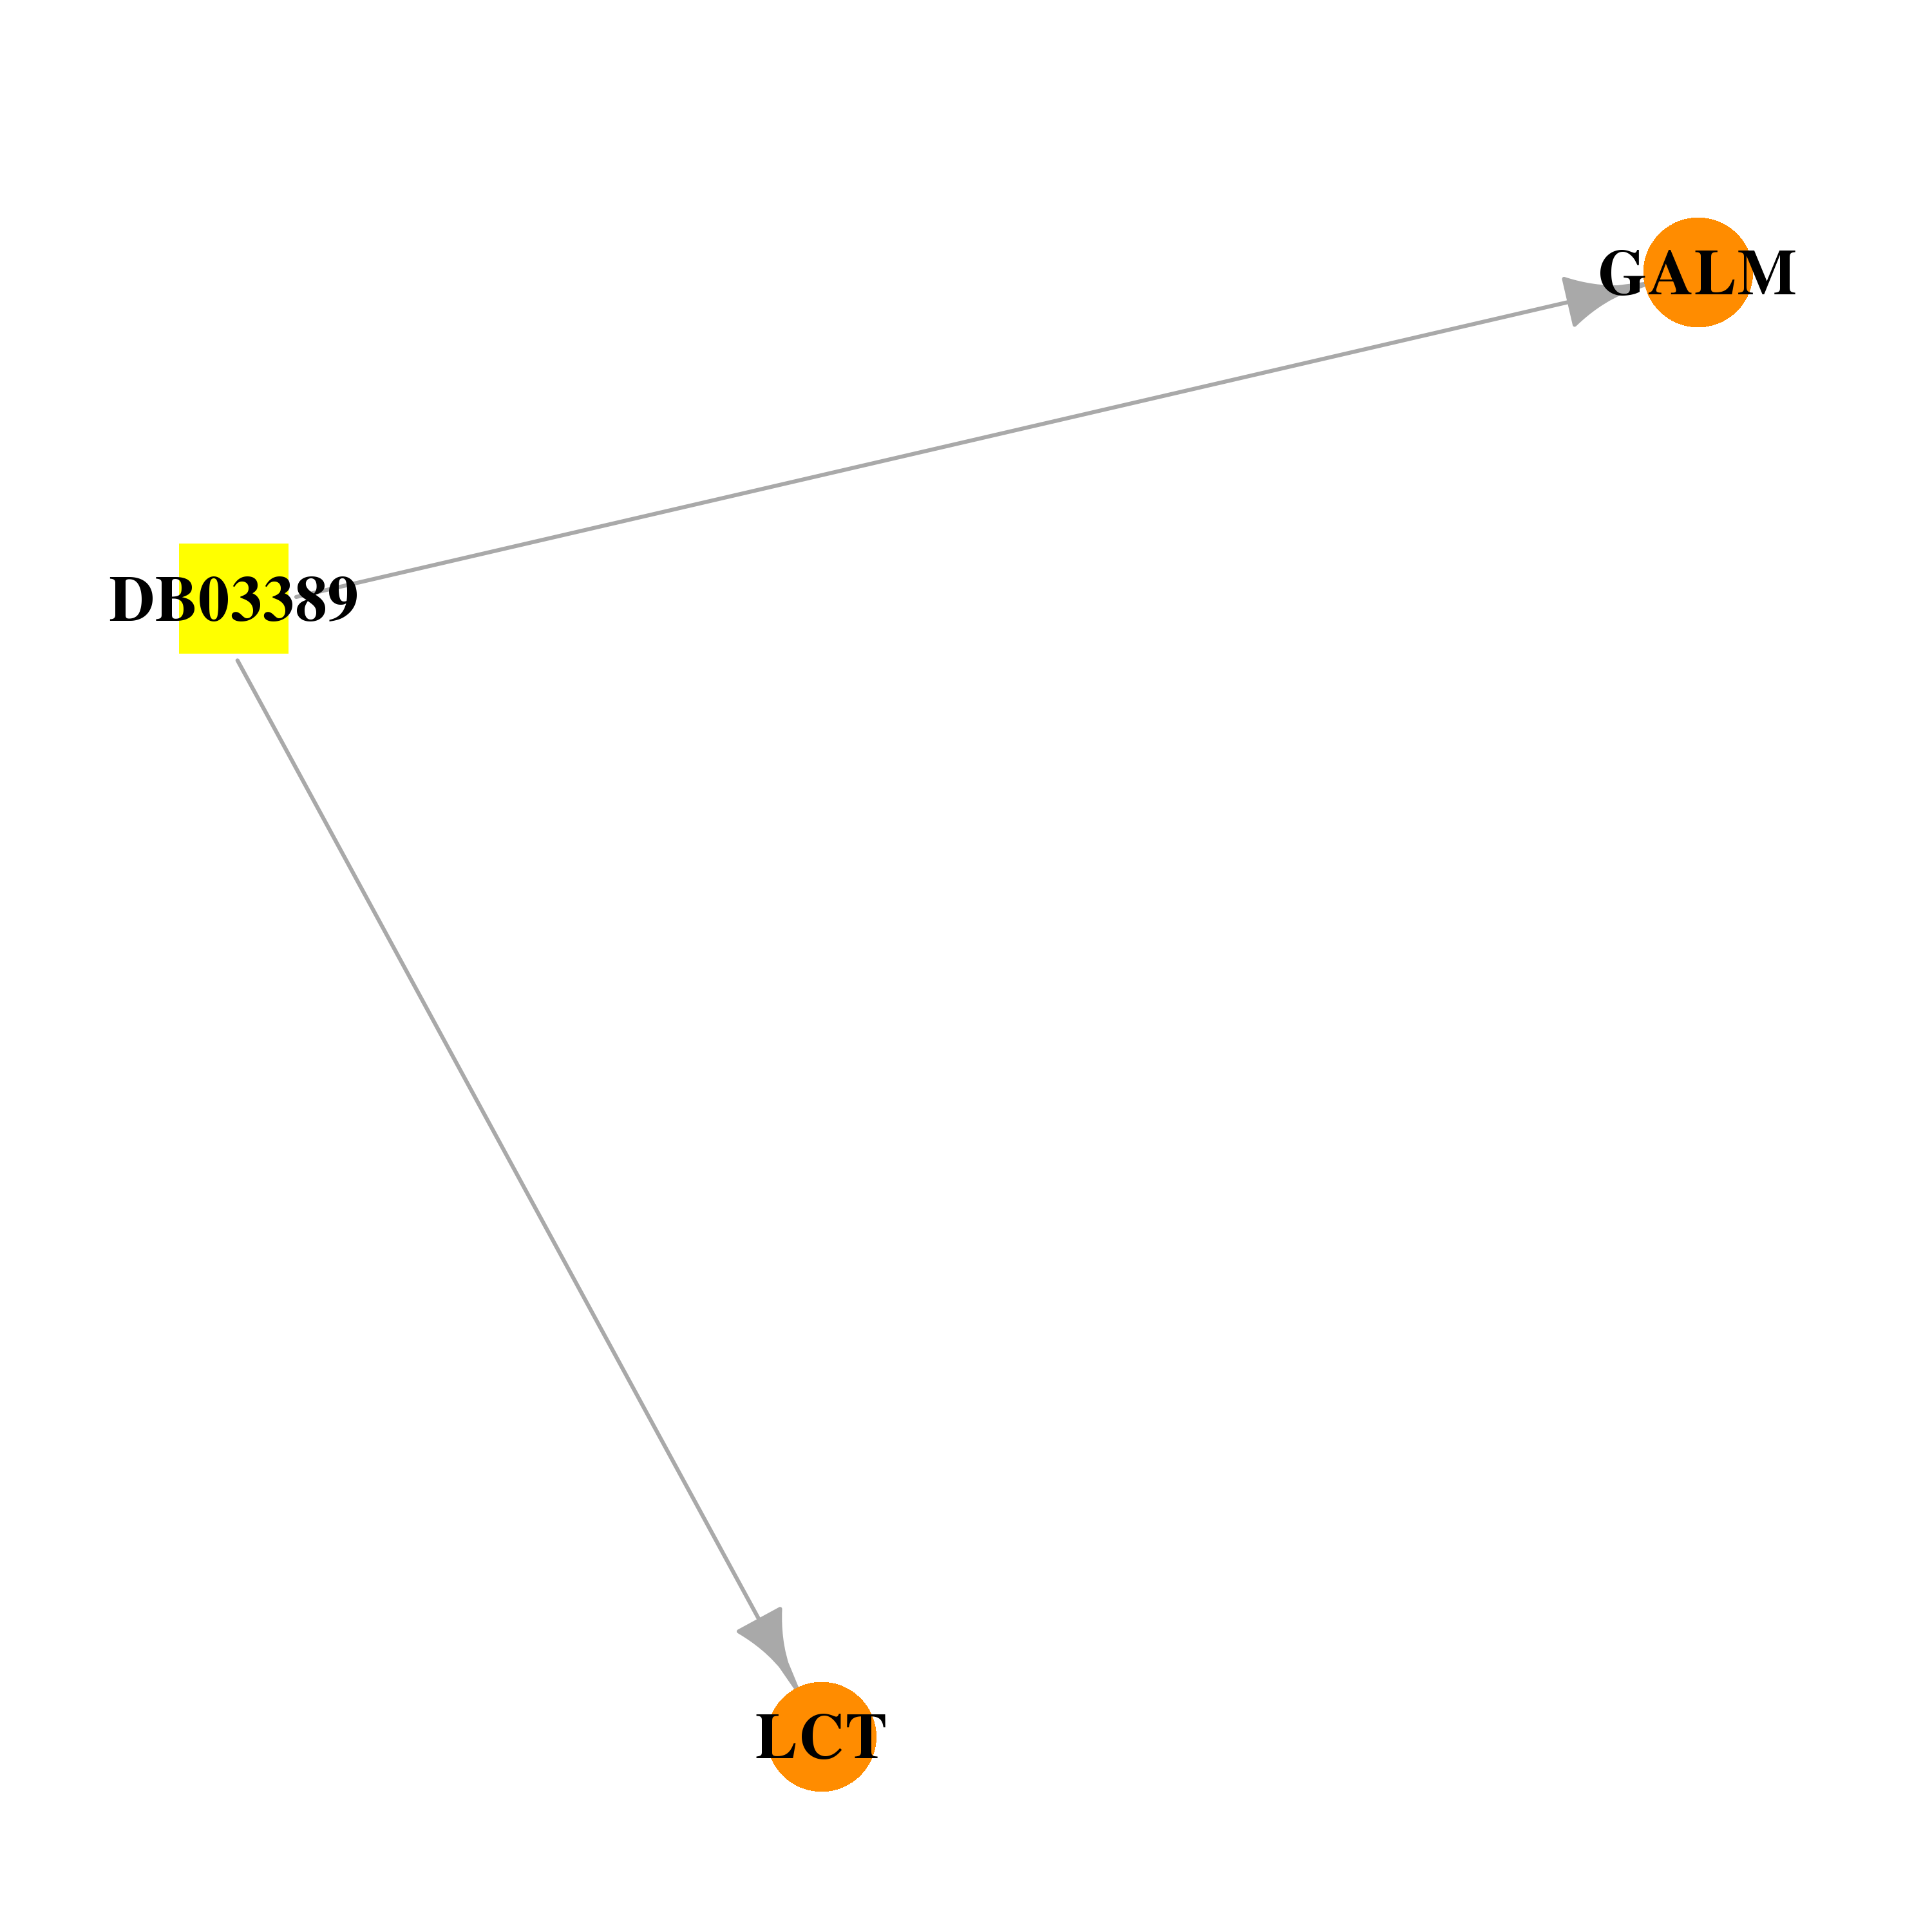 | 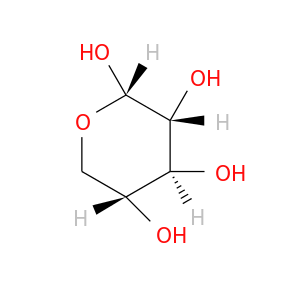 |
| DB04282 | lactase | experimental | 2-Deoxy-2fluoro-Glucose |  |  |
| DB04564 | lactase | experimental | Gluconolactone |  |  |
| DB04659 | lactase | experimental | (1S,2S,3R,4S,5S)-2,3,4-TRIHYDROXY-5-(HYDROXYMETHYL)CYCLOHEXYL (1E)-2-PHENYL-N-(SULFOOXY)ETHANIMIDOTHIOATE |  |  |
| DB04779 | lactase | experimental | ETHYL (1E)-2-PHENYL-N-(SULFOOXY)ETHANIMIDOTHIOATE |  |  |
| DB08558 | lactase | experimental | 2-HYDROXYMETHYL-6-OCTYLSULFANYL-TETRAHYDRO-PYRAN-3,4,5-TRIOL | 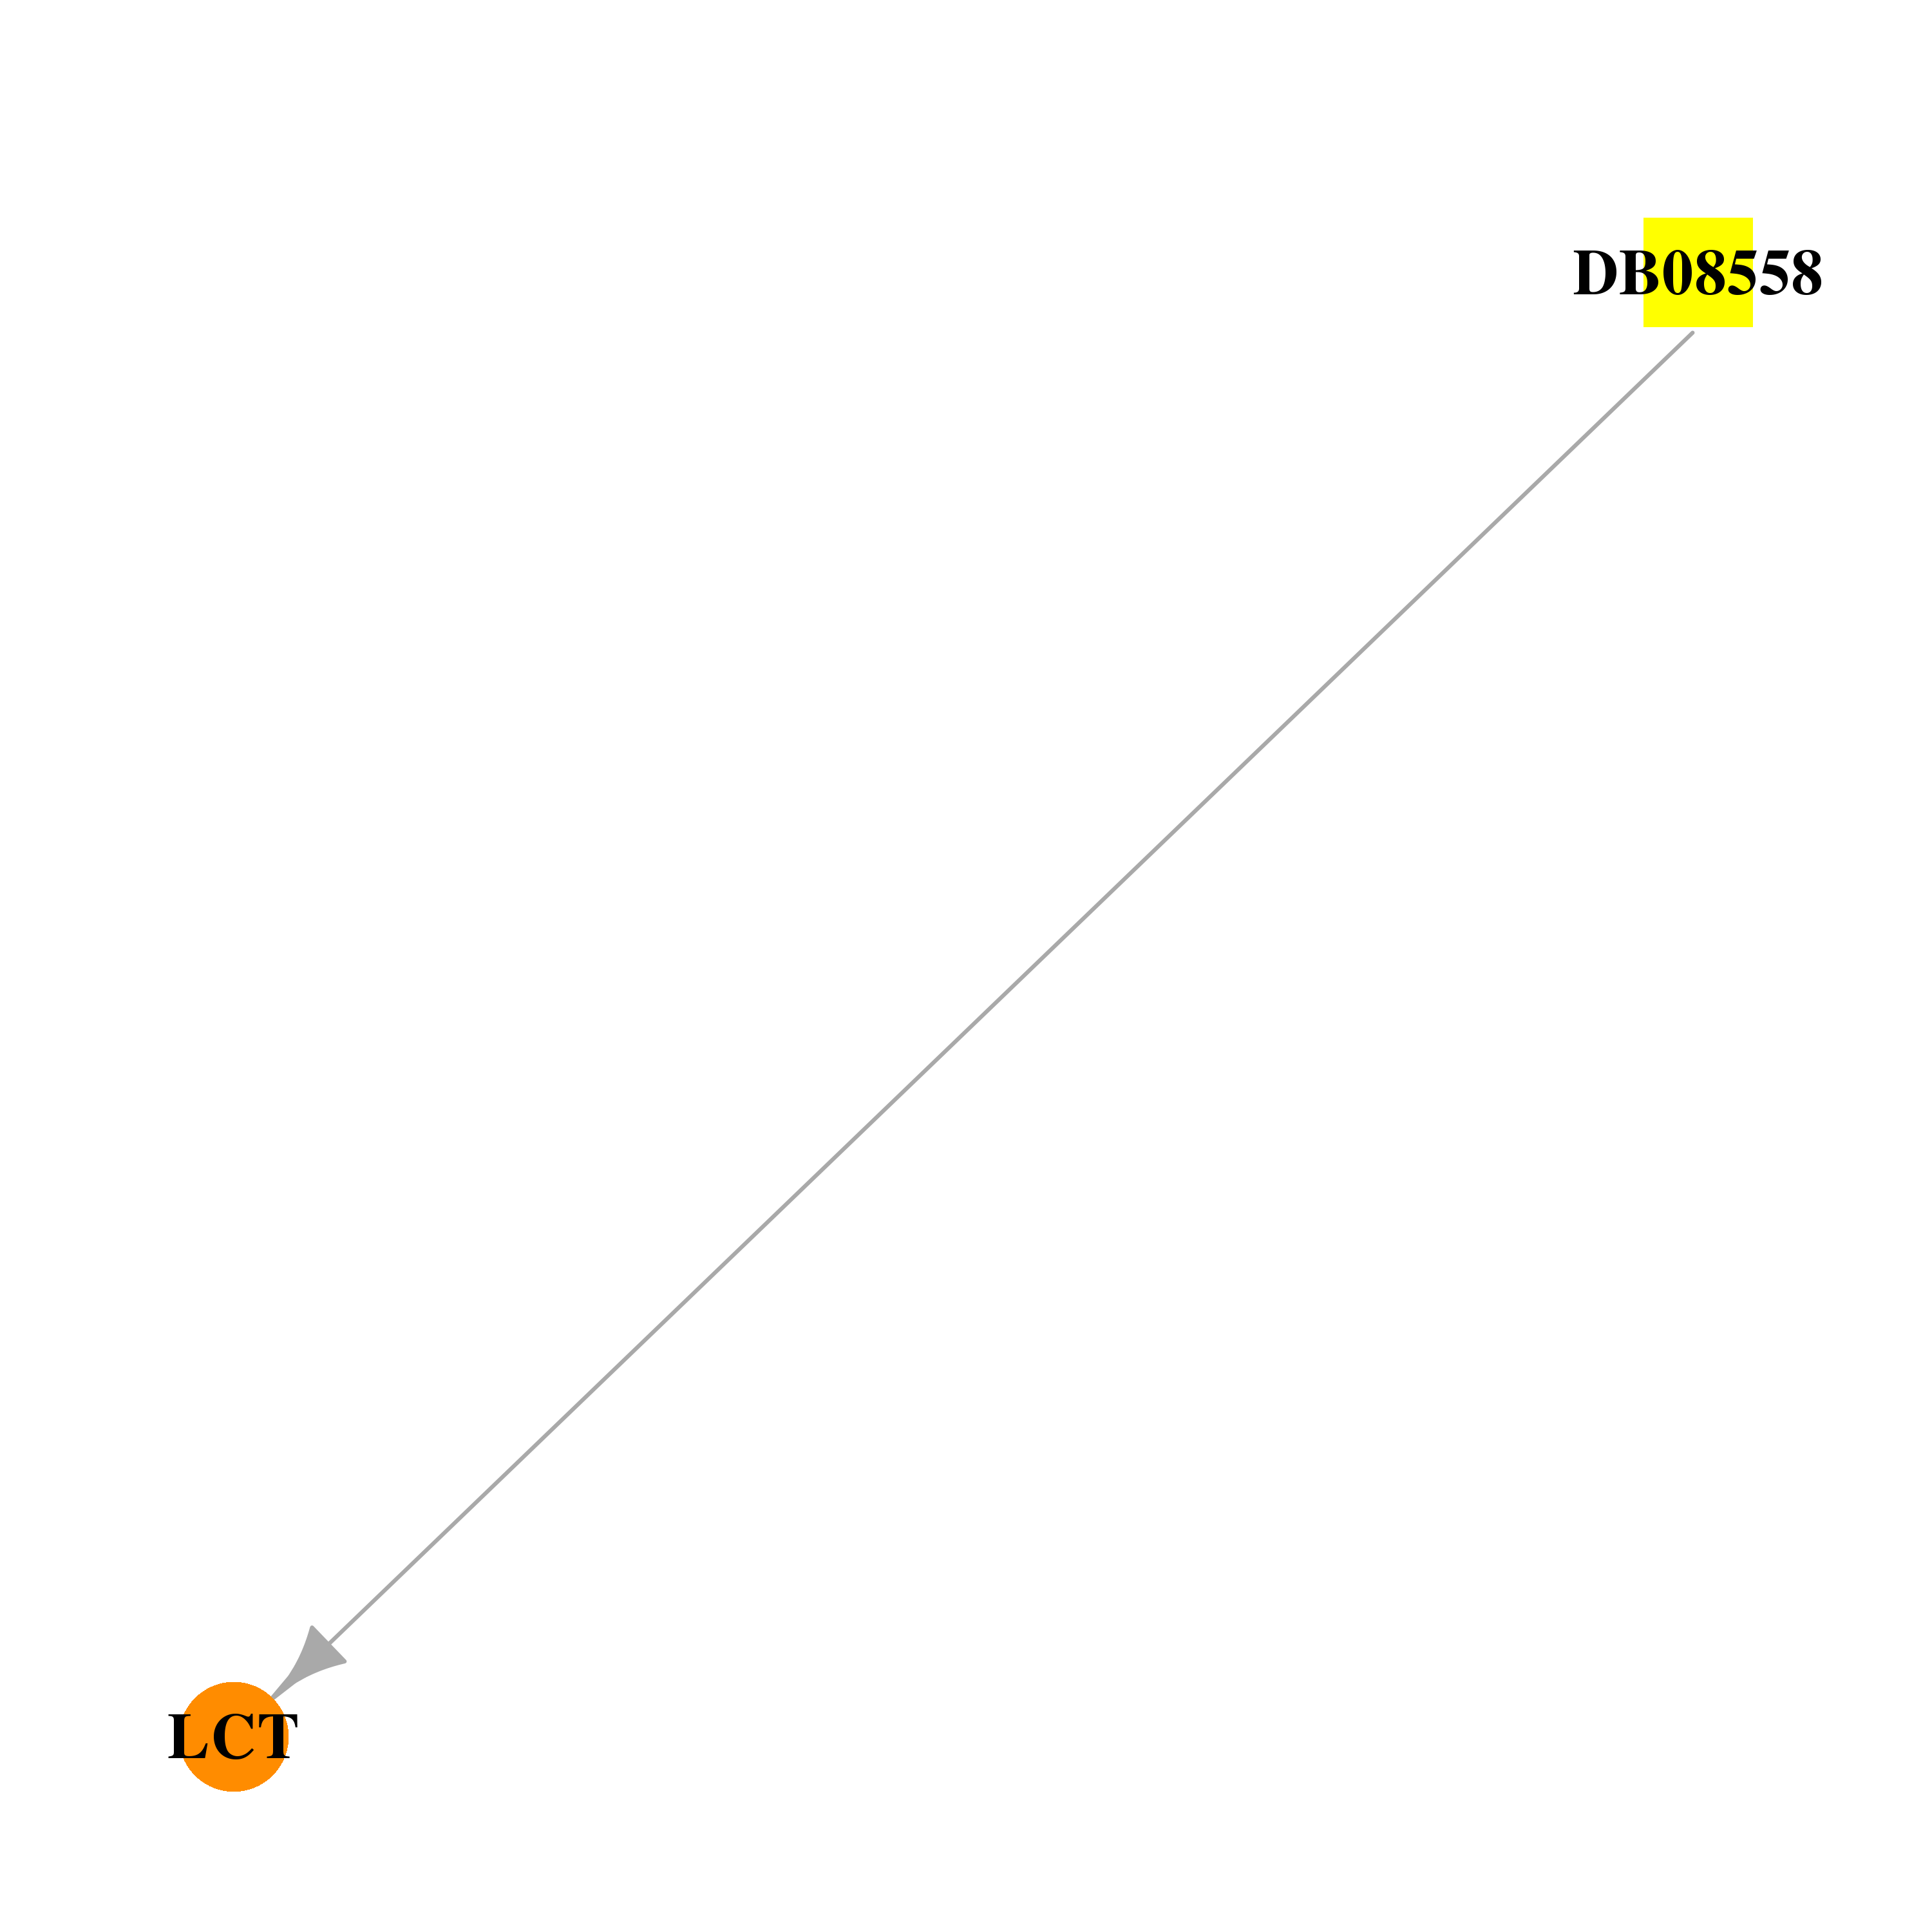 |  |
| DB04465 | lactase | experimental | Lactose |  | 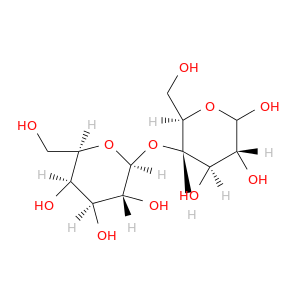 |
| Top |
| Cross referenced IDs for LCT |
| * We obtained these cross-references from Uniprot database. It covers 150 different DBs, 18 categories. http://www.uniprot.org/help/cross_references_section |
: Open all cross reference information
|
Copyright © 2016-Present - The Univsersity of Texas Health Science Center at Houston @ |