|
||||||||||||||||||||
| |
| Phenotypic Information (metabolism pathway, cancer, disease, phenome) |
| |
| |
| Gene-Gene Network Information: Co-Expression Network, Interacting Genes & KEGG |
| |
|


| Gene Summary for LDHC |
| Basic gene info. | Gene symbol | LDHC |
| Gene name | lactate dehydrogenase C | |
| Synonyms | CT32|LDH3|LDHX | |
| Cytomap | UCSC genome browser: 11p15.1 | |
| Genomic location | chr11 :18433852-18472793 | |
| Type of gene | protein-coding | |
| RefGenes | NM_002301.4, NM_017448.3, | |
| Ensembl id | ENSG00000166796 | |
| Description | L-lactate dehydrogenase C chainLDH testis subunitLDH-CLDH-Xcancer/testis antigen 32lactate dehydrogenase C4lactate dehydrogenase c variant 1lactate dehydrogenase c variant 3lactate dehydrogenase c variant 4 | |
| Modification date | 20141207 | |
| dbXrefs | MIM : 150150 | |
| HGNC : HGNC | ||
| Ensembl : ENSG00000166796 | ||
| HPRD : 01027 | ||
| Vega : OTTHUMG00000167722 | ||
| Protein | UniProt: go to UniProt's Cross Reference DB Table | |
| Expression | CleanEX: HS_LDHC | |
| BioGPS: 3948 | ||
| Gene Expression Atlas: ENSG00000166796 | ||
| The Human Protein Atlas: ENSG00000166796 | ||
| Pathway | NCI Pathway Interaction Database: LDHC | |
| KEGG: LDHC | ||
| REACTOME: LDHC | ||
| ConsensusPathDB | ||
| Pathway Commons: LDHC | ||
| Metabolism | MetaCyc: LDHC | |
| HUMANCyc: LDHC | ||
| Regulation | Ensembl's Regulation: ENSG00000166796 | |
| miRBase: chr11 :18,433,852-18,472,793 | ||
| TargetScan: NM_002301 | ||
| cisRED: ENSG00000166796 | ||
| Context | iHOP: LDHC | |
| cancer metabolism search in PubMed: LDHC | ||
| UCL Cancer Institute: LDHC | ||
| Assigned class in ccmGDB | C | |
| Top |
| Phenotypic Information for LDHC(metabolism pathway, cancer, disease, phenome) |
| Cancer | CGAP: LDHC |
| Familial Cancer Database: LDHC | |
| * This gene is included in those cancer gene databases. |
|
|
|
|
|
|
| ||||||||||||||
Oncogene 1 | Significant driver gene in | |||||||||||||||||||
| cf) number; DB name 1 Oncogene; http://nar.oxfordjournals.org/content/35/suppl_1/D721.long, 2 Tumor Suppressor gene; https://bioinfo.uth.edu/TSGene/, 3 Cancer Gene Census; http://www.nature.com/nrc/journal/v4/n3/abs/nrc1299.html, 4 CancerGenes; http://nar.oxfordjournals.org/content/35/suppl_1/D721.long, 5 Network of Cancer Gene; http://ncg.kcl.ac.uk/index.php, 1Therapeutic Vulnerabilities in Cancer; http://cbio.mskcc.org/cancergenomics/statius/ |
| KEGG_GLYCOLYSIS_GLUCONEOGENESIS KEGG_CYSTEINE_AND_METHIONINE_METABOLISM KEGG_PYRUVATE_METABOLISM KEGG_PROPANOATE_METABOLISM | |
| OMIM | |
| Orphanet | |
| Disease | KEGG Disease: LDHC |
| MedGen: LDHC (Human Medical Genetics with Condition) | |
| ClinVar: LDHC | |
| Phenotype | MGI: LDHC (International Mouse Phenotyping Consortium) |
| PhenomicDB: LDHC | |
| Mutations for LDHC |
| * Under tables are showing count per each tissue to give us broad intuition about tissue specific mutation patterns.You can go to the detailed page for each mutation database's web site. |
| There's no structural variation information in COSMIC data for this gene. |
| * From mRNA Sanger sequences, Chitars2.0 arranged chimeric transcripts. This table shows LDHC related fusion information. |
| ID | Head Gene | Tail Gene | Accession | Gene_a | qStart_a | qEnd_a | Chromosome_a | tStart_a | tEnd_a | Gene_a | qStart_a | qEnd_a | Chromosome_a | tStart_a | tEnd_a |
| BU569321 | RGS22 | 8 | 463 | 8 | 100990196 | 100999854 | LDHC | 458 | 600 | 11 | 18472647 | 18472789 | |
| Top |
| There's no copy number variation information in COSMIC data for this gene. |
| Top |
|
 |
| Top |
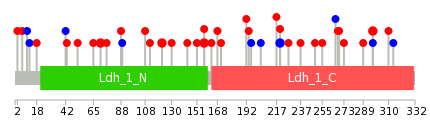
| Stat. for Non-Synonymous SNVs (# total SNVs=30) | (# total SNVs=5) |
 |  |
(# total SNVs=0) | (# total SNVs=2) |
 |
| Top |
| * When you move the cursor on each content, you can see more deailed mutation information on the Tooltip. Those are primary_site,primary_histology,mutation(aa),pubmedID. |
| GRCh37 position | Mutation(aa) | Unique sampleID count |
| chr11:18460142-18460142 | p.T220T | 2 |
| chr11:18472565-18472565 | p.R297Q | 2 |
| chr11:18451403-18451403 | p.P122S | 2 |
| chr11:18436817-18436817 | p.F71L | 2 |
| chr11:18456337-18456337 | p.R157C | 2 |
| chr11:18434294-18434294 | p.E10E | 1 |
| chr11:18460141-18460141 | p.T220M | 1 |
| chr11:18451306-18451306 | p.S89S | 1 |
| chr11:18472564-18472564 | p.R297R | 1 |
| chr11:18456338-18456338 | p.R157H | 1 |
| Top |
|
 |
| Point Mutation/ Tissue ID | 1 | 2 | 3 | 4 | 5 | 6 | 7 | 8 | 9 | 10 | 11 | 12 | 13 | 14 | 15 | 16 | 17 | 18 | 19 | 20 |
| # sample | 3 | 2 | 4 | 3 | 1 | 8 | 3 | 1 | 7 | 1 | 4 | |||||||||
| # mutation | 3 | 2 | 4 | 3 | 1 | 9 | 3 | 1 | 6 | 1 | 5 | |||||||||
| nonsynonymous SNV | 2 | 3 | 2 | 1 | 7 | 3 | 1 | 4 | 1 | 4 | ||||||||||
| synonymous SNV | 3 | 1 | 1 | 2 | 2 | 1 |
| cf) Tissue ID; Tissue type (1; BLCA[Bladder Urothelial Carcinoma], 2; BRCA[Breast invasive carcinoma], 3; CESC[Cervical squamous cell carcinoma and endocervical adenocarcinoma], 4; COAD[Colon adenocarcinoma], 5; GBM[Glioblastoma multiforme], 6; Glioma Low Grade, 7; HNSC[Head and Neck squamous cell carcinoma], 8; KICH[Kidney Chromophobe], 9; KIRC[Kidney renal clear cell carcinoma], 10; KIRP[Kidney renal papillary cell carcinoma], 11; LAML[Acute Myeloid Leukemia], 12; LUAD[Lung adenocarcinoma], 13; LUSC[Lung squamous cell carcinoma], 14; OV[Ovarian serous cystadenocarcinoma ], 15; PAAD[Pancreatic adenocarcinoma], 16; PRAD[Prostate adenocarcinoma], 17; SKCM[Skin Cutaneous Melanoma], 18:STAD[Stomach adenocarcinoma], 19:THCA[Thyroid carcinoma], 20:UCEC[Uterine Corpus Endometrial Carcinoma]) |
| Top |
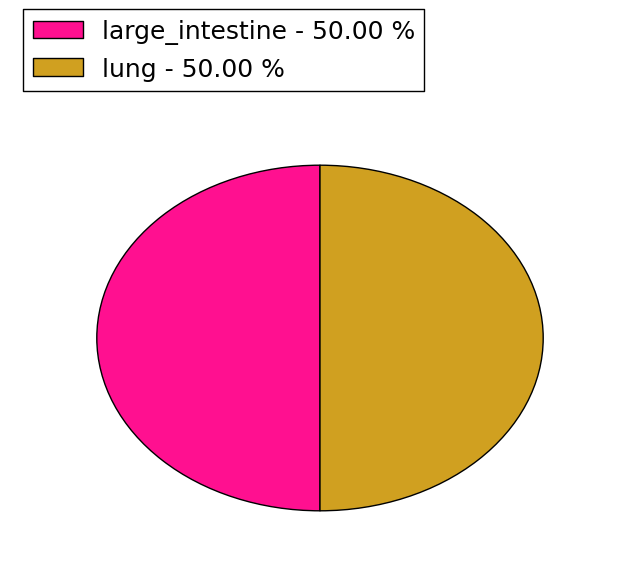
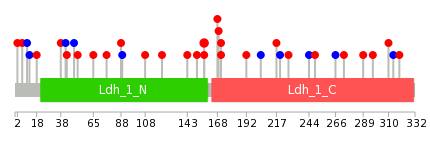
| * We represented just top 10 SNVs. When you move the cursor on each content, you can see more deailed mutation information on the Tooltip. Those are primary_site, primary_histology, mutation(aa), pubmedID. |
| Genomic Position | Mutation(aa) | Unique sampleID count |
| chr11:18456337 | p.R157C,LDHC | 3 |
| chr11:18434294 | p.E10E,LDHC | 1 |
| chr11:18472604 | p.S310F,LDHC | 1 |
| chr11:18451306 | p.L12L,LDHC | 1 |
| chr11:18460094 | p.A168G,LDHC | 1 |
| chr11:18434300 | p.A314A,LDHC | 1 |
| chr11:18472617 | p.N18K,LDHC | 1 |
| chr11:18451362 | p.R169S,LDHC | 1 |
| chr11:18460131 | p.S319I,LDHC | 1 |
| chr11:18434318 | p.S38R,LDHC | 1 |
| * Copy number data were extracted from TCGA using R package TCGA-Assembler. The URLs of all public data files on TCGA DCC data server were gathered on Jan-05-2015. Function ProcessCNAData in TCGA-Assembler package was used to obtain gene-level copy number value which is calculated as the average copy number of the genomic region of a gene. |
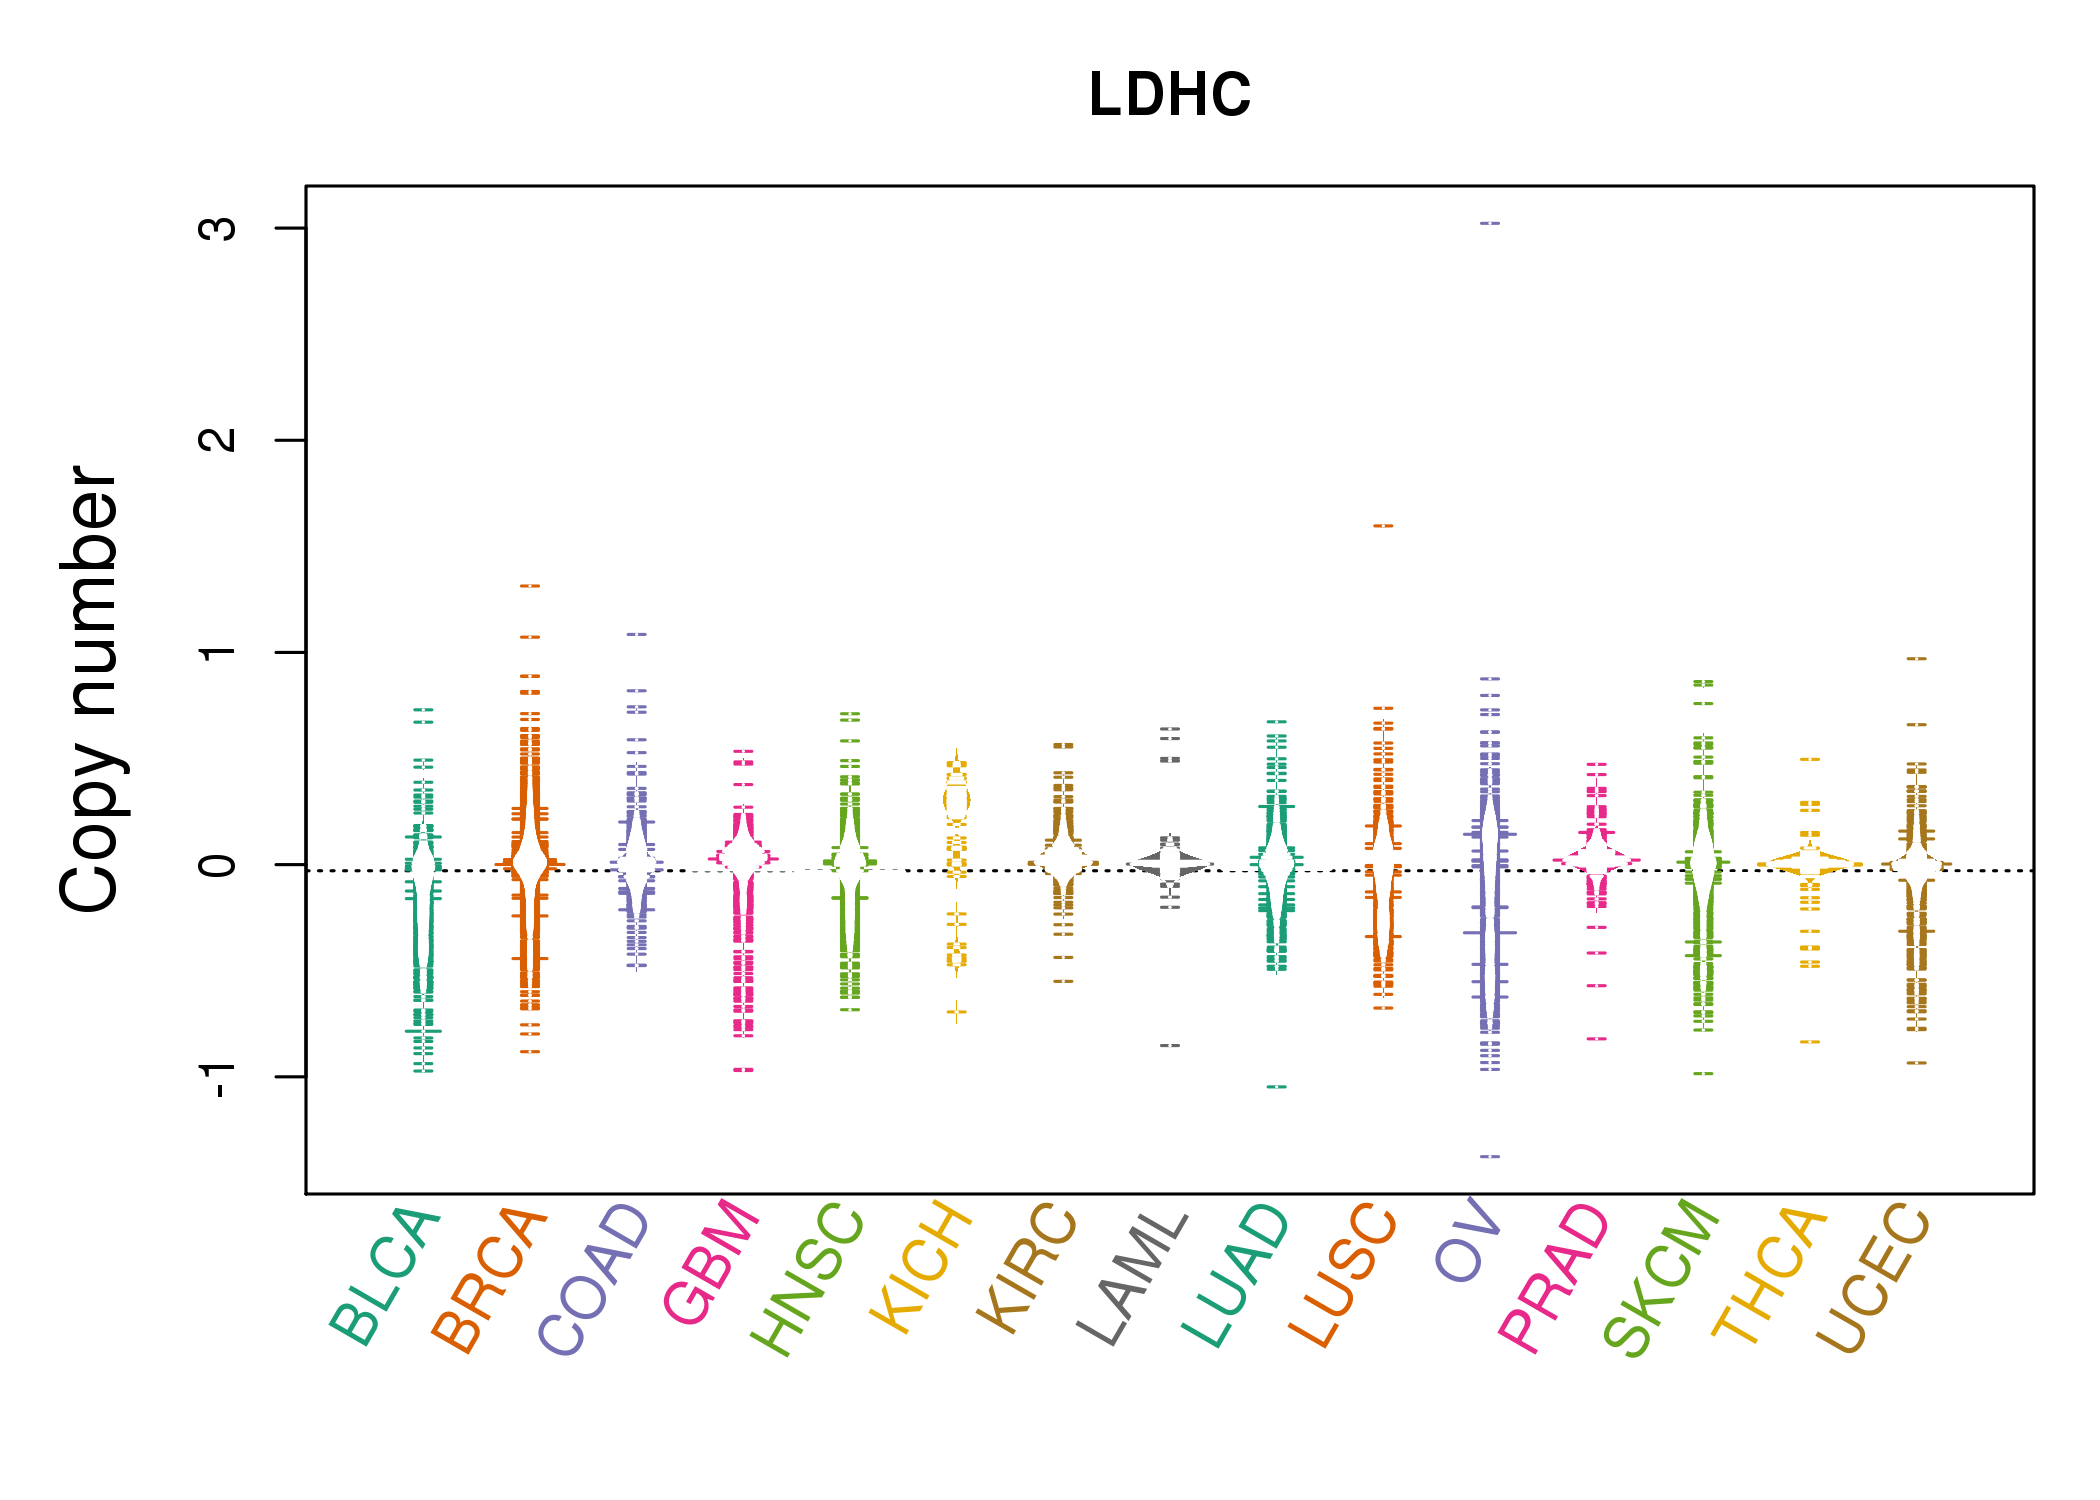 |
| cf) Tissue ID[Tissue type]: BLCA[Bladder Urothelial Carcinoma], BRCA[Breast invasive carcinoma], CESC[Cervical squamous cell carcinoma and endocervical adenocarcinoma], COAD[Colon adenocarcinoma], GBM[Glioblastoma multiforme], Glioma Low Grade, HNSC[Head and Neck squamous cell carcinoma], KICH[Kidney Chromophobe], KIRC[Kidney renal clear cell carcinoma], KIRP[Kidney renal papillary cell carcinoma], LAML[Acute Myeloid Leukemia], LUAD[Lung adenocarcinoma], LUSC[Lung squamous cell carcinoma], OV[Ovarian serous cystadenocarcinoma ], PAAD[Pancreatic adenocarcinoma], PRAD[Prostate adenocarcinoma], SKCM[Skin Cutaneous Melanoma], STAD[Stomach adenocarcinoma], THCA[Thyroid carcinoma], UCEC[Uterine Corpus Endometrial Carcinoma] |
| Top |
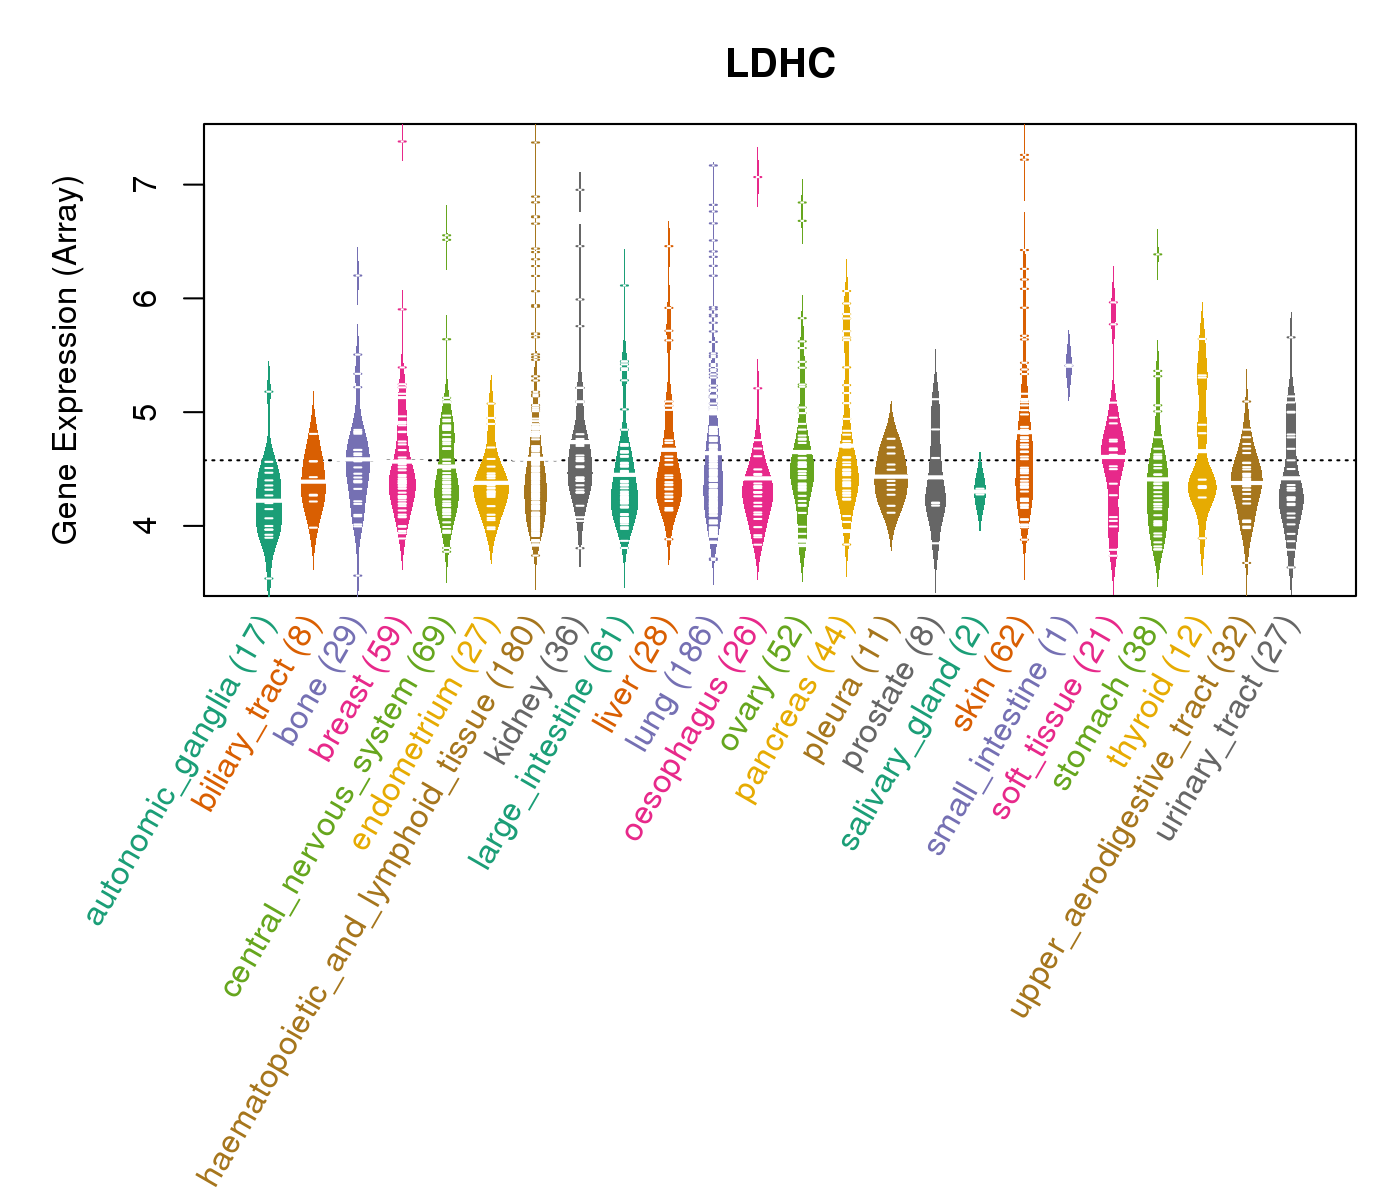
| Gene Expression for LDHC |
| * CCLE gene expression data were extracted from CCLE_Expression_Entrez_2012-10-18.res: Gene-centric RMA-normalized mRNA expression data. |
 |
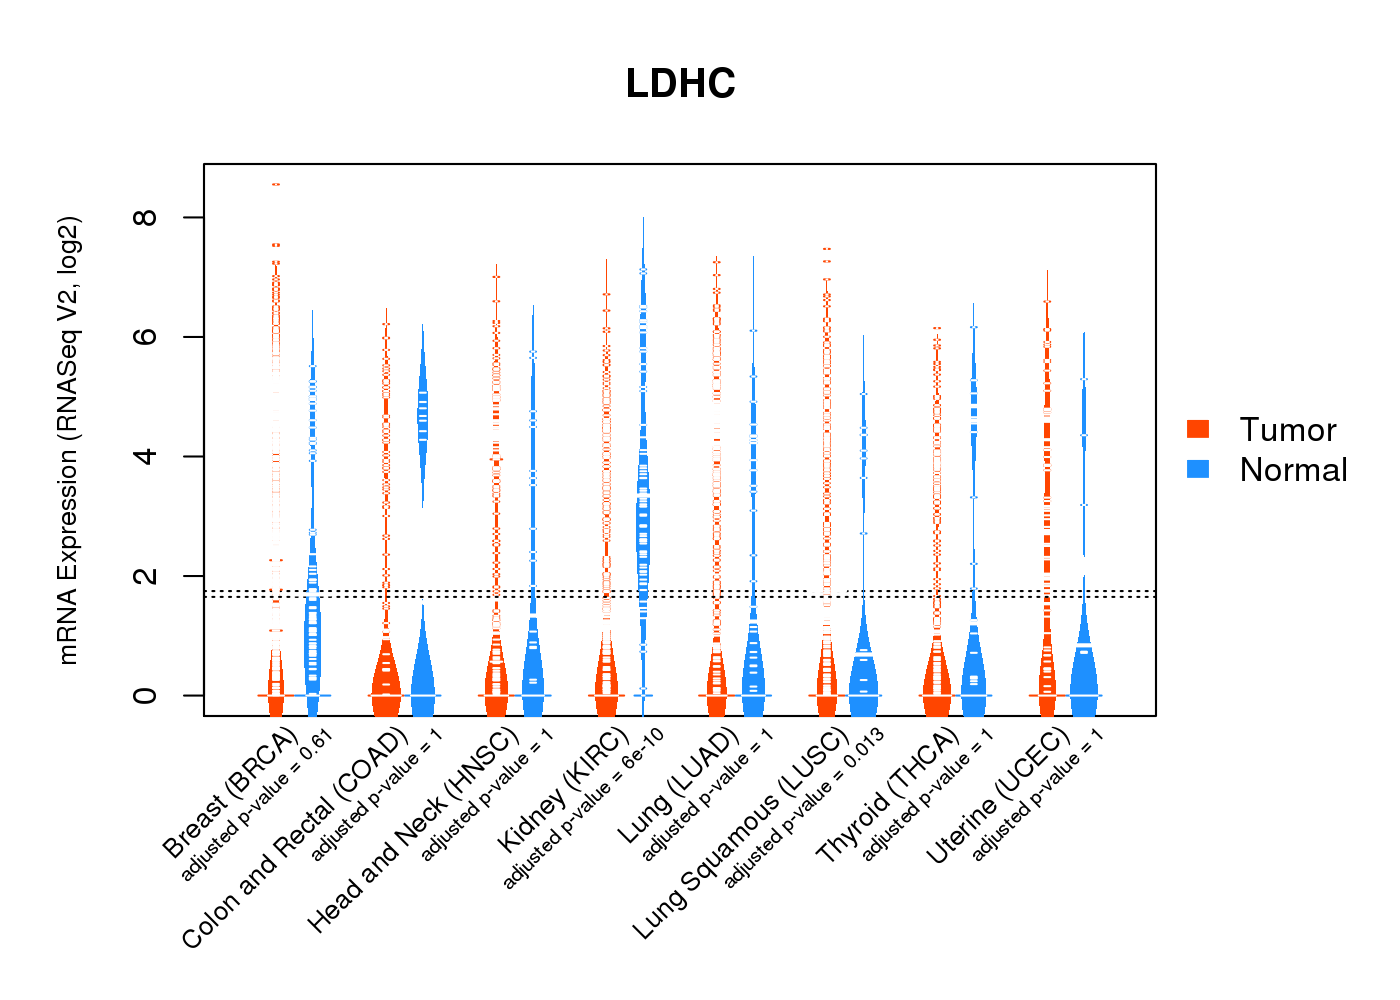
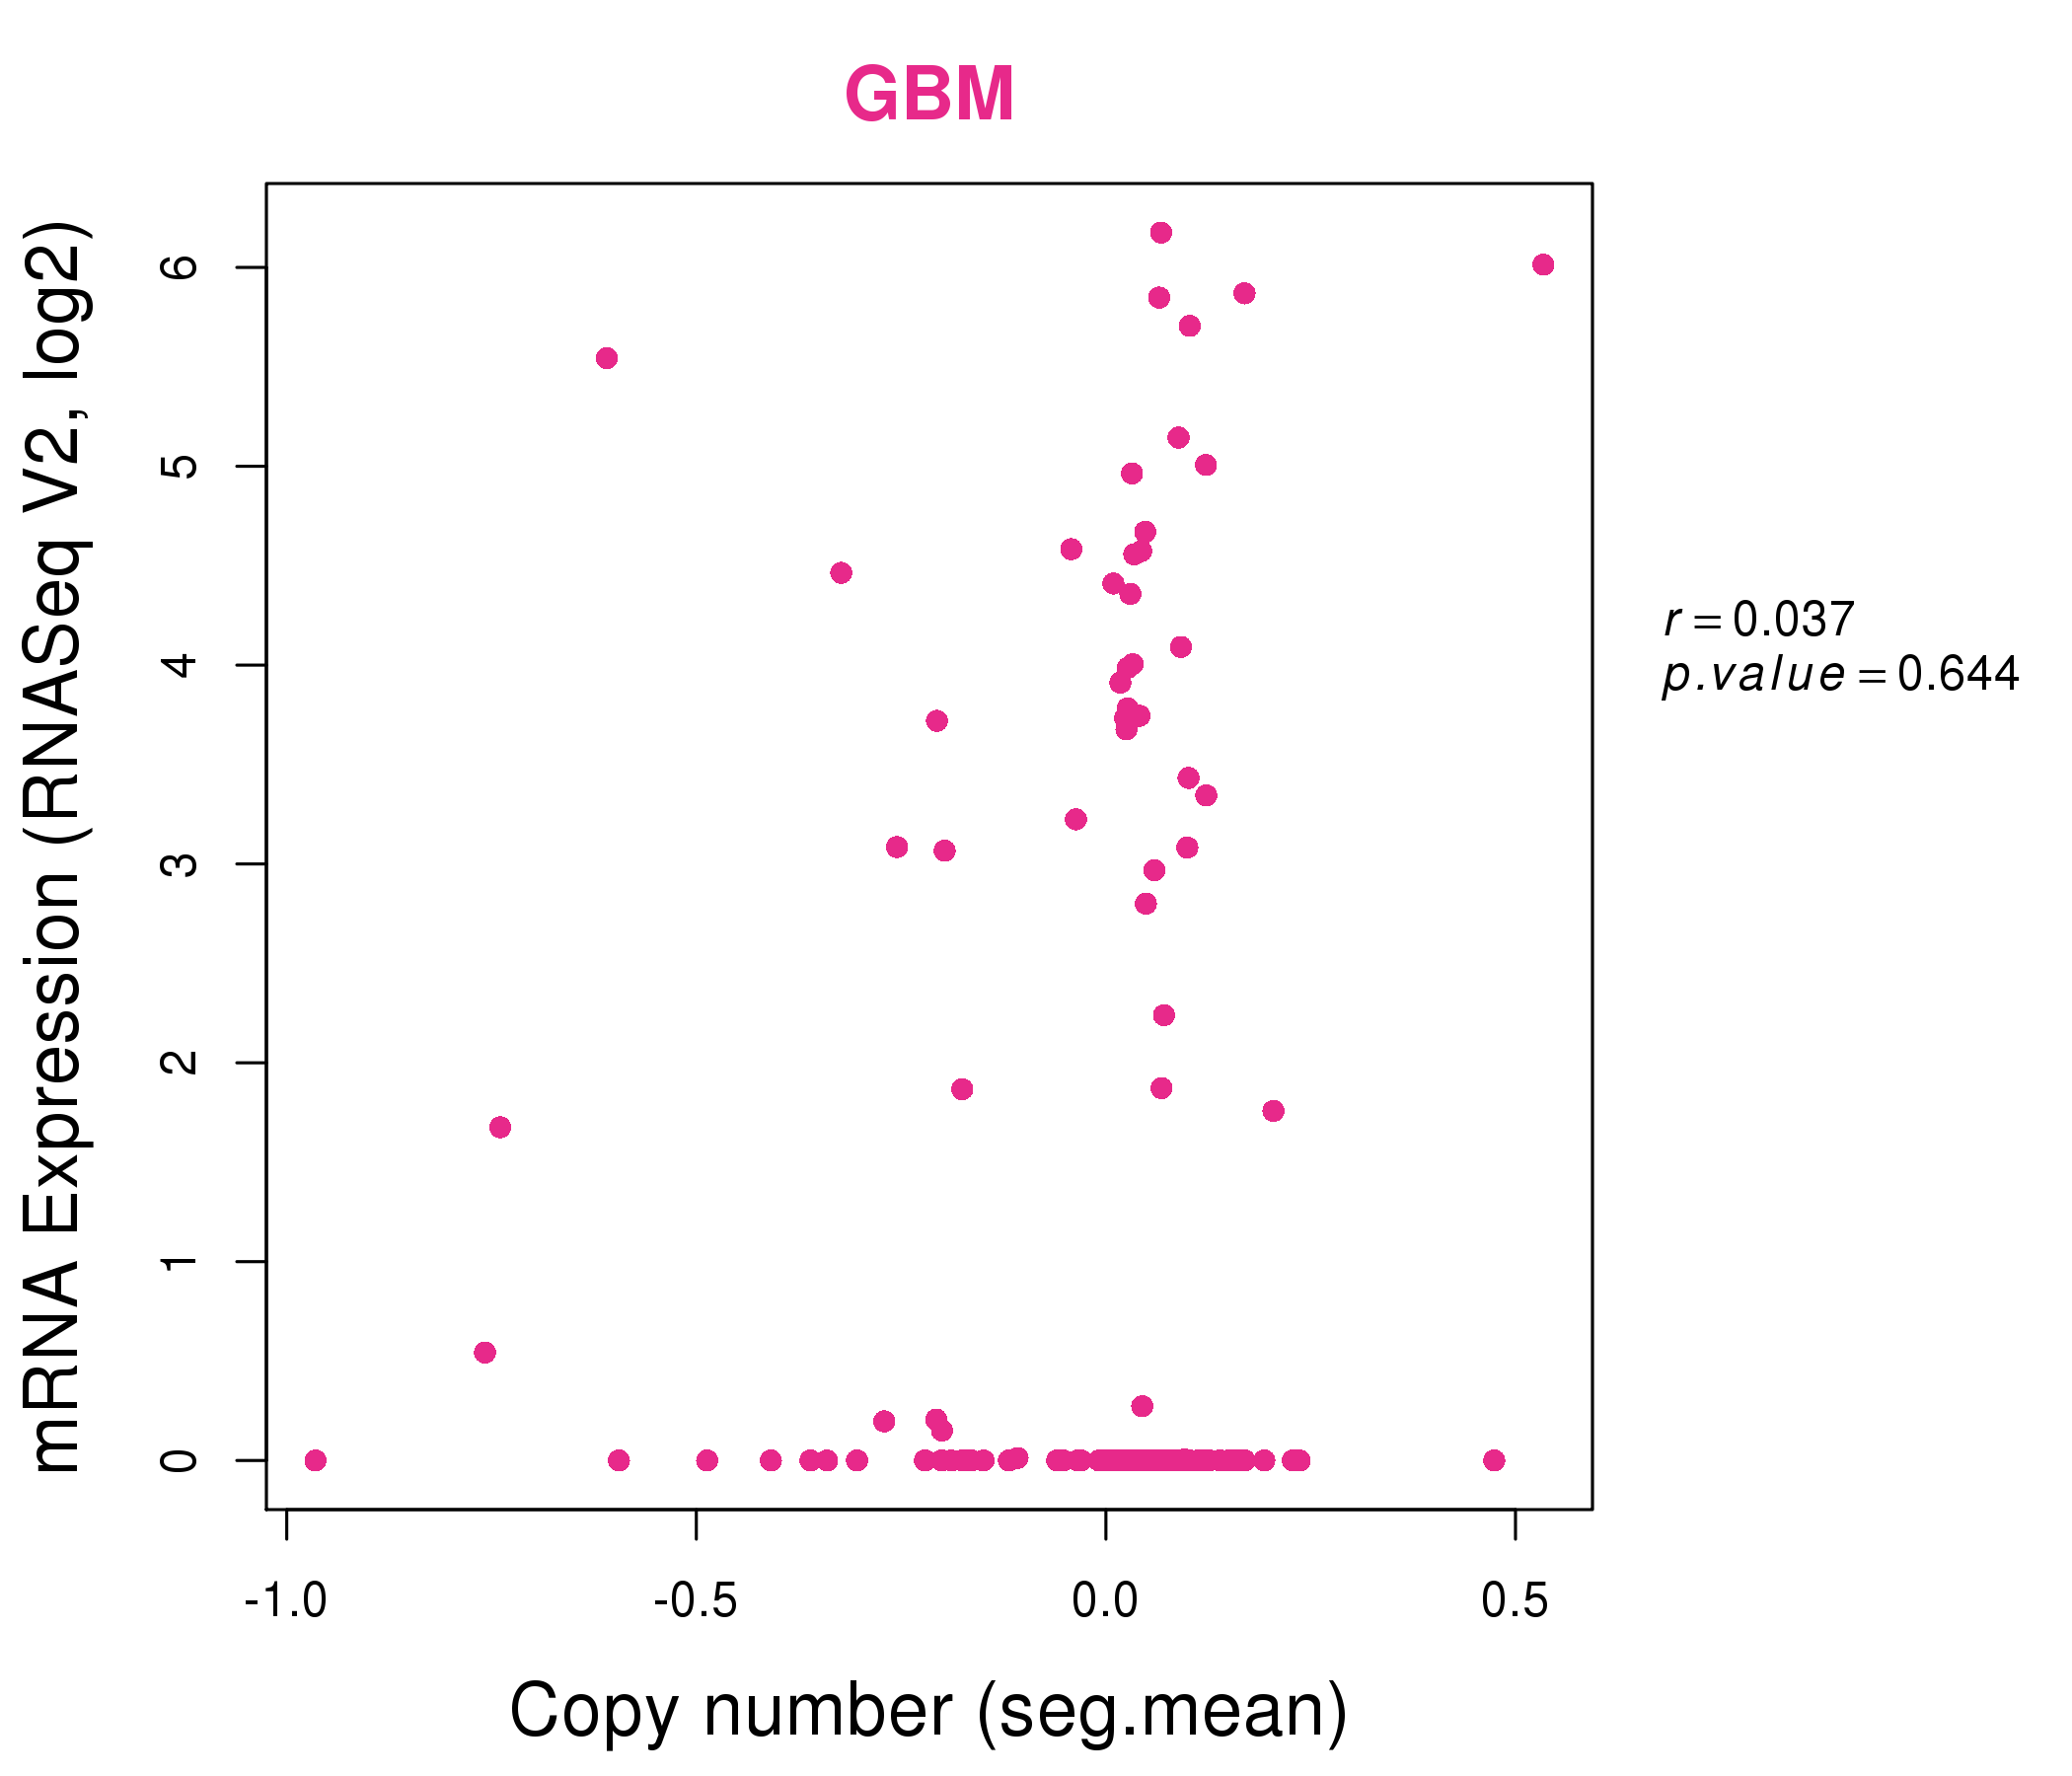
| * Normalized gene expression data of RNASeqV2 was extracted from TCGA using R package TCGA-Assembler. The URLs of all public data files on TCGA DCC data server were gathered at Jan-05-2015. Only eight cancer types have enough normal control samples for differential expression analysis. (t test, adjusted p<0.05 (using Benjamini-Hochberg FDR)) |
 |
| Top |
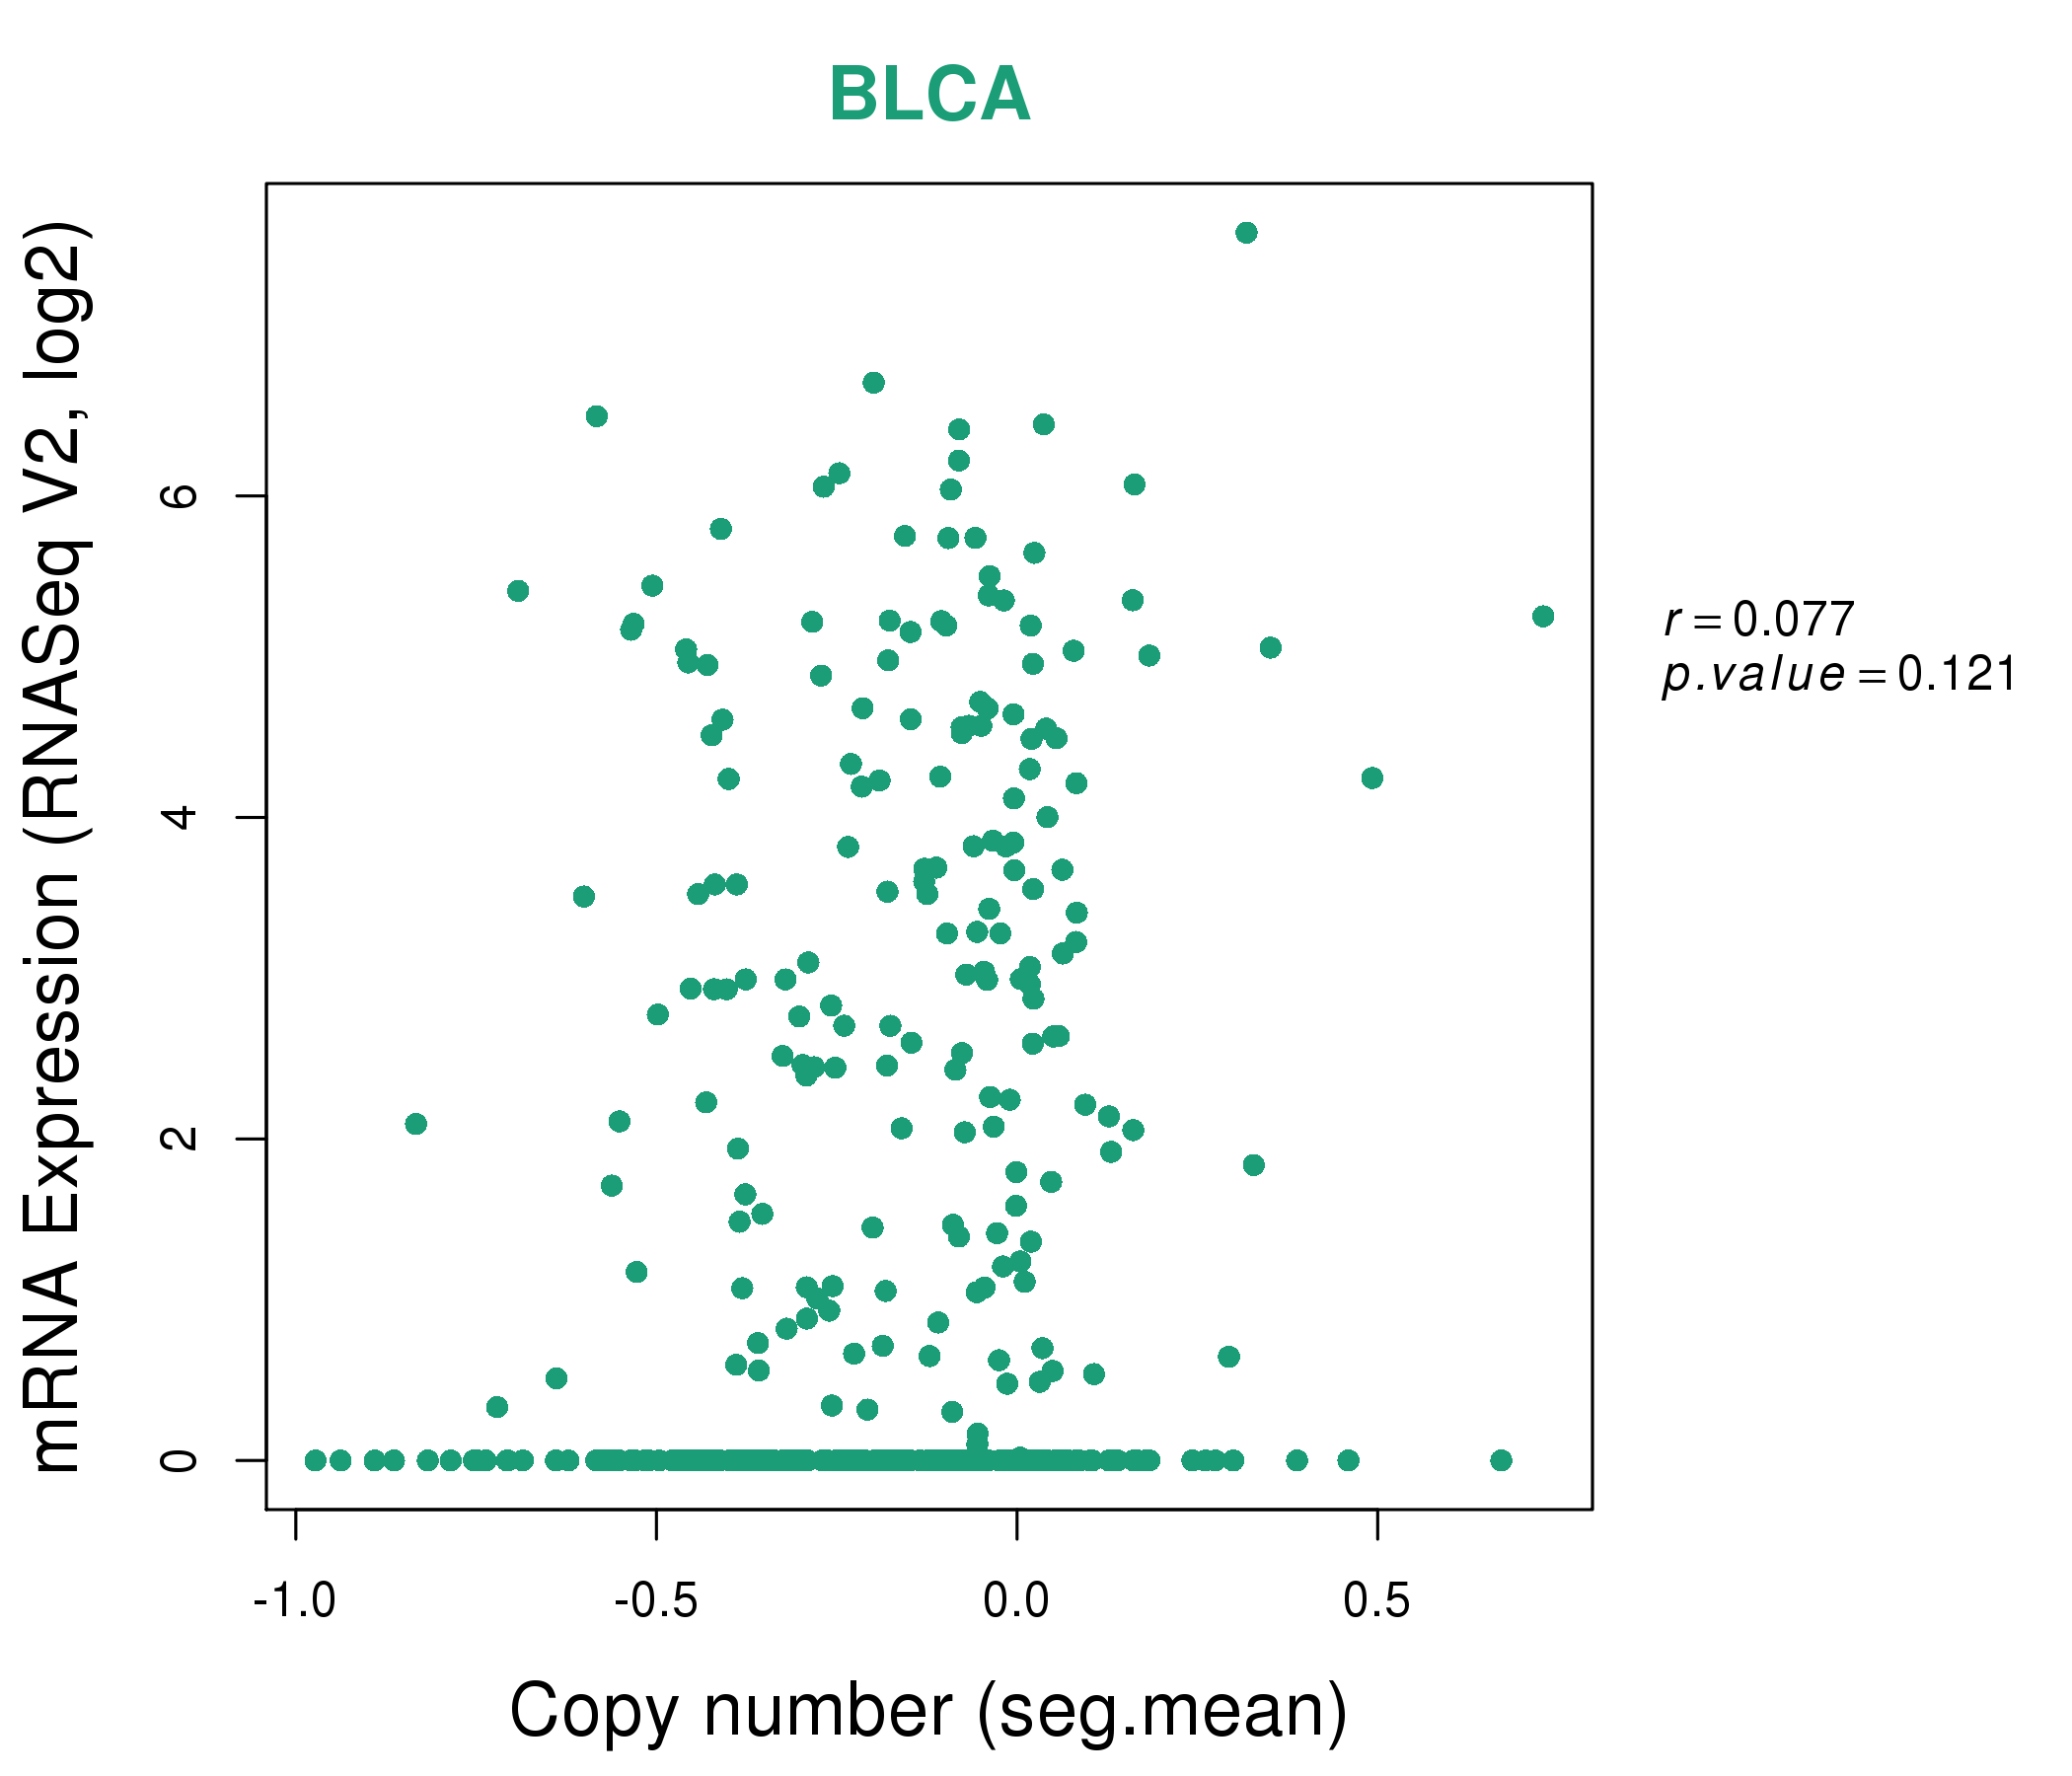
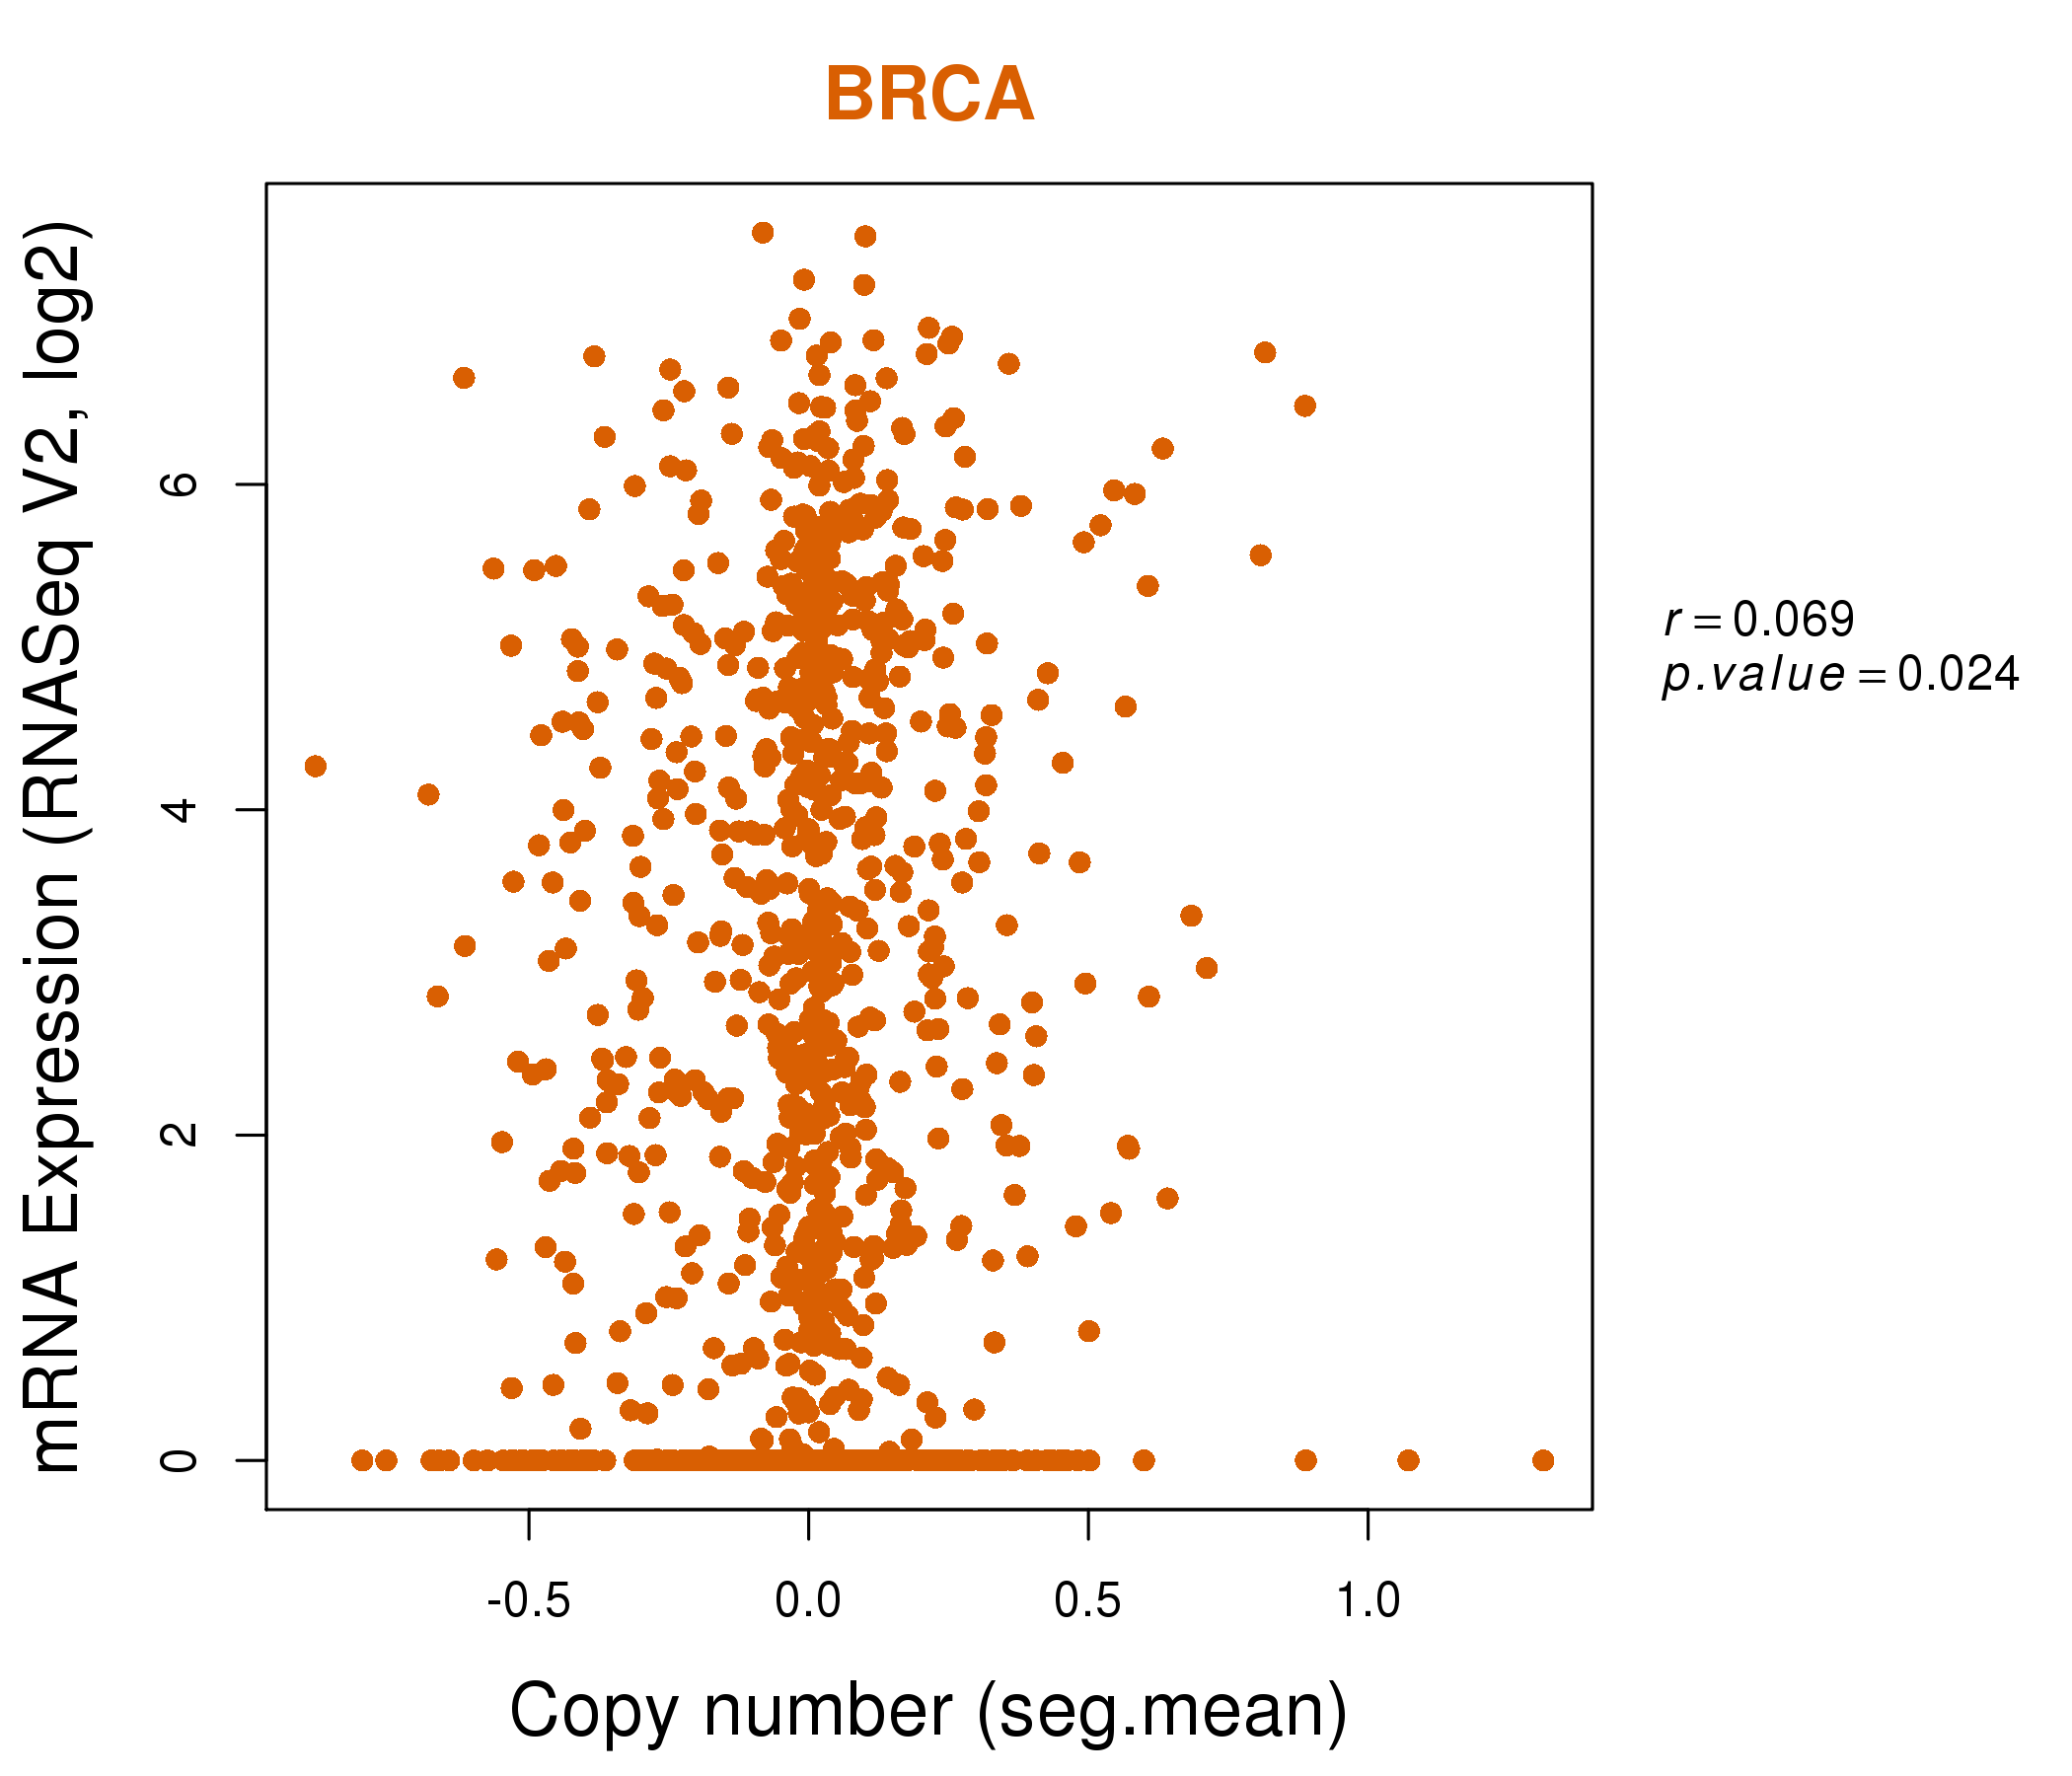
| * This plots show the correlation between CNV and gene expression. |
: Open all plots for all cancer types
 |
|
 |
|
| Top |
| Gene-Gene Network Information |
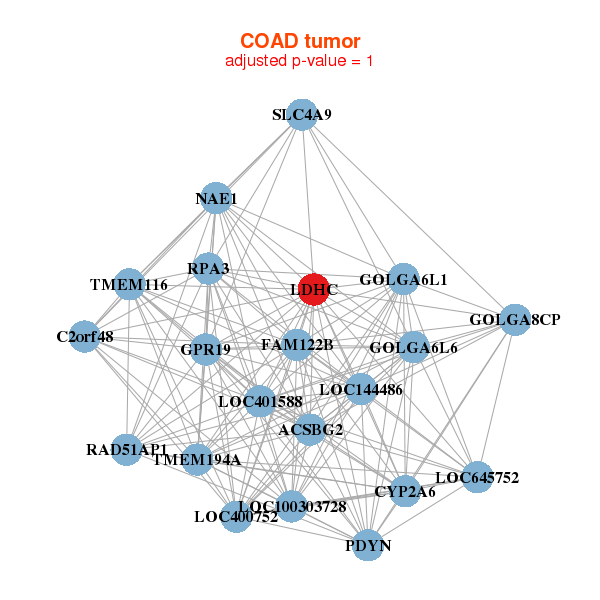
| * Co-Expression network figures were drawn using R package igraph. Only the top 20 genes with the highest correlations were shown. Red circle: input gene, orange circle: cell metabolism gene, sky circle: other gene |
: Open all plots for all cancer types
 |
| ||||
| ARHGEF33,BCL11A,BEND4,MCMBP,LINC01553,HENMT1,MMS22L, C7orf66,CTXN3,EDAR,FAM81A,FLJ36000,GPR156,KIAA1841, LDHC,LGR6,PGLYRP1,PRKD3,SGOL1,SLC16A10,TTK | ANKRD20A3,BAGE,DSTN,FAM133A,ZC2HC1A,TVP23C,GKN1, GRPR,IFNA17,LDHC,LAMTOR3,NPTN,PCNP,PEX2, SLC16A9,STK3,TERF1,TMEM128,TMEM68,VMA21,ZFAND1 | ||||
 |
| ||||
| ACSBG2,C2orf48,CYP2A6,FAM122B,GOLGA6L1,GOLGA6L6,GOLGA8CP, GPR19,LDHC,LOC100303728,LOC144486,LOC400752,LOC401588,LOC645752, NAE1,PDYN,RAD51AP1,RPA3,SLC4A9,TMEM116,TMEM194A | ALOX15B,ANTXRL,ATXN3,C15orf43,C7orf13,CA5A,CCDC122, EVX1,FRRS1,ITGA10,LDHC,LINC01512,MC3R,MOBP, OR10J3,OR1L6,RRM2B,SNORA24,ZBTB44,ZNF33B,ZNF543 |

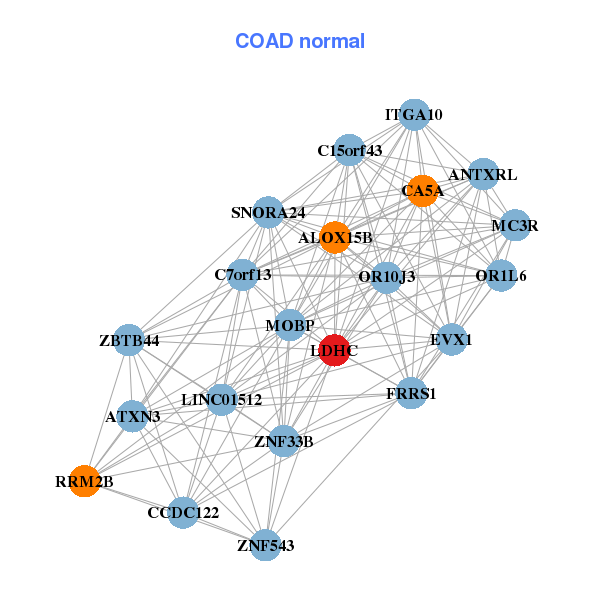
| * Co-Expression network figures were drawn using R package igraph. Only the top 20 genes with the highest correlations were shown. Red circle: input gene, orange circle: cell metabolism gene, sky circle: other gene |
: Open all plots for all cancer types
| Top |
: Open all interacting genes' information including KEGG pathway for all interacting genes from DAVID
| Top |
| Pharmacological Information for LDHC |
| DB Category | DB Name | DB's ID and Url link |
| * Gene Centered Interaction Network. |
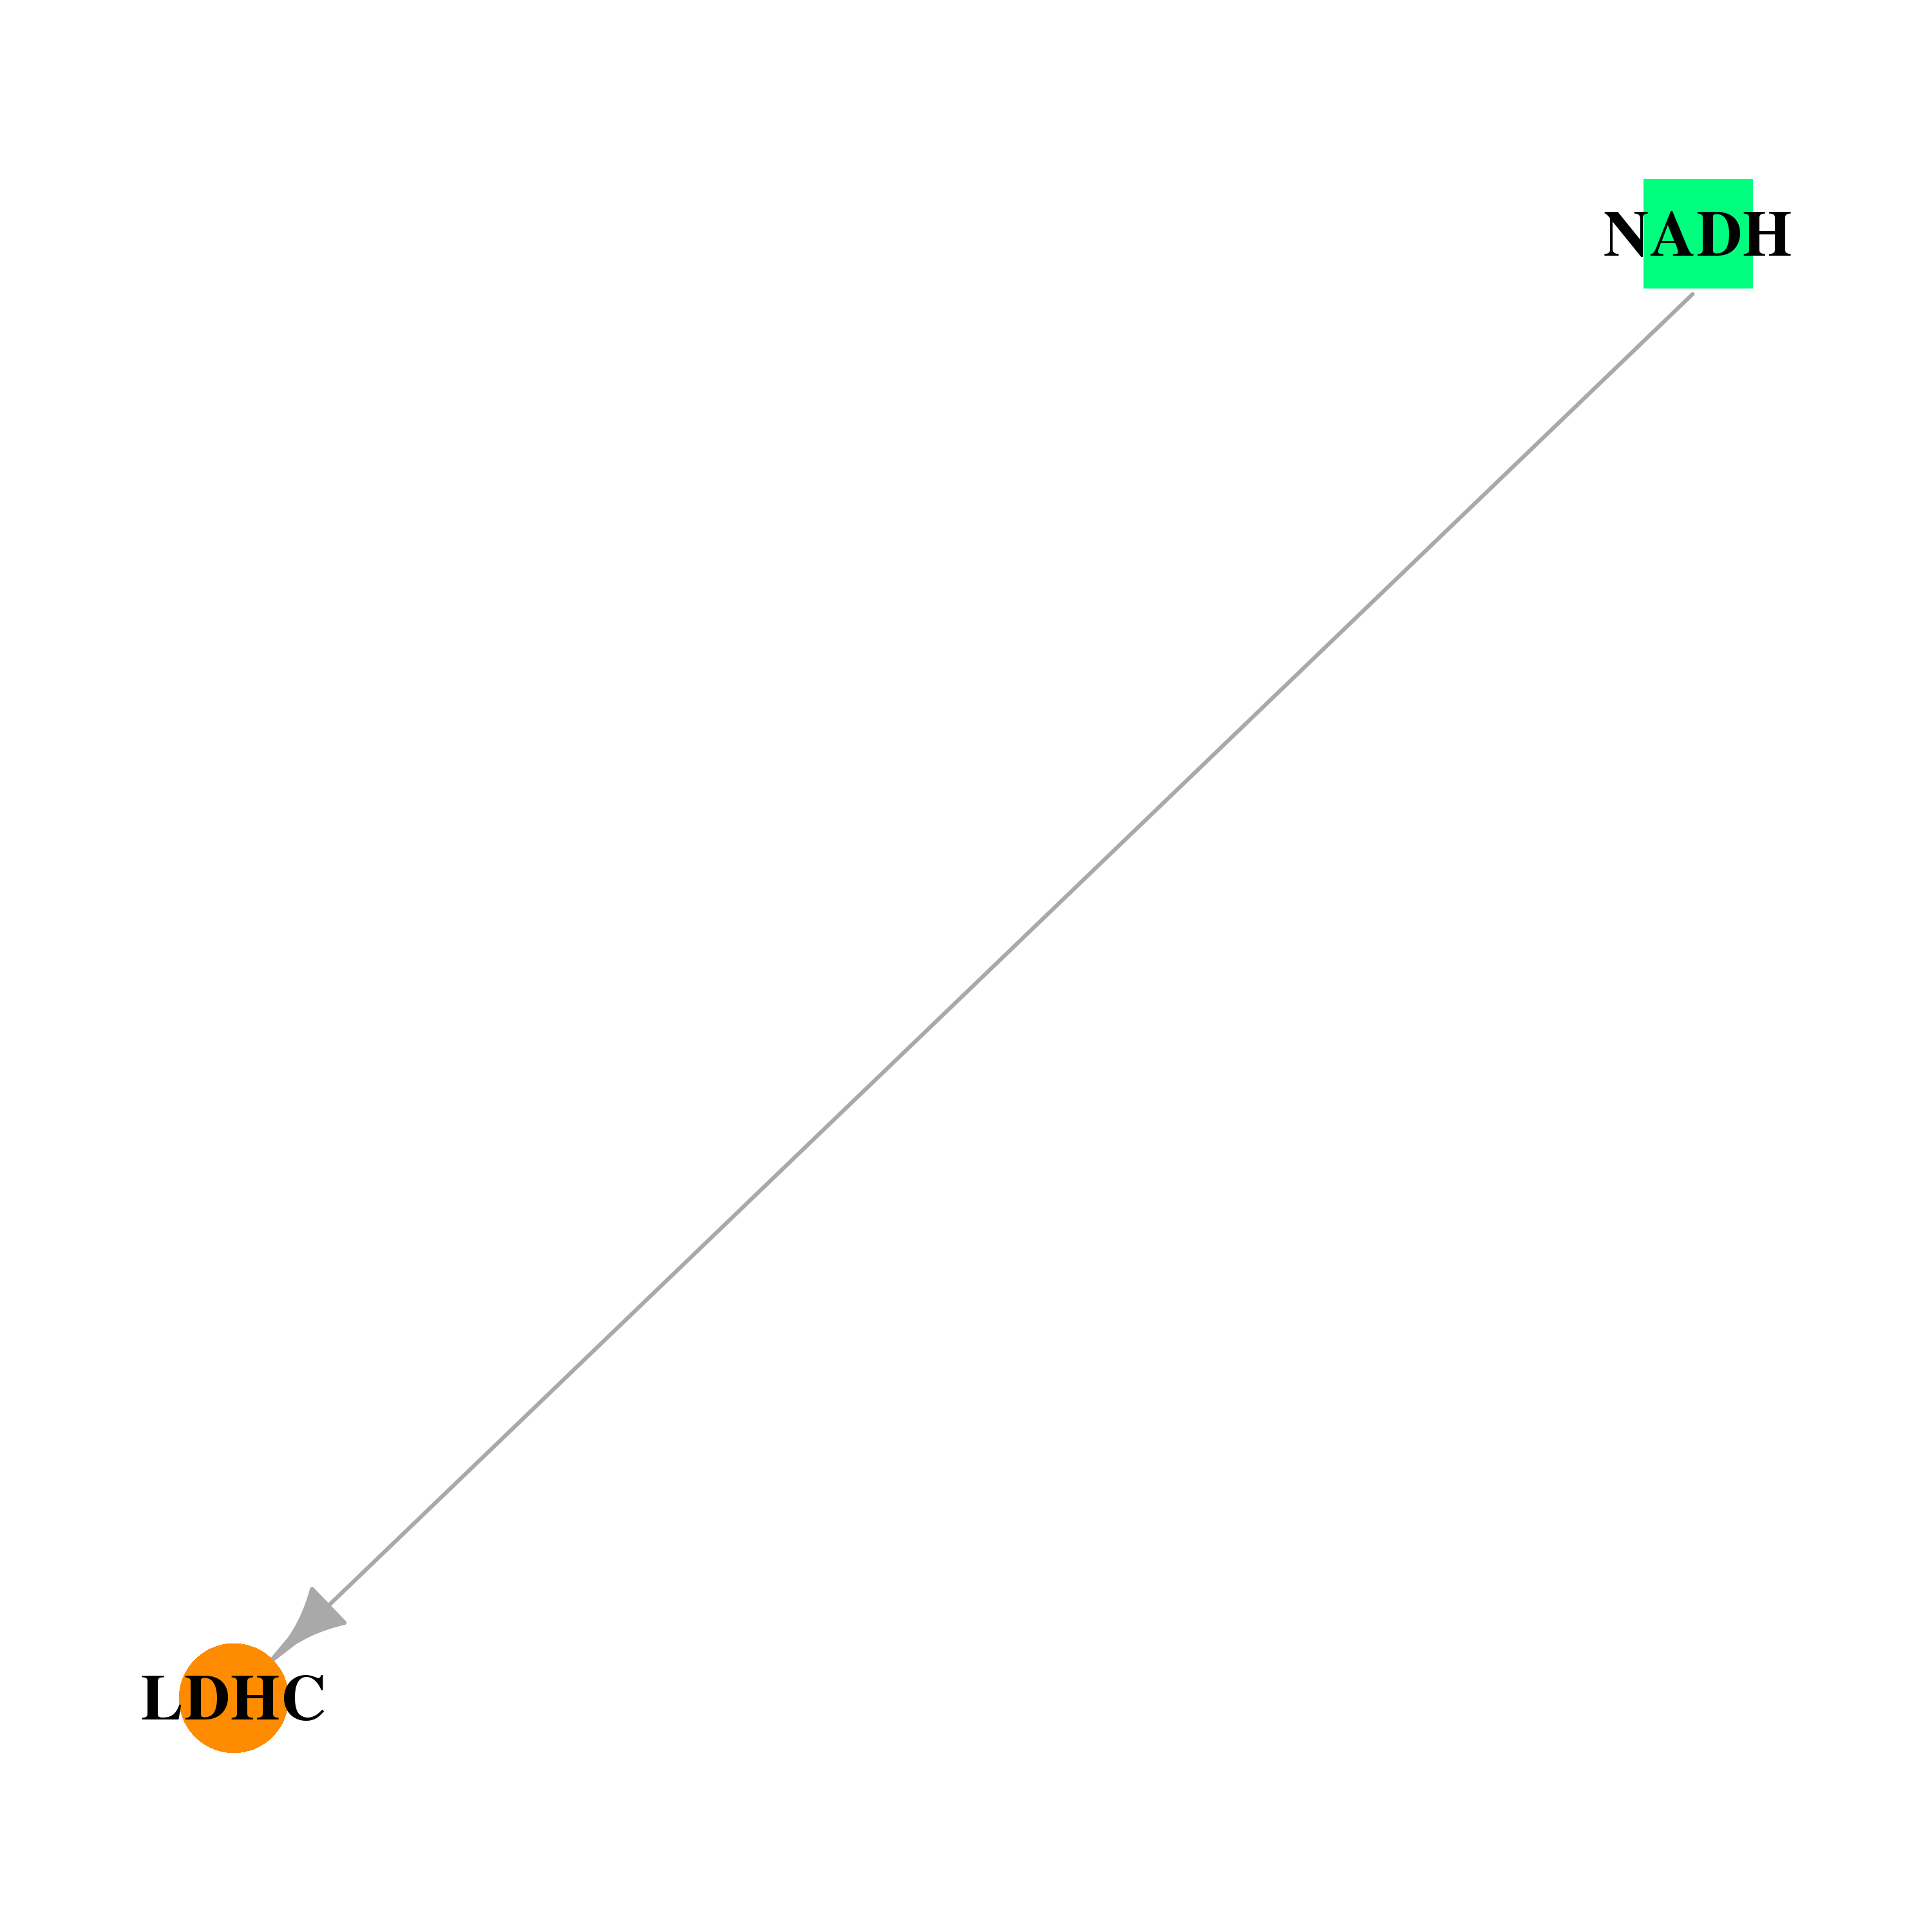 |
| * Drug Centered Interaction Network. |
| DrugBank ID | Target Name | Drug Groups | Generic Name | Drug Centered Network | Drug Structure |
| DB00157 | lactate dehydrogenase C | approved; nutraceutical | NADH |  |  |
| Top |
| Cross referenced IDs for LDHC |
| * We obtained these cross-references from Uniprot database. It covers 150 different DBs, 18 categories. http://www.uniprot.org/help/cross_references_section |
: Open all cross reference information
|
Copyright © 2016-Present - The Univsersity of Texas Health Science Center at Houston @ |