|
||||||||||||||||||||
| |
| Phenotypic Information (metabolism pathway, cancer, disease, phenome) |
| |
| |
| Gene-Gene Network Information: Co-Expression Network, Interacting Genes & KEGG |
| |
|


| Gene Summary for LHB |
| Basic gene info. | Gene symbol | LHB |
| Gene name | luteinizing hormone beta polypeptide | |
| Synonyms | CGB4|LSH-B|hLHB | |
| Cytomap | UCSC genome browser: 19q13.32 | |
| Genomic location | chr19 :49519236-49520347 | |
| Type of gene | protein-coding | |
| RefGenes | NM_000894.2, | |
| Ensembl id | ENSG00000104826 | |
| Description | LSH-betainterstitial cell stimulating hormone, beta chainluteinizing hormone beta subunitlutropin beta chainlutropin subunit beta | |
| Modification date | 20141207 | |
| dbXrefs | MIM : 152780 | |
| HGNC : HGNC | ||
| Ensembl : ENSG00000104826 | ||
| HPRD : 01072 | ||
| Vega : OTTHUMG00000183334 | ||
| Protein | UniProt: go to UniProt's Cross Reference DB Table | |
| Expression | CleanEX: HS_LHB | |
| BioGPS: 3972 | ||
| Gene Expression Atlas: ENSG00000104826 | ||
| The Human Protein Atlas: ENSG00000104826 | ||
| Pathway | NCI Pathway Interaction Database: LHB | |
| KEGG: LHB | ||
| REACTOME: LHB | ||
| ConsensusPathDB | ||
| Pathway Commons: LHB | ||
| Metabolism | MetaCyc: LHB | |
| HUMANCyc: LHB | ||
| Regulation | Ensembl's Regulation: ENSG00000104826 | |
| miRBase: chr19 :49,519,236-49,520,347 | ||
| TargetScan: NM_000894 | ||
| cisRED: ENSG00000104826 | ||
| Context | iHOP: LHB | |
| cancer metabolism search in PubMed: LHB | ||
| UCL Cancer Institute: LHB | ||
| Assigned class in ccmGDB | C | |
| Top |
| Phenotypic Information for LHB(metabolism pathway, cancer, disease, phenome) |
| Cancer | CGAP: LHB |
| Familial Cancer Database: LHB | |
| * This gene is included in those cancer gene databases. |
|
|
|
|
|
|
| ||||||||||||||
Oncogene 1 | Significant driver gene in | |||||||||||||||||||
| cf) number; DB name 1 Oncogene; http://nar.oxfordjournals.org/content/35/suppl_1/D721.long, 2 Tumor Suppressor gene; https://bioinfo.uth.edu/TSGene/, 3 Cancer Gene Census; http://www.nature.com/nrc/journal/v4/n3/abs/nrc1299.html, 4 CancerGenes; http://nar.oxfordjournals.org/content/35/suppl_1/D721.long, 5 Network of Cancer Gene; http://ncg.kcl.ac.uk/index.php, 1Therapeutic Vulnerabilities in Cancer; http://cbio.mskcc.org/cancergenomics/statius/ |
| REACTOME_METABOLISM_OF_STEROID_HORMONES_AND_VITAMINS_A_AND_D REACTOME_METABOLISM_OF_AMINO_ACIDS_AND_DERIVATIVES REACTOME_METABOLISM_OF_LIPIDS_AND_LIPOPROTEINS | |
| OMIM | |
| Orphanet | |
| Disease | KEGG Disease: LHB |
| MedGen: LHB (Human Medical Genetics with Condition) | |
| ClinVar: LHB | |
| Phenotype | MGI: LHB (International Mouse Phenotyping Consortium) |
| PhenomicDB: LHB | |
| Mutations for LHB |
| * Under tables are showing count per each tissue to give us broad intuition about tissue specific mutation patterns.You can go to the detailed page for each mutation database's web site. |
| There's no structural variation information in COSMIC data for this gene. |
| * From mRNA Sanger sequences, Chitars2.0 arranged chimeric transcripts. This table shows LHB related fusion information. |
| ID | Head Gene | Tail Gene | Accession | Gene_a | qStart_a | qEnd_a | Chromosome_a | tStart_a | tEnd_a | Gene_a | qStart_a | qEnd_a | Chromosome_a | tStart_a | tEnd_a |
| Top |
| There's no copy number variation information in COSMIC data for this gene. |
| Top |
|
 |
| Top |
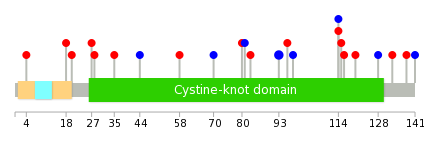
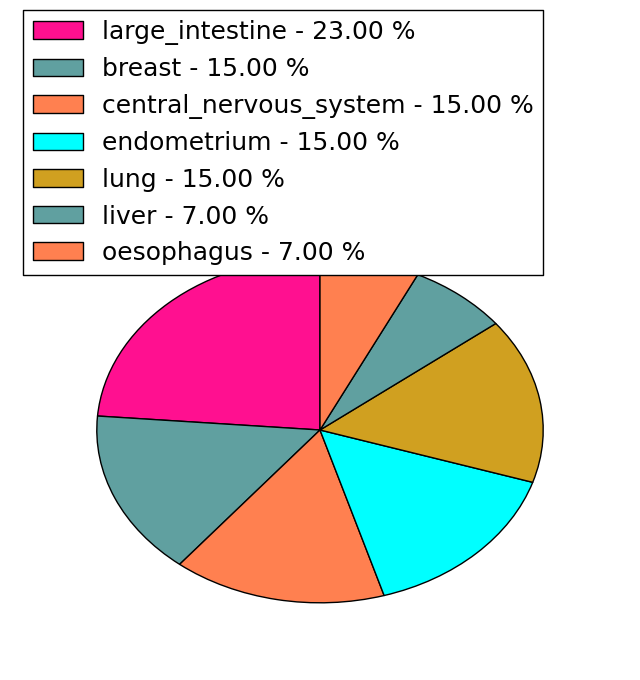
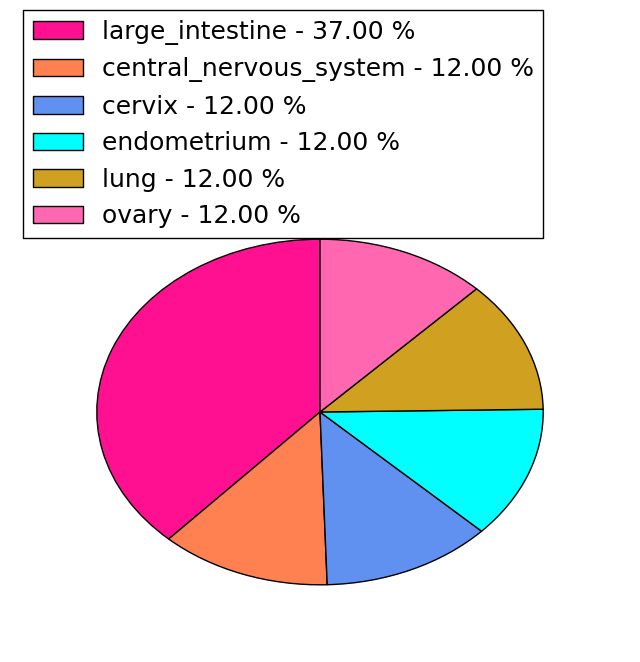
| Stat. for Non-Synonymous SNVs (# total SNVs=13) | (# total SNVs=8) |
 |  |
(# total SNVs=0) | (# total SNVs=0) |
| Top |
| * When you move the cursor on each content, you can see more deailed mutation information on the Tooltip. Those are primary_site,primary_histology,mutation(aa),pubmedID. |
| GRCh37 position | Mutation(aa) | Unique sampleID count |
| chr19:49519472-49519472 | p.P93P | 2 |
| chr19:49519407-49519407 | p.R115H | 1 |
| chr19:49519855-49519855 | p.P44P | 1 |
| chr19:49519409-49519409 | p.R114R | 1 |
| chr19:49519883-49519883 | p.I35T | 1 |
| chr19:49519410-49519410 | p.R114H | 1 |
| chr19:49519905-49519905 | p.W28R | 1 |
| chr19:49519457-49519457 | p.P98P | 1 |
| chr19:49519908-49519908 | p.P27A | 1 |
| chr19:49519465-49519465 | p.V96M | 1 |
| Top |
|
 |
| Point Mutation/ Tissue ID | 1 | 2 | 3 | 4 | 5 | 6 | 7 | 8 | 9 | 10 | 11 | 12 | 13 | 14 | 15 | 16 | 17 | 18 | 19 | 20 |
| # sample | 1 | 5 | 1 | 1 | 2 | 1 | 1 | 1 | 3 | |||||||||||
| # mutation | 1 | 5 | 1 | 1 | 2 | 2 | 1 | 1 | 3 | |||||||||||
| nonsynonymous SNV | 3 | 1 | 1 | 1 | 1 | 2 | ||||||||||||||
| synonymous SNV | 1 | 2 | 1 | 1 | 1 | 1 | 1 |
| cf) Tissue ID; Tissue type (1; BLCA[Bladder Urothelial Carcinoma], 2; BRCA[Breast invasive carcinoma], 3; CESC[Cervical squamous cell carcinoma and endocervical adenocarcinoma], 4; COAD[Colon adenocarcinoma], 5; GBM[Glioblastoma multiforme], 6; Glioma Low Grade, 7; HNSC[Head and Neck squamous cell carcinoma], 8; KICH[Kidney Chromophobe], 9; KIRC[Kidney renal clear cell carcinoma], 10; KIRP[Kidney renal papillary cell carcinoma], 11; LAML[Acute Myeloid Leukemia], 12; LUAD[Lung adenocarcinoma], 13; LUSC[Lung squamous cell carcinoma], 14; OV[Ovarian serous cystadenocarcinoma ], 15; PAAD[Pancreatic adenocarcinoma], 16; PRAD[Prostate adenocarcinoma], 17; SKCM[Skin Cutaneous Melanoma], 18:STAD[Stomach adenocarcinoma], 19:THCA[Thyroid carcinoma], 20:UCEC[Uterine Corpus Endometrial Carcinoma]) |
| Top |
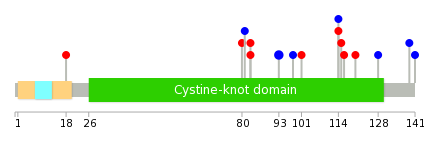
| * We represented just top 10 SNVs. When you move the cursor on each content, you can see more deailed mutation information on the Tooltip. Those are primary_site, primary_histology, mutation(aa), pubmedID. |
| Genomic Position | Mutation(aa) | Unique sampleID count |
| chr19:49519472 | p.P93P | 2 |
| chr19:49519409 | p.R83H | 1 |
| chr19:49519410 | p.R83C | 1 |
| chr19:49519449 | p.D81D | 1 |
| chr19:49519457 | p.R80H | 1 |
| chr19:49519328 | p.A18T | 1 |
| chr19:49519503 | p.L141L | 1 |
| chr19:49519334 | p.L139L | 1 |
| chr19:49519504 | p.L128L | 1 |
| chr19:49519367 | p.C120Y | 1 |
| * Copy number data were extracted from TCGA using R package TCGA-Assembler. The URLs of all public data files on TCGA DCC data server were gathered on Jan-05-2015. Function ProcessCNAData in TCGA-Assembler package was used to obtain gene-level copy number value which is calculated as the average copy number of the genomic region of a gene. |
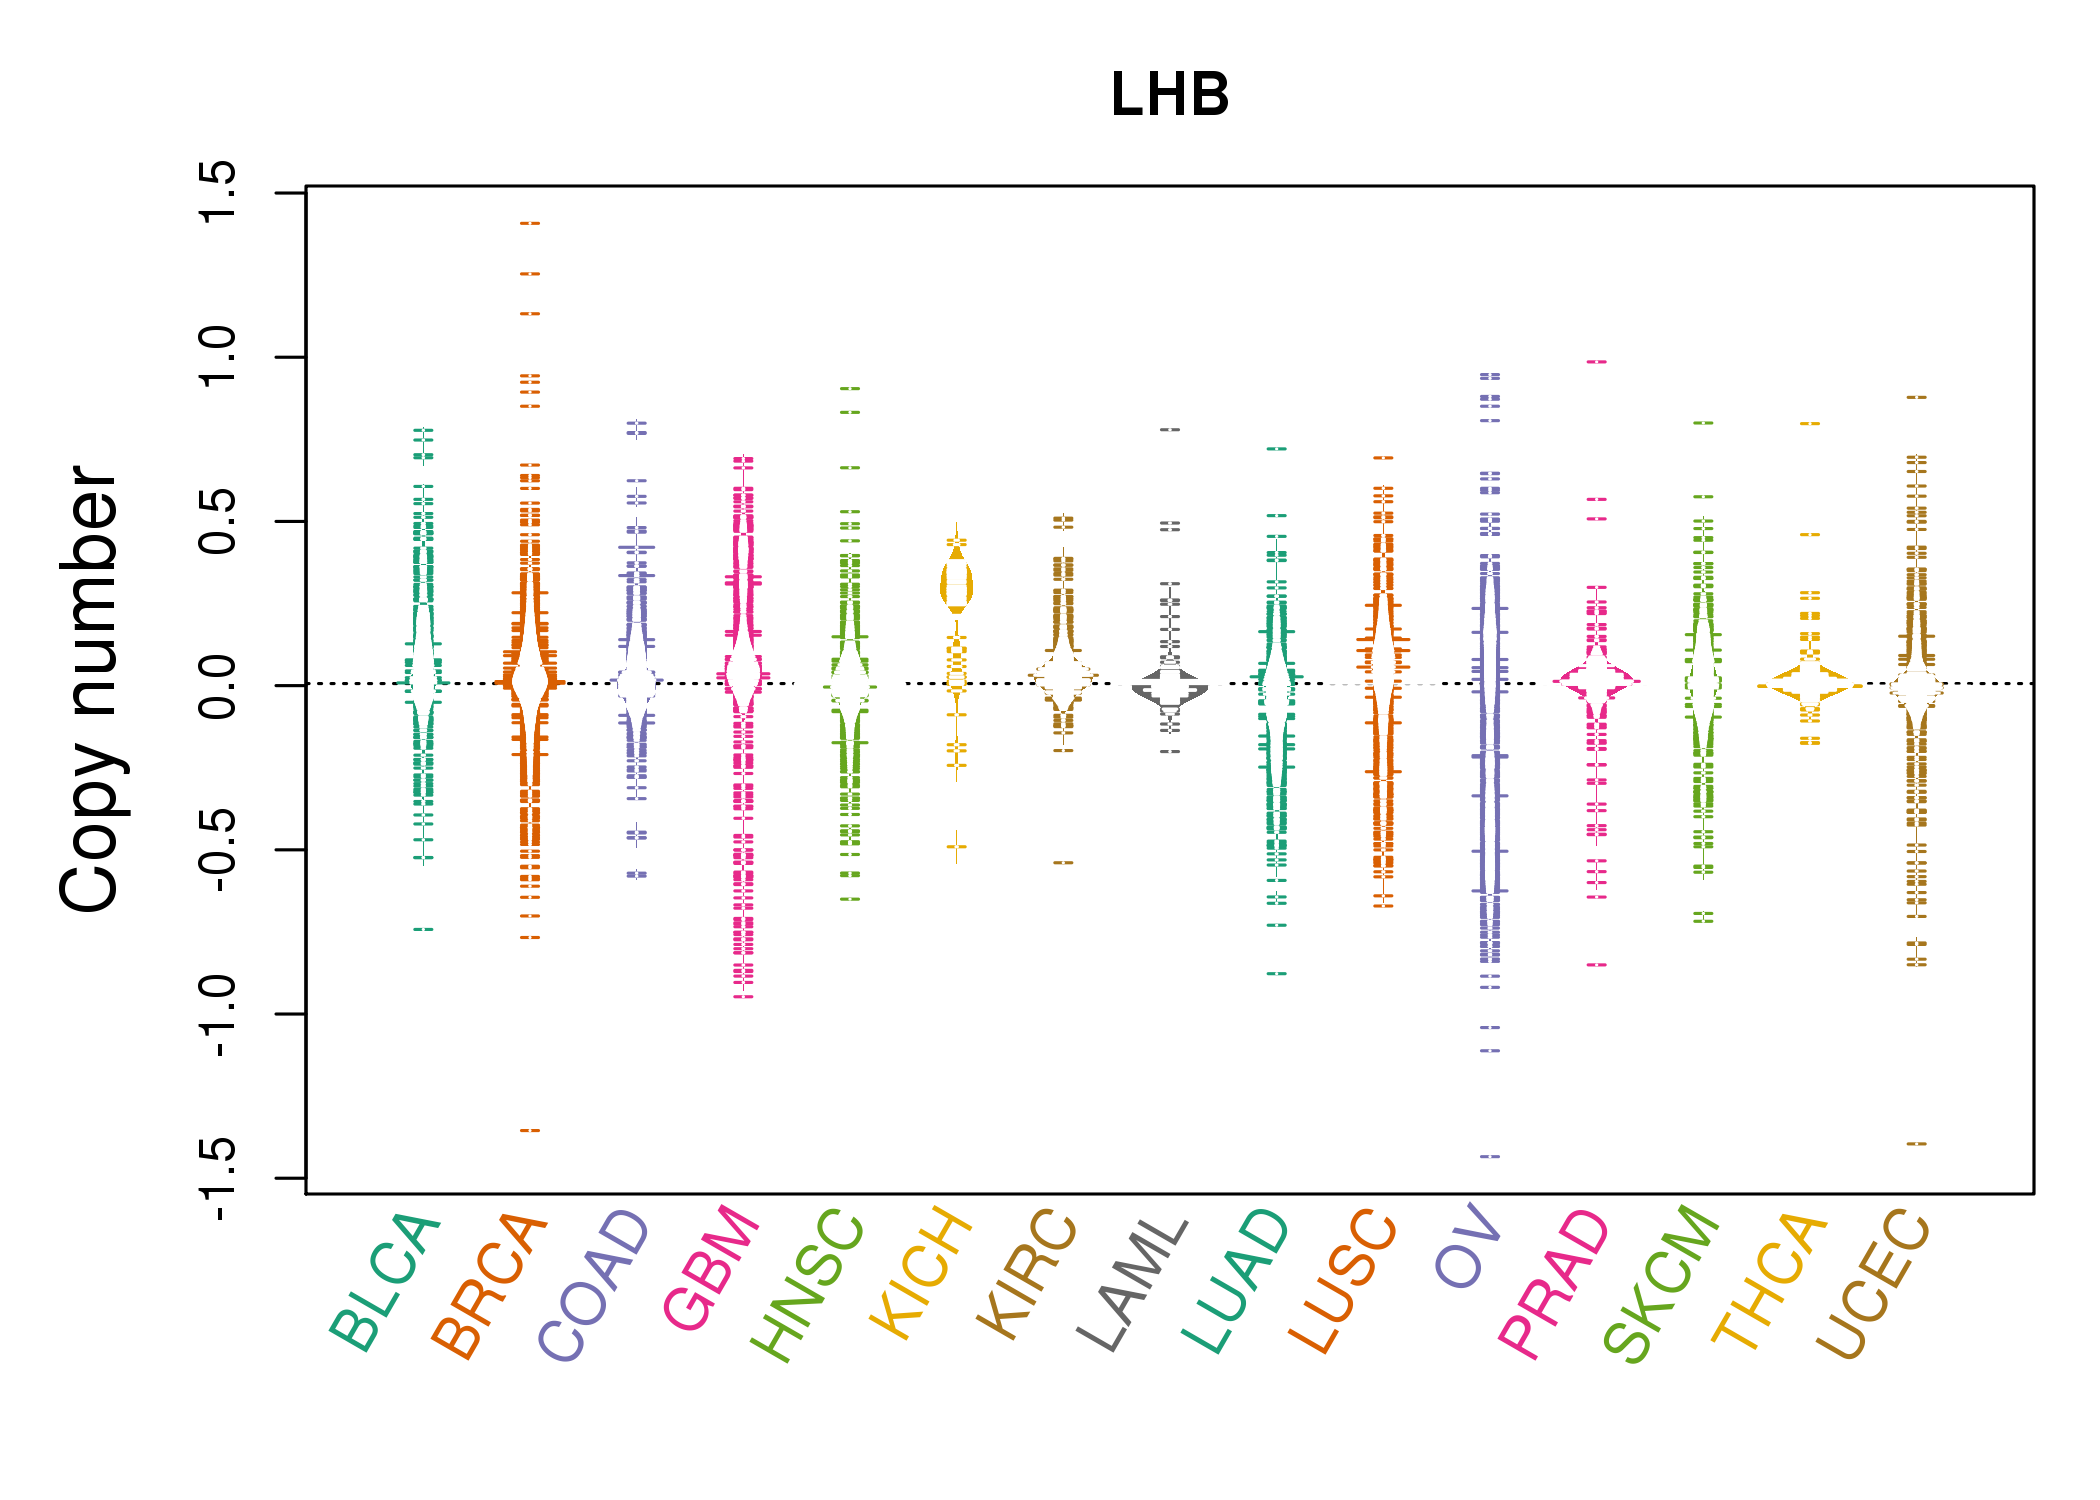 |
| cf) Tissue ID[Tissue type]: BLCA[Bladder Urothelial Carcinoma], BRCA[Breast invasive carcinoma], CESC[Cervical squamous cell carcinoma and endocervical adenocarcinoma], COAD[Colon adenocarcinoma], GBM[Glioblastoma multiforme], Glioma Low Grade, HNSC[Head and Neck squamous cell carcinoma], KICH[Kidney Chromophobe], KIRC[Kidney renal clear cell carcinoma], KIRP[Kidney renal papillary cell carcinoma], LAML[Acute Myeloid Leukemia], LUAD[Lung adenocarcinoma], LUSC[Lung squamous cell carcinoma], OV[Ovarian serous cystadenocarcinoma ], PAAD[Pancreatic adenocarcinoma], PRAD[Prostate adenocarcinoma], SKCM[Skin Cutaneous Melanoma], STAD[Stomach adenocarcinoma], THCA[Thyroid carcinoma], UCEC[Uterine Corpus Endometrial Carcinoma] |
| Top |
| Gene Expression for LHB |
| * CCLE gene expression data were extracted from CCLE_Expression_Entrez_2012-10-18.res: Gene-centric RMA-normalized mRNA expression data. |
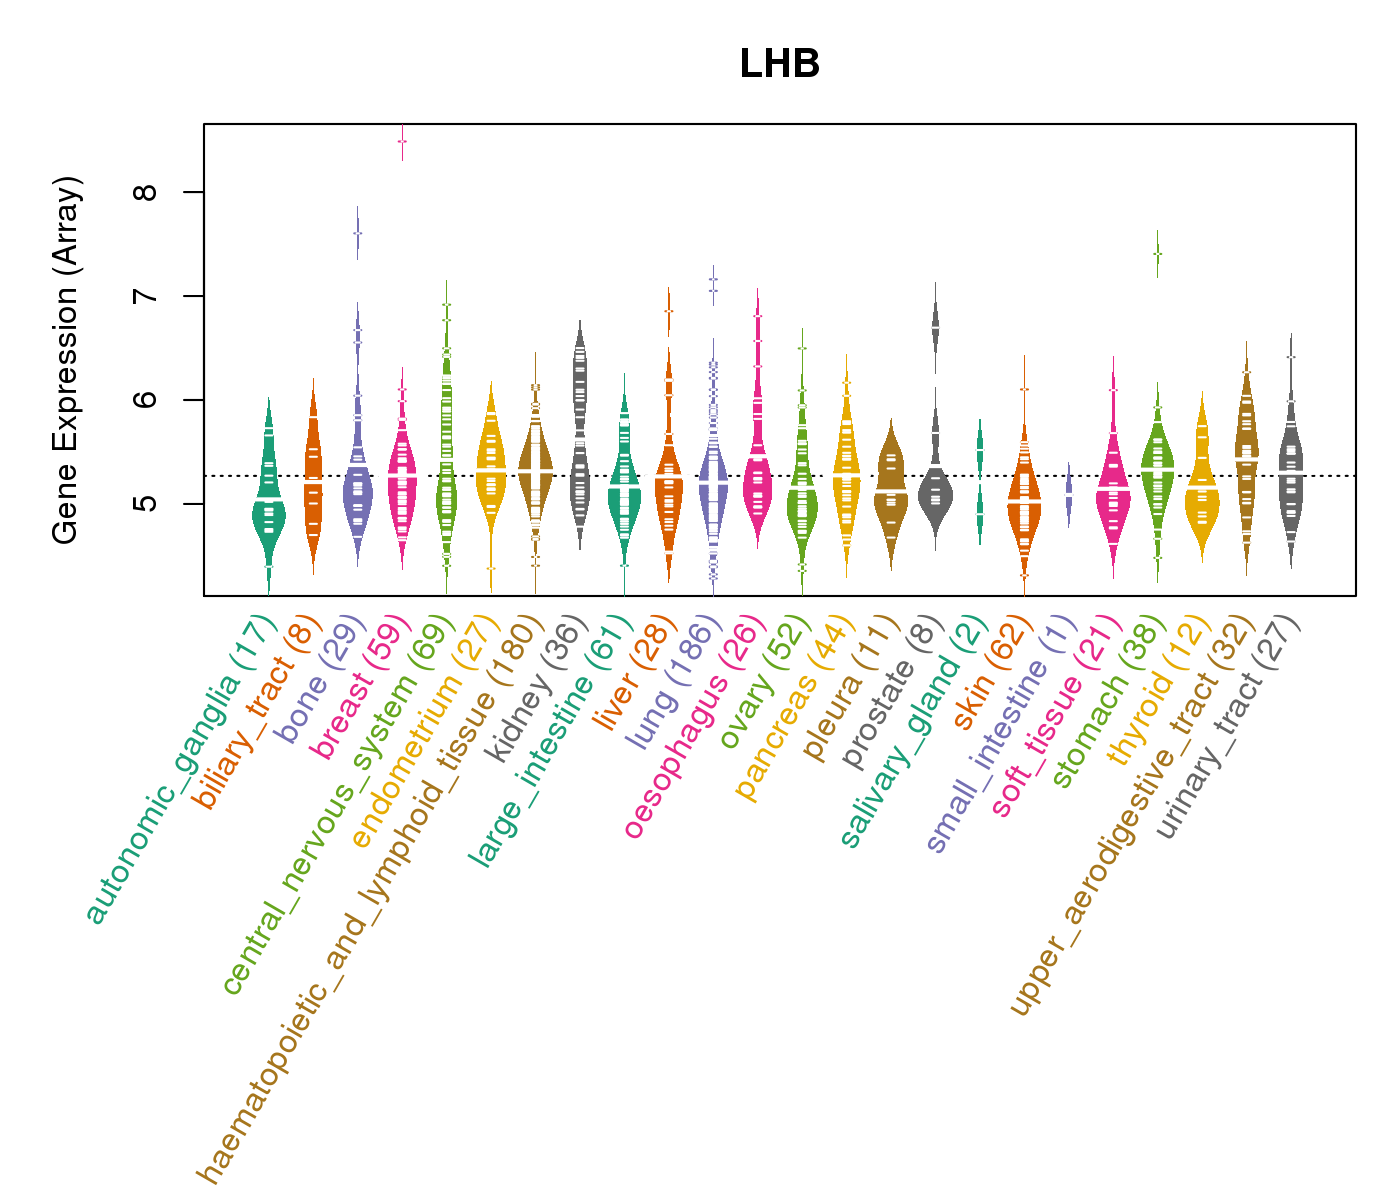 |
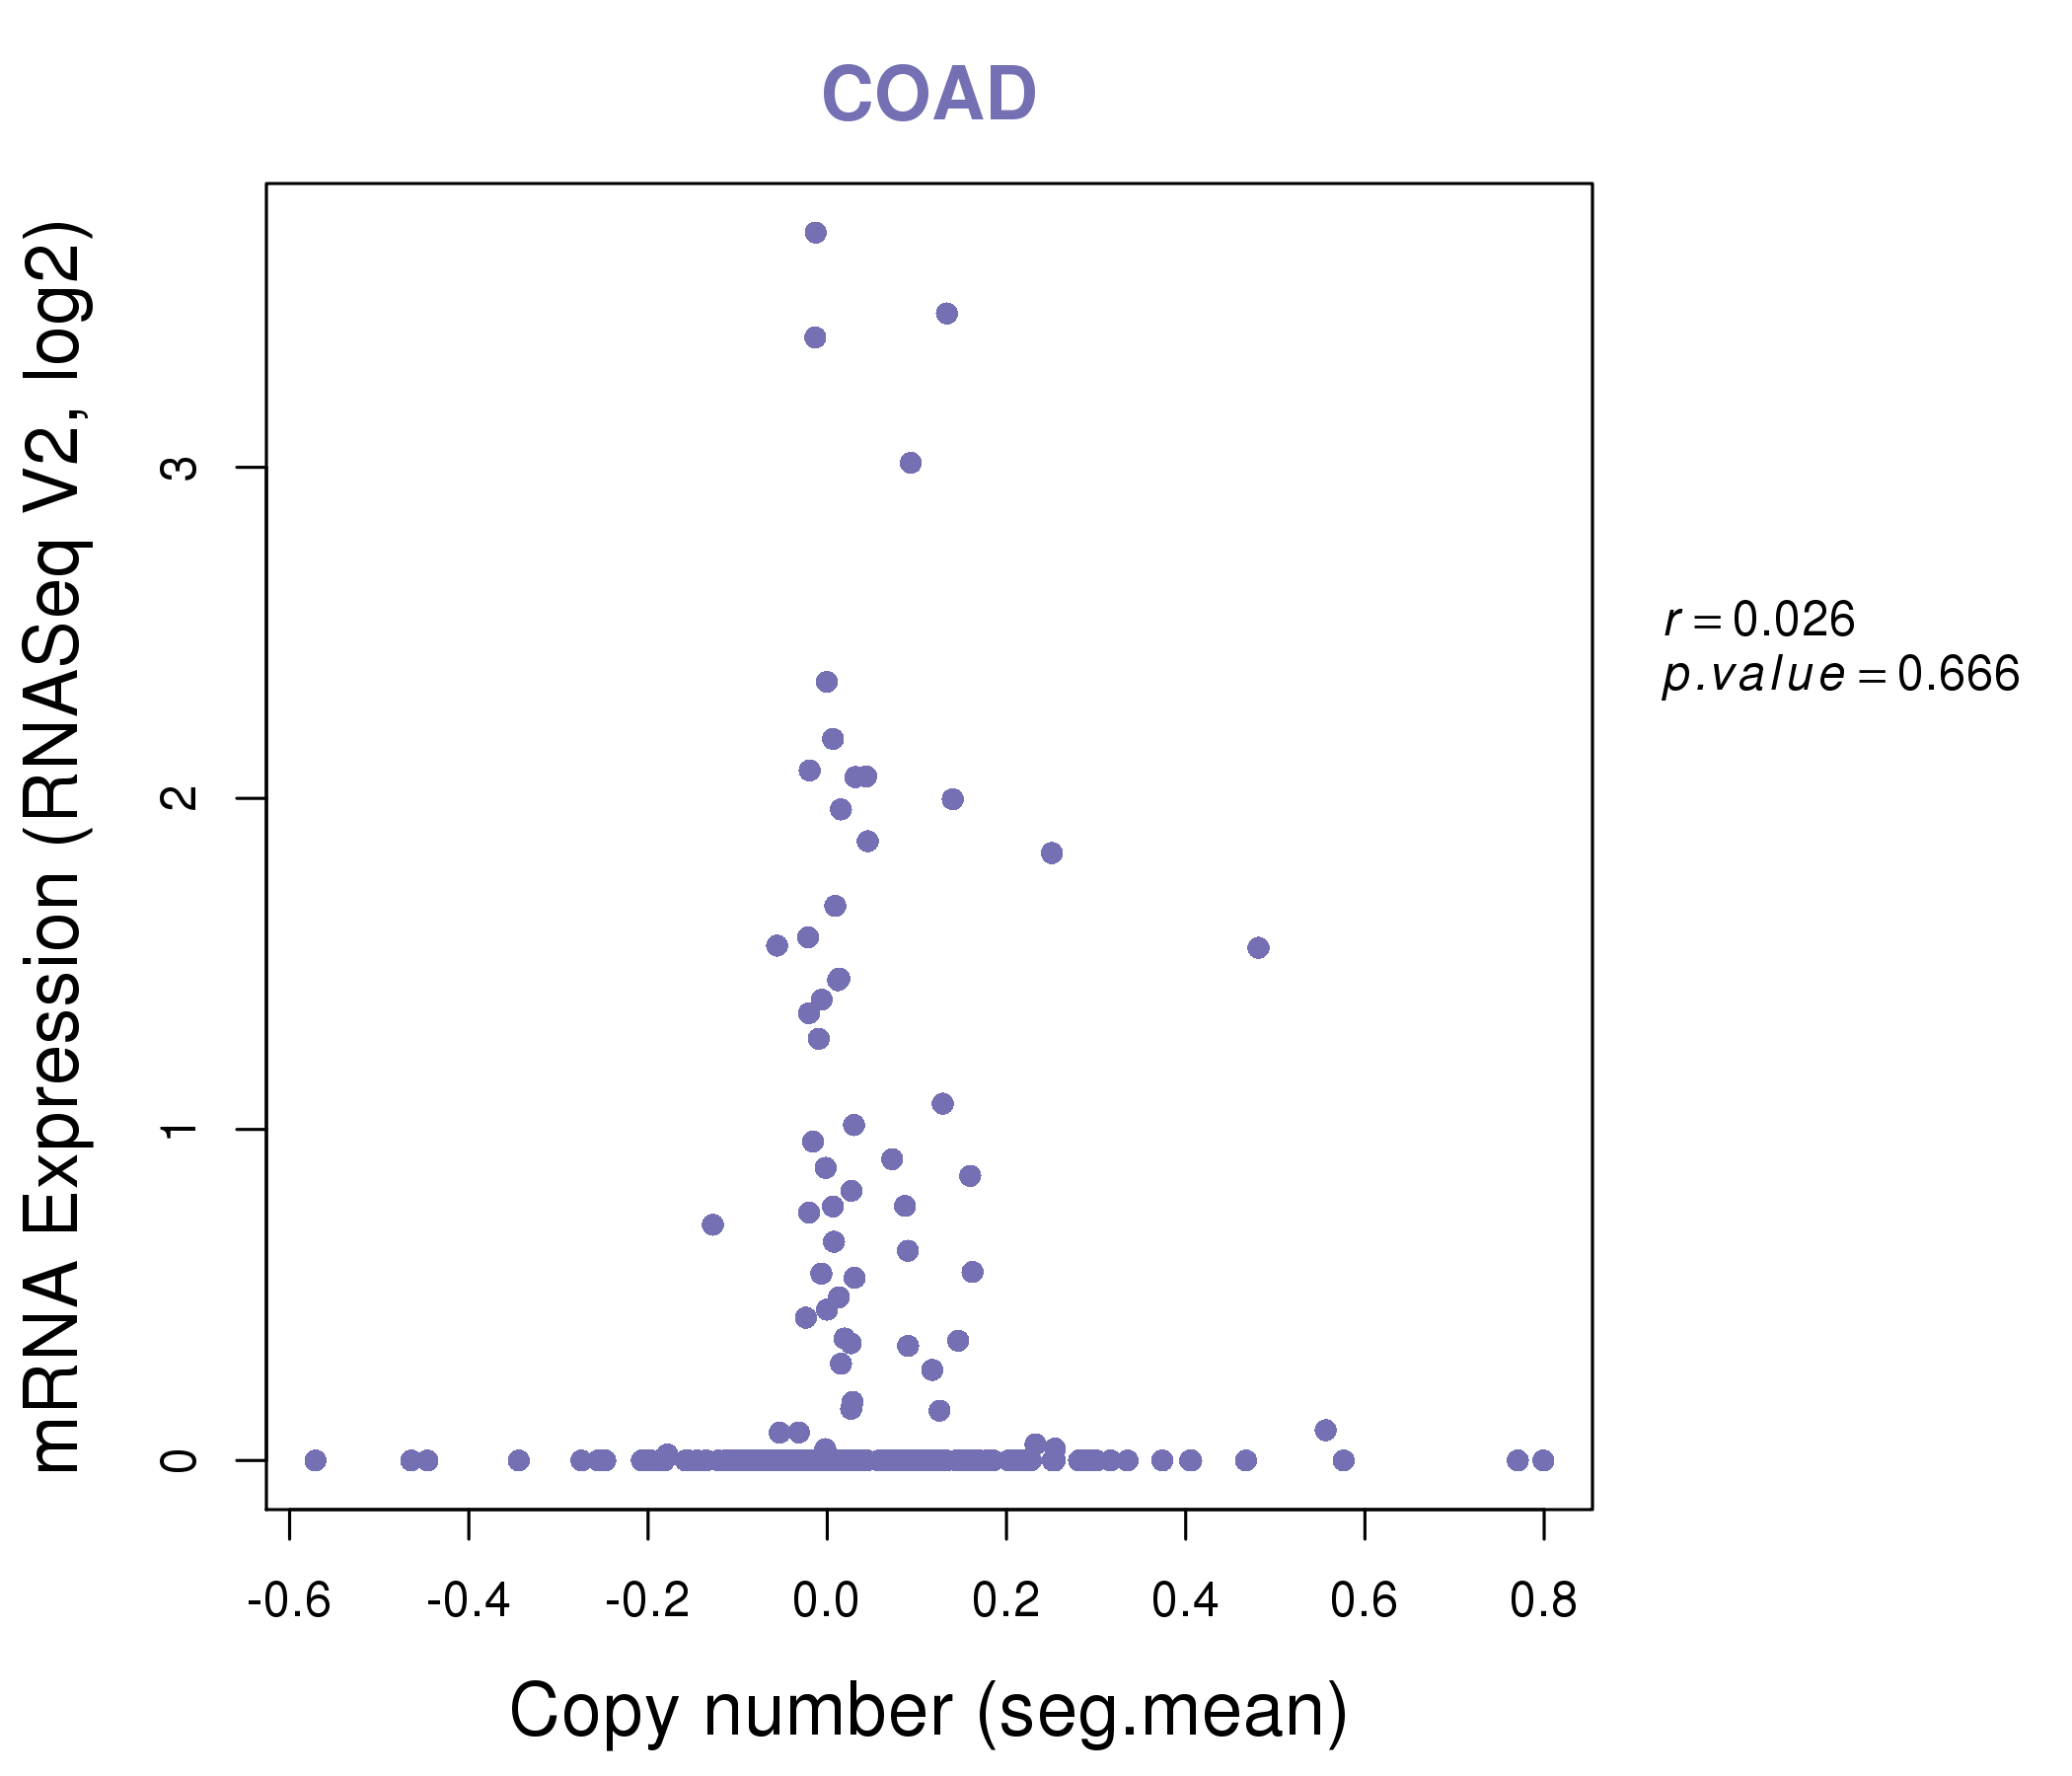
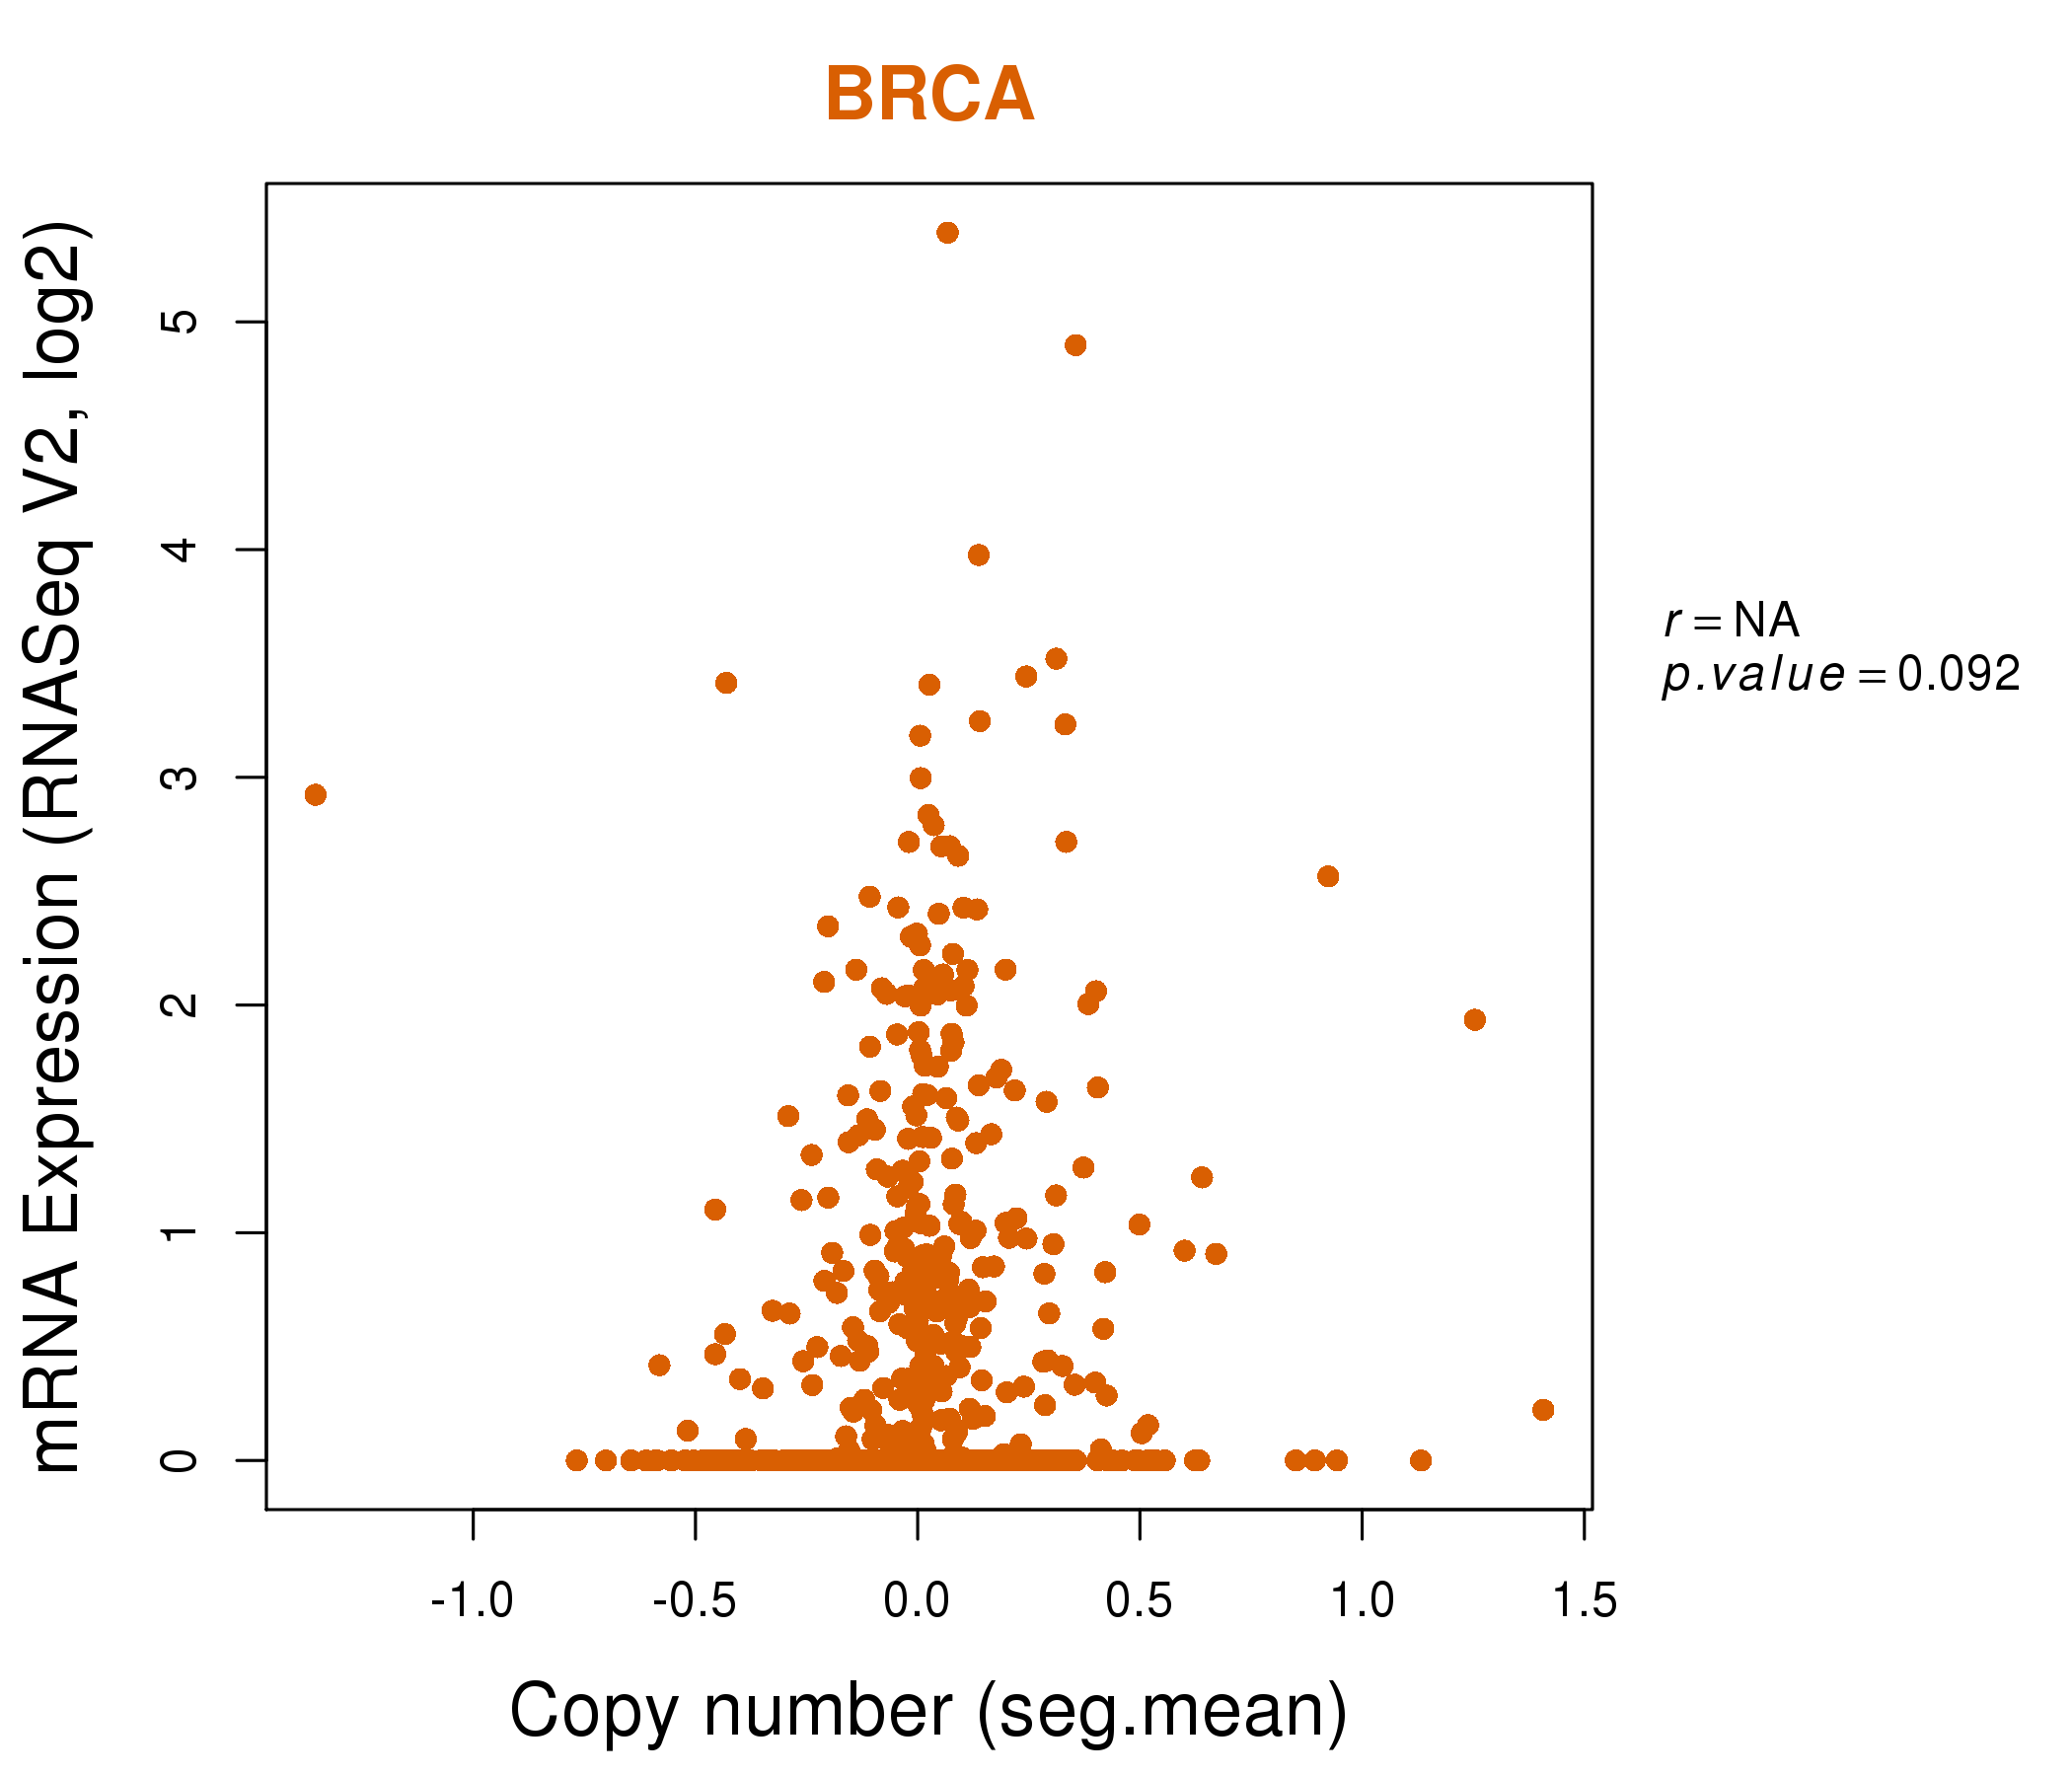
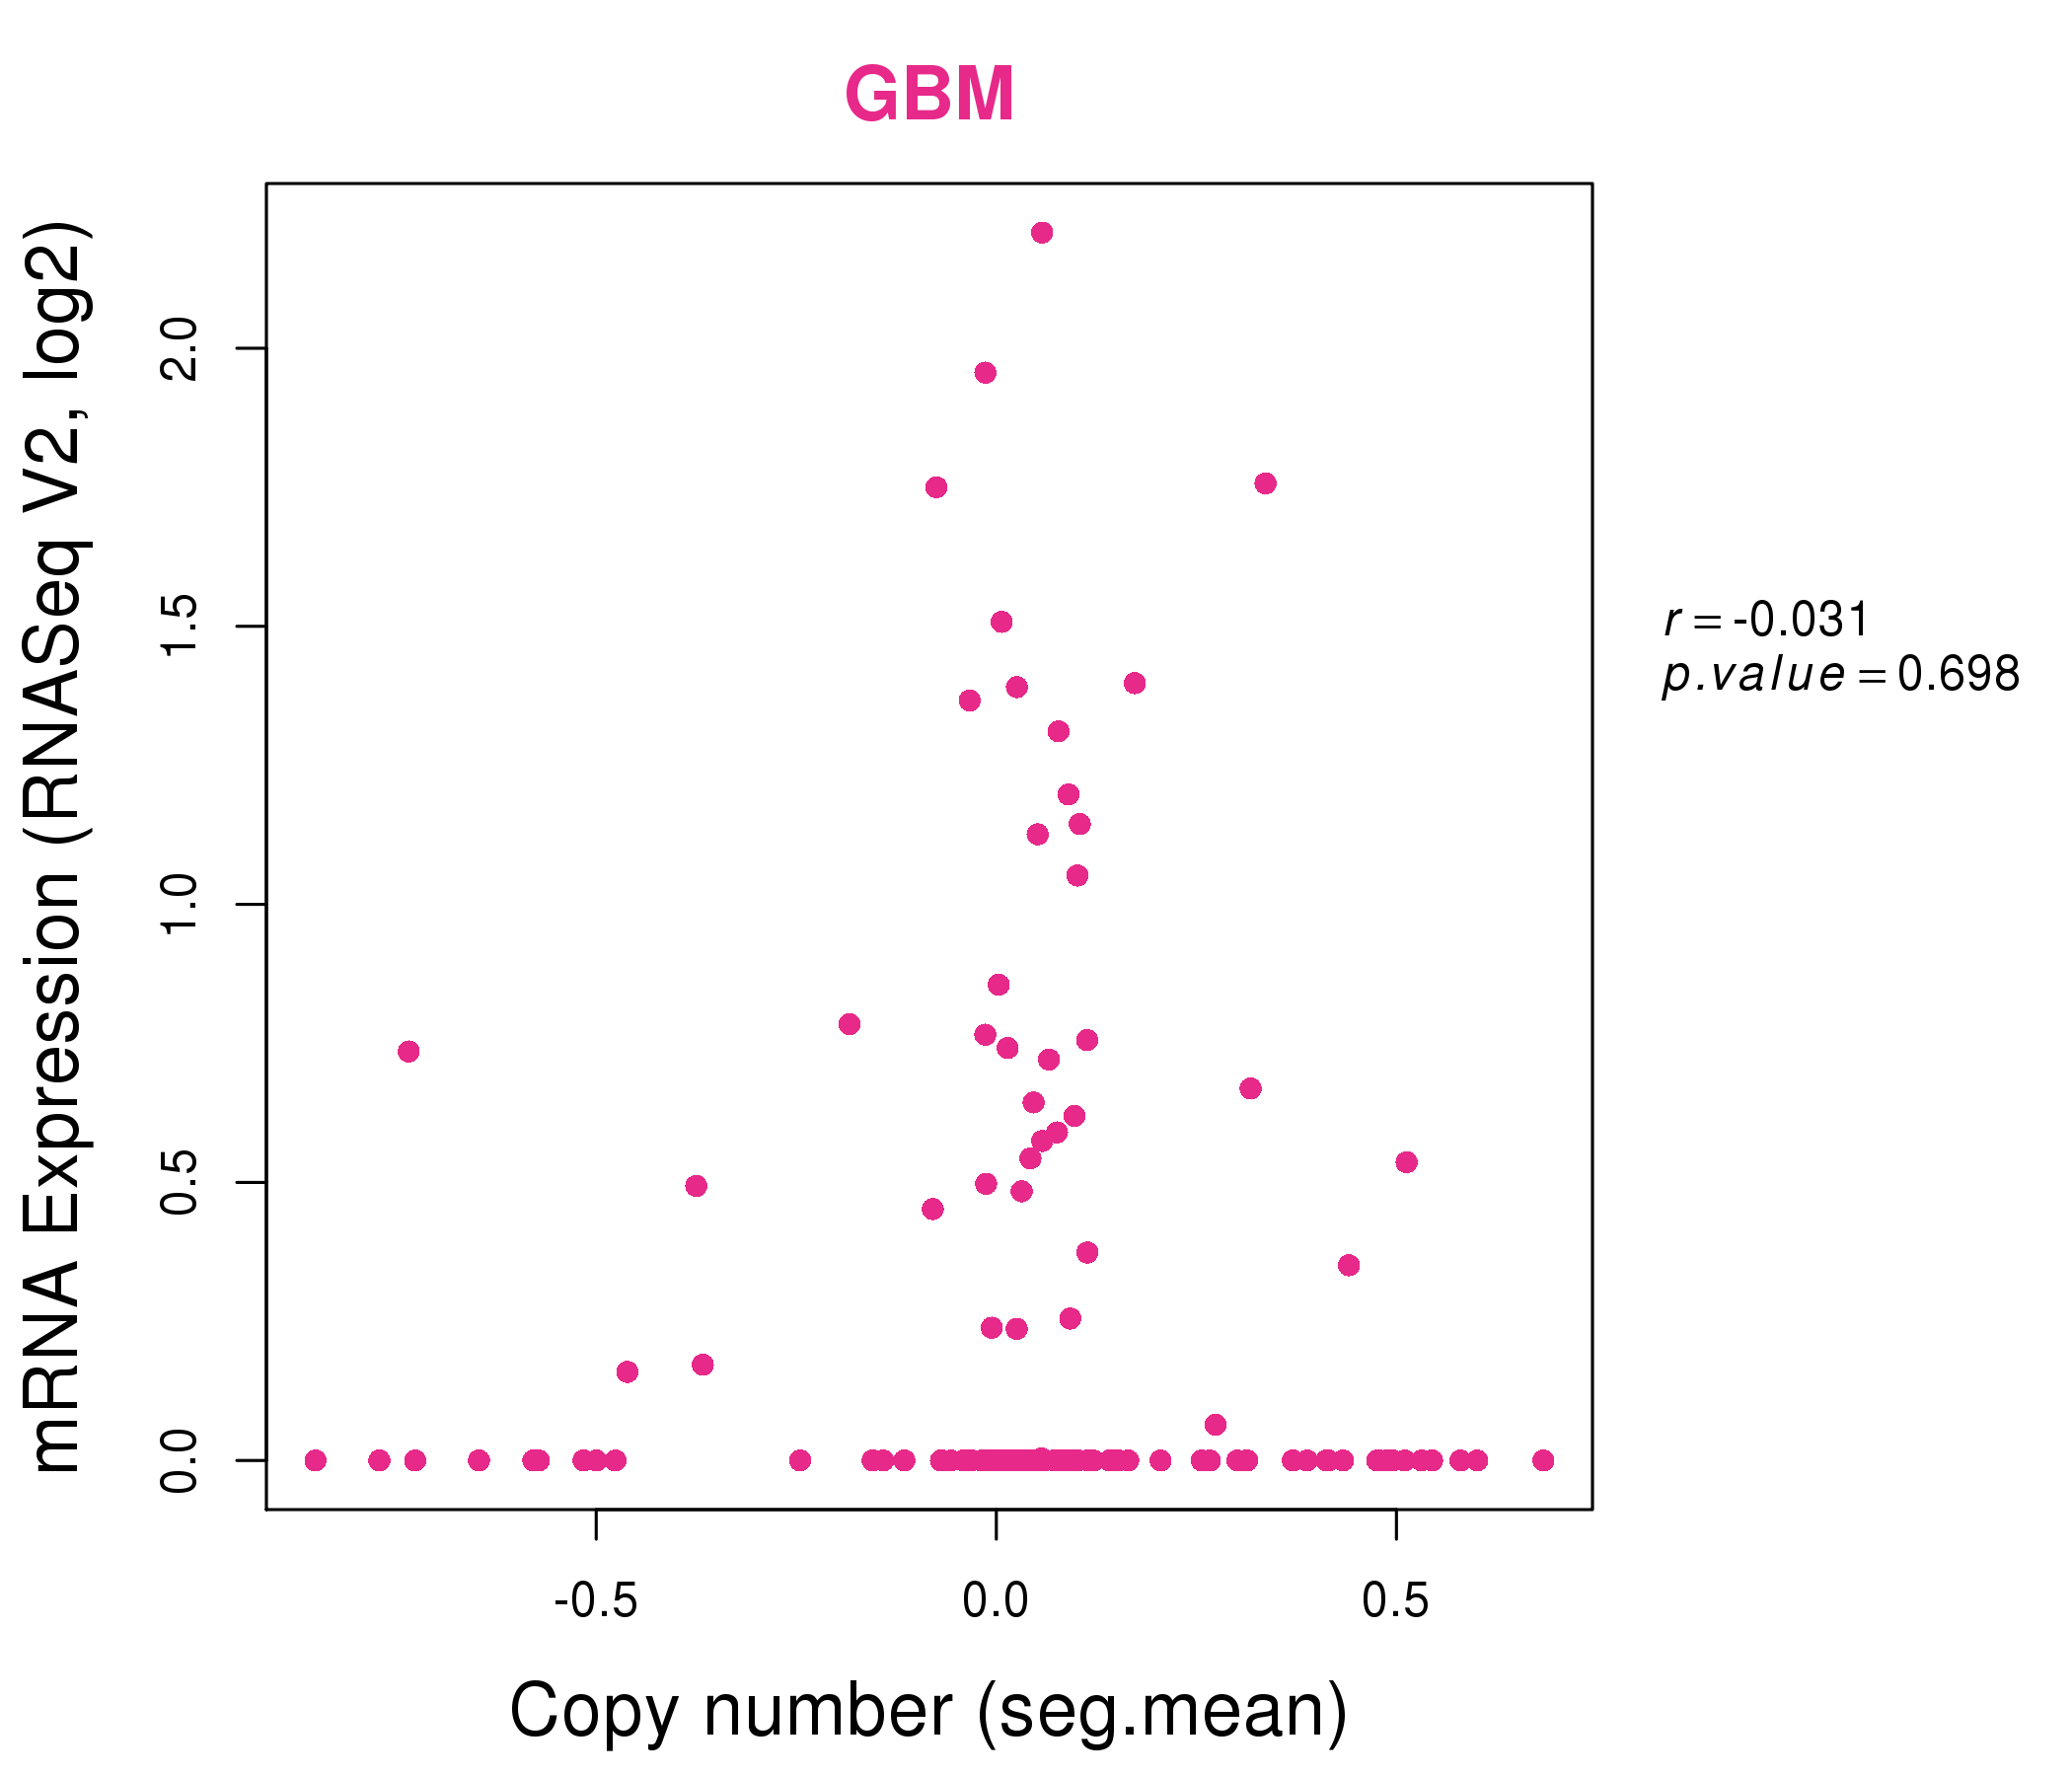
| * Normalized gene expression data of RNASeqV2 was extracted from TCGA using R package TCGA-Assembler. The URLs of all public data files on TCGA DCC data server were gathered at Jan-05-2015. Only eight cancer types have enough normal control samples for differential expression analysis. (t test, adjusted p<0.05 (using Benjamini-Hochberg FDR)) |
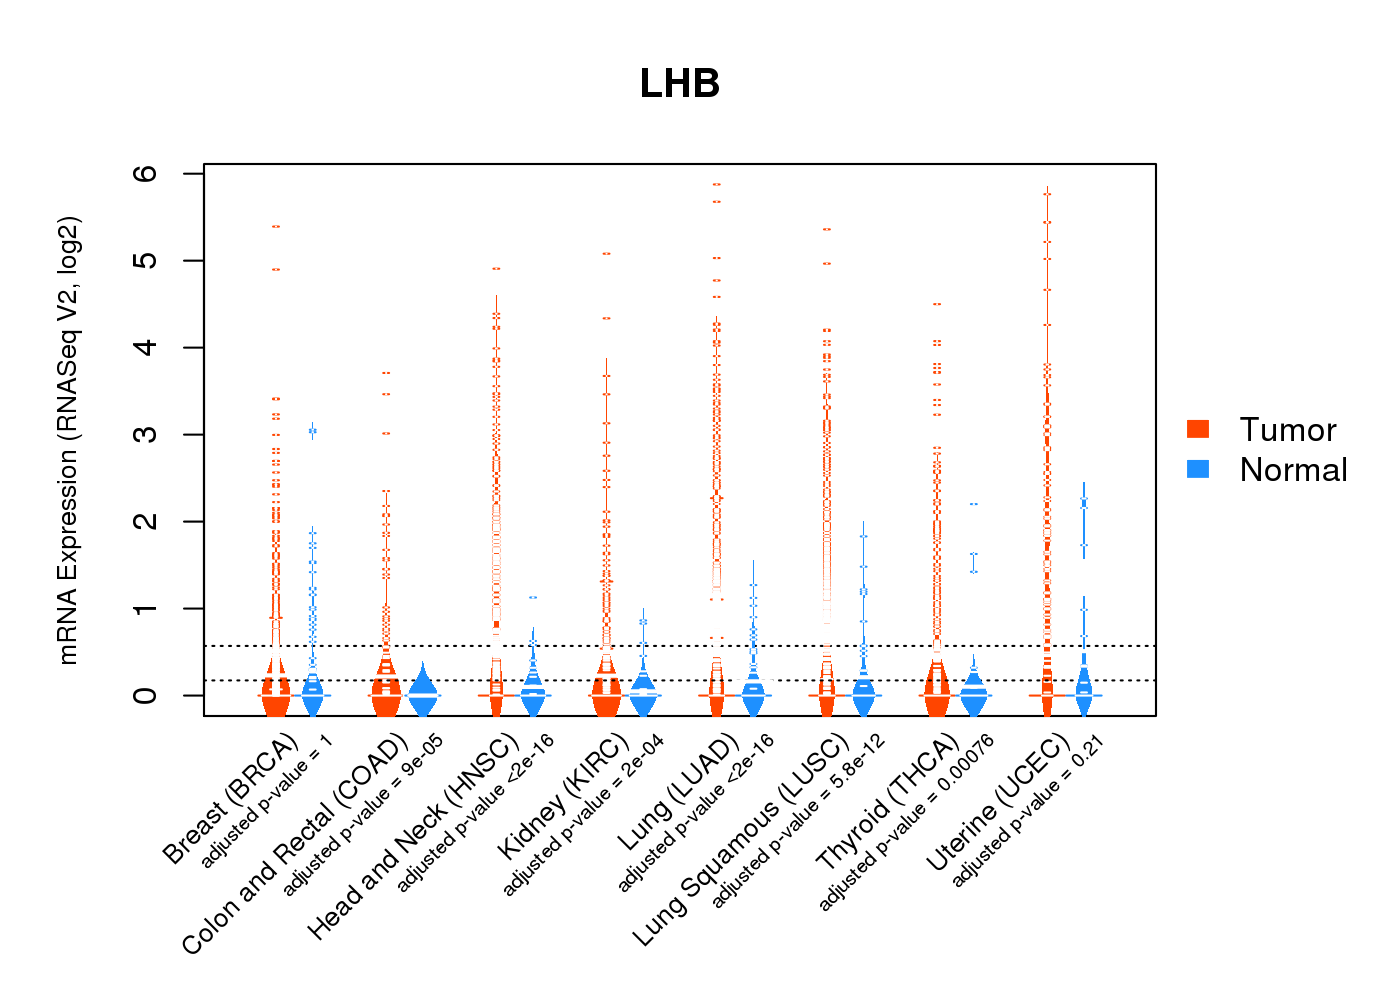 |
| Top |
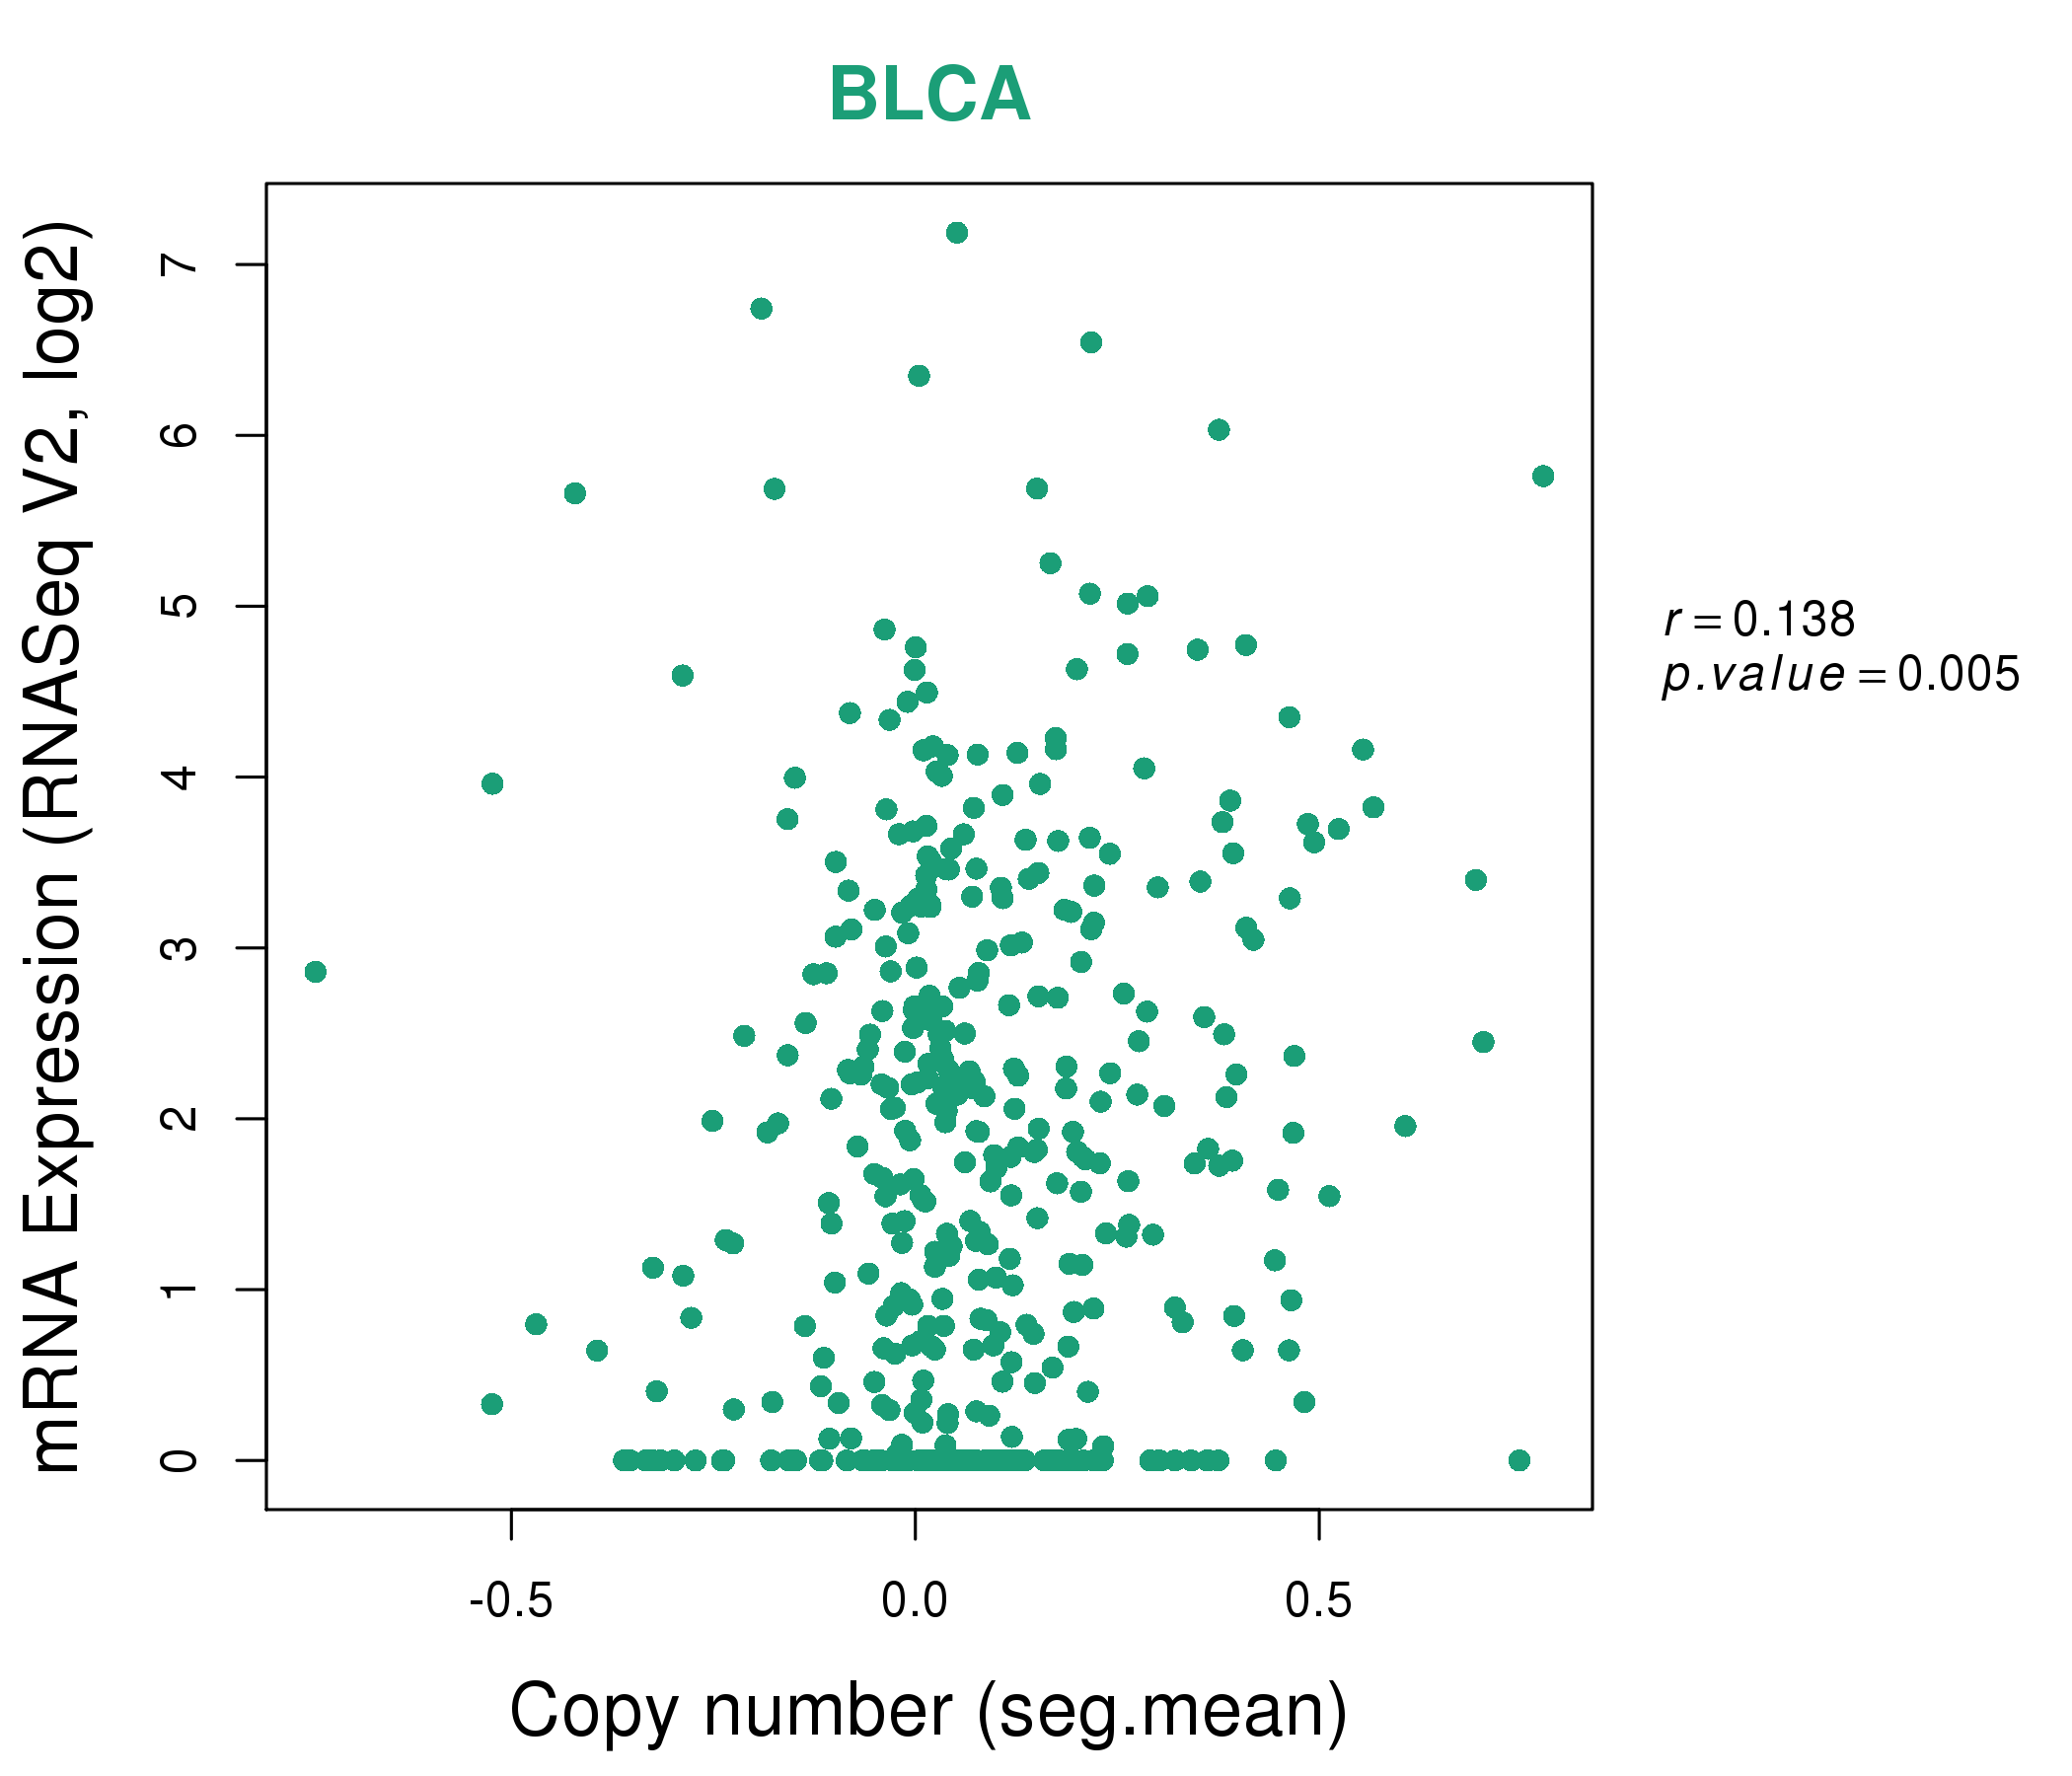
| * This plots show the correlation between CNV and gene expression. |
: Open all plots for all cancer types
 |
|
 |
|
| Top |
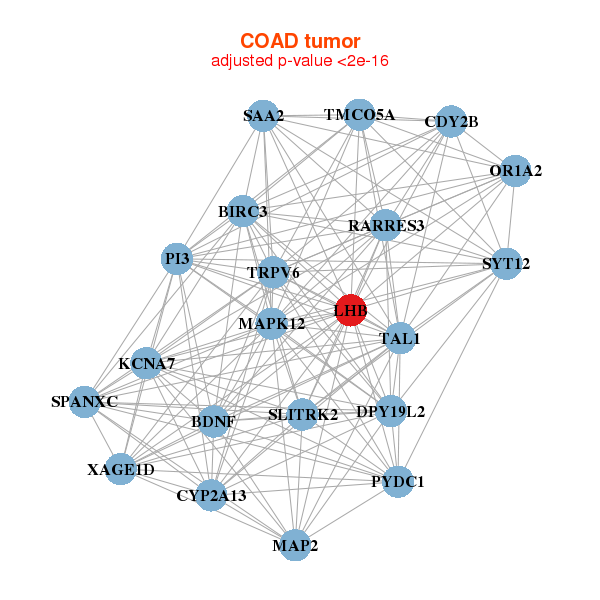
| Gene-Gene Network Information |
| * Co-Expression network figures were drawn using R package igraph. Only the top 20 genes with the highest correlations were shown. Red circle: input gene, orange circle: cell metabolism gene, sky circle: other gene |
: Open all plots for all cancer types
 |
|
| ALDH3A1,BCL2L10,CGB2,CRYBB2,GAGE12J,GAGE13,GAGE2B, GAGE2E,GAGE8,GPX2,HOXD11,IQCF2,LHB,LOC285629, OPALIN,PYY2,RBMXL2,UGT1A5,VCX,VCX3A,VCY | A1BG,ACD,BRICD5,PPP1R35,C9orf142,CCDC61,LHB, LOC100271831,MFSD10,PABPN1,PRR14,PRR22,INAFM1,QTRT1, RCE1,RNF25,TMEM61,TMEM86B,VAX2,ZFAND2B,ZNF444 |
 |
|
| BDNF,BIRC3,CDY2B,CYP2A13,DPY19L2,KCNA7,LHB, MAP2,MAPK12,OR1A2,PI3,PYDC1,RARRES3,SAA2, SLITRK2,SPANXC,SYT12,TAL1,TMCO5A,TRPV6,XAGE1D | AKR1C4,ASPDH,SMIM24,CD82,CLDN15,DAK,EMB, KCNH6,KHK,LHB,MIR31HG,LOC647121,MS4A10,MS4A15, MT1B,PDZK1,PLB1,PRODH,PRSS1,SLC34A2,SP8 |

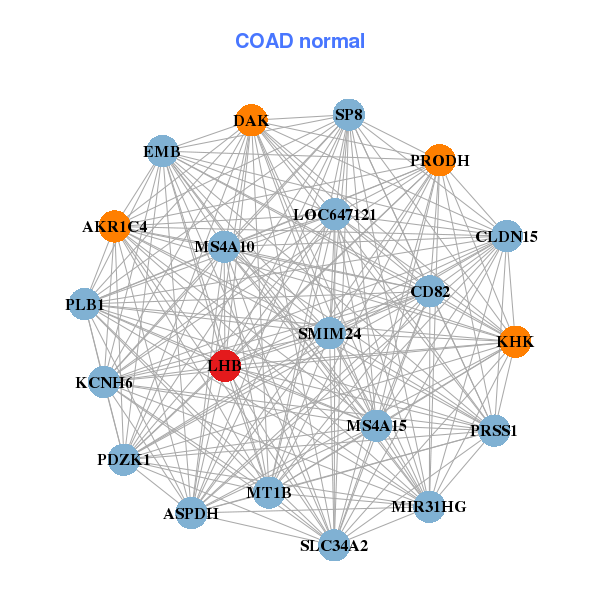
| * Co-Expression network figures were drawn using R package igraph. Only the top 20 genes with the highest correlations were shown. Red circle: input gene, orange circle: cell metabolism gene, sky circle: other gene |
: Open all plots for all cancer types
| Top |
: Open all interacting genes' information including KEGG pathway for all interacting genes from DAVID
| Top |
| Pharmacological Information for LHB |
| There's no related Drug. |
| Top |
| Cross referenced IDs for LHB |
| * We obtained these cross-references from Uniprot database. It covers 150 different DBs, 18 categories. http://www.uniprot.org/help/cross_references_section |
: Open all cross reference information
|
Copyright © 2016-Present - The Univsersity of Texas Health Science Center at Houston @ |