|
||||||||||||||||||||||||||||||||||||||||||||||||||||||||||||||||||||||||||||||||||||||||||||||||||||||||||||||||||||||||||||||||||||||||||||||||||||||||||||||||||||||||||||||||||||||||||||||||||||||||||||||||||||||||||||||||||||||||||||||||||||||||||||||||||||||||||||||||||||||||||||||||||||||||||||||||||||||||||
| |
| Phenotypic Information (metabolism pathway, cancer, disease, phenome) |
| |
| |
| Gene-Gene Network Information: Co-Expression Network, Interacting Genes & KEGG |
| |
|


| Gene Summary for LIPE |
| Basic gene info. | Gene symbol | LIPE |
| Gene name | lipase, hormone-sensitive | |
| Synonyms | AOMS4|HSL|LHS | |
| Cytomap | UCSC genome browser: 19q13.2 | |
| Genomic location | chr19 :42905665-42931578 | |
| Type of gene | protein-coding | |
| RefGenes | NM_005357.3, | |
| Ensembl id | ENSG00000079435 | |
| Description | hormone-sensitive lipasehormone-sensitive lipase testicular isoform | |
| Modification date | 20141207 | |
| dbXrefs | MIM : 151750 | |
| HGNC : HGNC | ||
| Ensembl : ENSG00000079435 | ||
| HPRD : 01062 | ||
| Vega : OTTHUMG00000182814 | ||
| Protein | UniProt: go to UniProt's Cross Reference DB Table | |
| Expression | CleanEX: HS_LIPE | |
| BioGPS: 3991 | ||
| Gene Expression Atlas: ENSG00000079435 | ||
| The Human Protein Atlas: ENSG00000079435 | ||
| Pathway | NCI Pathway Interaction Database: LIPE | |
| KEGG: LIPE | ||
| REACTOME: LIPE | ||
| ConsensusPathDB | ||
| Pathway Commons: LIPE | ||
| Metabolism | MetaCyc: LIPE | |
| HUMANCyc: LIPE | ||
| Regulation | Ensembl's Regulation: ENSG00000079435 | |
| miRBase: chr19 :42,905,665-42,931,578 | ||
| TargetScan: NM_005357 | ||
| cisRED: ENSG00000079435 | ||
| Context | iHOP: LIPE | |
| cancer metabolism search in PubMed: LIPE | ||
| UCL Cancer Institute: LIPE | ||
| Assigned class in ccmGDB | C | |
| Top |
| Phenotypic Information for LIPE(metabolism pathway, cancer, disease, phenome) |
| Cancer | CGAP: LIPE |
| Familial Cancer Database: LIPE | |
| * This gene is included in those cancer gene databases. |
|
|
|
|
|
|
| ||||||||||||||||||||||||||||||||||||||||||||||||||||||||||||||||||||||||||||||||||||||||||||||||||||||||||||||||||||||||||||||||||||||||||||||||||||||||||||||||||||||||||||||||||||||||||||||||||||||||||||||||||||||||||||||||||||||||||||||||||||||||||||||||||||||||||||||||||||||||||||||||||||||||||||||||||||
Oncogene 1 | Significant driver gene in | |||||||||||||||||||||||||||||||||||||||||||||||||||||||||||||||||||||||||||||||||||||||||||||||||||||||||||||||||||||||||||||||||||||||||||||||||||||||||||||||||||||||||||||||||||||||||||||||||||||||||||||||||||||||||||||||||||||||||||||||||||||||||||||||||||||||||||||||||||||||||||||||||||||||||||||||||||||||||
| cf) number; DB name 1 Oncogene; http://nar.oxfordjournals.org/content/35/suppl_1/D721.long, 2 Tumor Suppressor gene; https://bioinfo.uth.edu/TSGene/, 3 Cancer Gene Census; http://www.nature.com/nrc/journal/v4/n3/abs/nrc1299.html, 4 CancerGenes; http://nar.oxfordjournals.org/content/35/suppl_1/D721.long, 5 Network of Cancer Gene; http://ncg.kcl.ac.uk/index.php, 1Therapeutic Vulnerabilities in Cancer; http://cbio.mskcc.org/cancergenomics/statius/ |
| REACTOME_METABOLISM_OF_LIPIDS_AND_LIPOPROTEINS | |
| OMIM | |
| Orphanet | |
| Disease | KEGG Disease: LIPE |
| MedGen: LIPE (Human Medical Genetics with Condition) | |
| ClinVar: LIPE | |
| Phenotype | MGI: LIPE (International Mouse Phenotyping Consortium) |
| PhenomicDB: LIPE | |
| Mutations for LIPE |
| * Under tables are showing count per each tissue to give us broad intuition about tissue specific mutation patterns.You can go to the detailed page for each mutation database's web site. |
| There's no structural variation information in COSMIC data for this gene. |
| * From mRNA Sanger sequences, Chitars2.0 arranged chimeric transcripts. This table shows LIPE related fusion information. |
| ID | Head Gene | Tail Gene | Accession | Gene_a | qStart_a | qEnd_a | Chromosome_a | tStart_a | tEnd_a | Gene_a | qStart_a | qEnd_a | Chromosome_a | tStart_a | tEnd_a |
| Top |
| Mutation type/ Tissue ID | brca | cns | cerv | endome | haematopo | kidn | Lintest | liver | lung | ns | ovary | pancre | prost | skin | stoma | thyro | urina | |||
| Total # sample | 1 | |||||||||||||||||||
| GAIN (# sample) | 1 | |||||||||||||||||||
| LOSS (# sample) |
| cf) Tissue ID; Tissue type (1; Breast, 2; Central_nervous_system, 3; Cervix, 4; Endometrium, 5; Haematopoietic_and_lymphoid_tissue, 6; Kidney, 7; Large_intestine, 8; Liver, 9; Lung, 10; NS, 11; Ovary, 12; Pancreas, 13; Prostate, 14; Skin, 15; Stomach, 16; Thyroid, 17; Urinary_tract) |
| Top |
|
 |
| Top |
| Stat. for Non-Synonymous SNVs (# total SNVs=59) | (# total SNVs=28) |
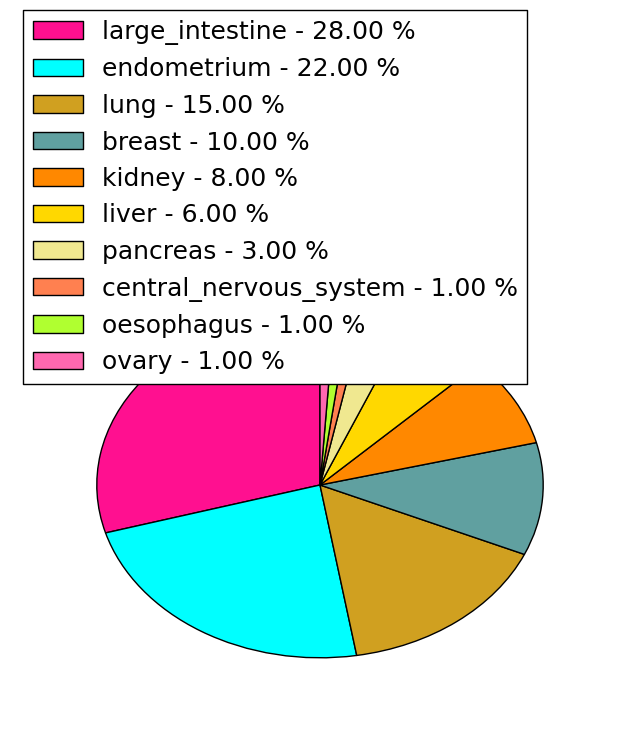 | 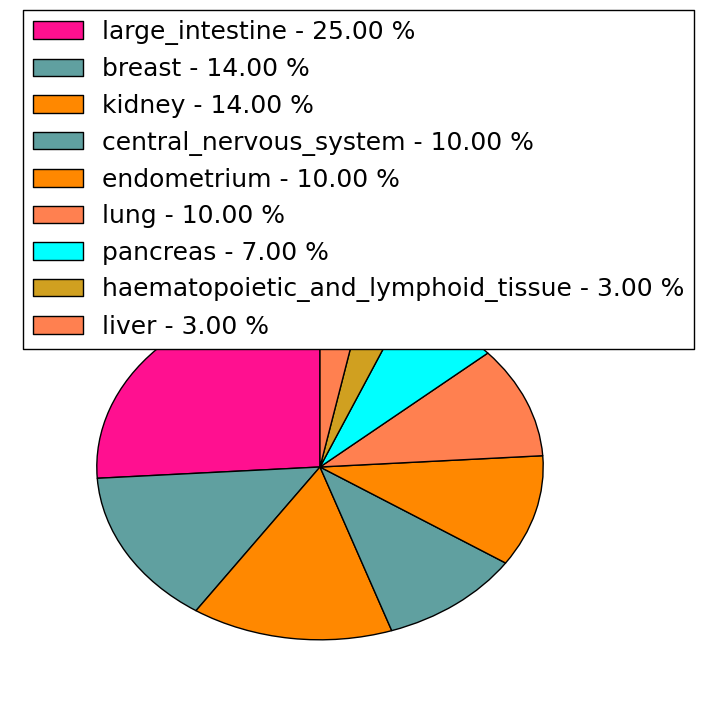 |
(# total SNVs=0) | (# total SNVs=0) |
| Top |
| * When you move the cursor on each content, you can see more deailed mutation information on the Tooltip. Those are primary_site,primary_histology,mutation(aa),pubmedID. |
| GRCh37 position | Mutation(aa) | Unique sampleID count |
| chr19:42930864-42930864 | p.P146P | 3 |
| chr19:42912472-42912472 | p.F474F | 2 |
| chr19:42911525-42911525 | p.L646L | 2 |
| chr19:42930938-42930938 | p.E122Q | 2 |
| chr19:42930801-42930801 | p.R167R | 2 |
| chr19:42911557-42911557 | p.R636C | 2 |
| chr19:42930863-42930863 | p.P147S | 2 |
| chr19:42930623-42930623 | p.E227Q | 2 |
| chr19:42914668-42914668 | p.R404C | 2 |
| chr19:42930894-42930894 | p.V136V | 2 |
| Top |
|
 |
| Point Mutation/ Tissue ID | 1 | 2 | 3 | 4 | 5 | 6 | 7 | 8 | 9 | 10 | 11 | 12 | 13 | 14 | 15 | 16 | 17 | 18 | 19 | 20 |
| # sample | 5 | 5 | 15 | 1 | 4 | 8 | 2 | 5 | 3 | 1 | 13 | 7 | 1 | 13 | ||||||
| # mutation | 4 | 4 | 13 | 1 | 4 | 8 | 2 | 5 | 3 | 1 | 12 | 7 | 1 | 16 | ||||||
| nonsynonymous SNV | 3 | 3 | 9 | 3 | 4 | 1 | 4 | 1 | 1 | 7 | 5 | 1 | 13 | |||||||
| synonymous SNV | 1 | 1 | 4 | 1 | 1 | 4 | 1 | 1 | 2 | 5 | 2 | 3 |
| cf) Tissue ID; Tissue type (1; BLCA[Bladder Urothelial Carcinoma], 2; BRCA[Breast invasive carcinoma], 3; CESC[Cervical squamous cell carcinoma and endocervical adenocarcinoma], 4; COAD[Colon adenocarcinoma], 5; GBM[Glioblastoma multiforme], 6; Glioma Low Grade, 7; HNSC[Head and Neck squamous cell carcinoma], 8; KICH[Kidney Chromophobe], 9; KIRC[Kidney renal clear cell carcinoma], 10; KIRP[Kidney renal papillary cell carcinoma], 11; LAML[Acute Myeloid Leukemia], 12; LUAD[Lung adenocarcinoma], 13; LUSC[Lung squamous cell carcinoma], 14; OV[Ovarian serous cystadenocarcinoma ], 15; PAAD[Pancreatic adenocarcinoma], 16; PRAD[Prostate adenocarcinoma], 17; SKCM[Skin Cutaneous Melanoma], 18:STAD[Stomach adenocarcinoma], 19:THCA[Thyroid carcinoma], 20:UCEC[Uterine Corpus Endometrial Carcinoma]) |
| Top |
| * We represented just top 10 SNVs. When you move the cursor on each content, you can see more deailed mutation information on the Tooltip. Those are primary_site, primary_histology, mutation(aa), pubmedID. |
| Genomic Position | Mutation(aa) | Unique sampleID count |
| chr19:42930864 | p.P146P | 3 |
| chr19:42911525 | p.R479W | 2 |
| chr19:42930623 | p.L646L | 2 |
| chr19:42930801 | p.E227Q | 2 |
| chr19:42912459 | p.R167R | 2 |
| chr19:42907058 | p.L88I | 1 |
| chr19:42912198 | p.L866L | 1 |
| chr19:42930869 | p.Q658L | 1 |
| chr19:42910326 | p.H495H | 1 |
| chr19:42914540 | p.G264E | 1 |
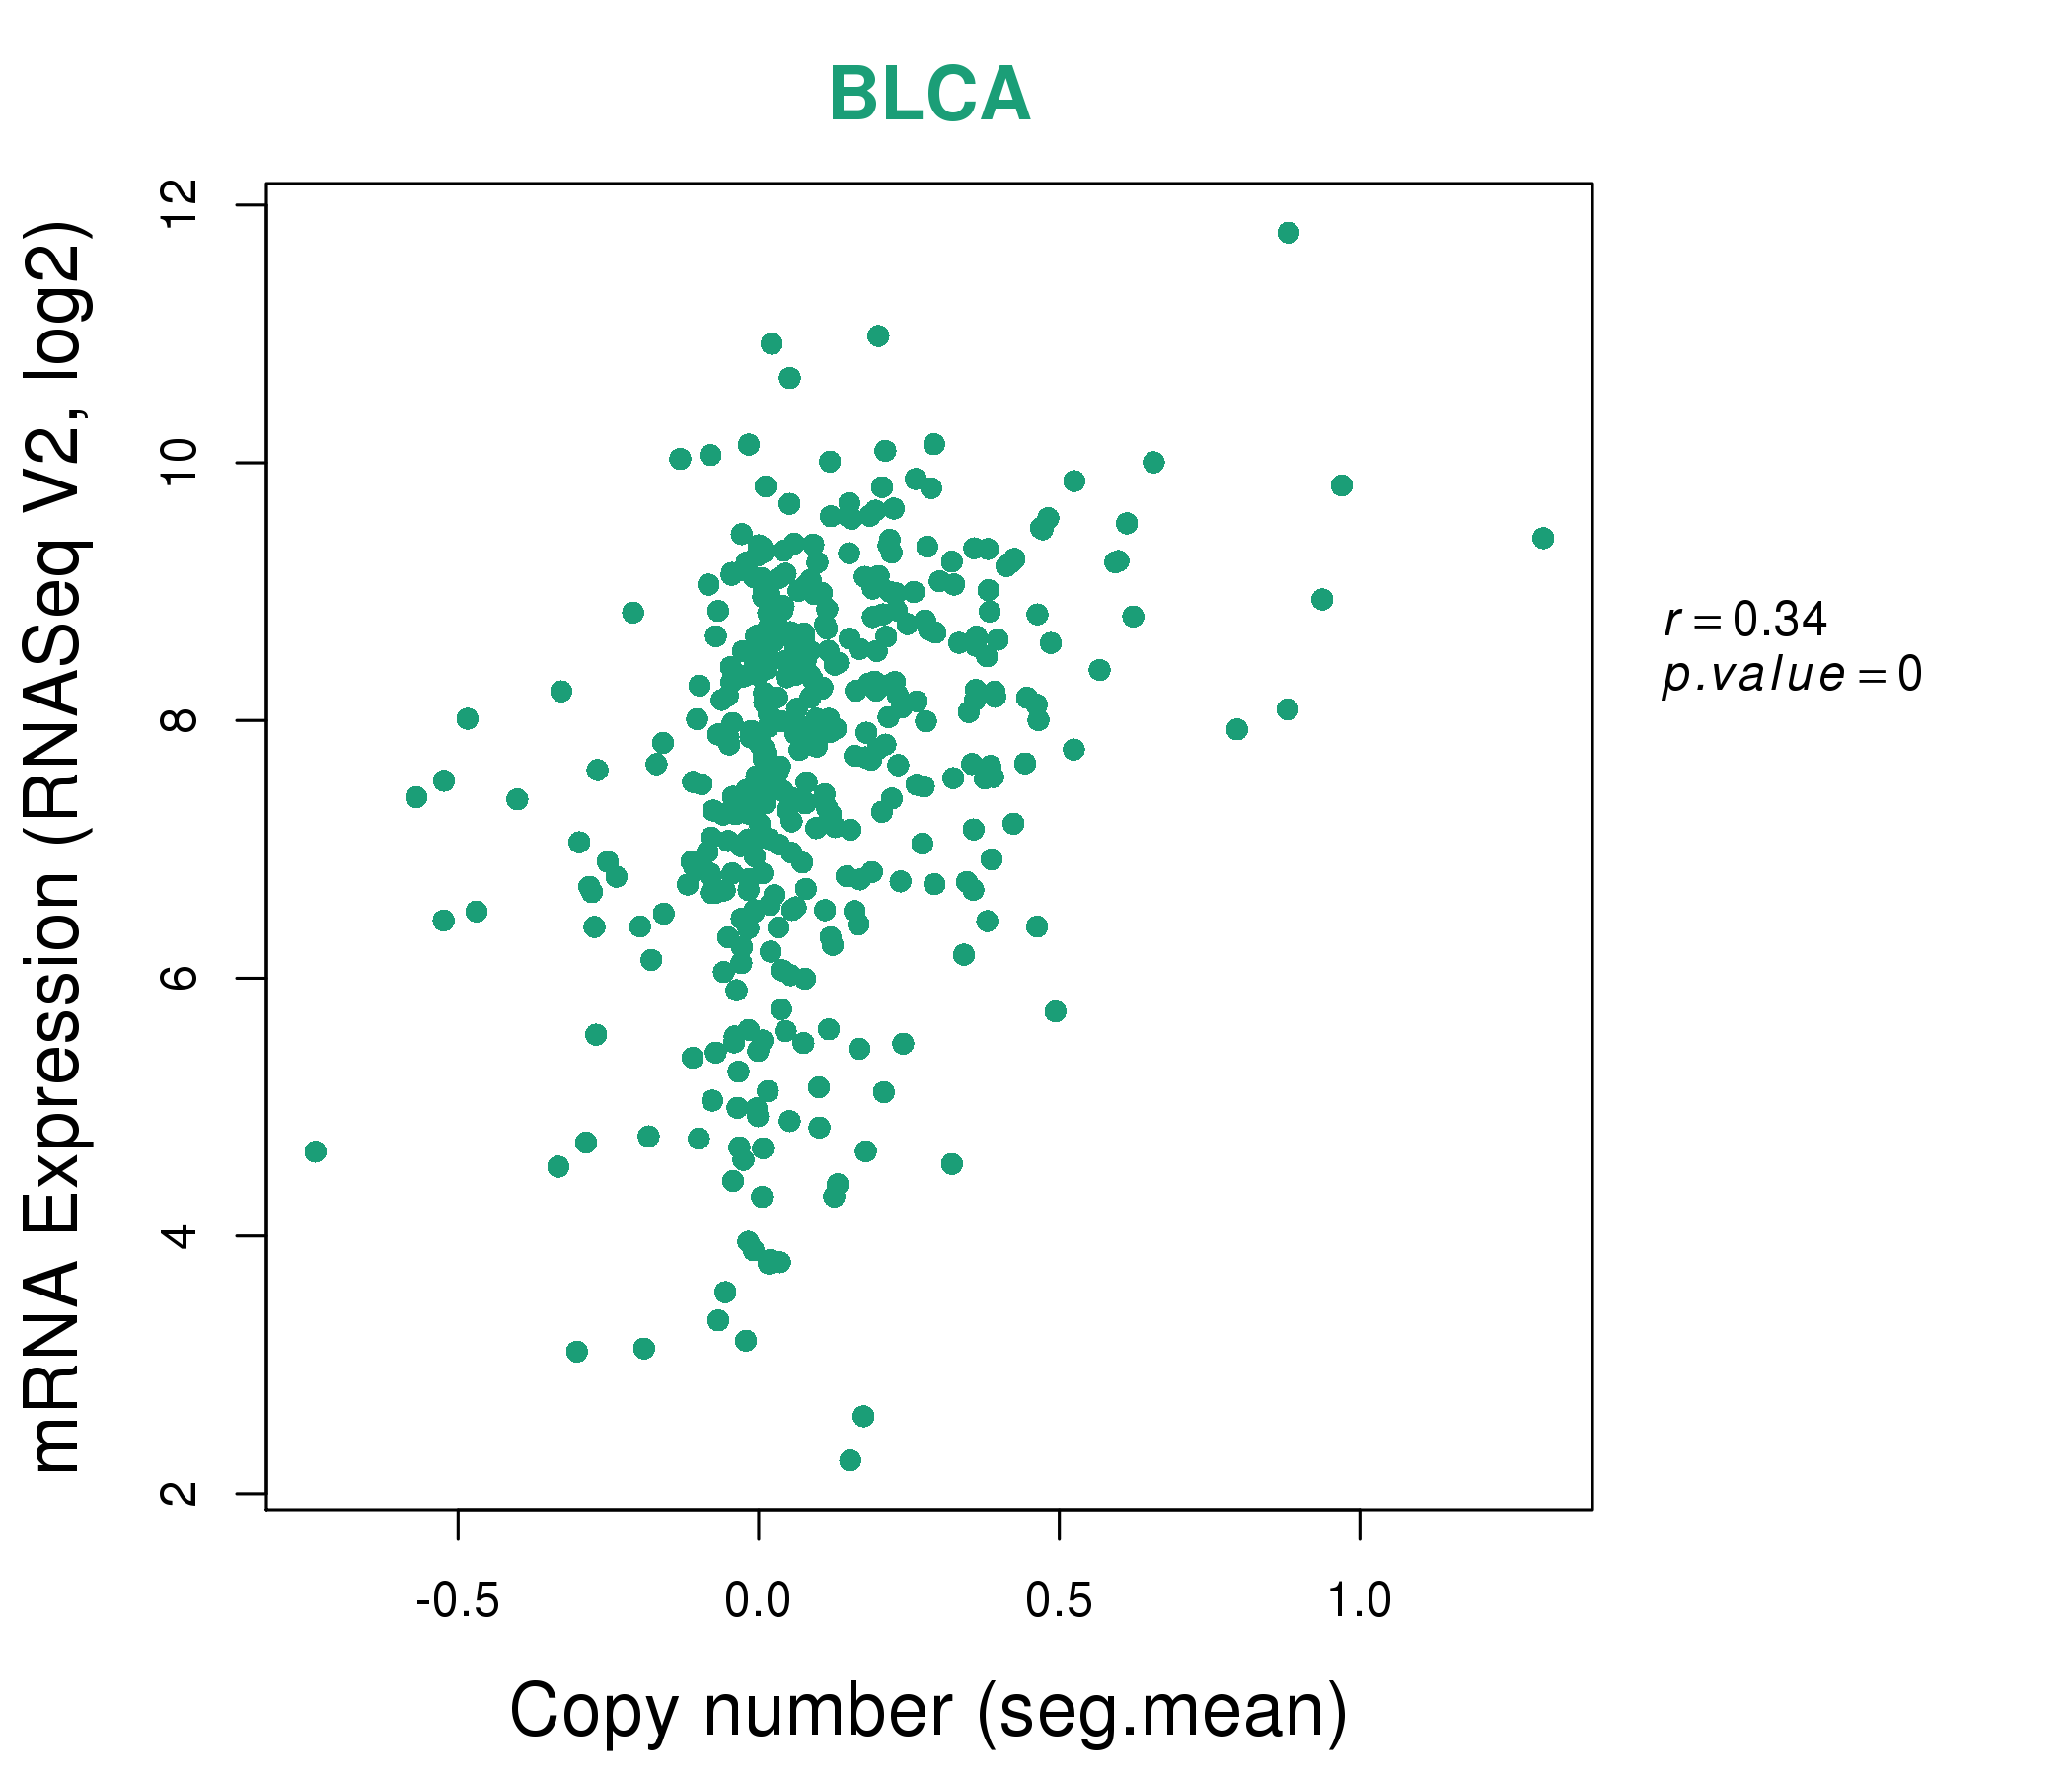
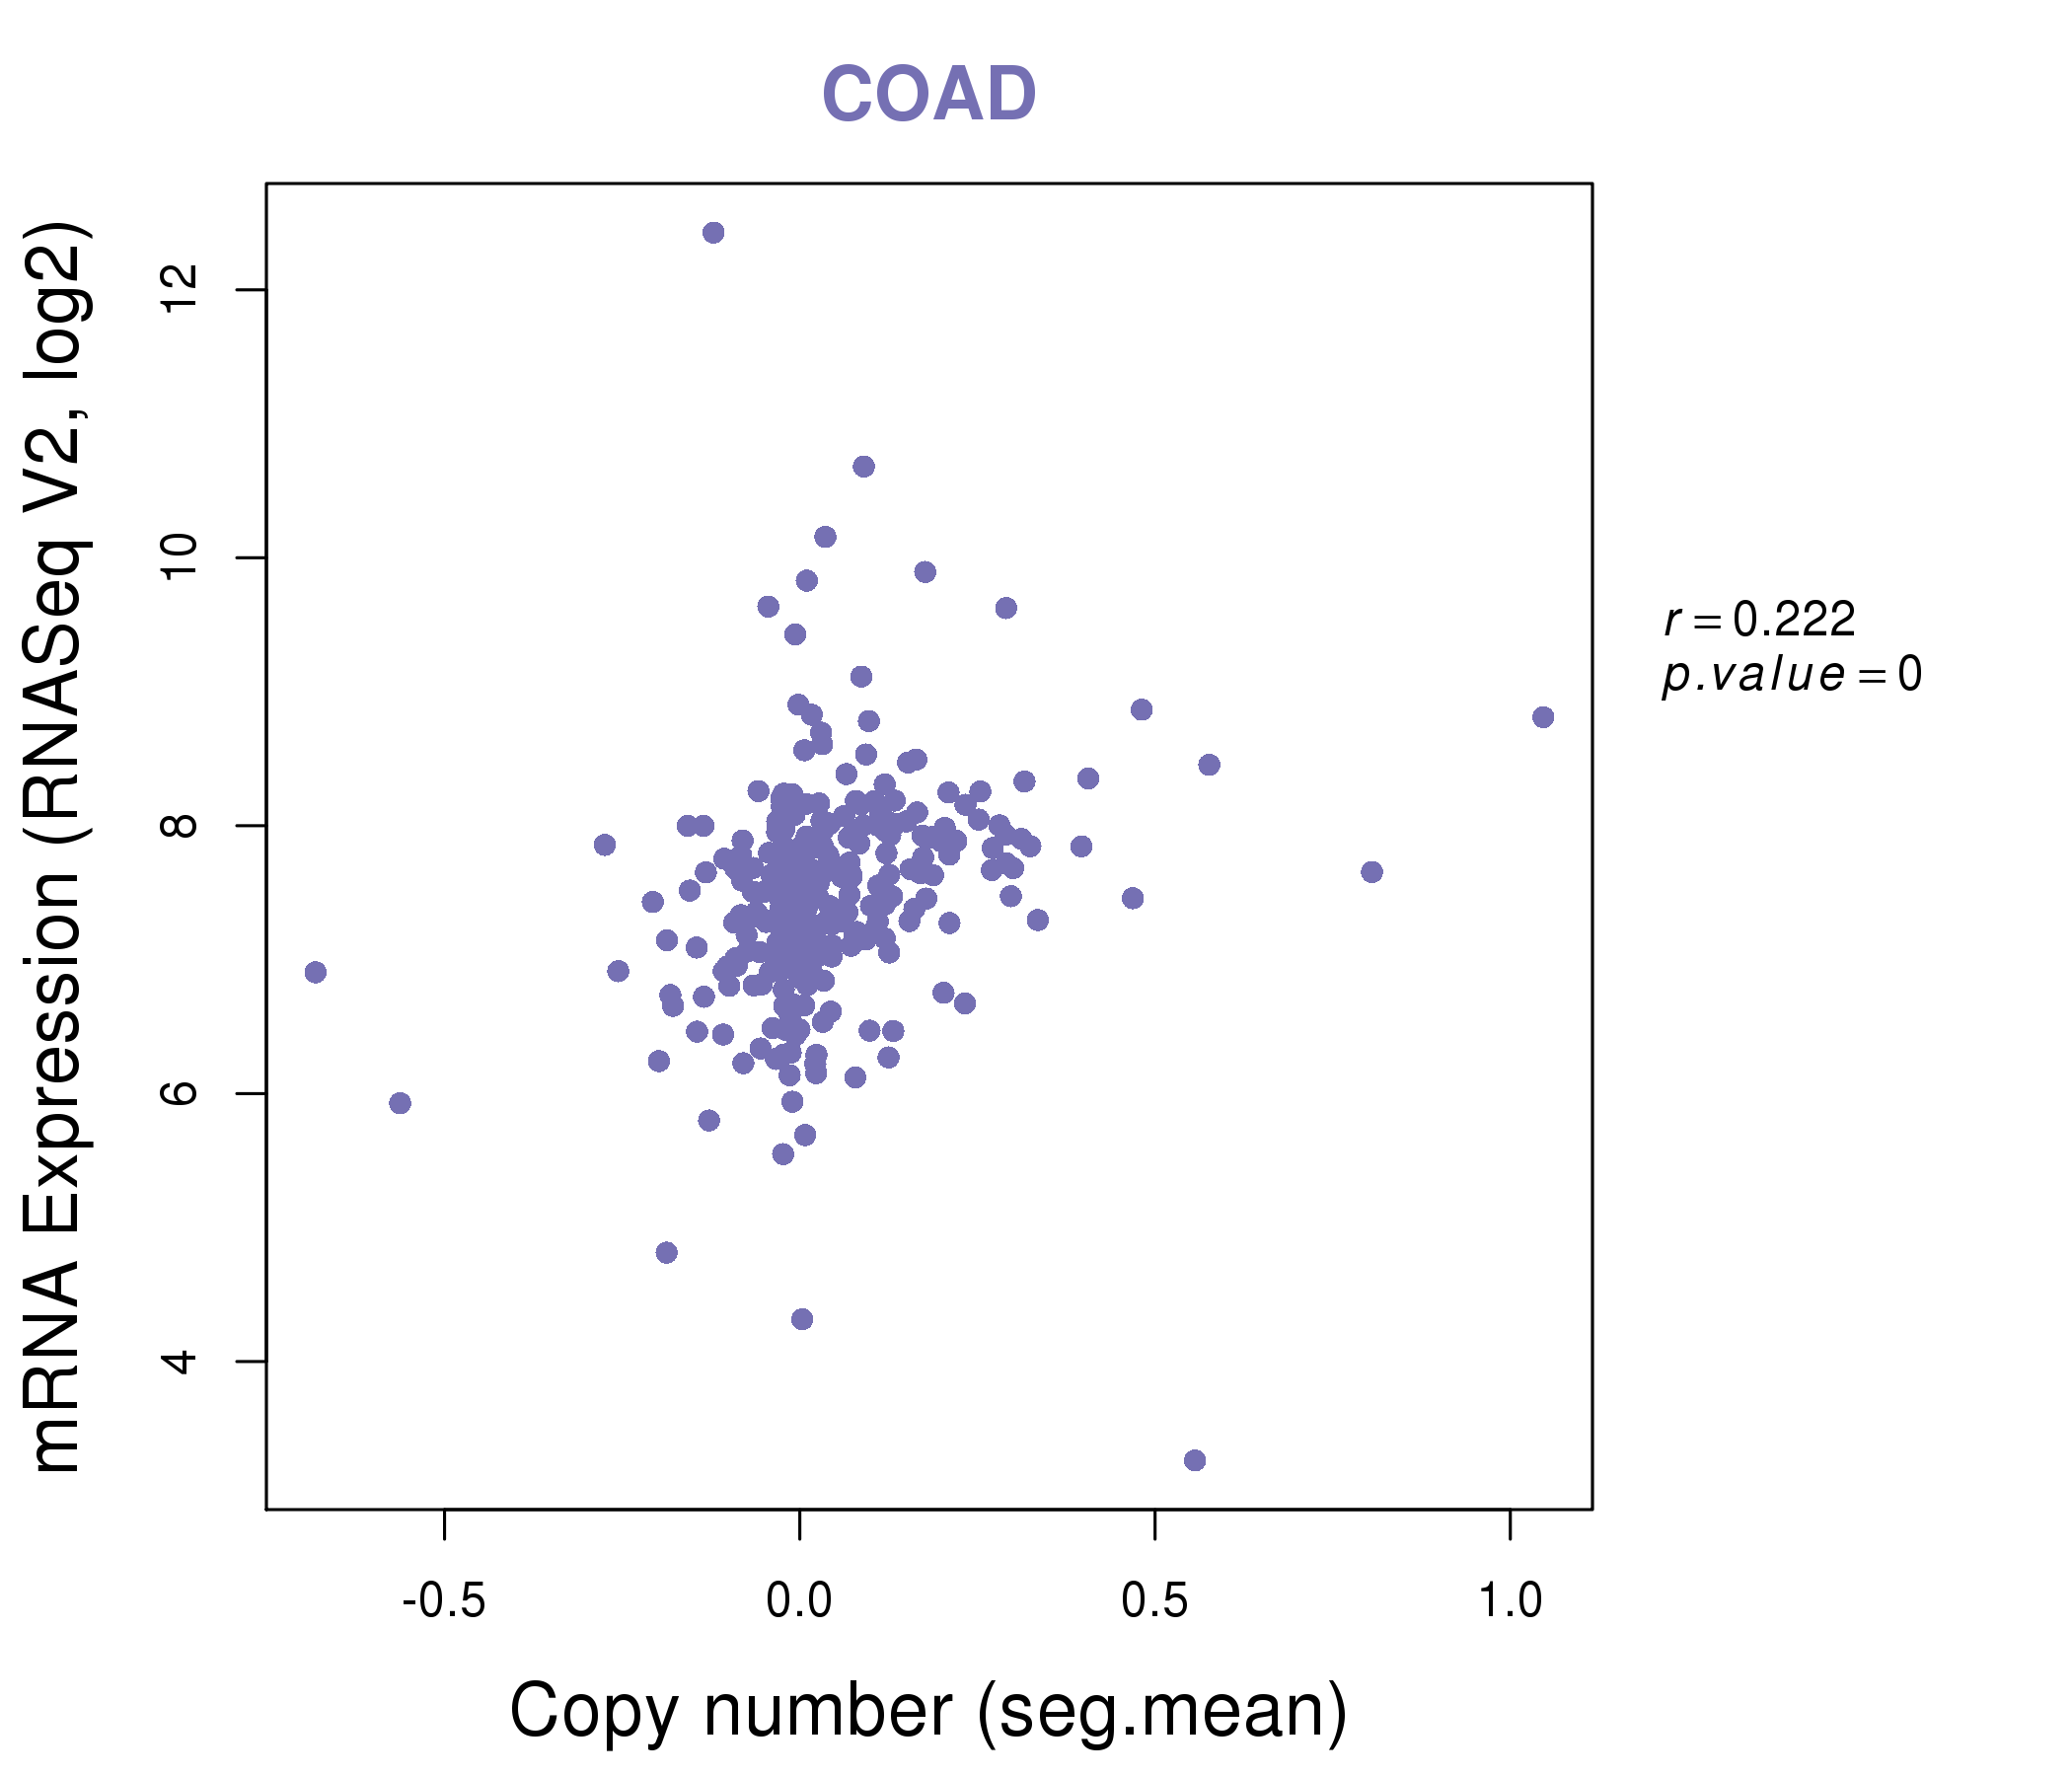
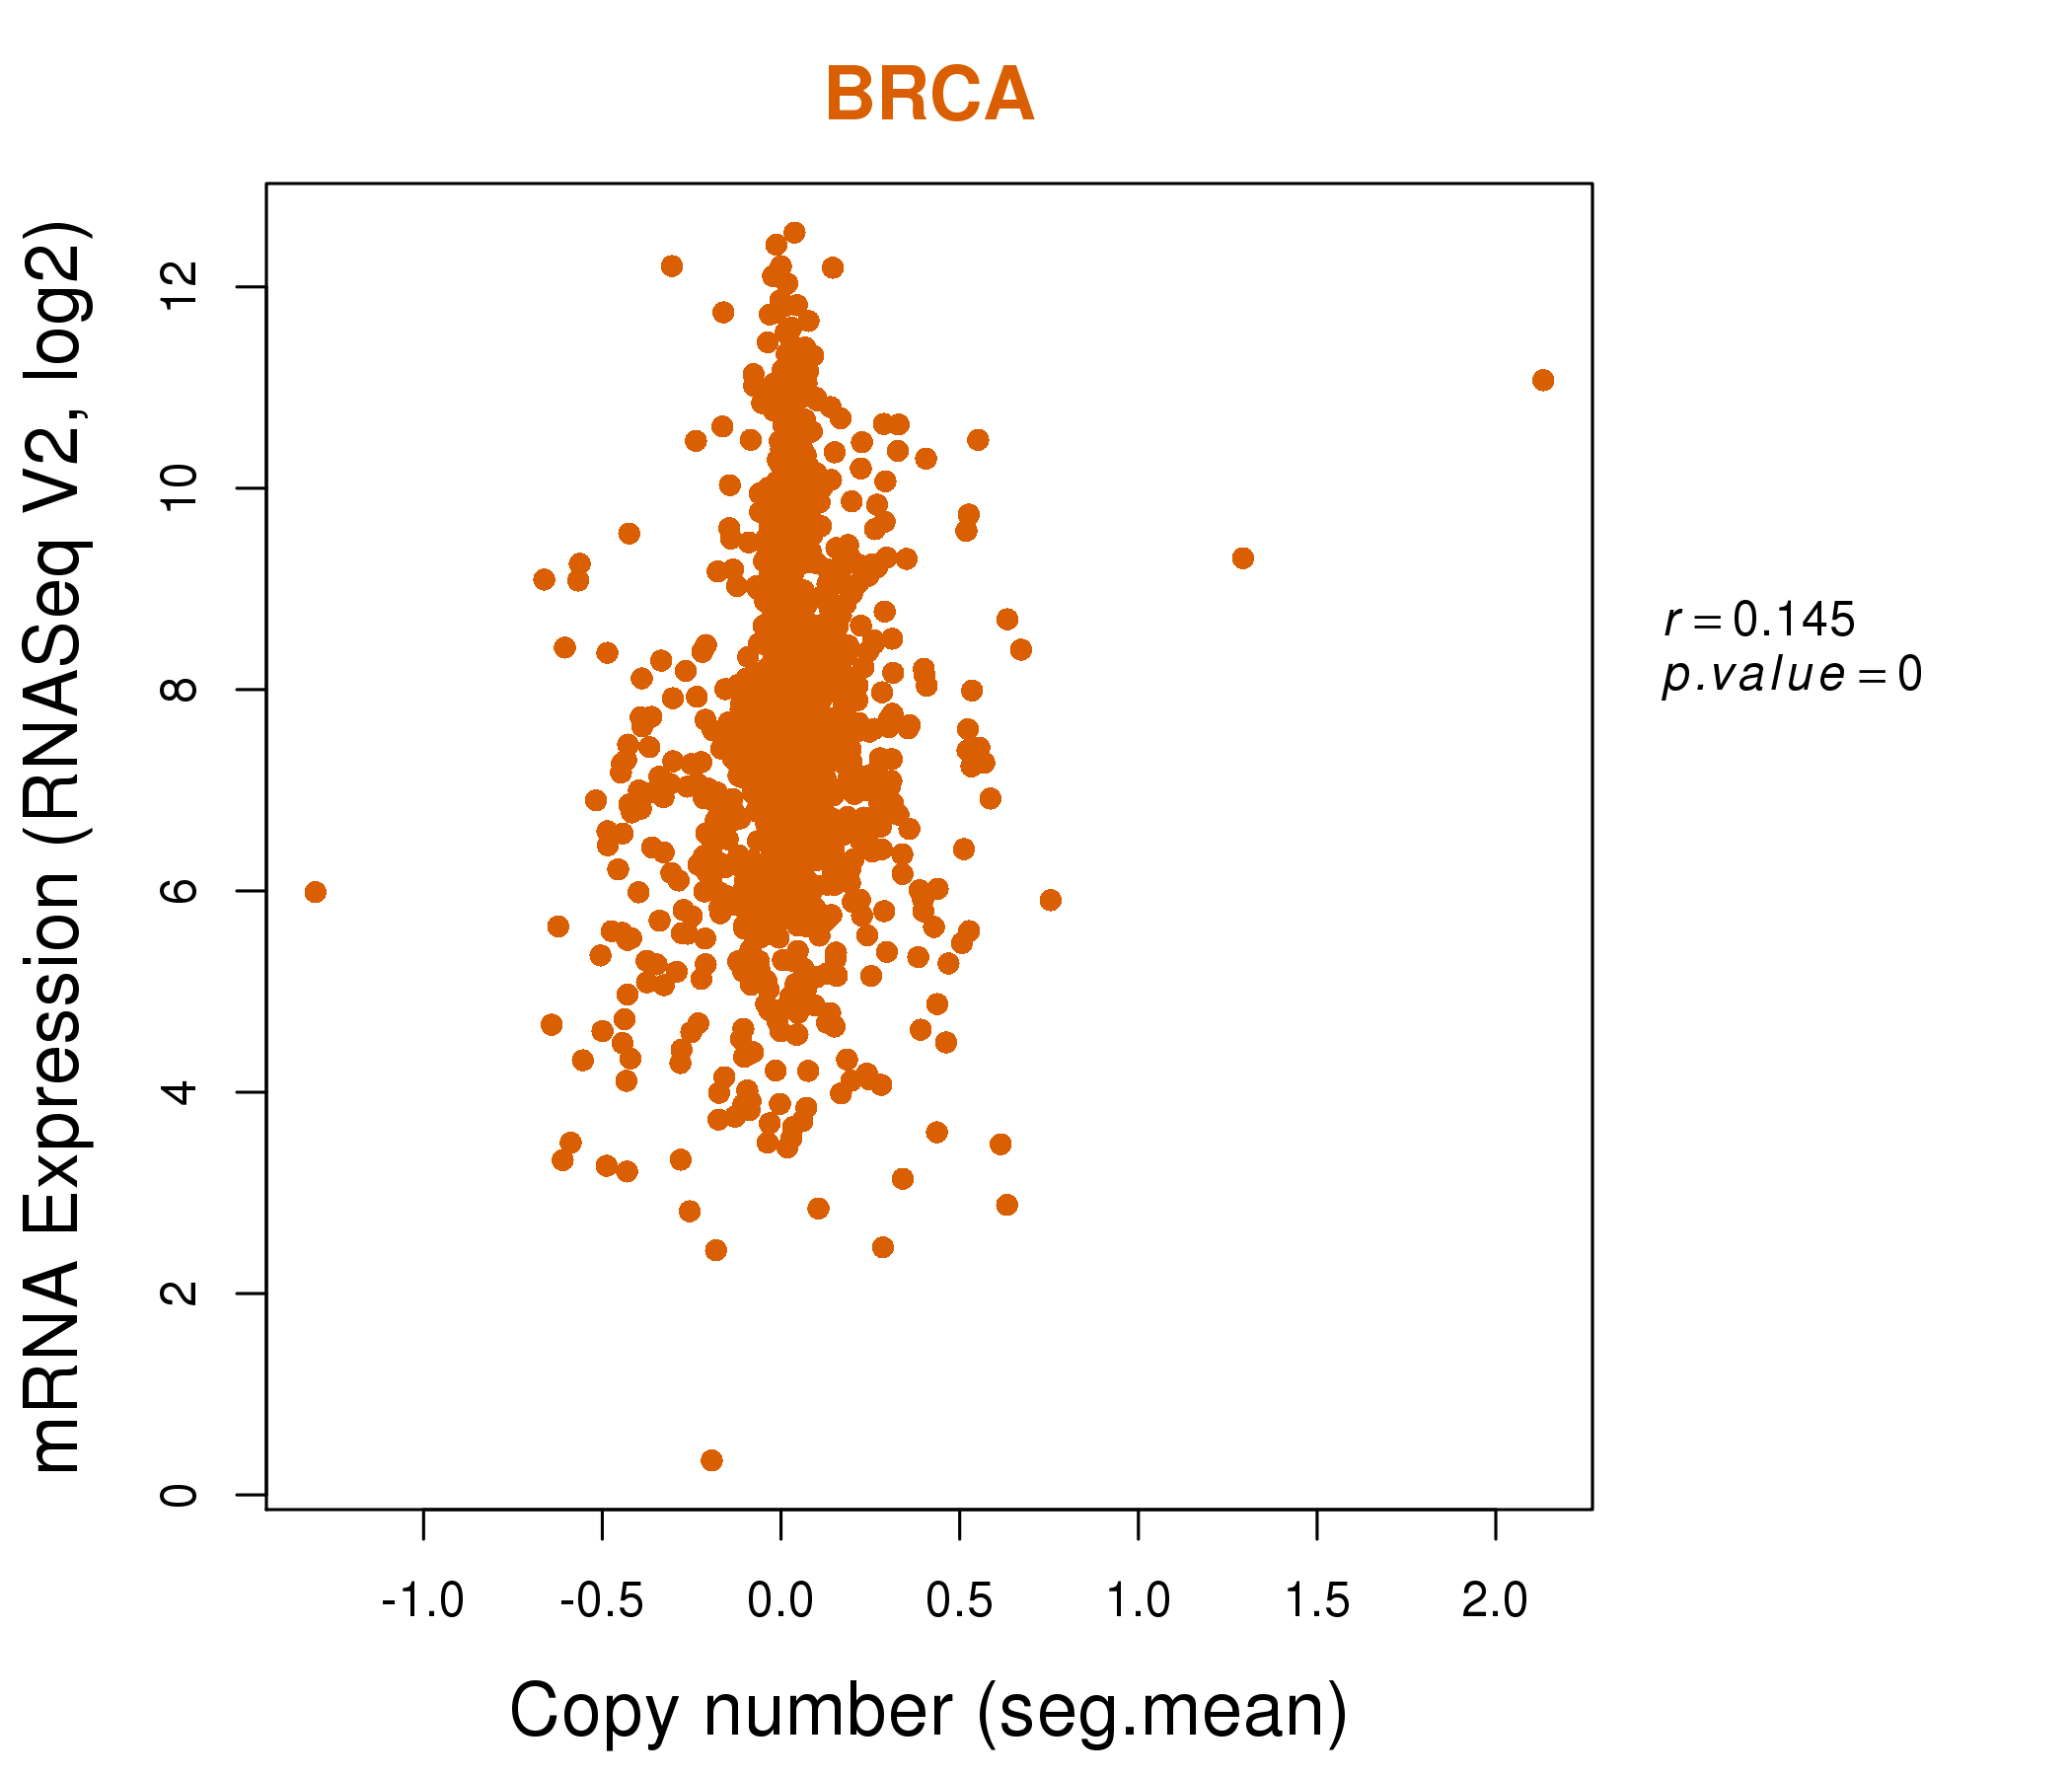
| * Copy number data were extracted from TCGA using R package TCGA-Assembler. The URLs of all public data files on TCGA DCC data server were gathered on Jan-05-2015. Function ProcessCNAData in TCGA-Assembler package was used to obtain gene-level copy number value which is calculated as the average copy number of the genomic region of a gene. |
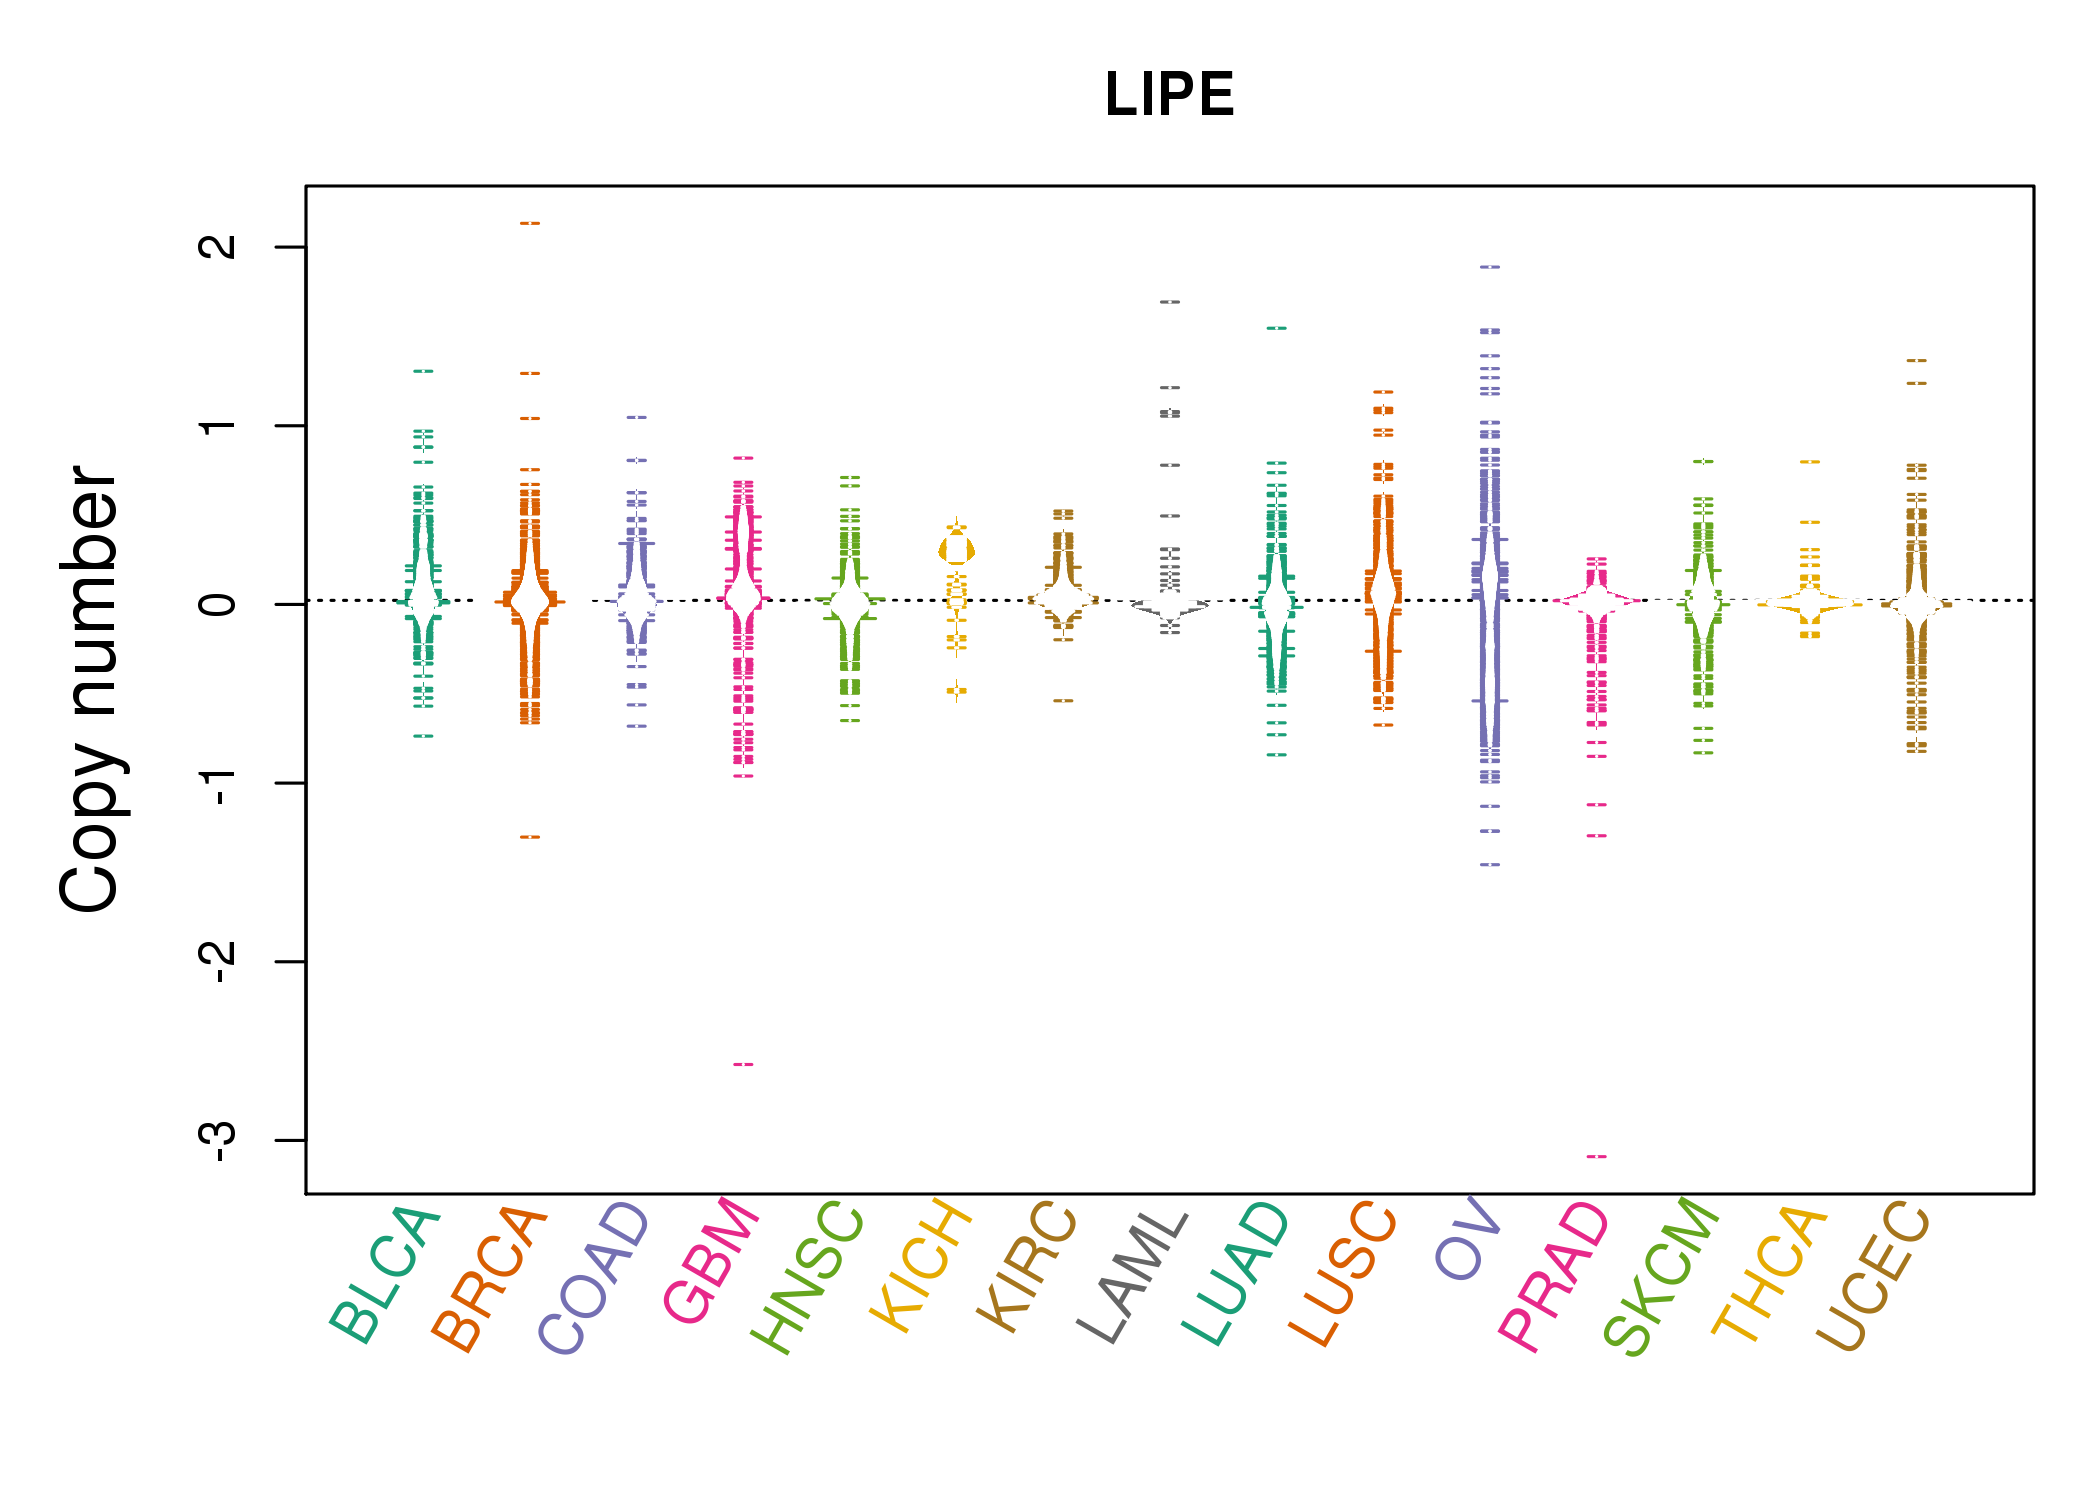 |
| cf) Tissue ID[Tissue type]: BLCA[Bladder Urothelial Carcinoma], BRCA[Breast invasive carcinoma], CESC[Cervical squamous cell carcinoma and endocervical adenocarcinoma], COAD[Colon adenocarcinoma], GBM[Glioblastoma multiforme], Glioma Low Grade, HNSC[Head and Neck squamous cell carcinoma], KICH[Kidney Chromophobe], KIRC[Kidney renal clear cell carcinoma], KIRP[Kidney renal papillary cell carcinoma], LAML[Acute Myeloid Leukemia], LUAD[Lung adenocarcinoma], LUSC[Lung squamous cell carcinoma], OV[Ovarian serous cystadenocarcinoma ], PAAD[Pancreatic adenocarcinoma], PRAD[Prostate adenocarcinoma], SKCM[Skin Cutaneous Melanoma], STAD[Stomach adenocarcinoma], THCA[Thyroid carcinoma], UCEC[Uterine Corpus Endometrial Carcinoma] |
| Top |
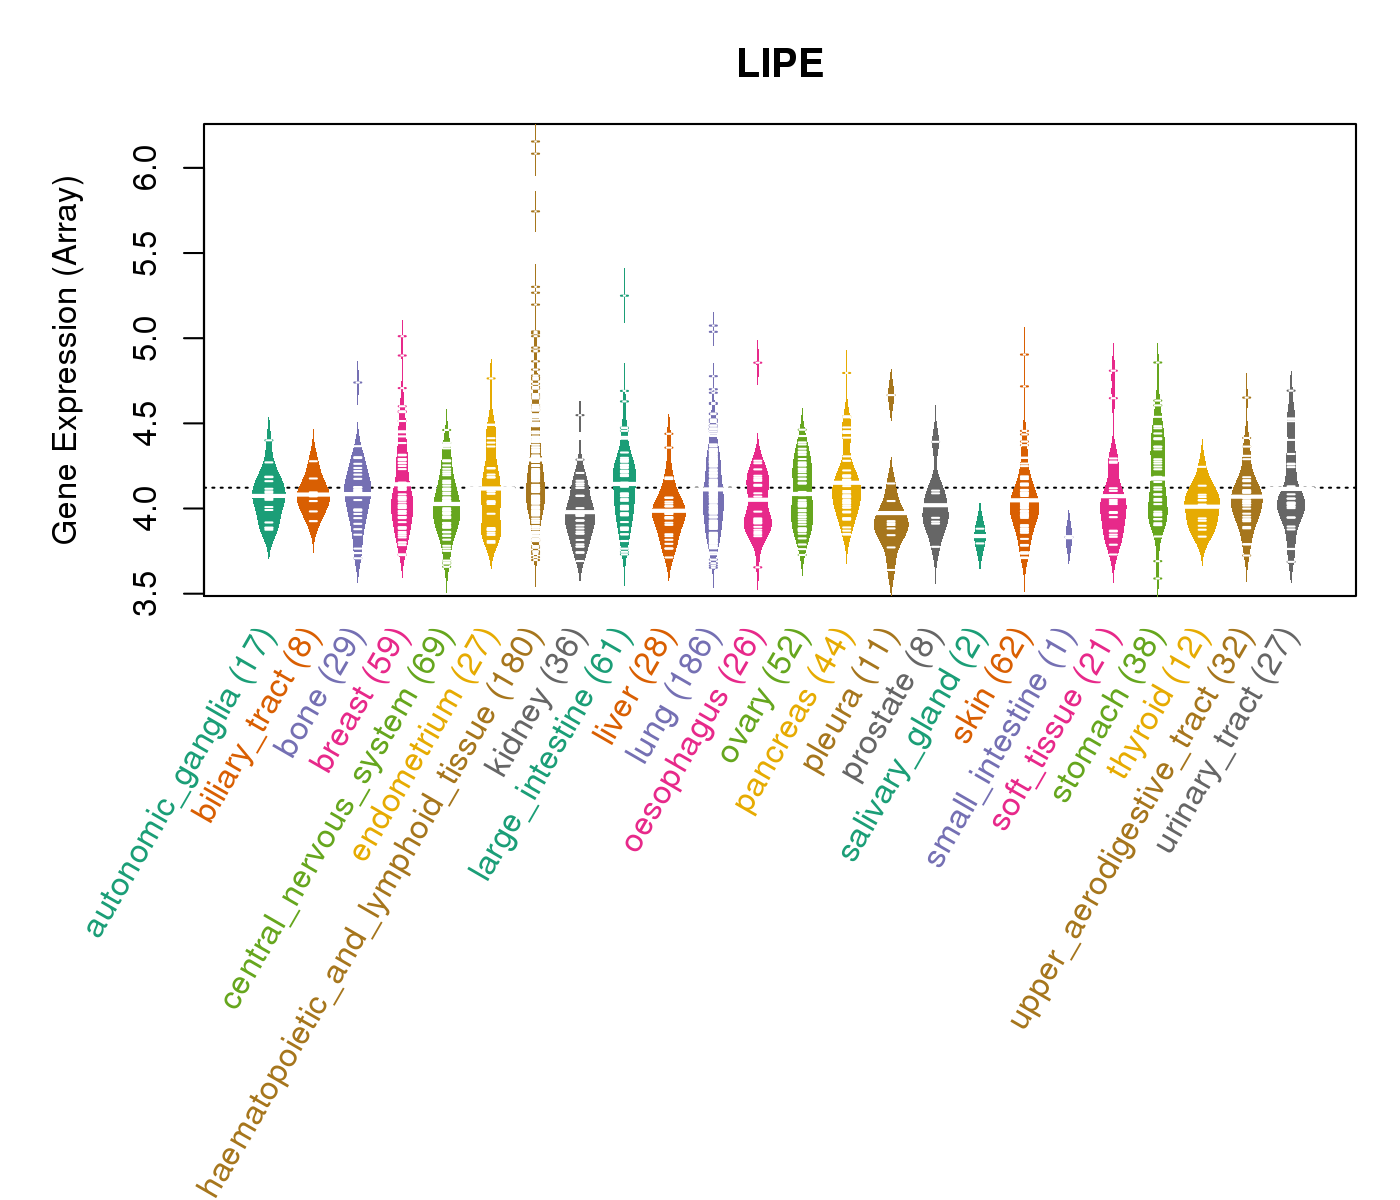
| Gene Expression for LIPE |
| * CCLE gene expression data were extracted from CCLE_Expression_Entrez_2012-10-18.res: Gene-centric RMA-normalized mRNA expression data. |
 |
| * Normalized gene expression data of RNASeqV2 was extracted from TCGA using R package TCGA-Assembler. The URLs of all public data files on TCGA DCC data server were gathered at Jan-05-2015. Only eight cancer types have enough normal control samples for differential expression analysis. (t test, adjusted p<0.05 (using Benjamini-Hochberg FDR)) |
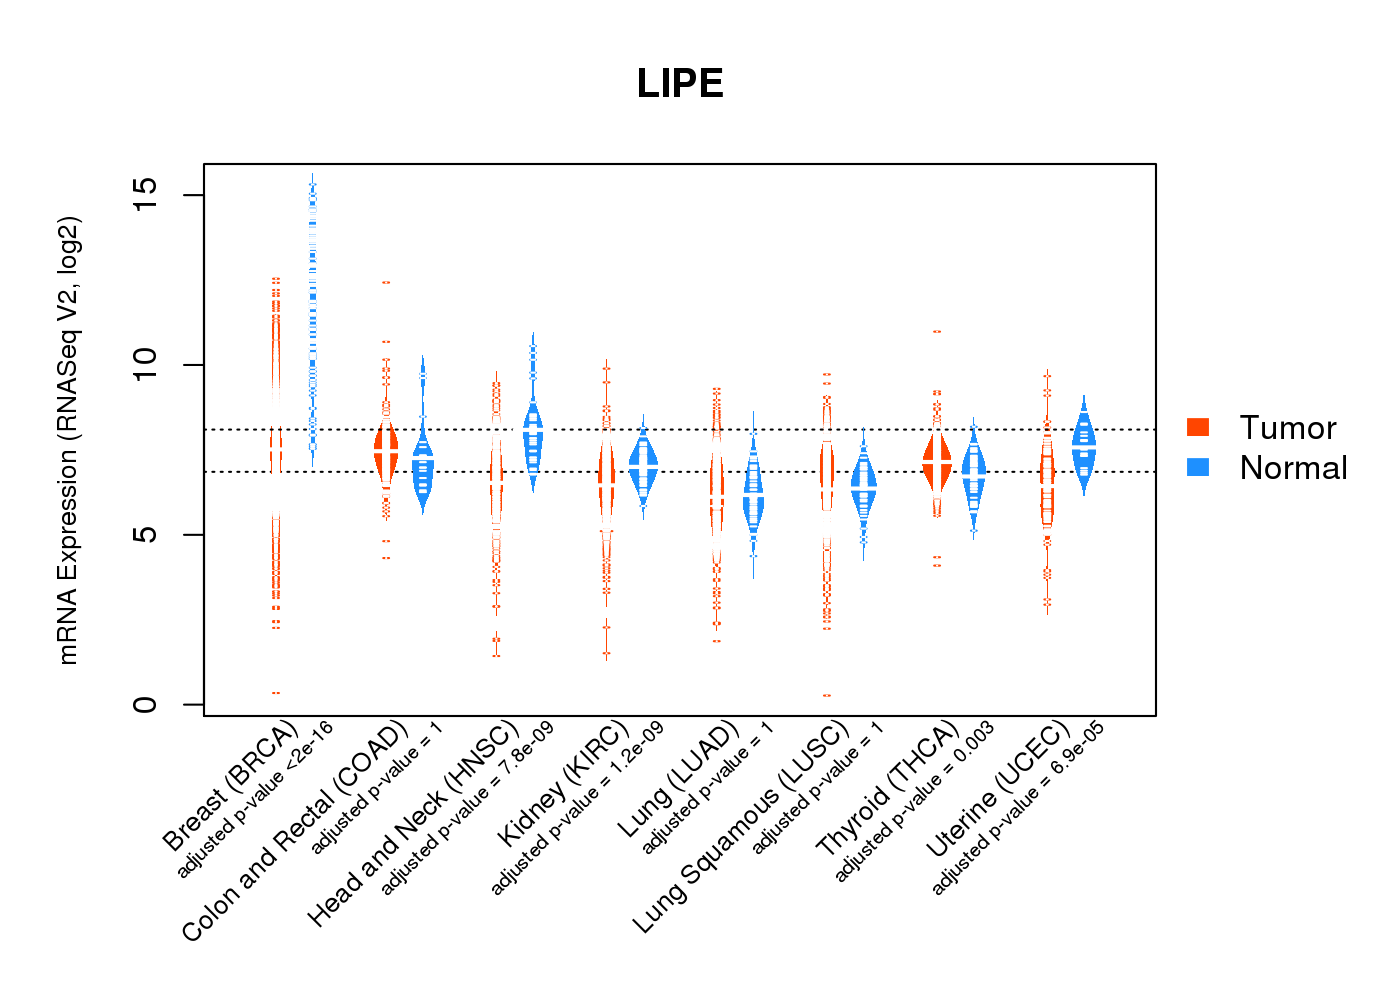 |
| Top |
| * This plots show the correlation between CNV and gene expression. |
: Open all plots for all cancer types
 |
|
 |
|

| Top |
| Gene-Gene Network Information |
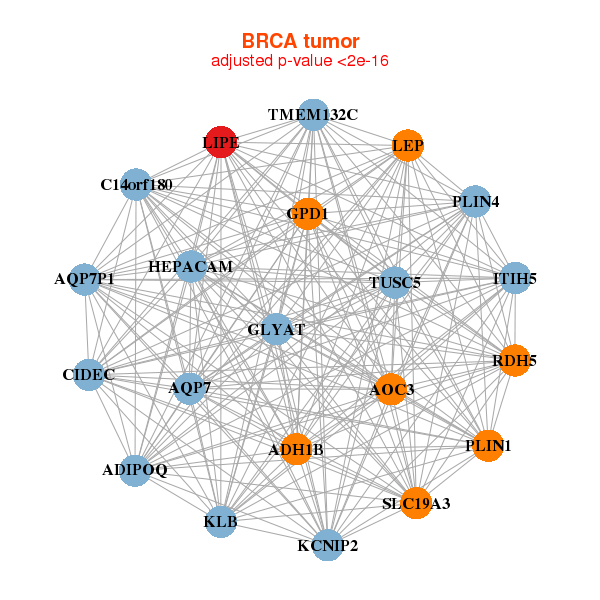
| * Co-Expression network figures were drawn using R package igraph. Only the top 20 genes with the highest correlations were shown. Red circle: input gene, orange circle: cell metabolism gene, sky circle: other gene |
: Open all plots for all cancer types
 |
|
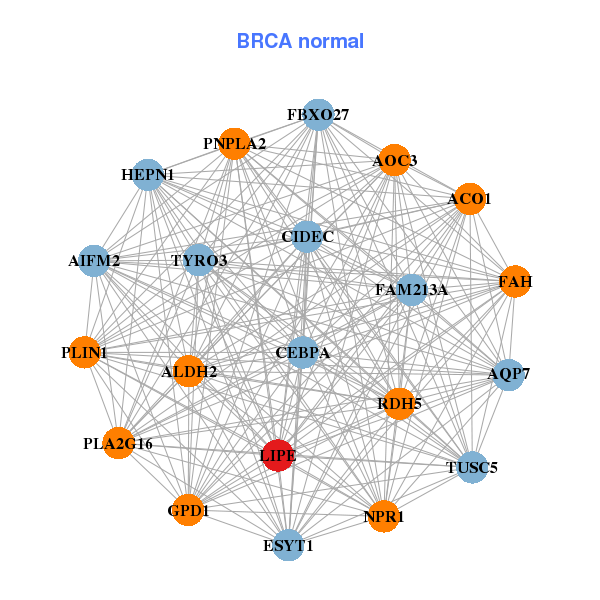
| ADH1B,ADIPOQ,AOC3,AQP7,AQP7P1,C14orf180,CIDEC, GLYAT,GPD1,HEPACAM,ITIH5,KCNIP2,KLB,LEP, LIPE,PLIN1,PLIN4,RDH5,SLC19A3,TMEM132C,TUSC5 | ACO1,AIFM2,ALDH2,AOC3,AQP7,FAM213A,CEBPA, CIDEC,ESYT1,FAH,FBXO27,GPD1,HEPN1,LIPE, NPR1,PLA2G16,PLIN1,PNPLA2,RDH5,TUSC5,TYRO3 |
 |
|
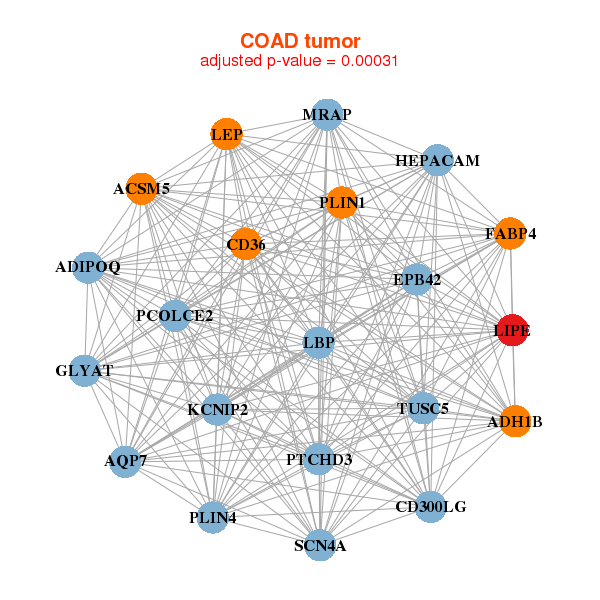
| ACSM5,ADH1B,ADIPOQ,AQP7,CD300LG,CD36,EPB42, FABP4,GLYAT,HEPACAM,KCNIP2,LBP,LEP,LIPE, MRAP,PCOLCE2,PLIN1,PLIN4,PTCHD3,SCN4A,TUSC5 | ADIPOQ,AQP7P1,CD36,CIDEA,DEFB132,DGAT2,ELOVL3, FABP4,G0S2,GPAM,KCNIP2,LGALS12,LIPE,LPL, MMP20,MRAP,NAT8L,PLIN1,THRSP,TMEM132C,TUSC5 |
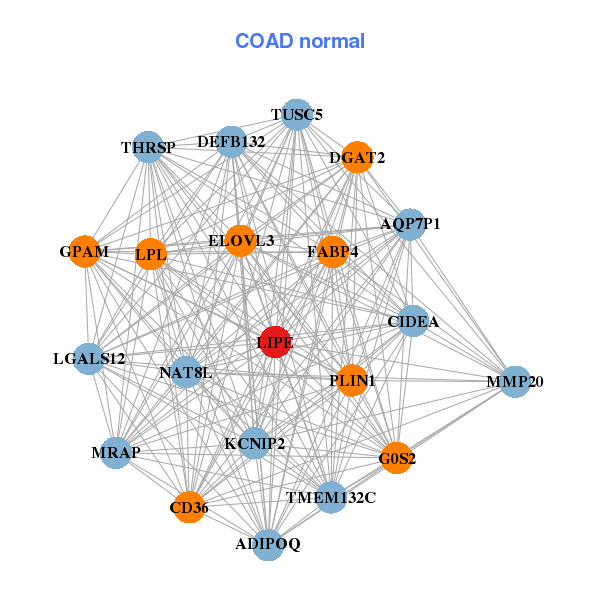
| * Co-Expression network figures were drawn using R package igraph. Only the top 20 genes with the highest correlations were shown. Red circle: input gene, orange circle: cell metabolism gene, sky circle: other gene |
: Open all plots for all cancer types
| Top |
: Open all interacting genes' information including KEGG pathway for all interacting genes from DAVID
| Top |
| Pharmacological Information for LIPE |
| There's no related Drug. |
| Top |
| Cross referenced IDs for LIPE |
| * We obtained these cross-references from Uniprot database. It covers 150 different DBs, 18 categories. http://www.uniprot.org/help/cross_references_section |
: Open all cross reference information
|
Copyright © 2016-Present - The Univsersity of Texas Health Science Center at Houston @ |