|
|||||||||||||||||||||||||||||||||||||||||||||||||||||||||||||||||||||||||||||||||||||||||||||||||||||||||||||||||||||||||||||||||||||||||||||||||||||||||||||||||||||||||||||||||||||||||||||||||||||||||||||||||||||||||||||||||||||||||||||||||||||||||||||||||||||||||||||||||||||||||||||||||||||||||||||||||||||||||||||||||||||||||||||||||||
| |
| Phenotypic Information (metabolism pathway, cancer, disease, phenome) |
| |
| |
| Gene-Gene Network Information: Co-Expression Network, Interacting Genes & KEGG |
| |
|


| Gene Summary for FADS1 |
| Basic gene info. | Gene symbol | FADS1 |
| Gene name | fatty acid desaturase 1 | |
| Synonyms | D5D|FADS6|FADSD5|LLCDL1|TU12 | |
| Cytomap | UCSC genome browser: 11q12.2-q13.1 | |
| Genomic location | chr11 :61567096-61584529 | |
| Type of gene | protein-coding | |
| RefGenes | NM_013402.4, | |
| Ensembl id | ENSG00000149485 | |
| Description | delta(5) desaturasedelta(5) fatty acid desaturasedelta-5 desaturasedelta-5 fatty acid desaturaselinoleoyl-CoA desaturase (delta-6-desaturase)-like 1 | |
| Modification date | 20141222 | |
| dbXrefs | MIM : 606148 | |
| HGNC : HGNC | ||
| Ensembl : ENSG00000149485 | ||
| HPRD : 06935 | ||
| Vega : OTTHUMG00000157155 | ||
| Protein | UniProt: go to UniProt's Cross Reference DB Table | |
| Expression | CleanEX: HS_FADS1 | |
| BioGPS: 3992 | ||
| Gene Expression Atlas: ENSG00000149485 | ||
| The Human Protein Atlas: ENSG00000149485 | ||
| Pathway | NCI Pathway Interaction Database: FADS1 | |
| KEGG: FADS1 | ||
| REACTOME: FADS1 | ||
| ConsensusPathDB | ||
| Pathway Commons: FADS1 | ||
| Metabolism | MetaCyc: FADS1 | |
| HUMANCyc: FADS1 | ||
| Regulation | Ensembl's Regulation: ENSG00000149485 | |
| miRBase: chr11 :61,567,096-61,584,529 | ||
| TargetScan: NM_013402 | ||
| cisRED: ENSG00000149485 | ||
| Context | iHOP: FADS1 | |
| cancer metabolism search in PubMed: FADS1 | ||
| UCL Cancer Institute: FADS1 | ||
| Assigned class in ccmGDB | C | |
| Top |
| Phenotypic Information for FADS1(metabolism pathway, cancer, disease, phenome) |
| Cancer | CGAP: FADS1 |
| Familial Cancer Database: FADS1 | |
| * This gene is included in those cancer gene databases. |
|
|
|
|
|
|
| |||||||||||||||||||||||||||||||||||||||||||||||||||||||||||||||||||||||||||||||||||||||||||||||||||||||||||||||||||||||||||||||||||||||||||||||||||||||||||||||||||||||||||||||||||||||||||||||||||||||||||||||||||||||||||||||||||||||||||||||||||||||||||||||||||||||||||||||||||||||||||||||||||||||||||||||||||||||||||||||||||||||||||||
Oncogene 1 | Significant driver gene in | ||||||||||||||||||||||||||||||||||||||||||||||||||||||||||||||||||||||||||||||||||||||||||||||||||||||||||||||||||||||||||||||||||||||||||||||||||||||||||||||||||||||||||||||||||||||||||||||||||||||||||||||||||||||||||||||||||||||||||||||||||||||||||||||||||||||||||||||||||||||||||||||||||||||||||||||||||||||||||||||||||||||||||||||||||
| cf) number; DB name 1 Oncogene; http://nar.oxfordjournals.org/content/35/suppl_1/D721.long, 2 Tumor Suppressor gene; https://bioinfo.uth.edu/TSGene/, 3 Cancer Gene Census; http://www.nature.com/nrc/journal/v4/n3/abs/nrc1299.html, 4 CancerGenes; http://nar.oxfordjournals.org/content/35/suppl_1/D721.long, 5 Network of Cancer Gene; http://ncg.kcl.ac.uk/index.php, 1Therapeutic Vulnerabilities in Cancer; http://cbio.mskcc.org/cancergenomics/statius/ |
| REACTOME_METABOLISM_OF_LIPIDS_AND_LIPOPROTEINS | |
| OMIM | |
| Orphanet | |
| Disease | KEGG Disease: FADS1 |
| MedGen: FADS1 (Human Medical Genetics with Condition) | |
| ClinVar: FADS1 | |
| Phenotype | MGI: FADS1 (International Mouse Phenotyping Consortium) |
| PhenomicDB: FADS1 | |
| Mutations for FADS1 |
| * Under tables are showing count per each tissue to give us broad intuition about tissue specific mutation patterns.You can go to the detailed page for each mutation database's web site. |
| There's no structural variation information in COSMIC data for this gene. |
| * From mRNA Sanger sequences, Chitars2.0 arranged chimeric transcripts. This table shows FADS1 related fusion information. |
| ID | Head Gene | Tail Gene | Accession | Gene_a | qStart_a | qEnd_a | Chromosome_a | tStart_a | tEnd_a | Gene_a | qStart_a | qEnd_a | Chromosome_a | tStart_a | tEnd_a |
| AW579368 | FADS1 | 15 | 97 | 11 | 61570504 | 61570587 | FADS1 | 95 | 240 | 11 | 61569706 | 61569851 | |
| BG289620 | FADS1 | 1 | 311 | 11 | 61568978 | 61569290 | CLDN1 | 303 | 769 | 3 | 190024204 | 190024669 | |
| AI937735 | LOC440944 | 2 | 214 | 3 | 9426340 | 9426552 | FADS1 | 212 | 392 | 11 | 61580785 | 61584167 | |
| BE789742 | FADS1 | 1 | 52 | 11 | 61568454 | 61568505 | FADS1 | 49 | 718 | 11 | 61567747 | 61568421 | |
| AW937108 | FADS1 | 62 | 163 | 11 | 61569592 | 61569695 | YWHAE | 154 | 512 | 17 | 1270940 | 1271298 | |
| CB143399 | FADS1 | 14 | 288 | 11 | 61569355 | 61569629 | TGOLN2 | 286 | 512 | 2 | 85545198 | 85545424 | |
| N67724 | FADS1 | 1 | 61 | 11 | 61569748 | 61569808 | VGLL3 | 53 | 457 | 3 | 86994531 | 86994935 | |
| Top |
| Mutation type/ Tissue ID | brca | cns | cerv | endome | haematopo | kidn | Lintest | liver | lung | ns | ovary | pancre | prost | skin | stoma | thyro | urina | |||
| Total # sample | 1 | 1 | 1 | |||||||||||||||||
| GAIN (# sample) | 1 | 1 | 1 | |||||||||||||||||
| LOSS (# sample) |
| cf) Tissue ID; Tissue type (1; Breast, 2; Central_nervous_system, 3; Cervix, 4; Endometrium, 5; Haematopoietic_and_lymphoid_tissue, 6; Kidney, 7; Large_intestine, 8; Liver, 9; Lung, 10; NS, 11; Ovary, 12; Pancreas, 13; Prostate, 14; Skin, 15; Stomach, 16; Thyroid, 17; Urinary_tract) |
| Top |
|
 |
| Top |
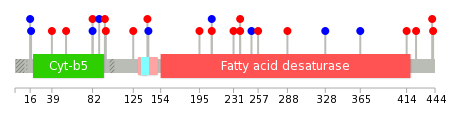
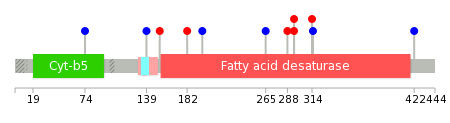
| Stat. for Non-Synonymous SNVs (# total SNVs=13) | (# total SNVs=9) |
 |  |
(# total SNVs=1) | (# total SNVs=0) |
 |
| Top |
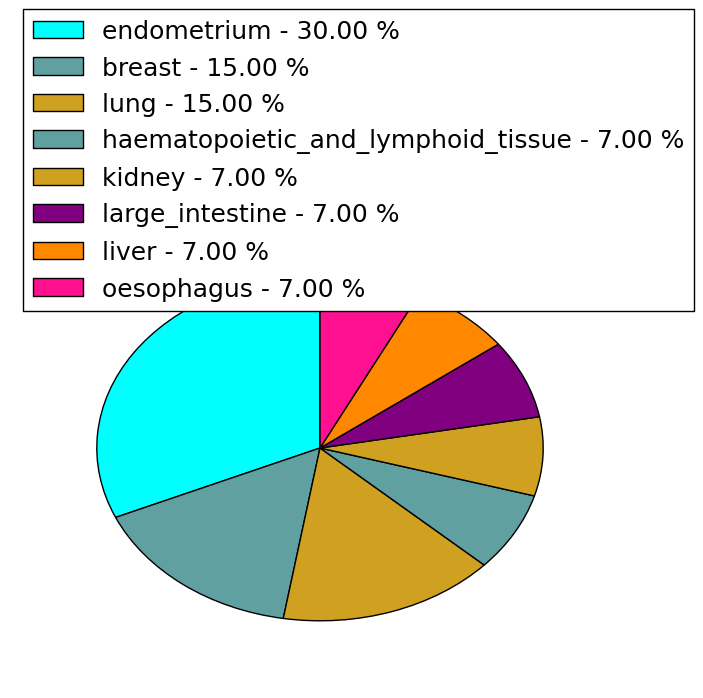
| * When you move the cursor on each content, you can see more deailed mutation information on the Tooltip. Those are primary_site,primary_histology,mutation(aa),pubmedID. |
| GRCh37 position | Mutation(aa) | Unique sampleID count |
| chr11:61569884-61569884 | p.*445* | 2 |
| chr11:61570315-61570315 | p.Y414C | 1 |
| chr11:61578343-61578343 | p.P208P | 1 |
| chr11:61584071-61584071 | p.G54W | 1 |
| chr11:61570566-61570566 | p.N365N | 1 |
| chr11:61578345-61578345 | p.P208S | 1 |
| chr11:61584116-61584116 | p.D39Y | 1 |
| chr11:61570834-61570834 | p.? | 1 |
| chr11:61578478-61578478 | p.L195V | 1 |
| chr11:61584180-61584180 | p.P17P | 1 |
| Top |
|
 |
| Point Mutation/ Tissue ID | 1 | 2 | 3 | 4 | 5 | 6 | 7 | 8 | 9 | 10 | 11 | 12 | 13 | 14 | 15 | 16 | 17 | 18 | 19 | 20 |
| # sample | 2 | 1 | 1 | 1 | 1 | 1 | 1 | 4 | ||||||||||||
| # mutation | 2 | 1 | 1 | 1 | 1 | 1 | 1 | 6 | ||||||||||||
| nonsynonymous SNV | 1 | 1 | 1 | 1 | 4 | |||||||||||||||
| synonymous SNV | 1 | 1 | 1 | 1 | 2 |
| cf) Tissue ID; Tissue type (1; BLCA[Bladder Urothelial Carcinoma], 2; BRCA[Breast invasive carcinoma], 3; CESC[Cervical squamous cell carcinoma and endocervical adenocarcinoma], 4; COAD[Colon adenocarcinoma], 5; GBM[Glioblastoma multiforme], 6; Glioma Low Grade, 7; HNSC[Head and Neck squamous cell carcinoma], 8; KICH[Kidney Chromophobe], 9; KIRC[Kidney renal clear cell carcinoma], 10; KIRP[Kidney renal papillary cell carcinoma], 11; LAML[Acute Myeloid Leukemia], 12; LUAD[Lung adenocarcinoma], 13; LUSC[Lung squamous cell carcinoma], 14; OV[Ovarian serous cystadenocarcinoma ], 15; PAAD[Pancreatic adenocarcinoma], 16; PRAD[Prostate adenocarcinoma], 17; SKCM[Skin Cutaneous Melanoma], 18:STAD[Stomach adenocarcinoma], 19:THCA[Thyroid carcinoma], 20:UCEC[Uterine Corpus Endometrial Carcinoma]) |
| Top |
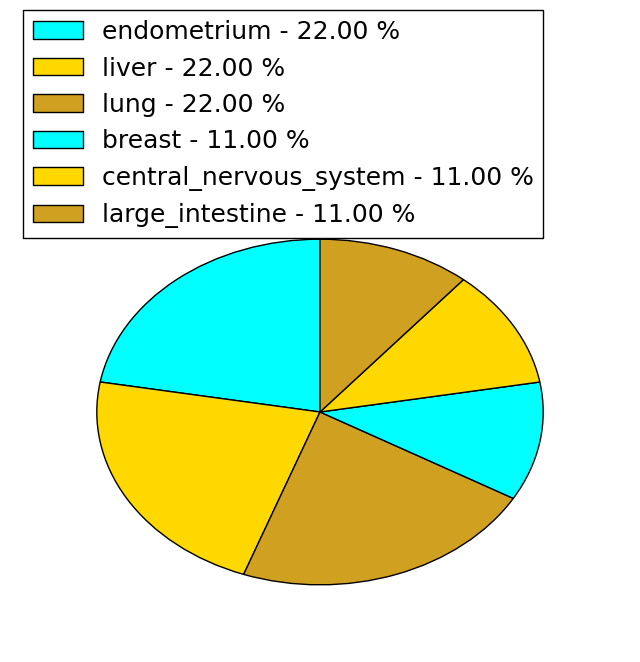
| * We represented just top 10 SNVs. When you move the cursor on each content, you can see more deailed mutation information on the Tooltip. Those are primary_site, primary_histology, mutation(aa), pubmedID. |
| Genomic Position | Mutation(aa) | Unique sampleID count |
| chr11:61574172 | p.F295L | 1 |
| chr11:61578253 | p.F295V | 1 |
| chr11:61578255 | p.D288E | 1 |
| chr11:61578274 | p.P265P | 1 |
| chr11:61578343 | p.L198L | 1 |
| chr11:61580035 | p.M182I | 1 |
| chr11:61580081 | p.E153D | 1 |
| chr11:61569896 | p.K139K | 1 |
| chr11:61580742 | p.P74P | 1 |
| chr11:61570315 | p.Y498C | 1 |
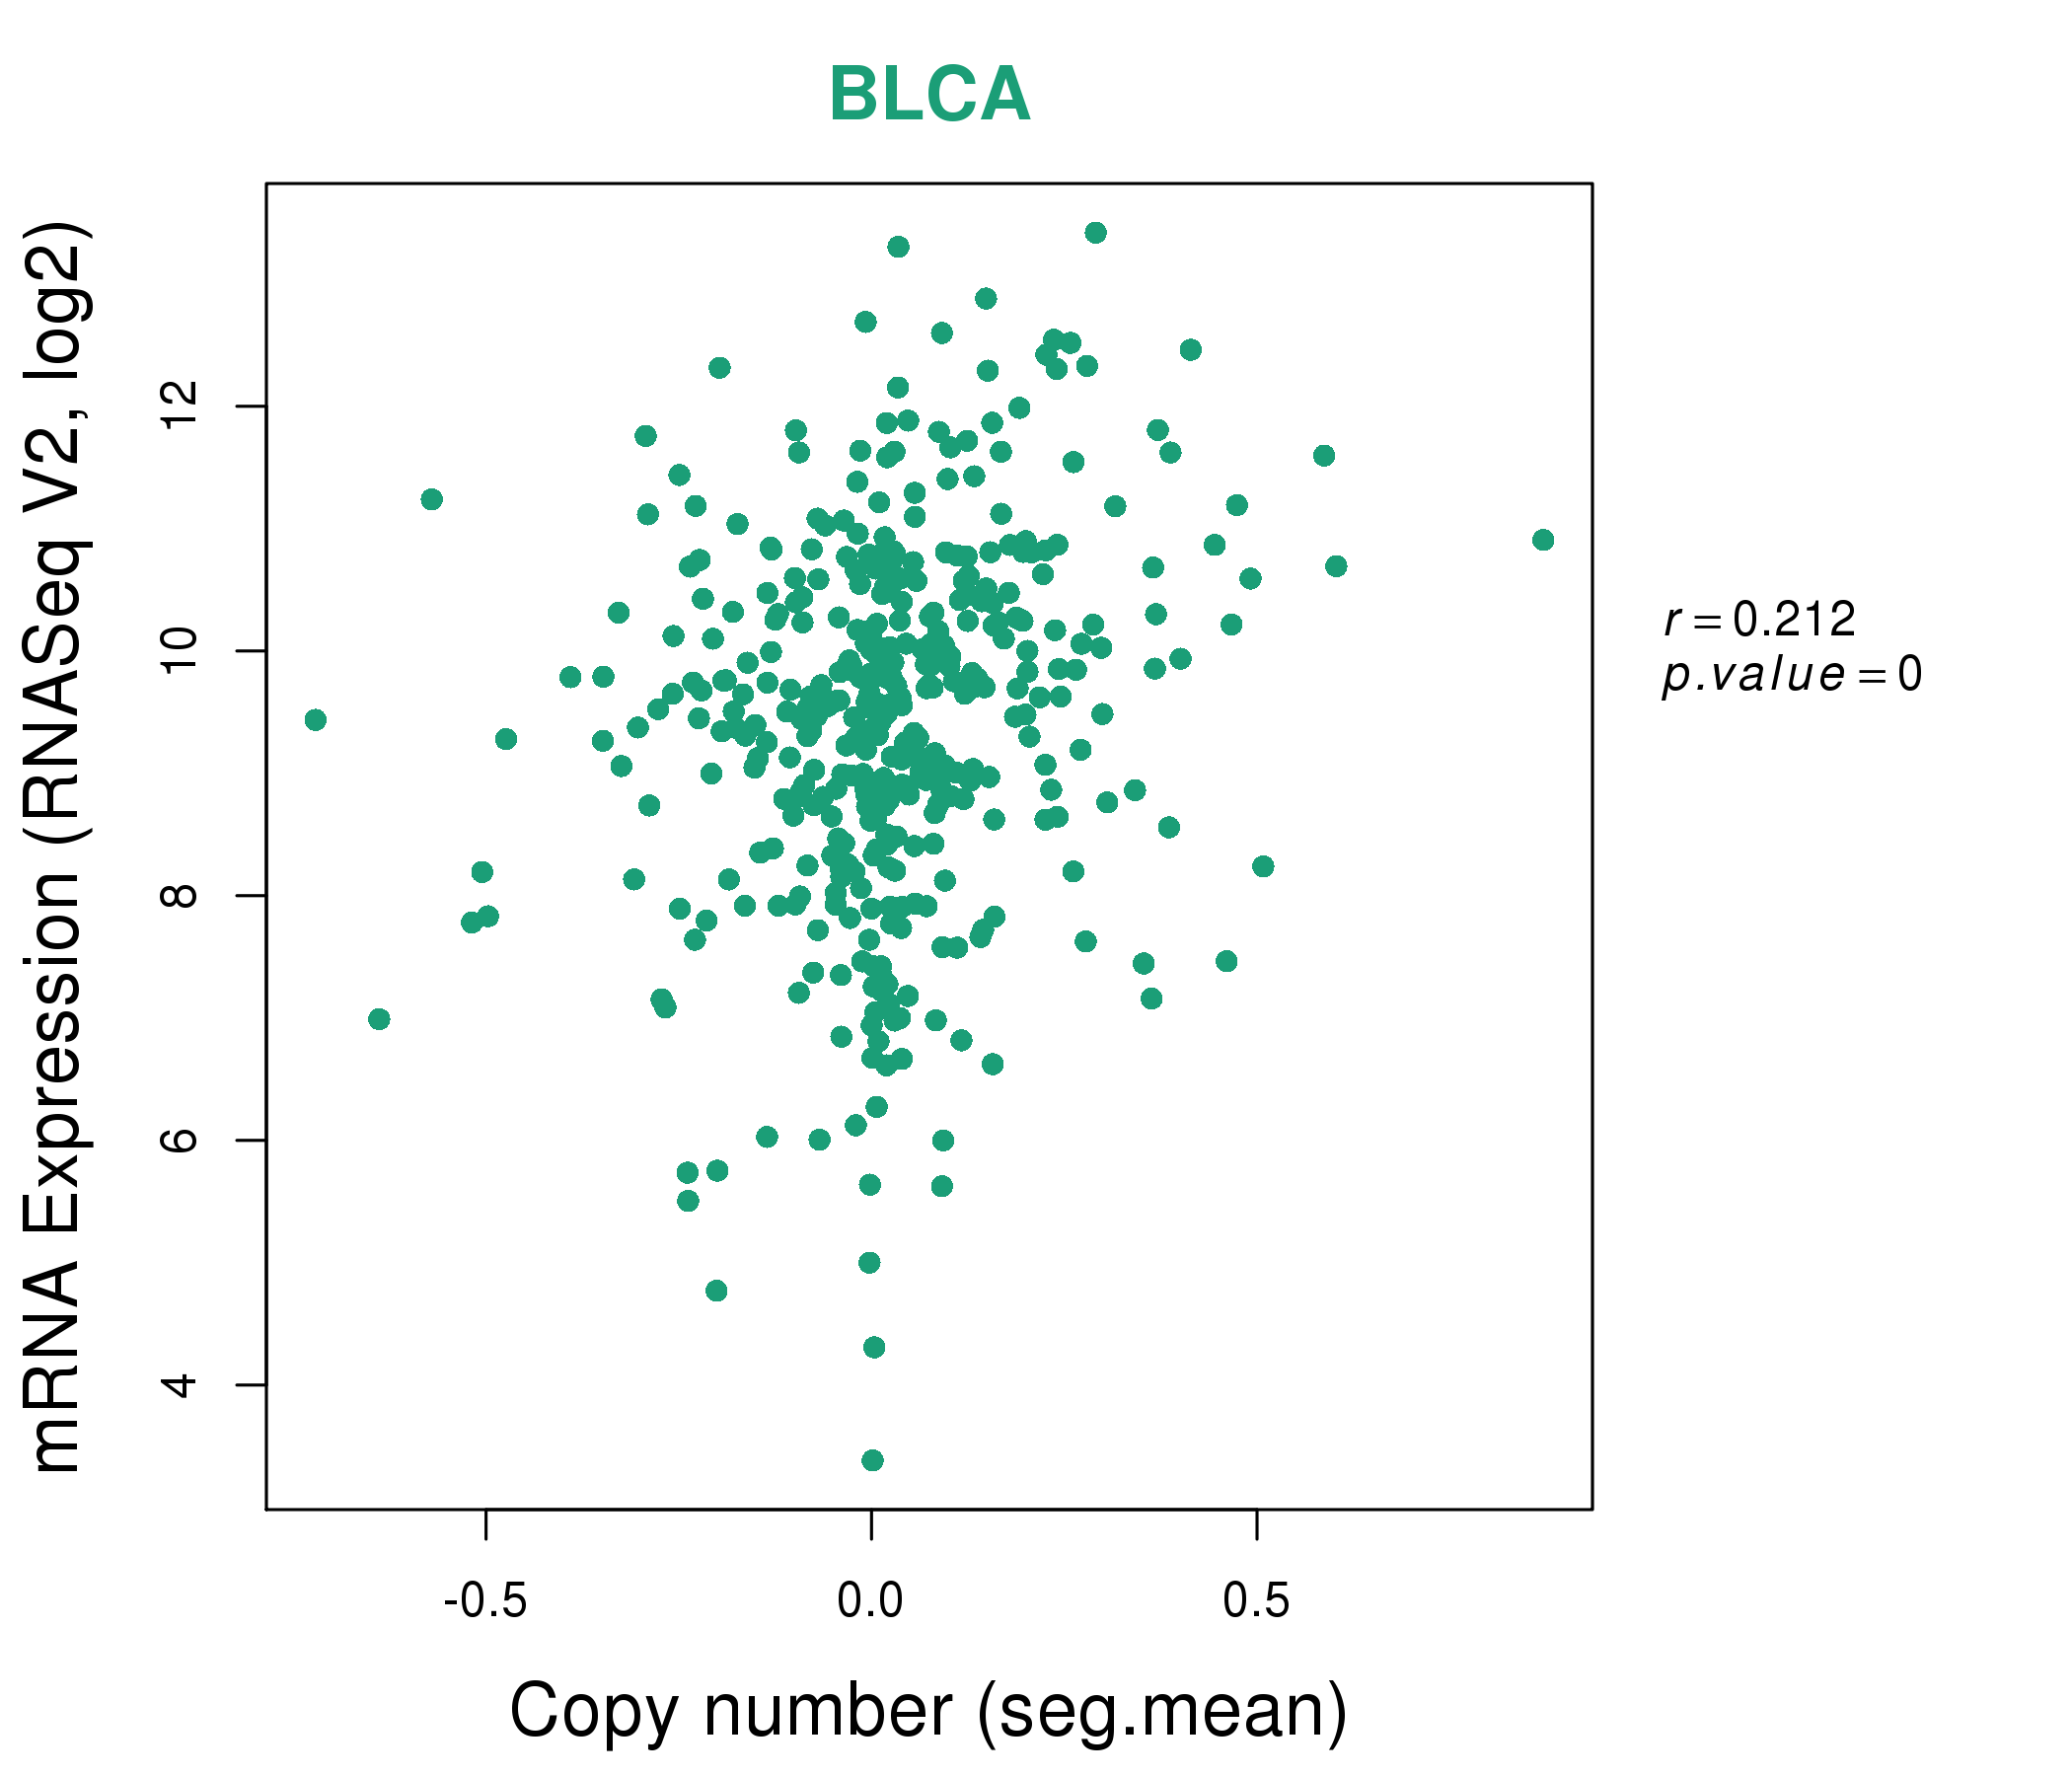
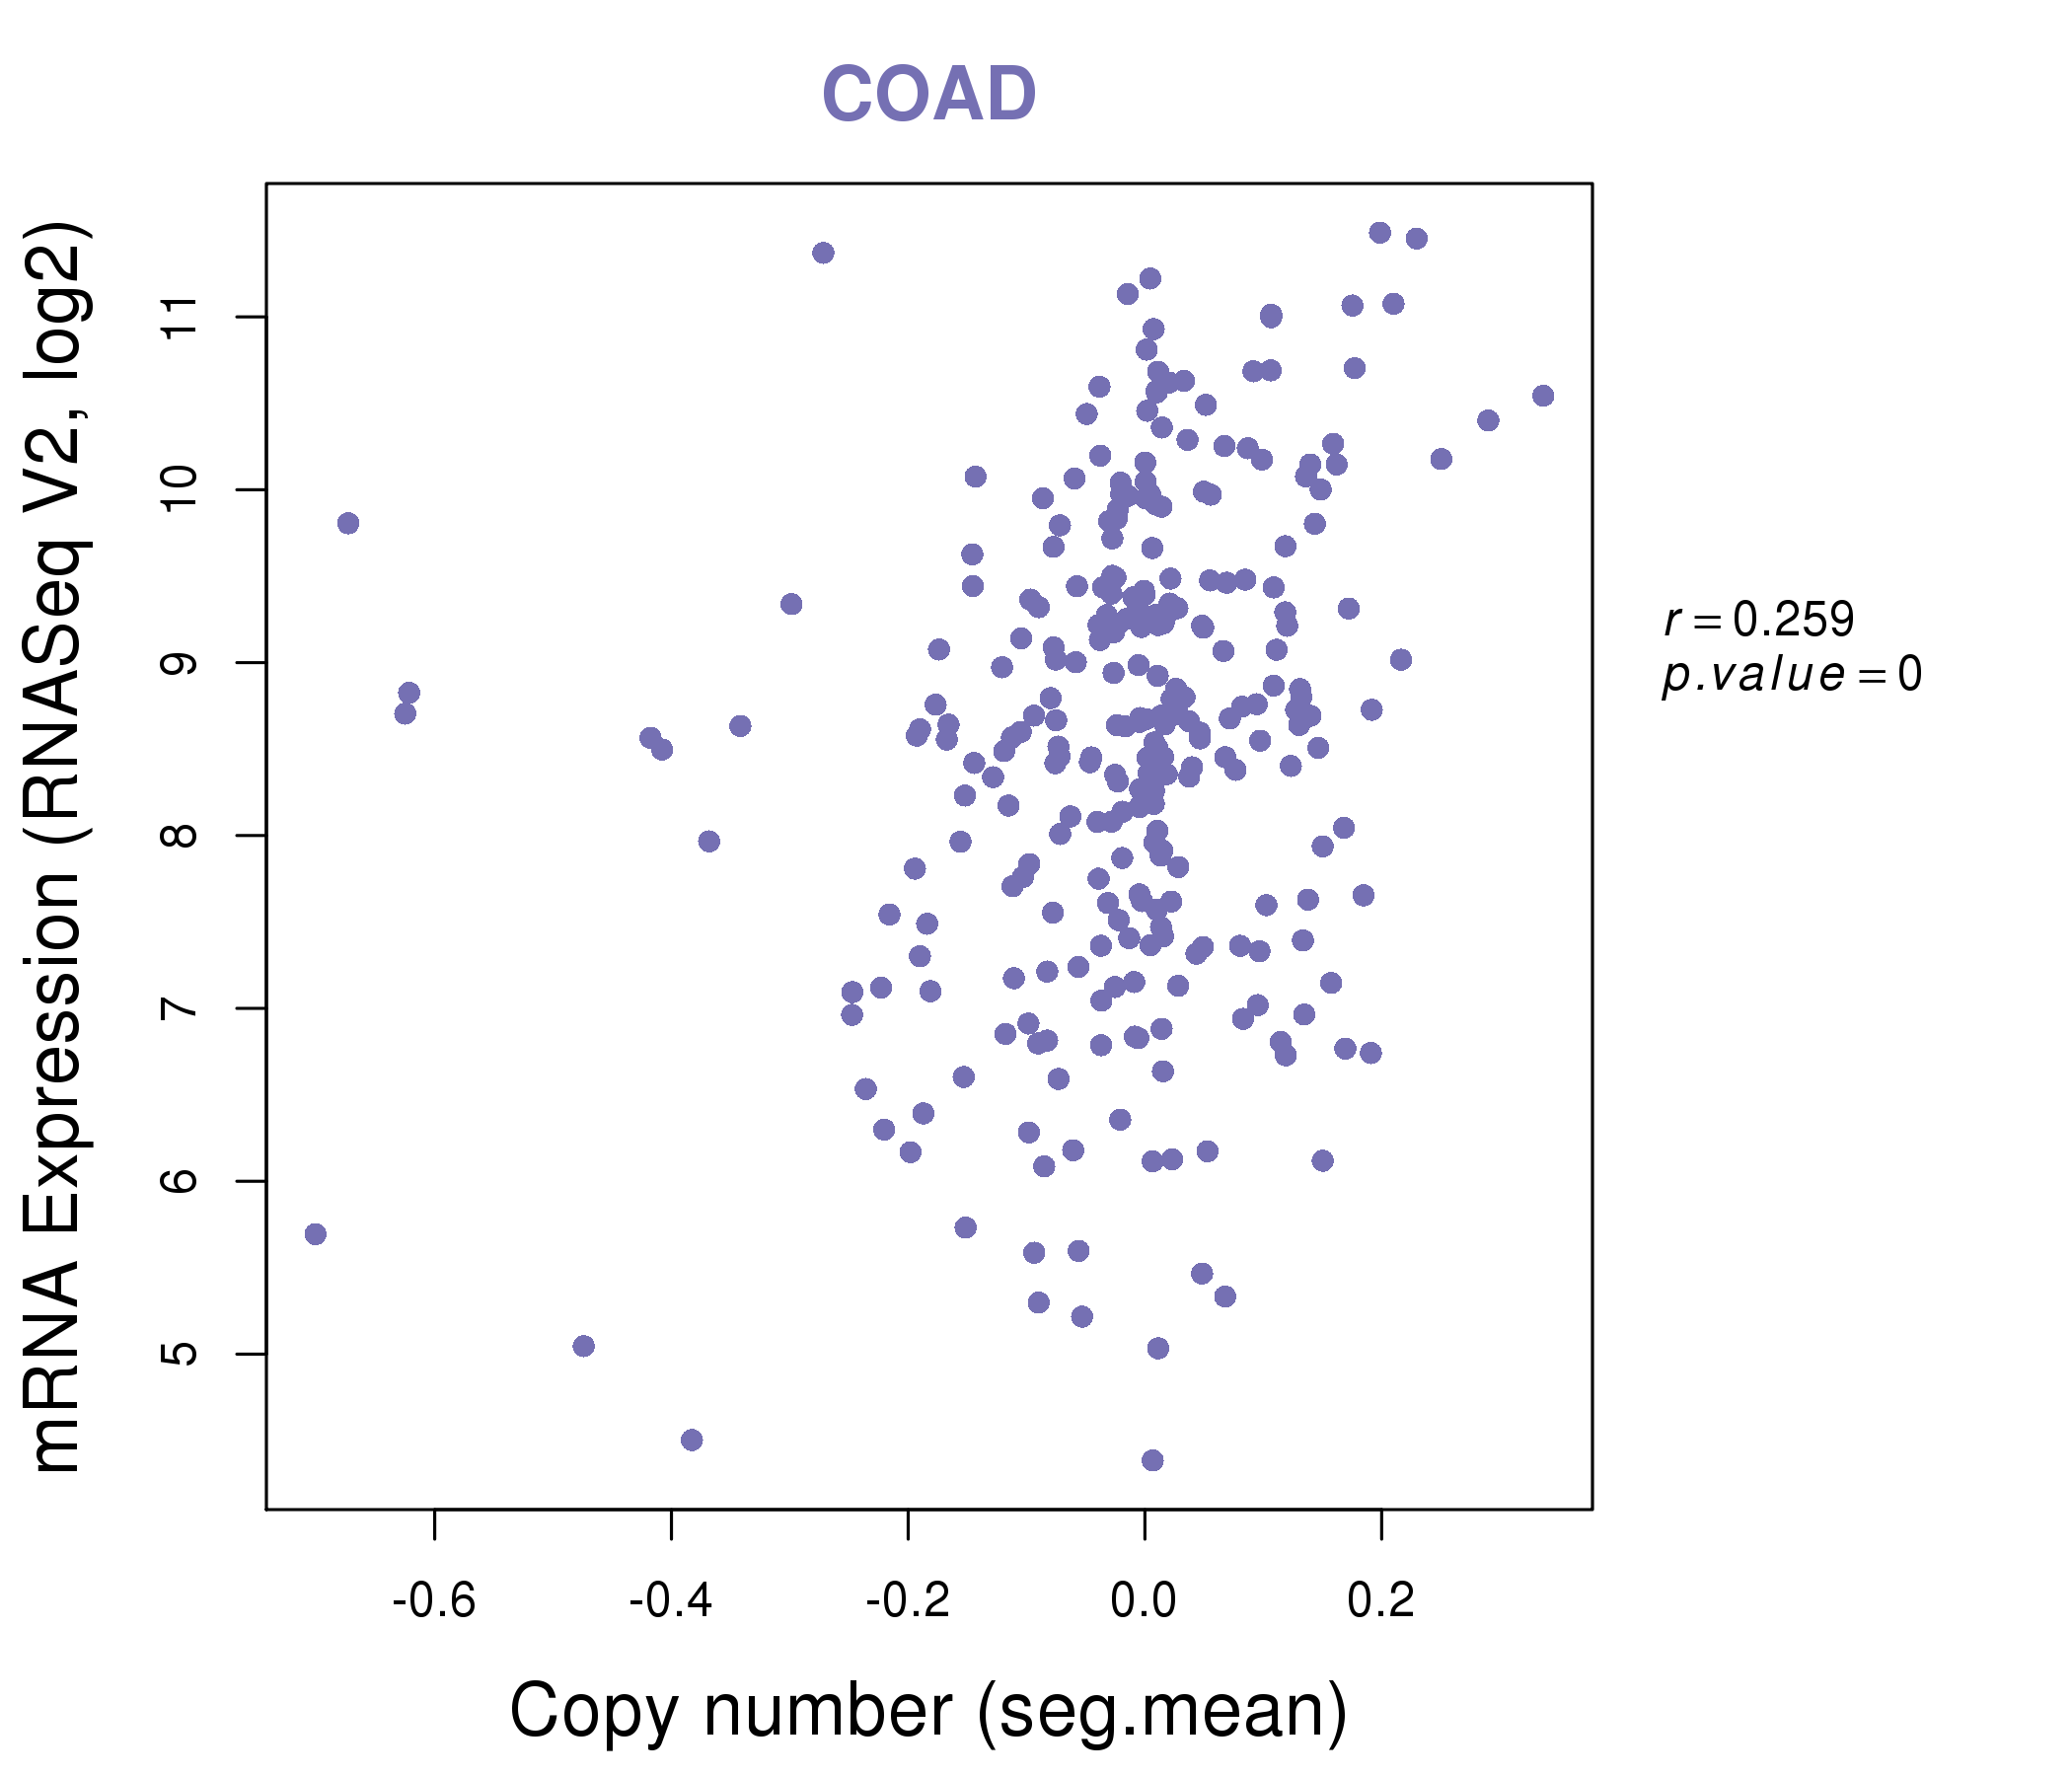
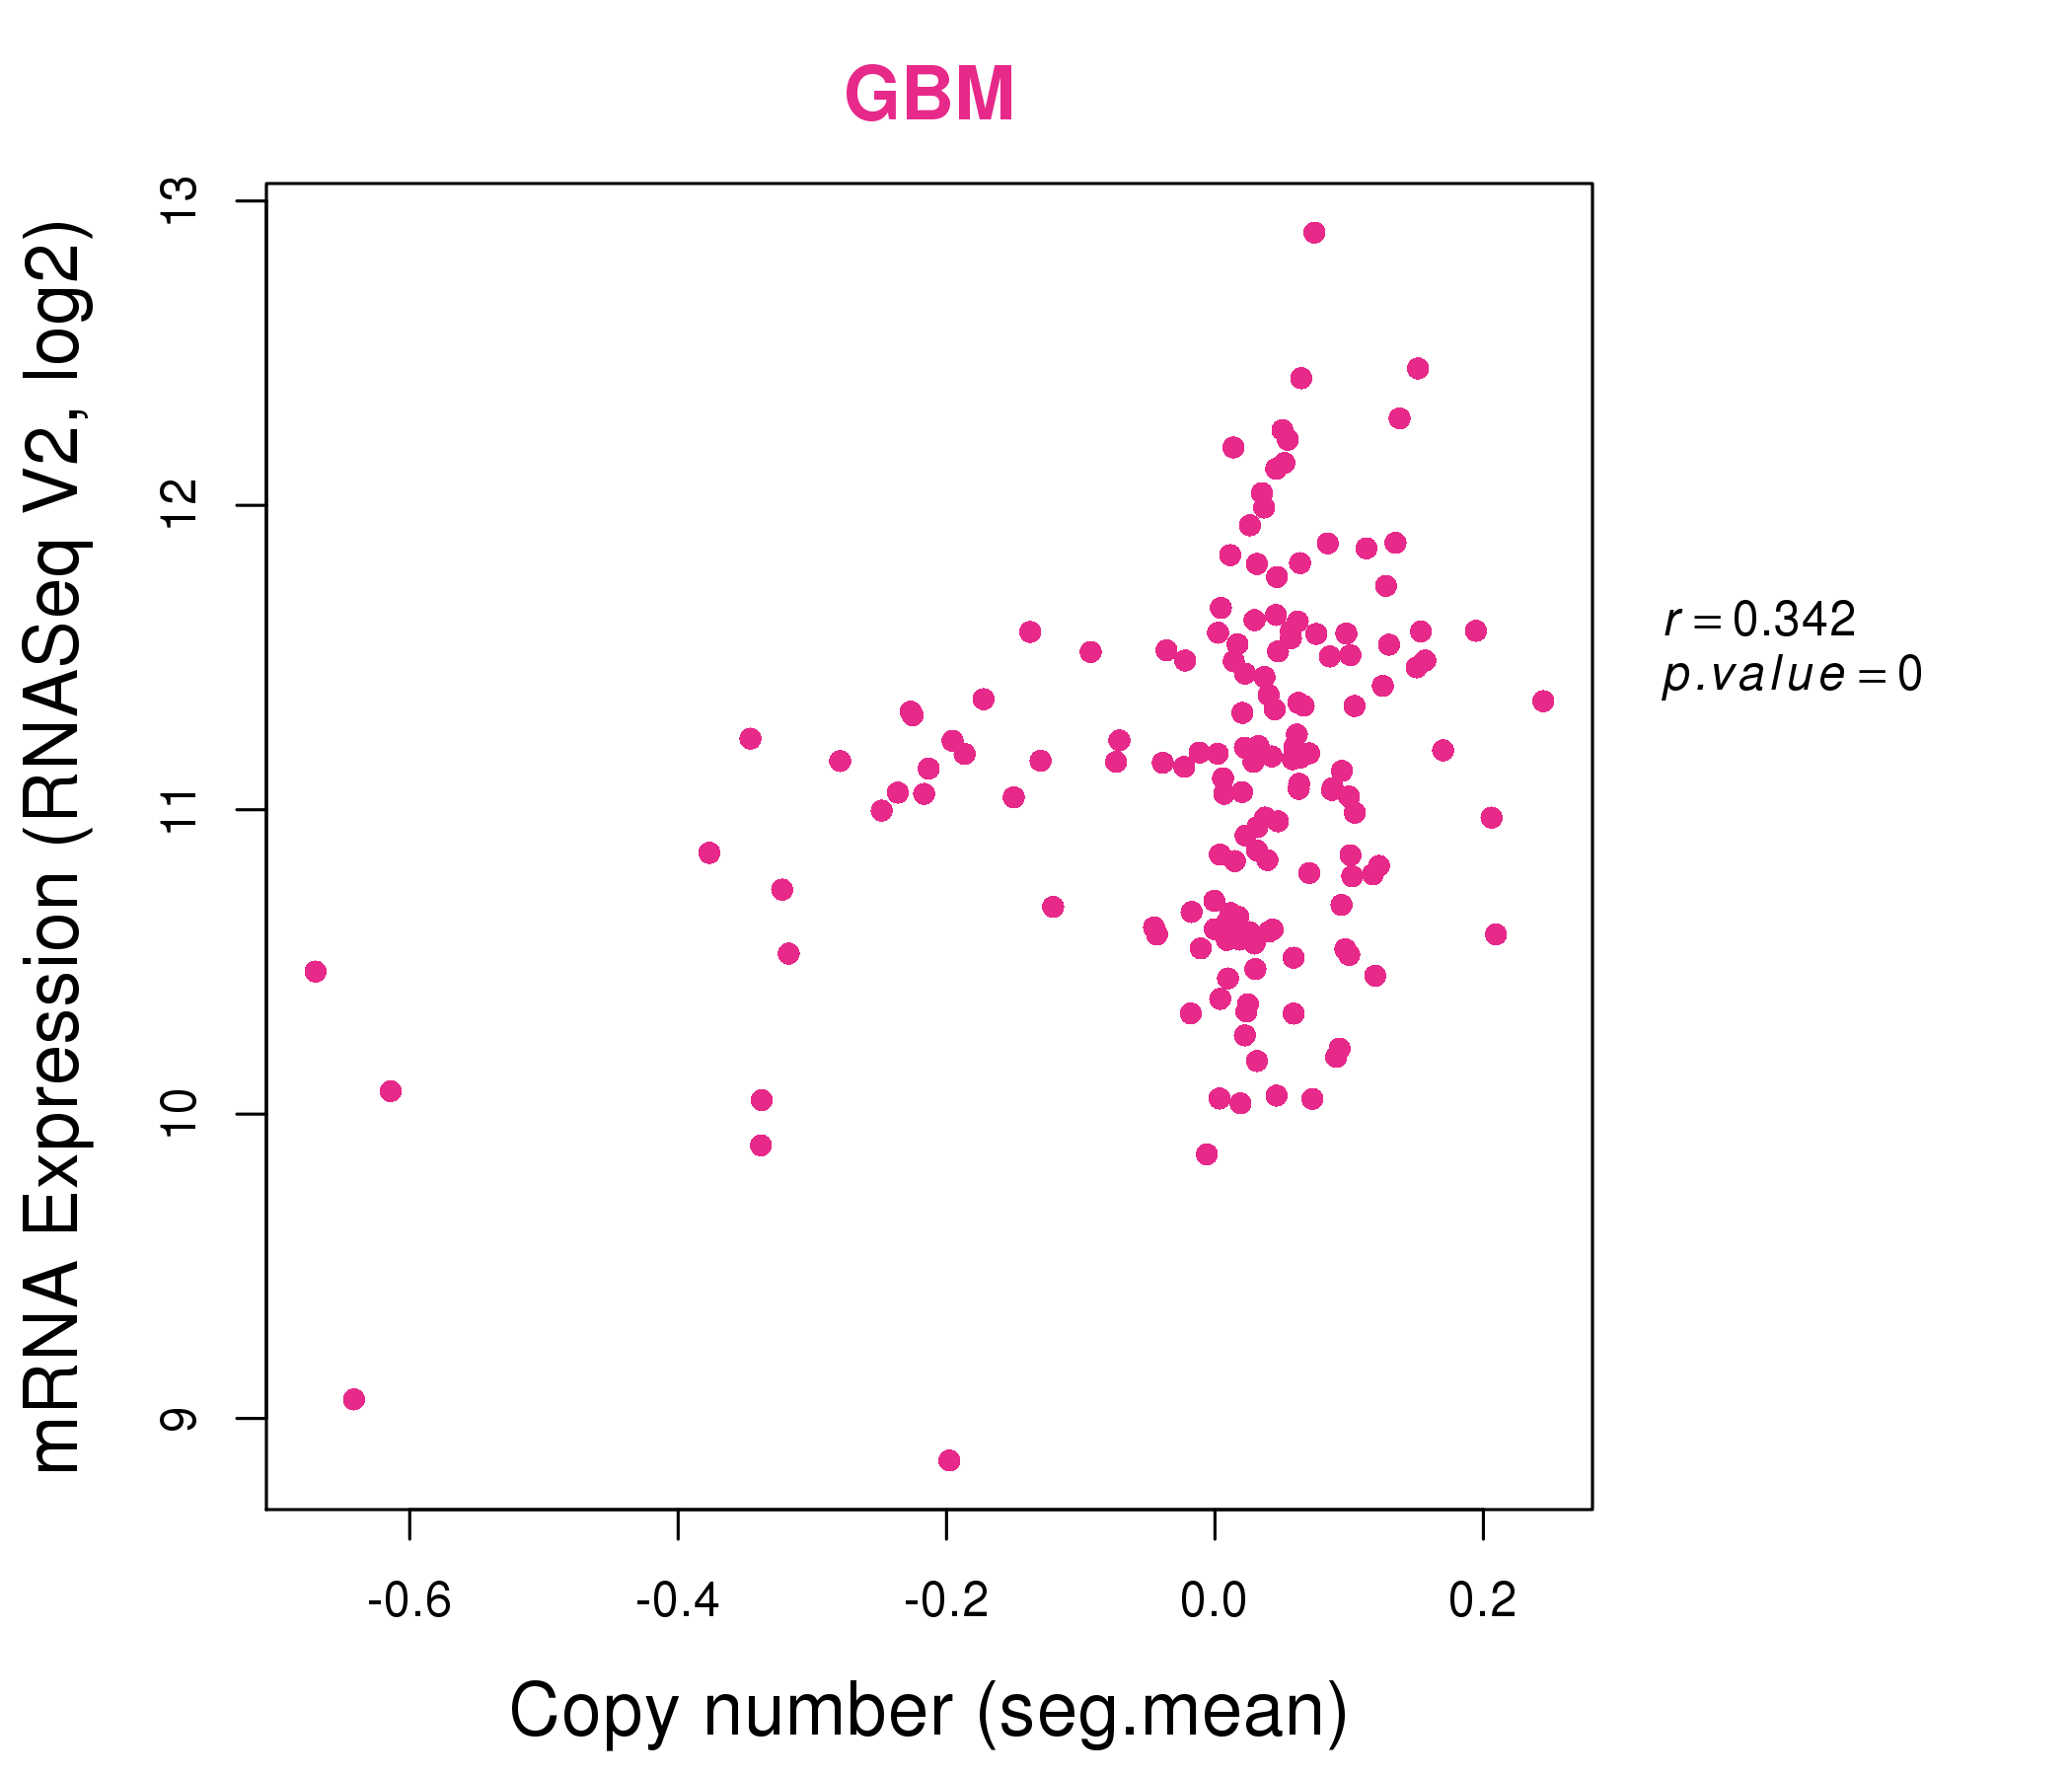
| * Copy number data were extracted from TCGA using R package TCGA-Assembler. The URLs of all public data files on TCGA DCC data server were gathered on Jan-05-2015. Function ProcessCNAData in TCGA-Assembler package was used to obtain gene-level copy number value which is calculated as the average copy number of the genomic region of a gene. |
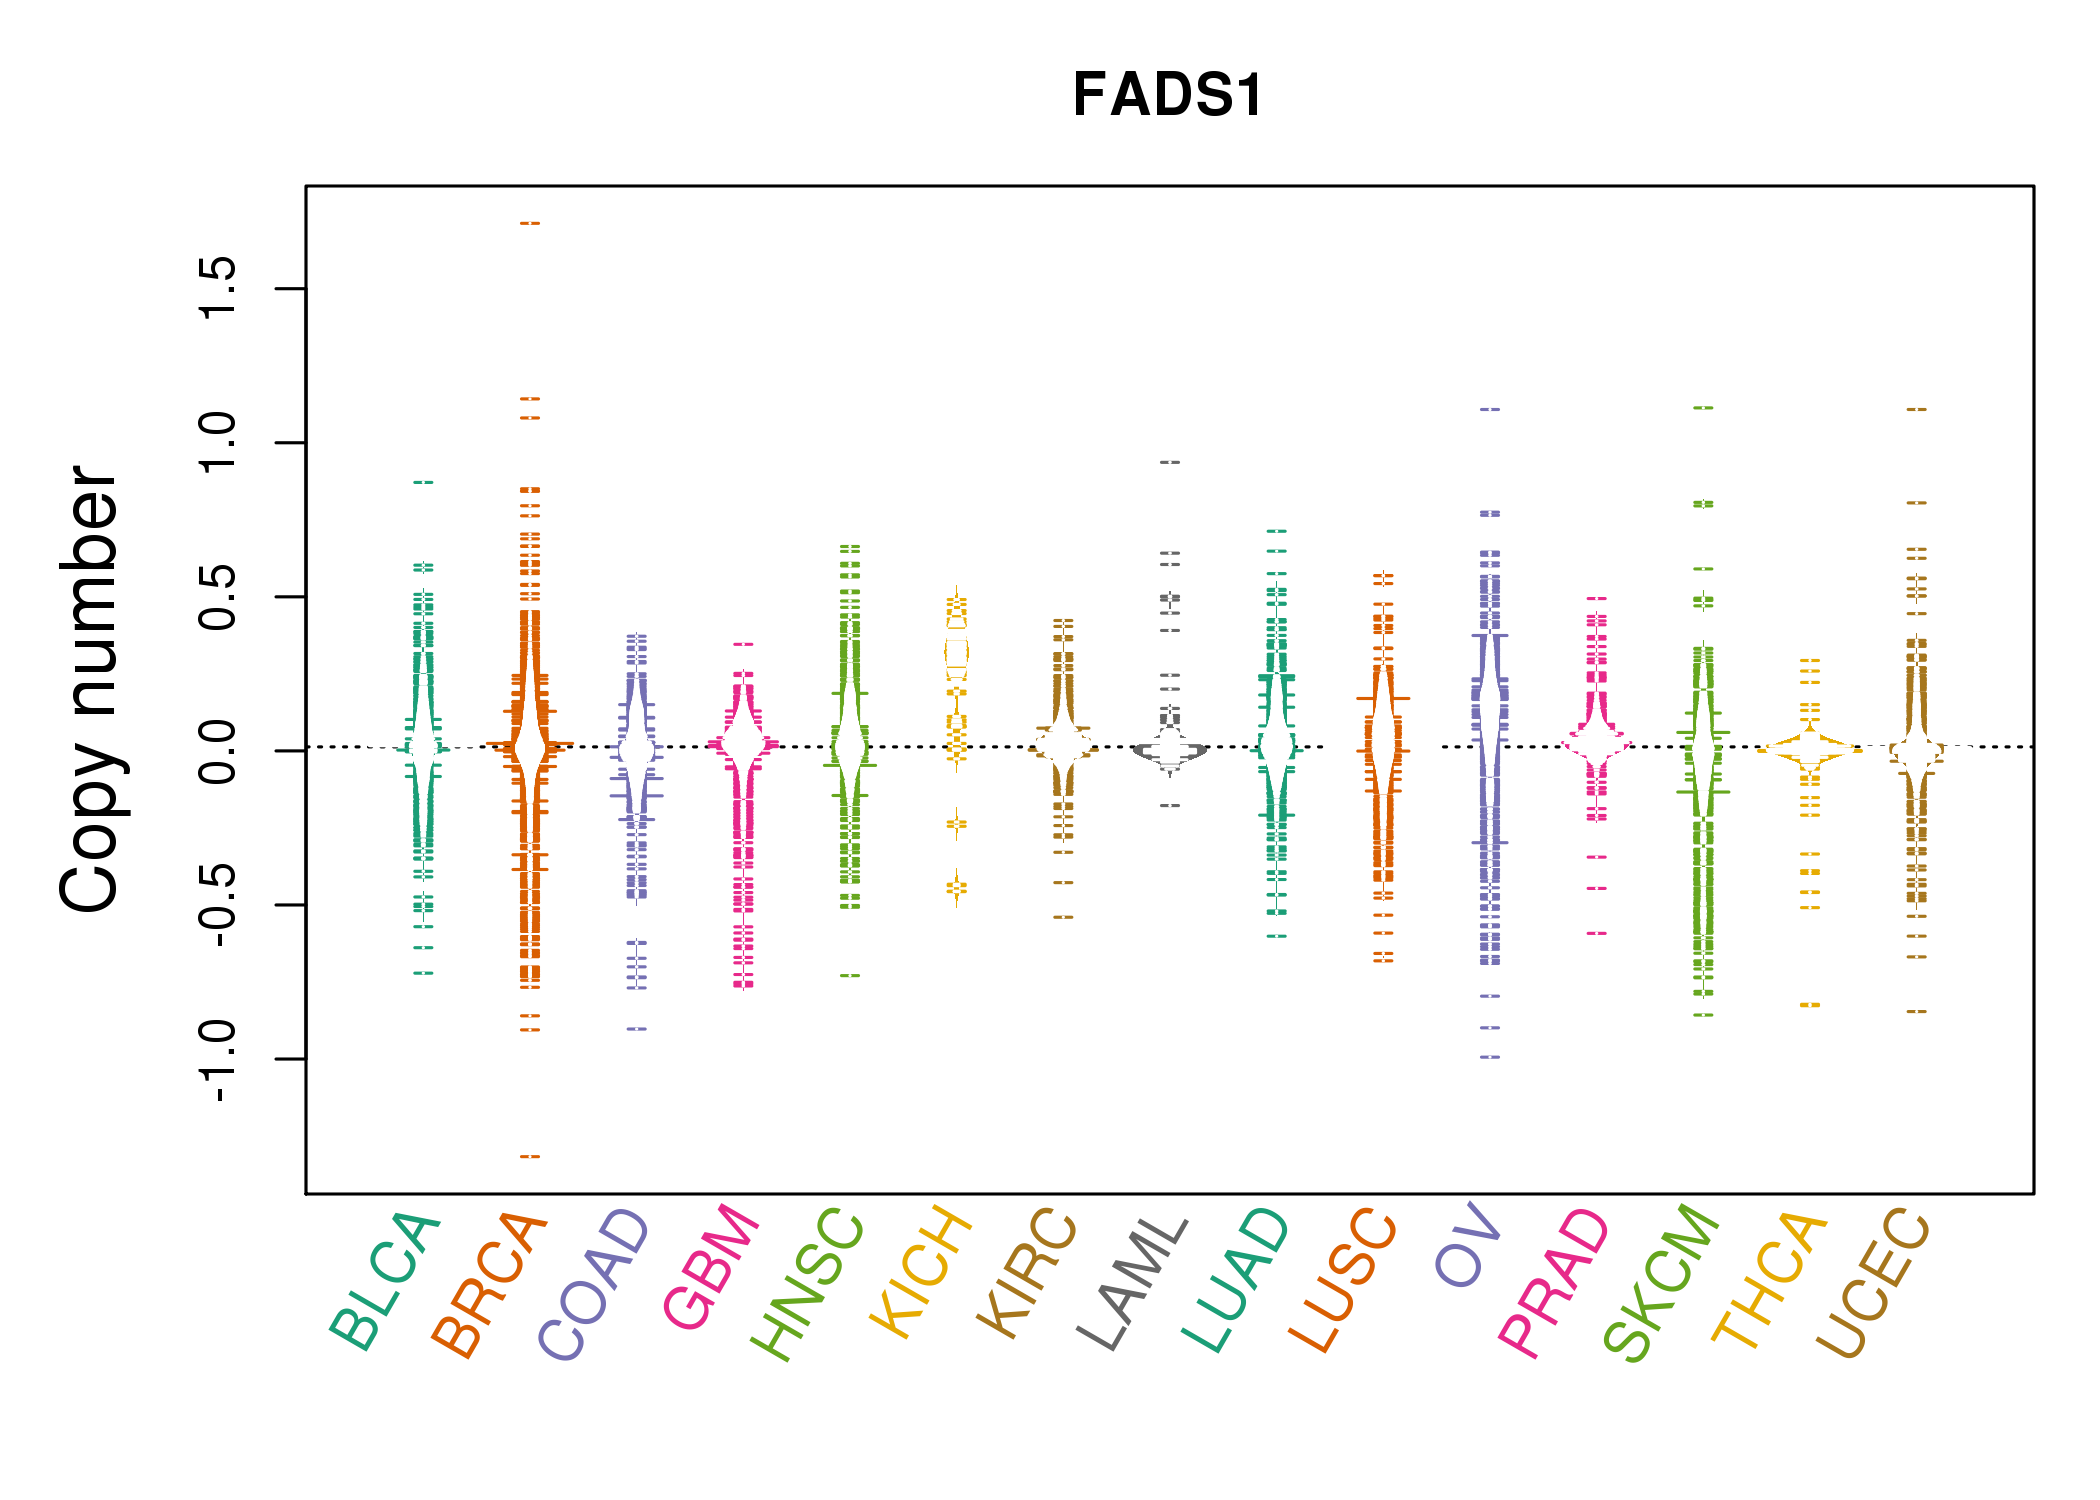 |
| cf) Tissue ID[Tissue type]: BLCA[Bladder Urothelial Carcinoma], BRCA[Breast invasive carcinoma], CESC[Cervical squamous cell carcinoma and endocervical adenocarcinoma], COAD[Colon adenocarcinoma], GBM[Glioblastoma multiforme], Glioma Low Grade, HNSC[Head and Neck squamous cell carcinoma], KICH[Kidney Chromophobe], KIRC[Kidney renal clear cell carcinoma], KIRP[Kidney renal papillary cell carcinoma], LAML[Acute Myeloid Leukemia], LUAD[Lung adenocarcinoma], LUSC[Lung squamous cell carcinoma], OV[Ovarian serous cystadenocarcinoma ], PAAD[Pancreatic adenocarcinoma], PRAD[Prostate adenocarcinoma], SKCM[Skin Cutaneous Melanoma], STAD[Stomach adenocarcinoma], THCA[Thyroid carcinoma], UCEC[Uterine Corpus Endometrial Carcinoma] |
| Top |
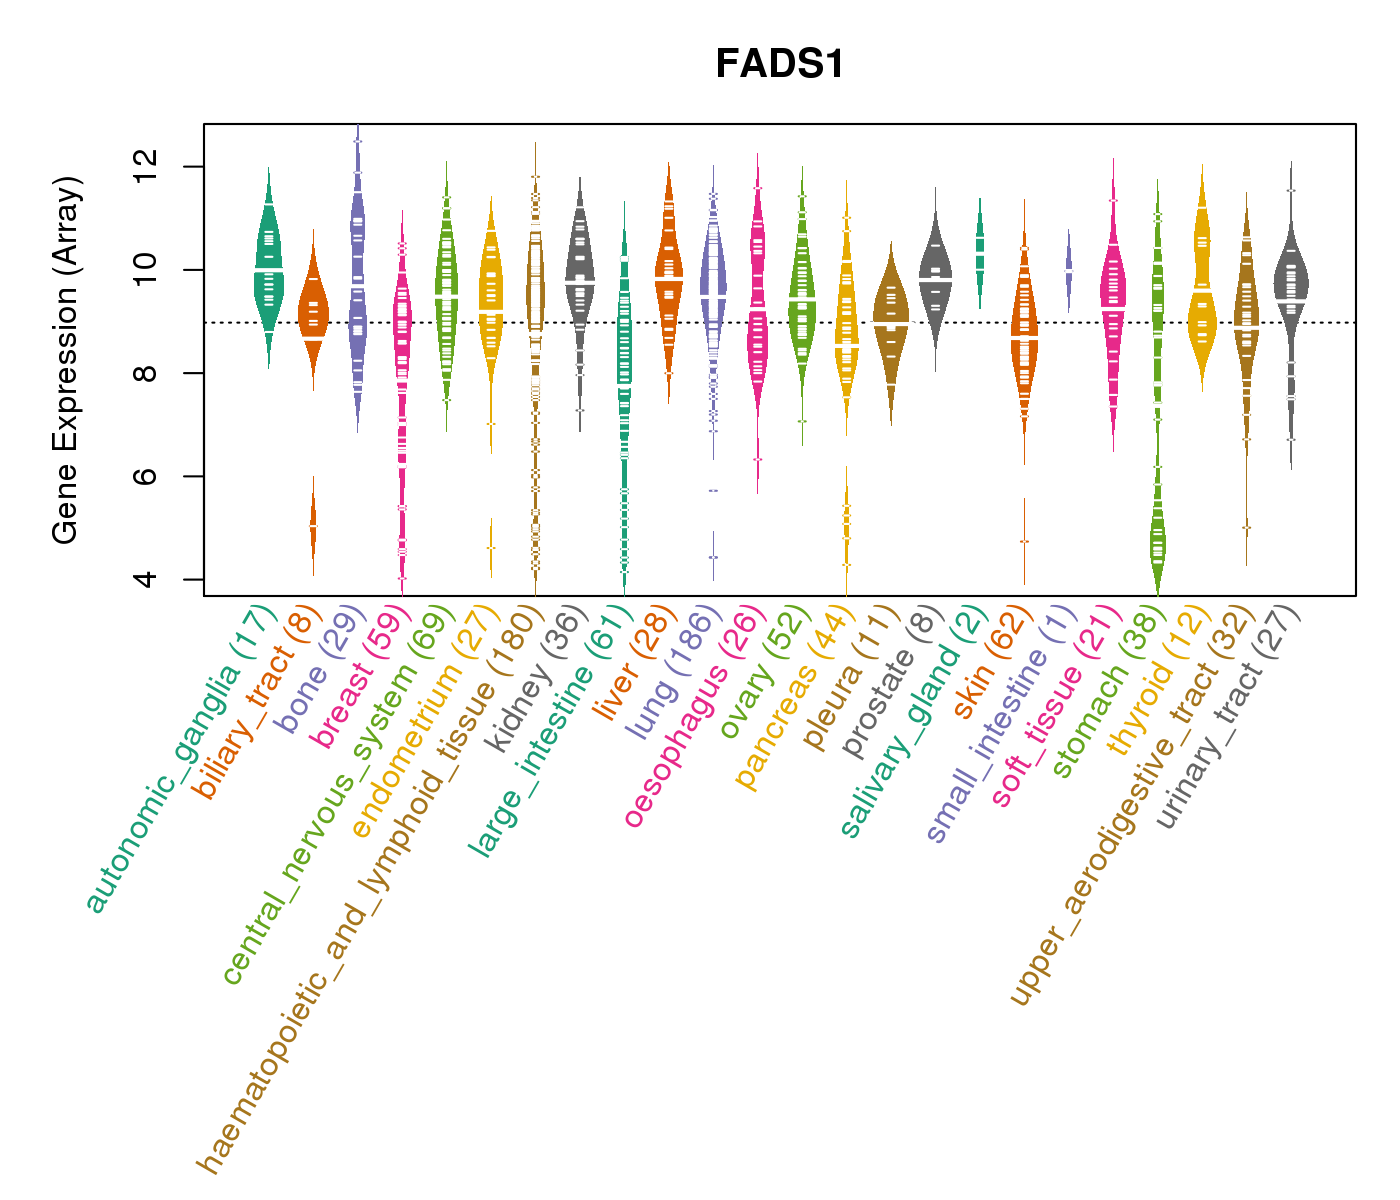
| Gene Expression for FADS1 |
| * CCLE gene expression data were extracted from CCLE_Expression_Entrez_2012-10-18.res: Gene-centric RMA-normalized mRNA expression data. |
 |
| * Normalized gene expression data of RNASeqV2 was extracted from TCGA using R package TCGA-Assembler. The URLs of all public data files on TCGA DCC data server were gathered at Jan-05-2015. Only eight cancer types have enough normal control samples for differential expression analysis. (t test, adjusted p<0.05 (using Benjamini-Hochberg FDR)) |
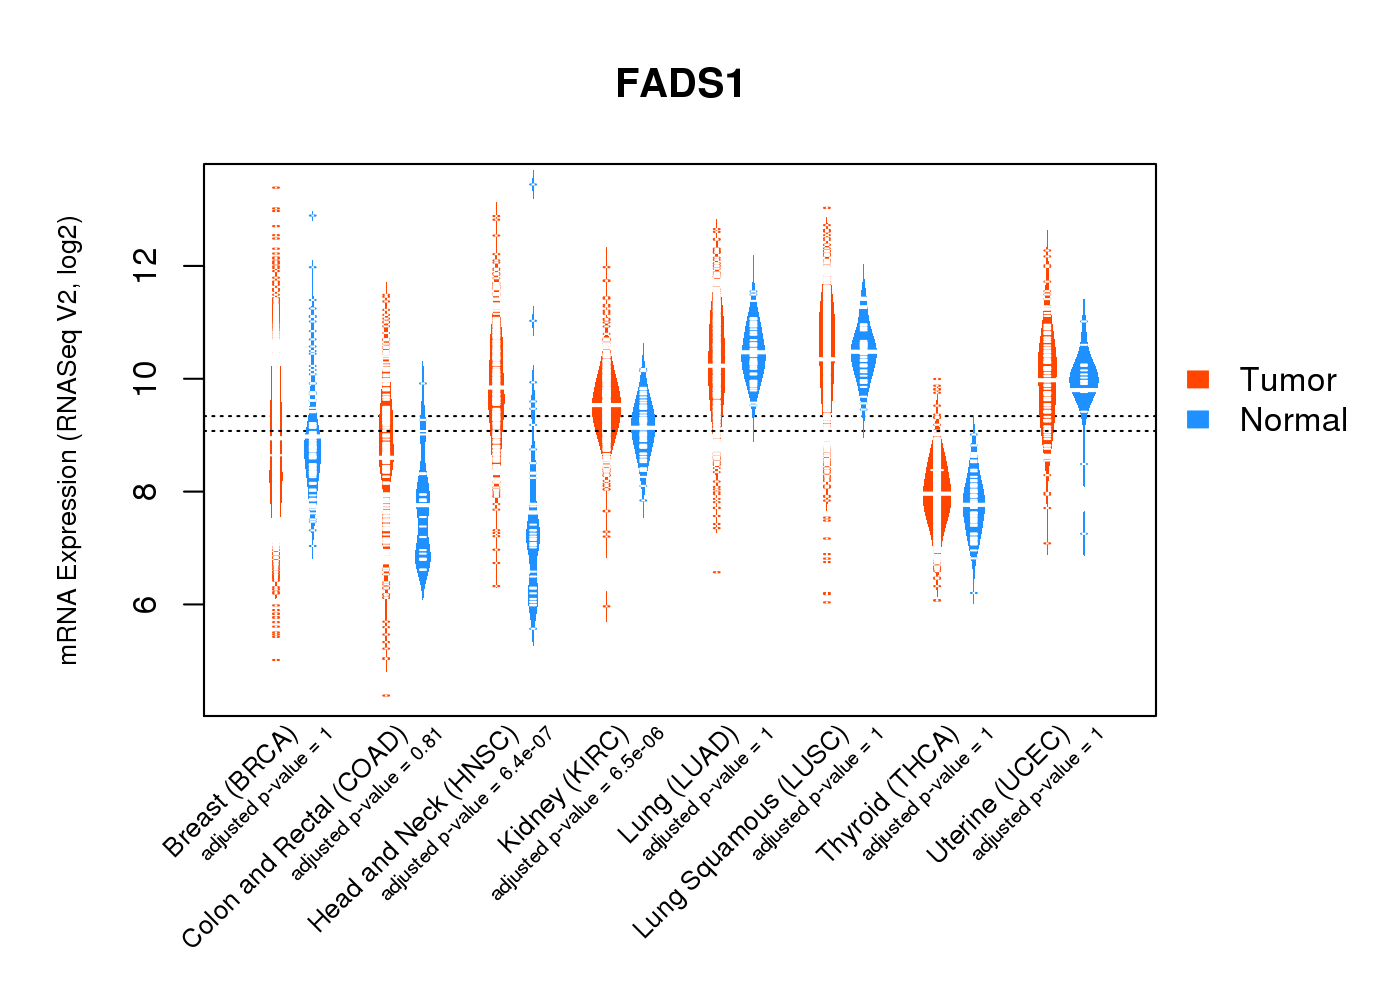 |
| Top |
| * This plots show the correlation between CNV and gene expression. |
: Open all plots for all cancer types
 |
|
 |
|

| Top |
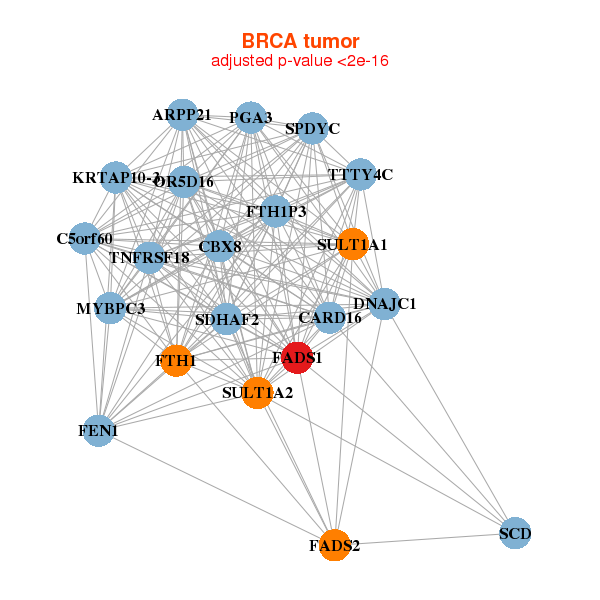
| Gene-Gene Network Information |
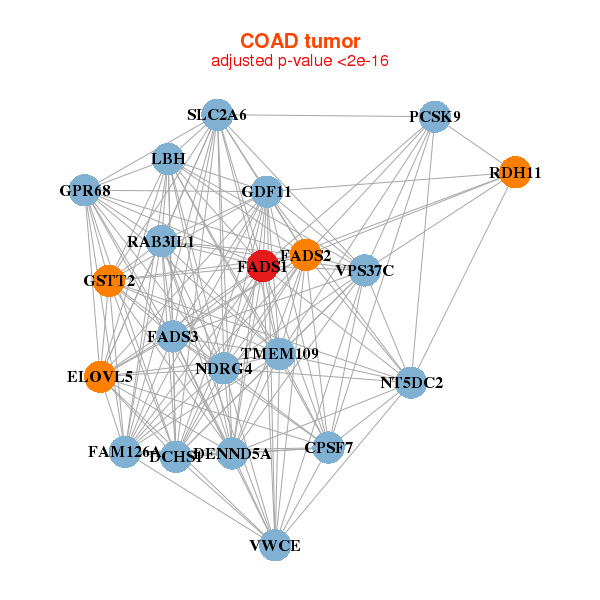
| * Co-Expression network figures were drawn using R package igraph. Only the top 20 genes with the highest correlations were shown. Red circle: input gene, orange circle: cell metabolism gene, sky circle: other gene |
: Open all plots for all cancer types
 |
| ||||
| ARPP21,C5orf60,CARD16,CBX8,DNAJC1,FADS1,FADS2, FEN1,FTH1,FTH1P3,KRTAP10-3,MYBPC3,OR5D16,PGA3, SCD,SDHAF2,SPDYC,SULT1A1,SULT1A2,TNFRSF18,TTTY4C | ACACA,ACLY,ACSS2,C8orf34,CDKN2C,CPA2,CRHBP, DMRTA1,ECHDC1,ELOVL6,FADS1,FASN,GPR50,ME1, NKX2-4,OLFM2,SCD,SEL1L2,SPZ1,TF,TMEM132B | ||||
 |
| ||||
| CPSF7,DCHS1,DENND5A,ELOVL5,FADS1,FADS2,FADS3, FAM126A,GDF11,GPR68,GSTT2,LBH,NDRG4,NT5DC2, PCSK9,RAB3IL1,RDH11,SLC2A6,TMEM109,VPS37C,VWCE | ARL9,LURAP1,MIR99AHG,CALU,ELOVL5,FADS1,FKBP14, GDF11,GMPR,GNB4,GUCY1B3,KCND3,MRAS,NRSN2, PRAF2,PTP4A3,RAB31,SULF1,TMEM45A,ZCCHC24,ZNF385D |
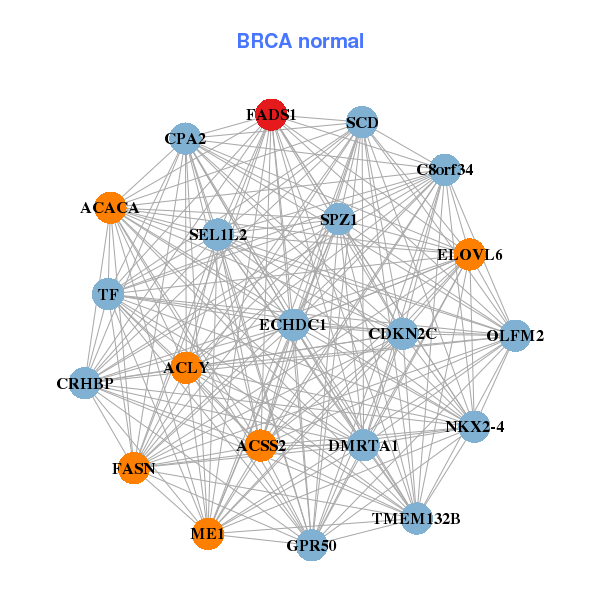
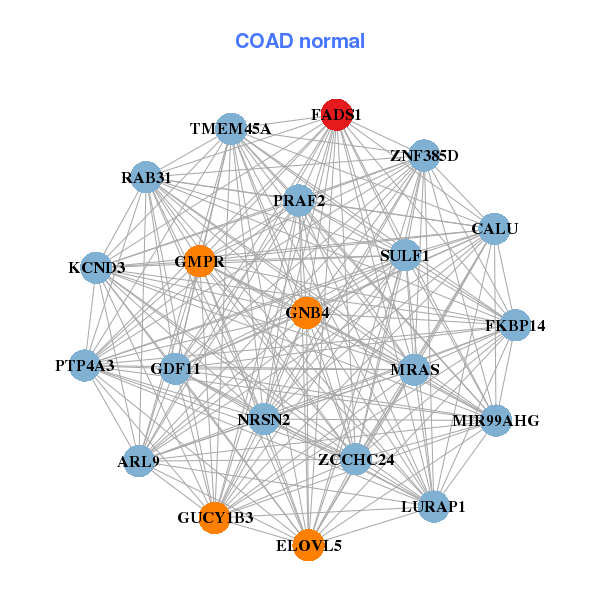
| * Co-Expression network figures were drawn using R package igraph. Only the top 20 genes with the highest correlations were shown. Red circle: input gene, orange circle: cell metabolism gene, sky circle: other gene |
: Open all plots for all cancer types
| Top |
: Open all interacting genes' information including KEGG pathway for all interacting genes from DAVID
| Top |
| Pharmacological Information for FADS1 |
| DB Category | DB Name | DB's ID and Url link |
| * Gene Centered Interaction Network. |
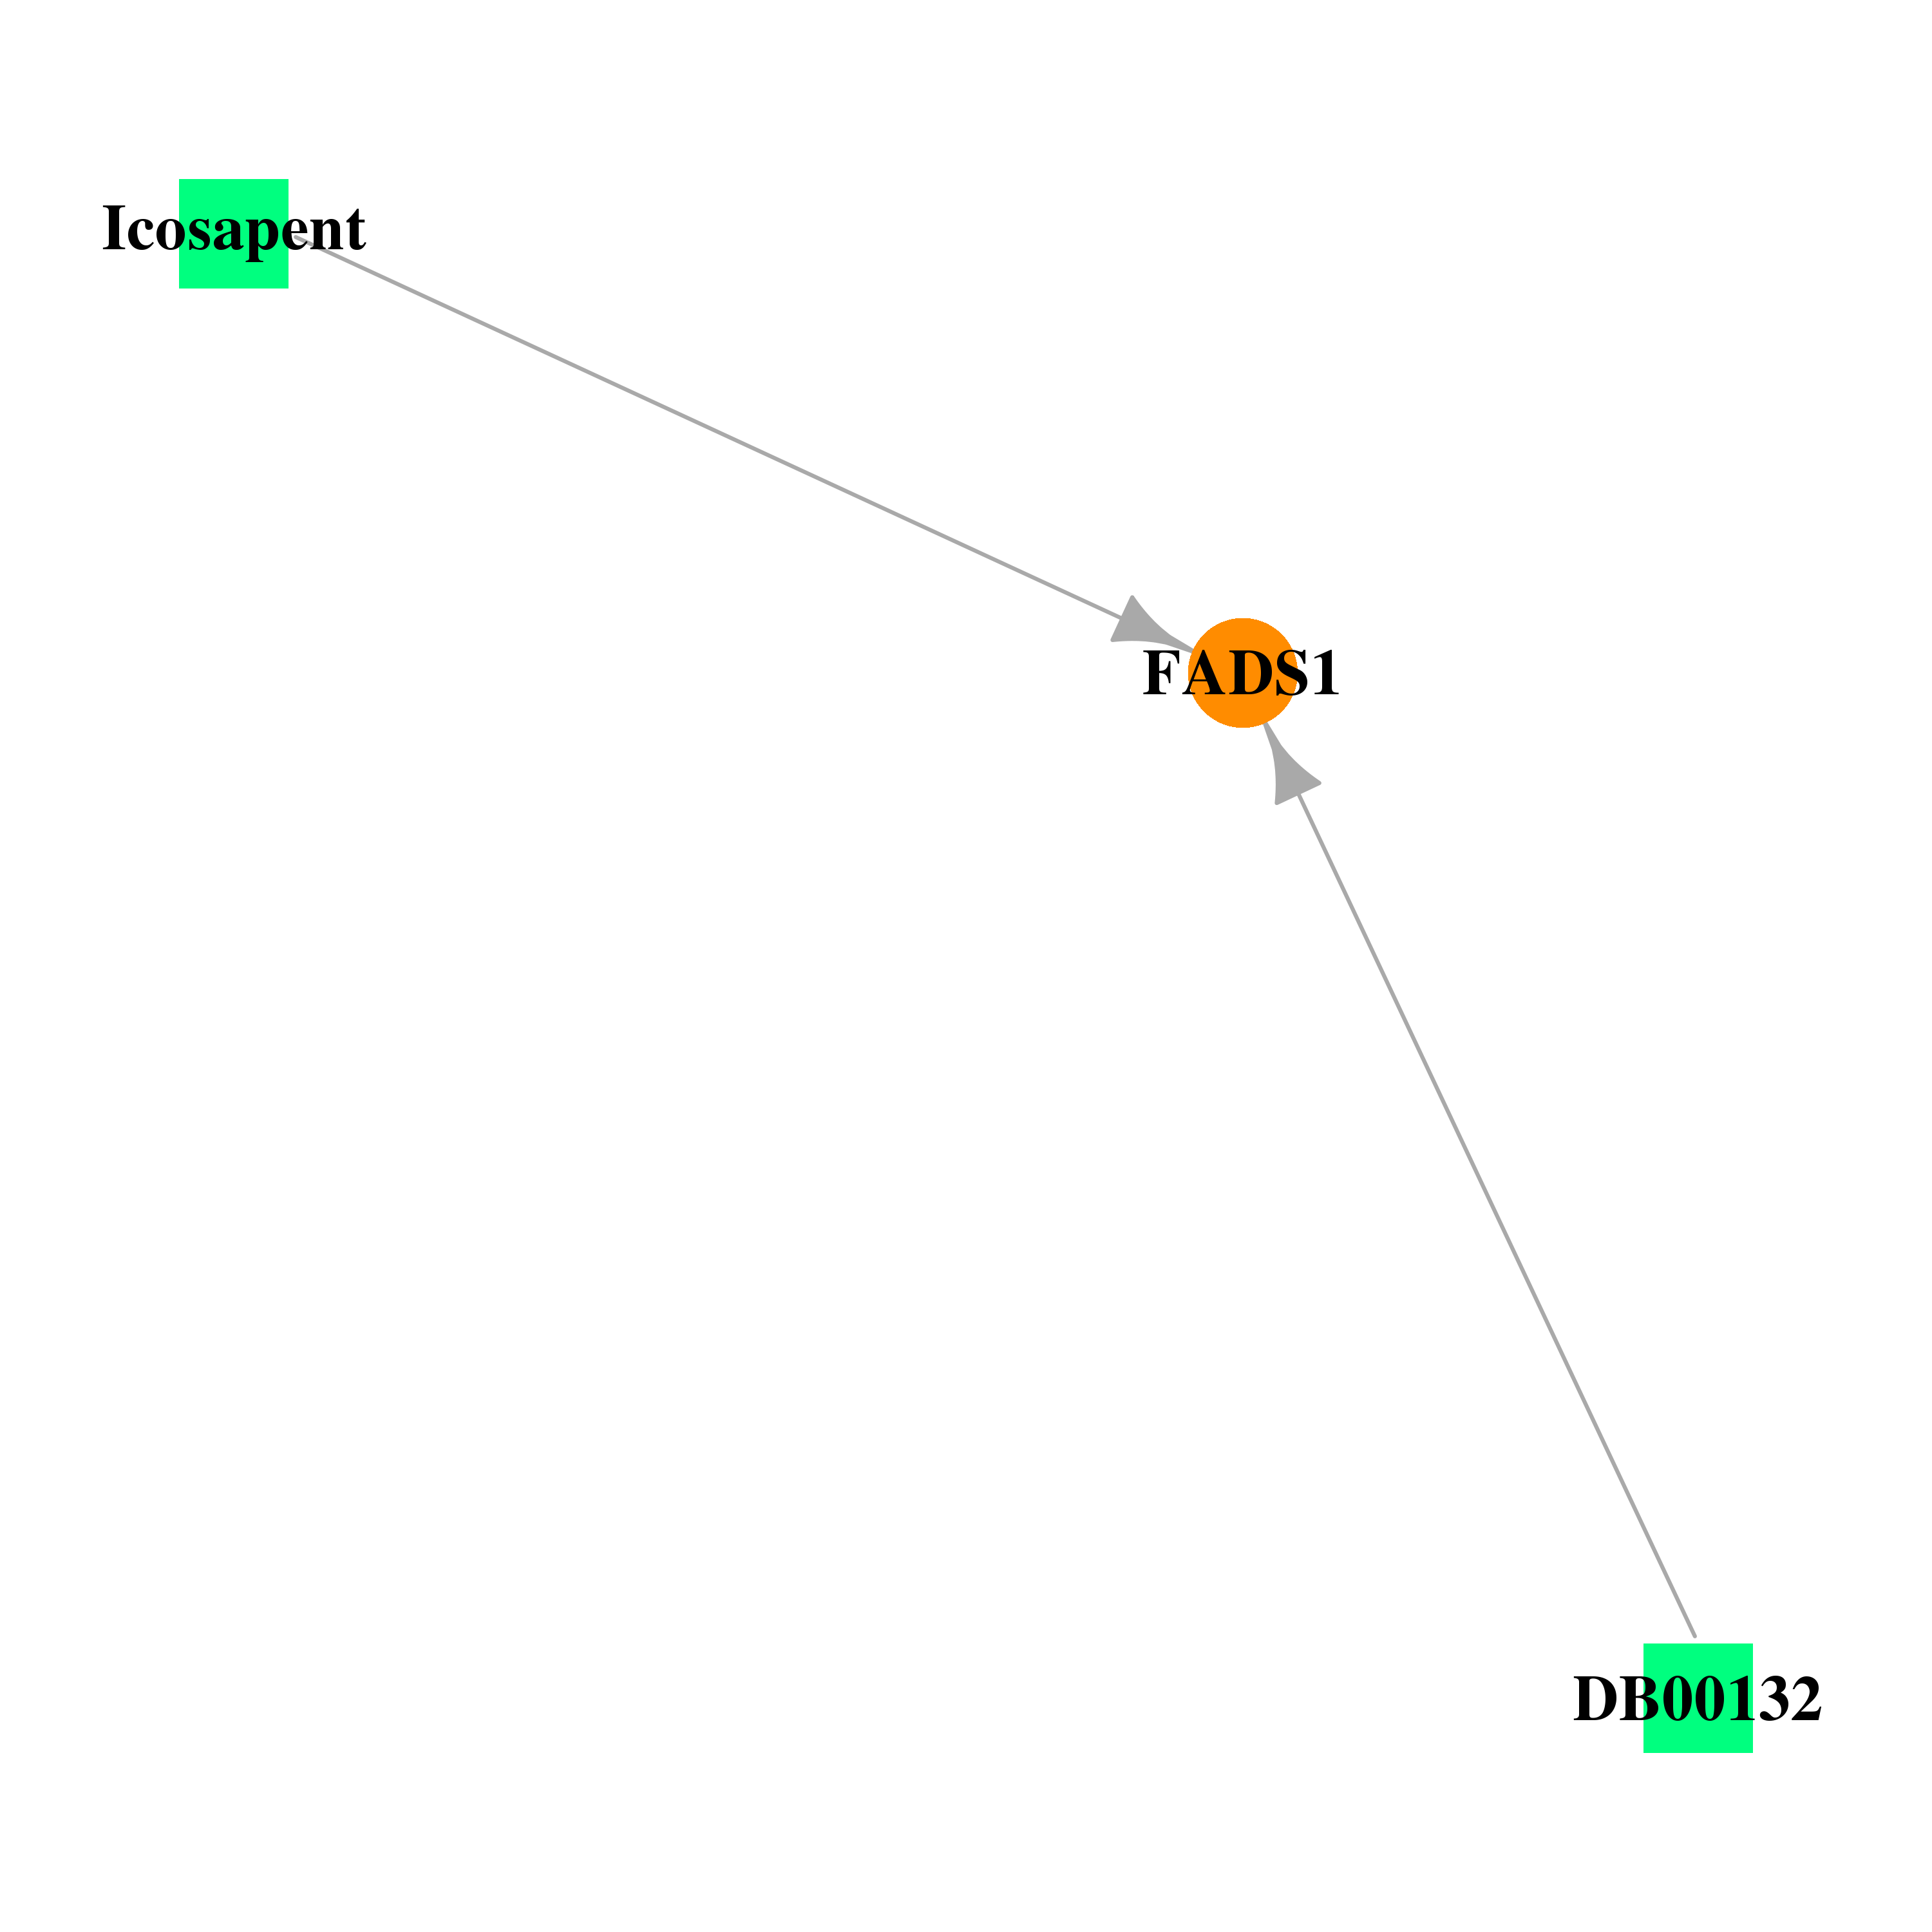 |
| * Drug Centered Interaction Network. |
| DrugBank ID | Target Name | Drug Groups | Generic Name | Drug Centered Network | Drug Structure |
| DB00132 | fatty acid desaturase 1 | approved; nutraceutical | Alpha-Linolenic Acid |  | 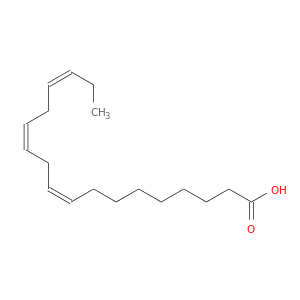 |
| DB00159 | fatty acid desaturase 1 | approved; nutraceutical | Icosapent | 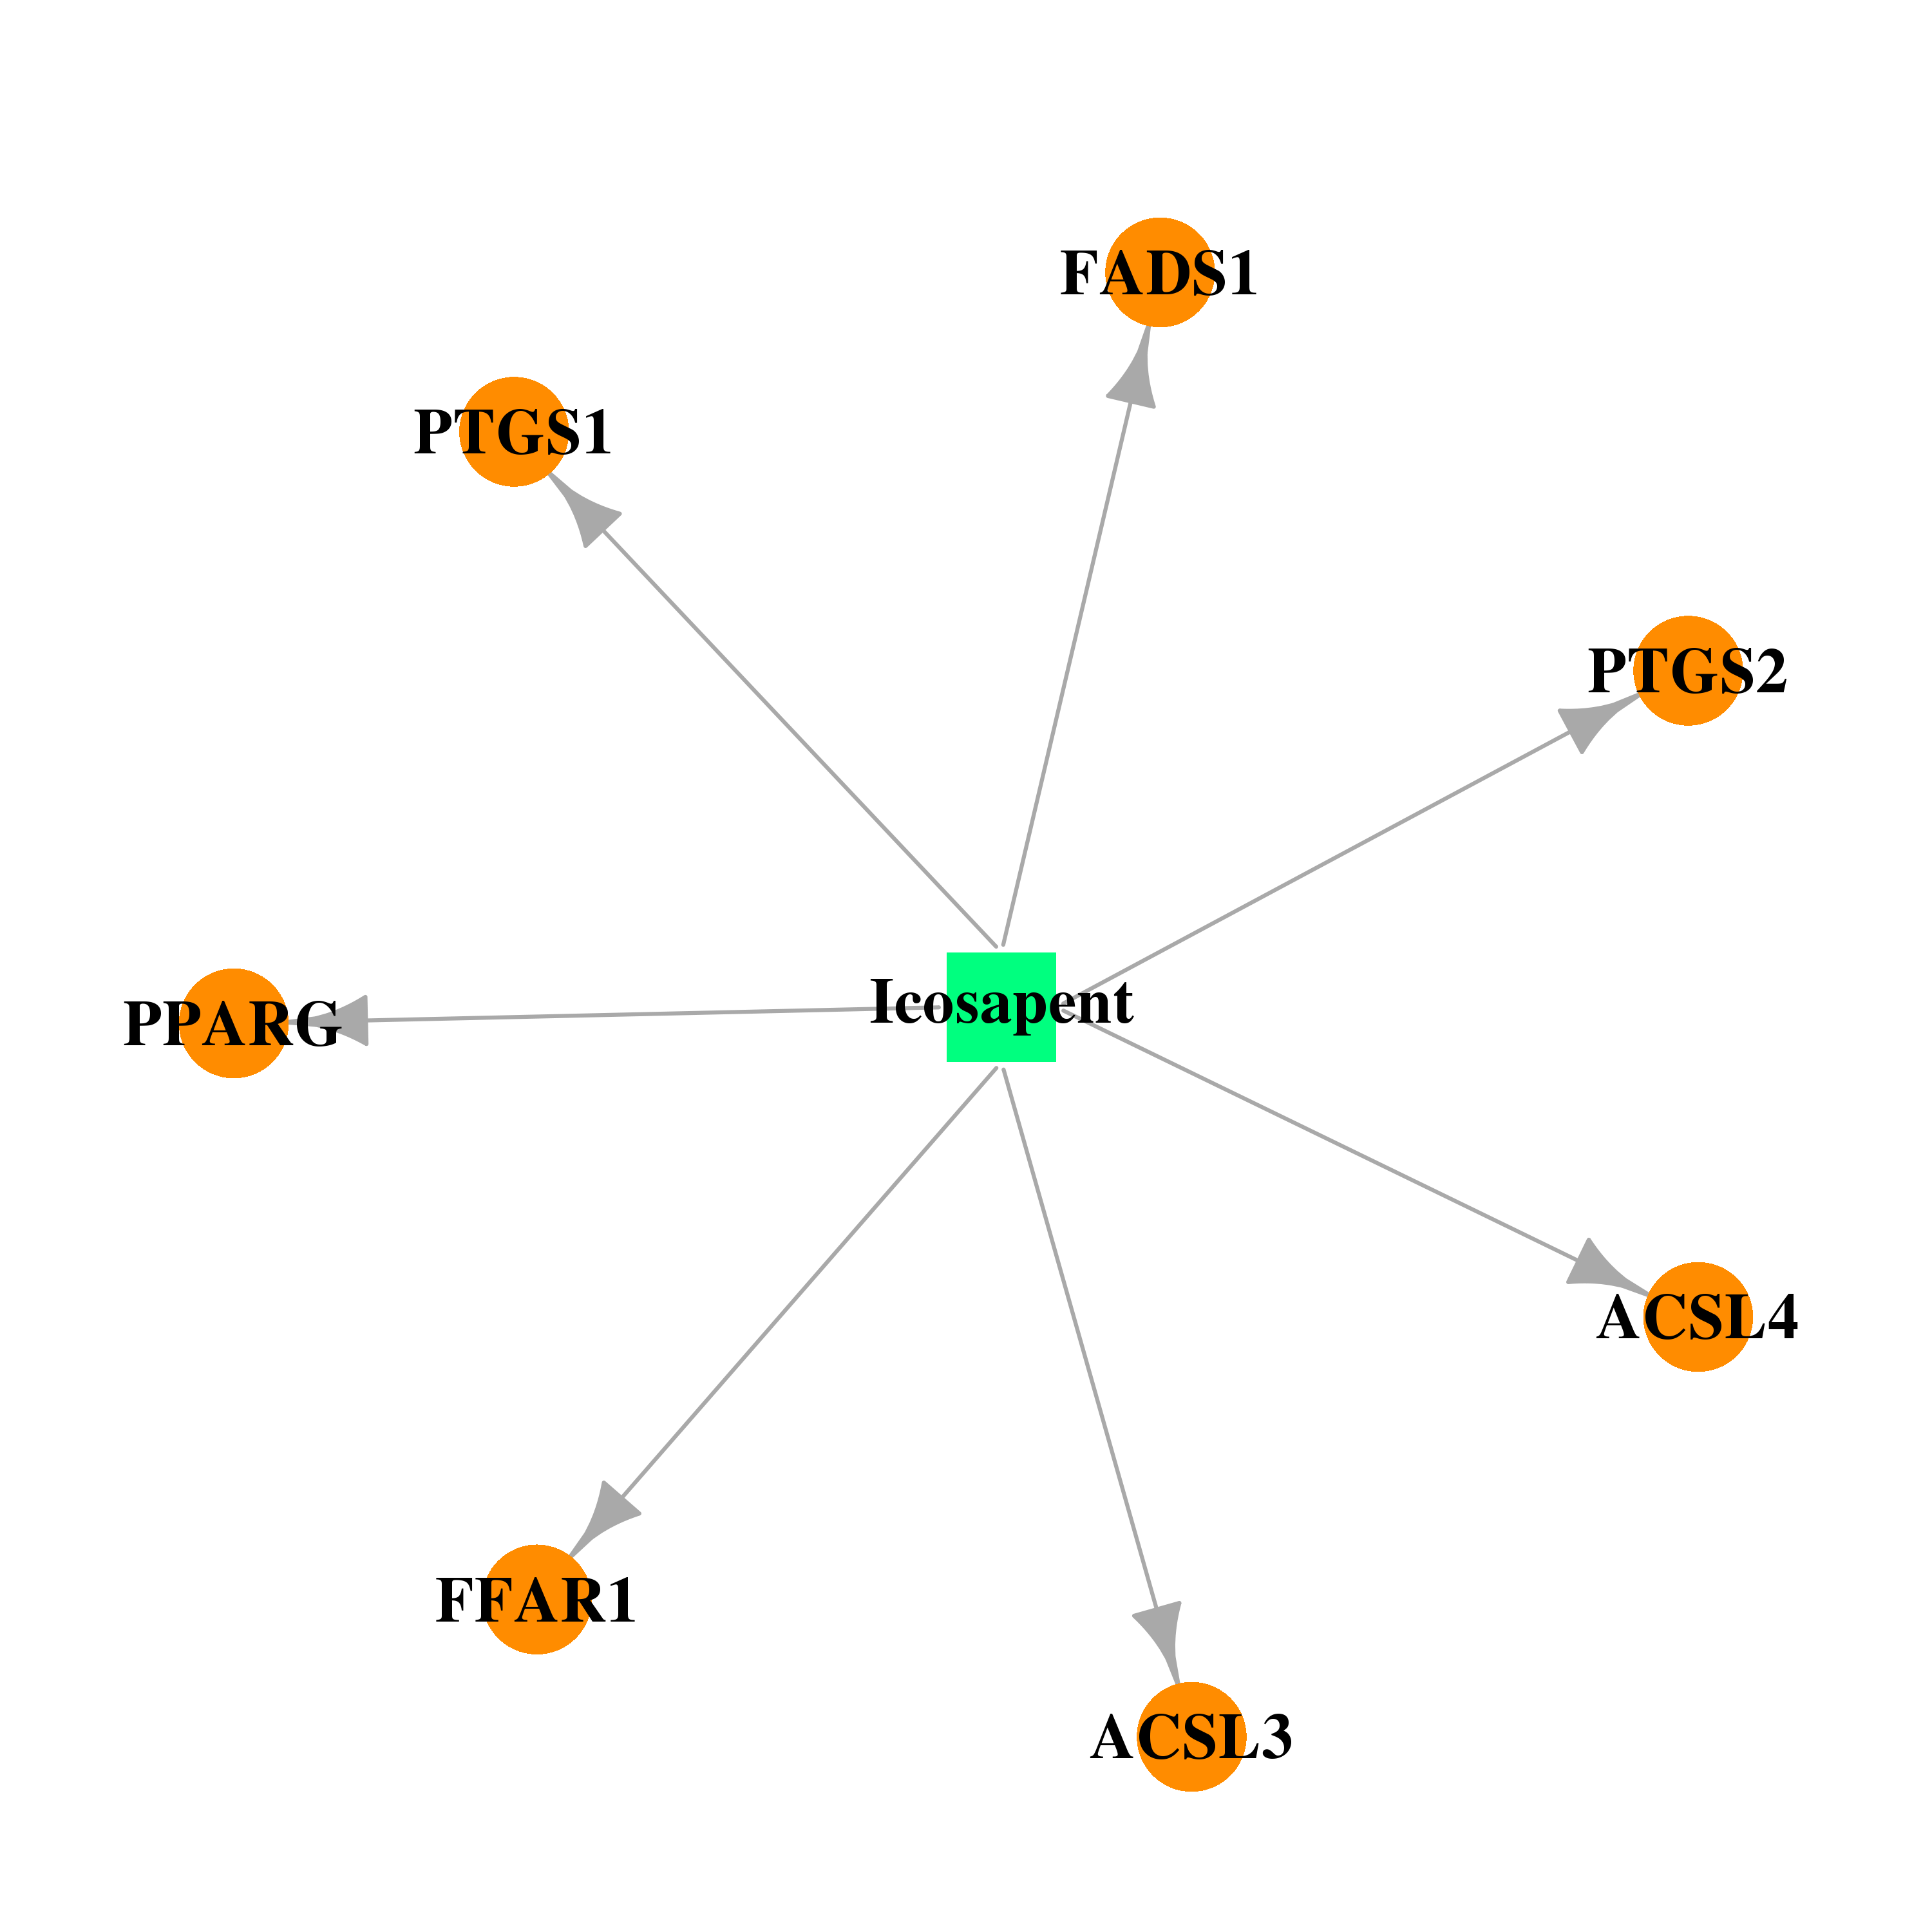 | 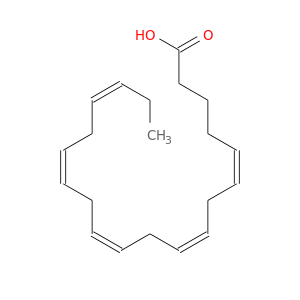 |
| Top |
| Cross referenced IDs for FADS1 |
| * We obtained these cross-references from Uniprot database. It covers 150 different DBs, 18 categories. http://www.uniprot.org/help/cross_references_section |
: Open all cross reference information
|
Copyright © 2016-Present - The Univsersity of Texas Health Science Center at Houston @ |