|
||||||||||||||||||||||||||||||||||||||||||||||||||||||||||||||||||||||||||||||||||||||||||||||||||||||||||||||||||||||||||||||||||||||||||||||||||||||||||||||||||||||||||||||||||||||||||||||||||||||||||||||||||||||||||||||||||||||||||||||||||||||||||||||||||||||||||||||||||||||||||||||||||||||||||||||||||||||||||
| |
| Phenotypic Information (metabolism pathway, cancer, disease, phenome) |
| |
| |
| Gene-Gene Network Information: Co-Expression Network, Interacting Genes & KEGG |
| |
|


| Gene Summary for LMAN1 |
| Basic gene info. | Gene symbol | LMAN1 |
| Gene name | lectin, mannose-binding, 1 | |
| Synonyms | ERGIC-53|ERGIC53|F5F8D|FMFD1|MCFD1|MR60|gp58 | |
| Cytomap | UCSC genome browser: 18q21.3-q22 | |
| Genomic location | chr18 :56995055-57026508 | |
| Type of gene | protein-coding | |
| RefGenes | NM_005570.3, | |
| Ensembl id | ENSG00000074695 | |
| Description | ER-Golgi intermediate compartment 53 kDa proteinendoplasmic reticulum-golgi intermediate compartment protein 53intracellular mannose specific lectinintracellular mannose-specific lectin MR60protein ERGIC-53 | |
| Modification date | 20141207 | |
| dbXrefs | MIM : 601567 | |
| HGNC : HGNC | ||
| Ensembl : ENSG00000074695 | ||
| HPRD : 03338 | ||
| Vega : OTTHUMG00000132758 | ||
| Protein | UniProt: P49257 go to UniProt's Cross Reference DB Table | |
| Expression | CleanEX: HS_LMAN1 | |
| BioGPS: 3998 | ||
| Gene Expression Atlas: ENSG00000074695 | ||
| The Human Protein Atlas: ENSG00000074695 | ||
| Pathway | NCI Pathway Interaction Database: LMAN1 | |
| KEGG: LMAN1 | ||
| REACTOME: LMAN1 | ||
| ConsensusPathDB | ||
| Pathway Commons: LMAN1 | ||
| Metabolism | MetaCyc: LMAN1 | |
| HUMANCyc: LMAN1 | ||
| Regulation | Ensembl's Regulation: ENSG00000074695 | |
| miRBase: chr18 :56,995,055-57,026,508 | ||
| TargetScan: NM_005570 | ||
| cisRED: ENSG00000074695 | ||
| Context | iHOP: LMAN1 | |
| cancer metabolism search in PubMed: LMAN1 | ||
| UCL Cancer Institute: LMAN1 | ||
| Assigned class in ccmGDB | B - This gene belongs to cancer gene. | |
| Top |
| Phenotypic Information for LMAN1(metabolism pathway, cancer, disease, phenome) |
| Cancer | CGAP: LMAN1 |
| Familial Cancer Database: LMAN1 | |
| * This gene is included in those cancer gene databases. |
|
|
|
|
|
| . | ||||||||||||||||||||||||||||||||||||||||||||||||||||||||||||||||||||||||||||||||||||||||||||||||||||||||||||||||||||||||||||||||||||||||||||||||||||||||||||||||||||||||||||||||||||||||||||||||||||||||||||||||||||||||||||||||||||||||||||||||||||||||||||||||||||||||||||||||||||||||||||||||||||||||||||||||||||
Oncogene 1 | Significant driver gene in STAD 6, | |||||||||||||||||||||||||||||||||||||||||||||||||||||||||||||||||||||||||||||||||||||||||||||||||||||||||||||||||||||||||||||||||||||||||||||||||||||||||||||||||||||||||||||||||||||||||||||||||||||||||||||||||||||||||||||||||||||||||||||||||||||||||||||||||||||||||||||||||||||||||||||||||||||||||||||||||||||||||
| cf) number; DB name 1 Oncogene; http://nar.oxfordjournals.org/content/35/suppl_1/D721.long, 2 Tumor Suppressor gene; https://bioinfo.uth.edu/TSGene/, 3 Cancer Gene Census; http://www.nature.com/nrc/journal/v4/n3/abs/nrc1299.html, 4 CancerGenes; http://nar.oxfordjournals.org/content/35/suppl_1/D721.long, 5 Network of Cancer Gene; http://ncg.kcl.ac.uk/index.php, 6 http://www.nature.com/nature/journal/v513/n7517/full/nature13480.html, 7Therapeutic Vulnerabilities in Cancer; http://cbio.mskcc.org/cancergenomics/statius/ |
| REACTOME_METABOLISM_OF_PROTEINS | |
| OMIM | 227300; phenotype. 227300; phenotype. 601567; gene. 601567; gene. |
| Orphanet | 35909; Combined deficiency of factor V and factor VIII. 35909; Combined deficiency of factor V and factor VIII. |
| Disease | KEGG Disease: LMAN1 |
| MedGen: LMAN1 (Human Medical Genetics with Condition) | |
| ClinVar: LMAN1 | |
| Phenotype | MGI: LMAN1 (International Mouse Phenotyping Consortium) |
| PhenomicDB: LMAN1 | |
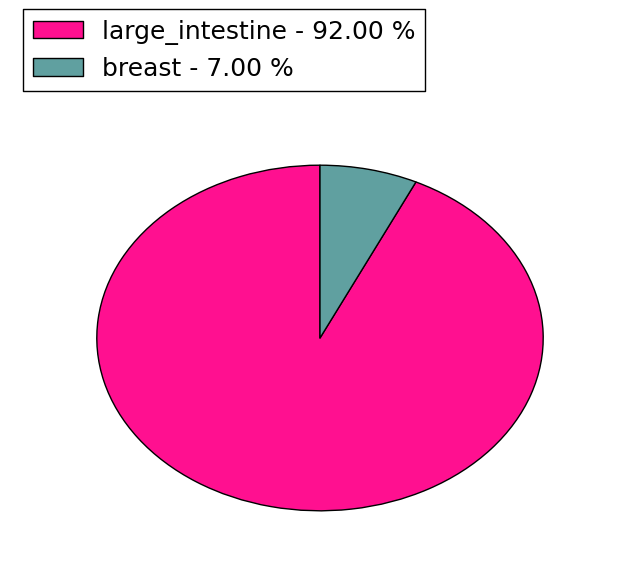
| Mutations for LMAN1 |
| * Under tables are showing count per each tissue to give us broad intuition about tissue specific mutation patterns.You can go to the detailed page for each mutation database's web site. |
| - Statistics for Tissue and Mutation type | Top |
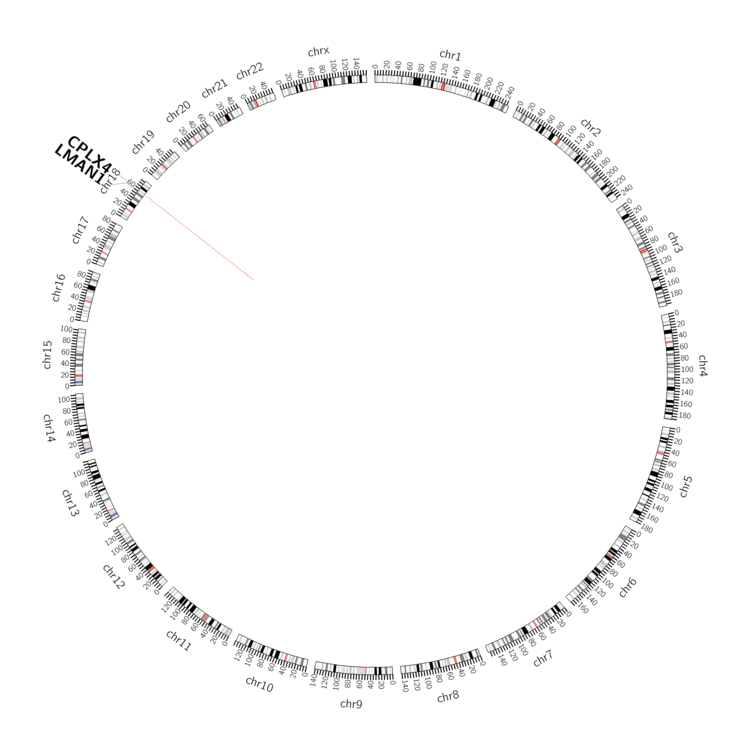 |
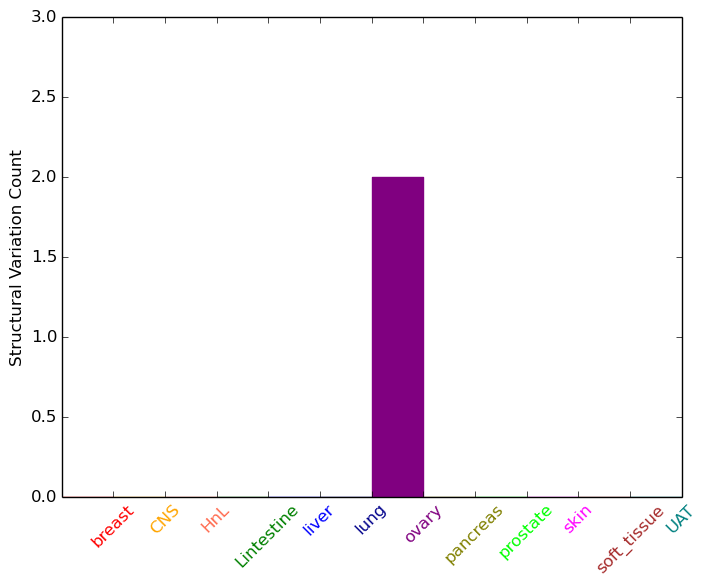
| - For Inter-chromosomal Variations |
| There's no inter-chromosomal structural variation. |
| - For Intra-chromosomal Variations |
| * Intra-chromosomal variantions includes 'intrachromosomal amplicon to amplicon', 'intrachromosomal amplicon to non-amplified dna', 'intrachromosomal deletion', 'intrachromosomal fold-back inversion', 'intrachromosomal inversion', 'intrachromosomal tandem duplication', 'Intrachromosomal unknown type', 'intrachromosomal with inverted orientation', 'intrachromosomal with non-inverted orientation'. |
 |
| Sample | Symbol_a | Chr_a | Start_a | End_a | Symbol_b | Chr_b | Start_b | End_b |
| ovary | LMAN1 | chr18 | 57004391 | 57004411 | CPLX4 | chr18 | 56984492 | 56984512 |
| ovary | LMAN1 | chr18 | 57005845 | 57005865 | LMAN1 | chr18 | 57003213 | 57003233 |
| cf) Tissue number; Tissue name (1;Breast, 2;Central_nervous_system, 3;Haematopoietic_and_lymphoid_tissue, 4;Large_intestine, 5;Liver, 6;Lung, 7;Ovary, 8;Pancreas, 9;Prostate, 10;Skin, 11;Soft_tissue, 12;Upper_aerodigestive_tract) |
| * From mRNA Sanger sequences, Chitars2.0 arranged chimeric transcripts. This table shows LMAN1 related fusion information. |
| ID | Head Gene | Tail Gene | Accession | Gene_a | qStart_a | qEnd_a | Chromosome_a | tStart_a | tEnd_a | Gene_a | qStart_a | qEnd_a | Chromosome_a | tStart_a | tEnd_a |
| BU625653 | LMAN1 | 21 | 599 | 18 | 56998744 | 57013282 | KLF6 | 581 | 727 | 10 | 3819868 | 3820014 | |
| Top |
| Mutation type/ Tissue ID | brca | cns | cerv | endome | haematopo | kidn | Lintest | liver | lung | ns | ovary | pancre | prost | skin | stoma | thyro | urina | |||
| Total # sample | 1 | |||||||||||||||||||
| GAIN (# sample) | ||||||||||||||||||||
| LOSS (# sample) | 1 |
| cf) Tissue ID; Tissue type (1; Breast, 2; Central_nervous_system, 3; Cervix, 4; Endometrium, 5; Haematopoietic_and_lymphoid_tissue, 6; Kidney, 7; Large_intestine, 8; Liver, 9; Lung, 10; NS, 11; Ovary, 12; Pancreas, 13; Prostate, 14; Skin, 15; Stomach, 16; Thyroid, 17; Urinary_tract) |
| Top |
|
 |
| Top |
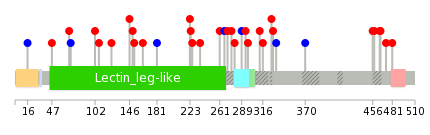
| Stat. for Non-Synonymous SNVs (# total SNVs=41) | (# total SNVs=8) |
 |  |
(# total SNVs=14) | (# total SNVs=0) |
 |
| Top |
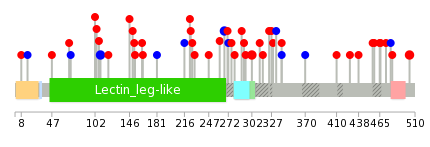
| * When you move the cursor on each content, you can see more deailed mutation information on the Tooltip. Those are primary_site,primary_histology,mutation(aa),pubmedID. |
| GRCh37 position | Mutation(aa) | Unique sampleID count |
| chr18:57013194-57013194 | p.E305fs*22 | 16 |
| chr18:56998349-56998349 | p.E503D | 2 |
| chr18:57022778-57022778 | p.T109T | 2 |
| chr18:57013200-57013200 | p.K302N | 2 |
| chr18:57014768-57014768 | p.L267L | 2 |
| chr18:57021815-57021815 | p.? | 2 |
| chr18:57022801-57022801 | p.E102* | 2 |
| chr18:57026429-57026429 | p.L16L | 1 |
| chr18:57013279-57013279 | p.T276R | 1 |
| chr18:57000396-57000401 | p.T433_Q434delTQ | 1 |
| Top |
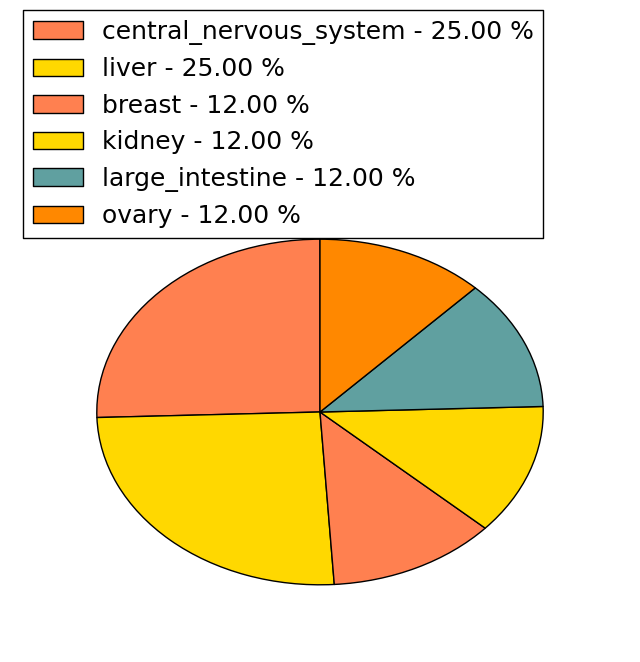
|
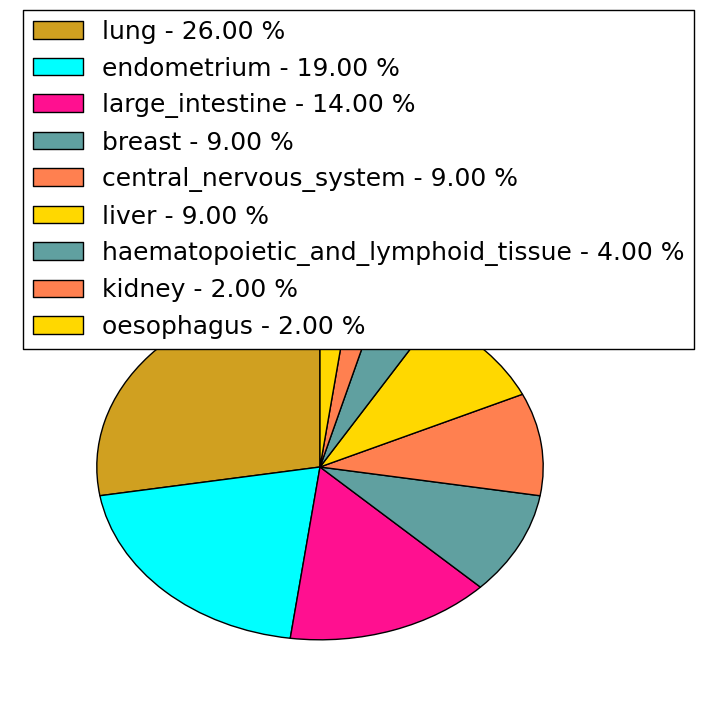
 |
| Point Mutation/ Tissue ID | 1 | 2 | 3 | 4 | 5 | 6 | 7 | 8 | 9 | 10 | 11 | 12 | 13 | 14 | 15 | 16 | 17 | 18 | 19 | 20 |
| # sample | 1 | 4 | 2 | 2 | 5 | 2 | 1 | 1 | 6 | 4 | 6 | |||||||||
| # mutation | 1 | 5 | 2 | 2 | 5 | 2 | 1 | 1 | 6 | 4 | 7 | |||||||||
| nonsynonymous SNV | 1 | 4 | 1 | 1 | 5 | 2 | 1 | 6 | 1 | 7 | ||||||||||
| synonymous SNV | 1 | 1 | 1 | 1 | 3 |
| cf) Tissue ID; Tissue type (1; BLCA[Bladder Urothelial Carcinoma], 2; BRCA[Breast invasive carcinoma], 3; CESC[Cervical squamous cell carcinoma and endocervical adenocarcinoma], 4; COAD[Colon adenocarcinoma], 5; GBM[Glioblastoma multiforme], 6; Glioma Low Grade, 7; HNSC[Head and Neck squamous cell carcinoma], 8; KICH[Kidney Chromophobe], 9; KIRC[Kidney renal clear cell carcinoma], 10; KIRP[Kidney renal papillary cell carcinoma], 11; LAML[Acute Myeloid Leukemia], 12; LUAD[Lung adenocarcinoma], 13; LUSC[Lung squamous cell carcinoma], 14; OV[Ovarian serous cystadenocarcinoma ], 15; PAAD[Pancreatic adenocarcinoma], 16; PRAD[Prostate adenocarcinoma], 17; SKCM[Skin Cutaneous Melanoma], 18:STAD[Stomach adenocarcinoma], 19:THCA[Thyroid carcinoma], 20:UCEC[Uterine Corpus Endometrial Carcinoma]) |
| Top |
| * We represented just top 10 SNVs. When you move the cursor on each content, you can see more deailed mutation information on the Tooltip. Those are primary_site, primary_histology, mutation(aa), pubmedID. |
| Genomic Position | Mutation(aa) | Unique sampleID count |
| chr18:57014768 | p.C466R | 1 |
| chr18:57022737 | p.L267L | 1 |
| chr18:57006155 | p.E47Q | 1 |
| chr18:57014785 | p.K465E | 1 |
| chr18:57022784 | p.S261F | 1 |
| chr18:57006162 | p.L16L | 1 |
| chr18:57016400 | p.M458I | 1 |
| chr18:57022800 | p.M236I | 1 |
| chr18:57013159 | p.R456Q | 1 |
| chr18:57016432 | p.D226Y | 1 |
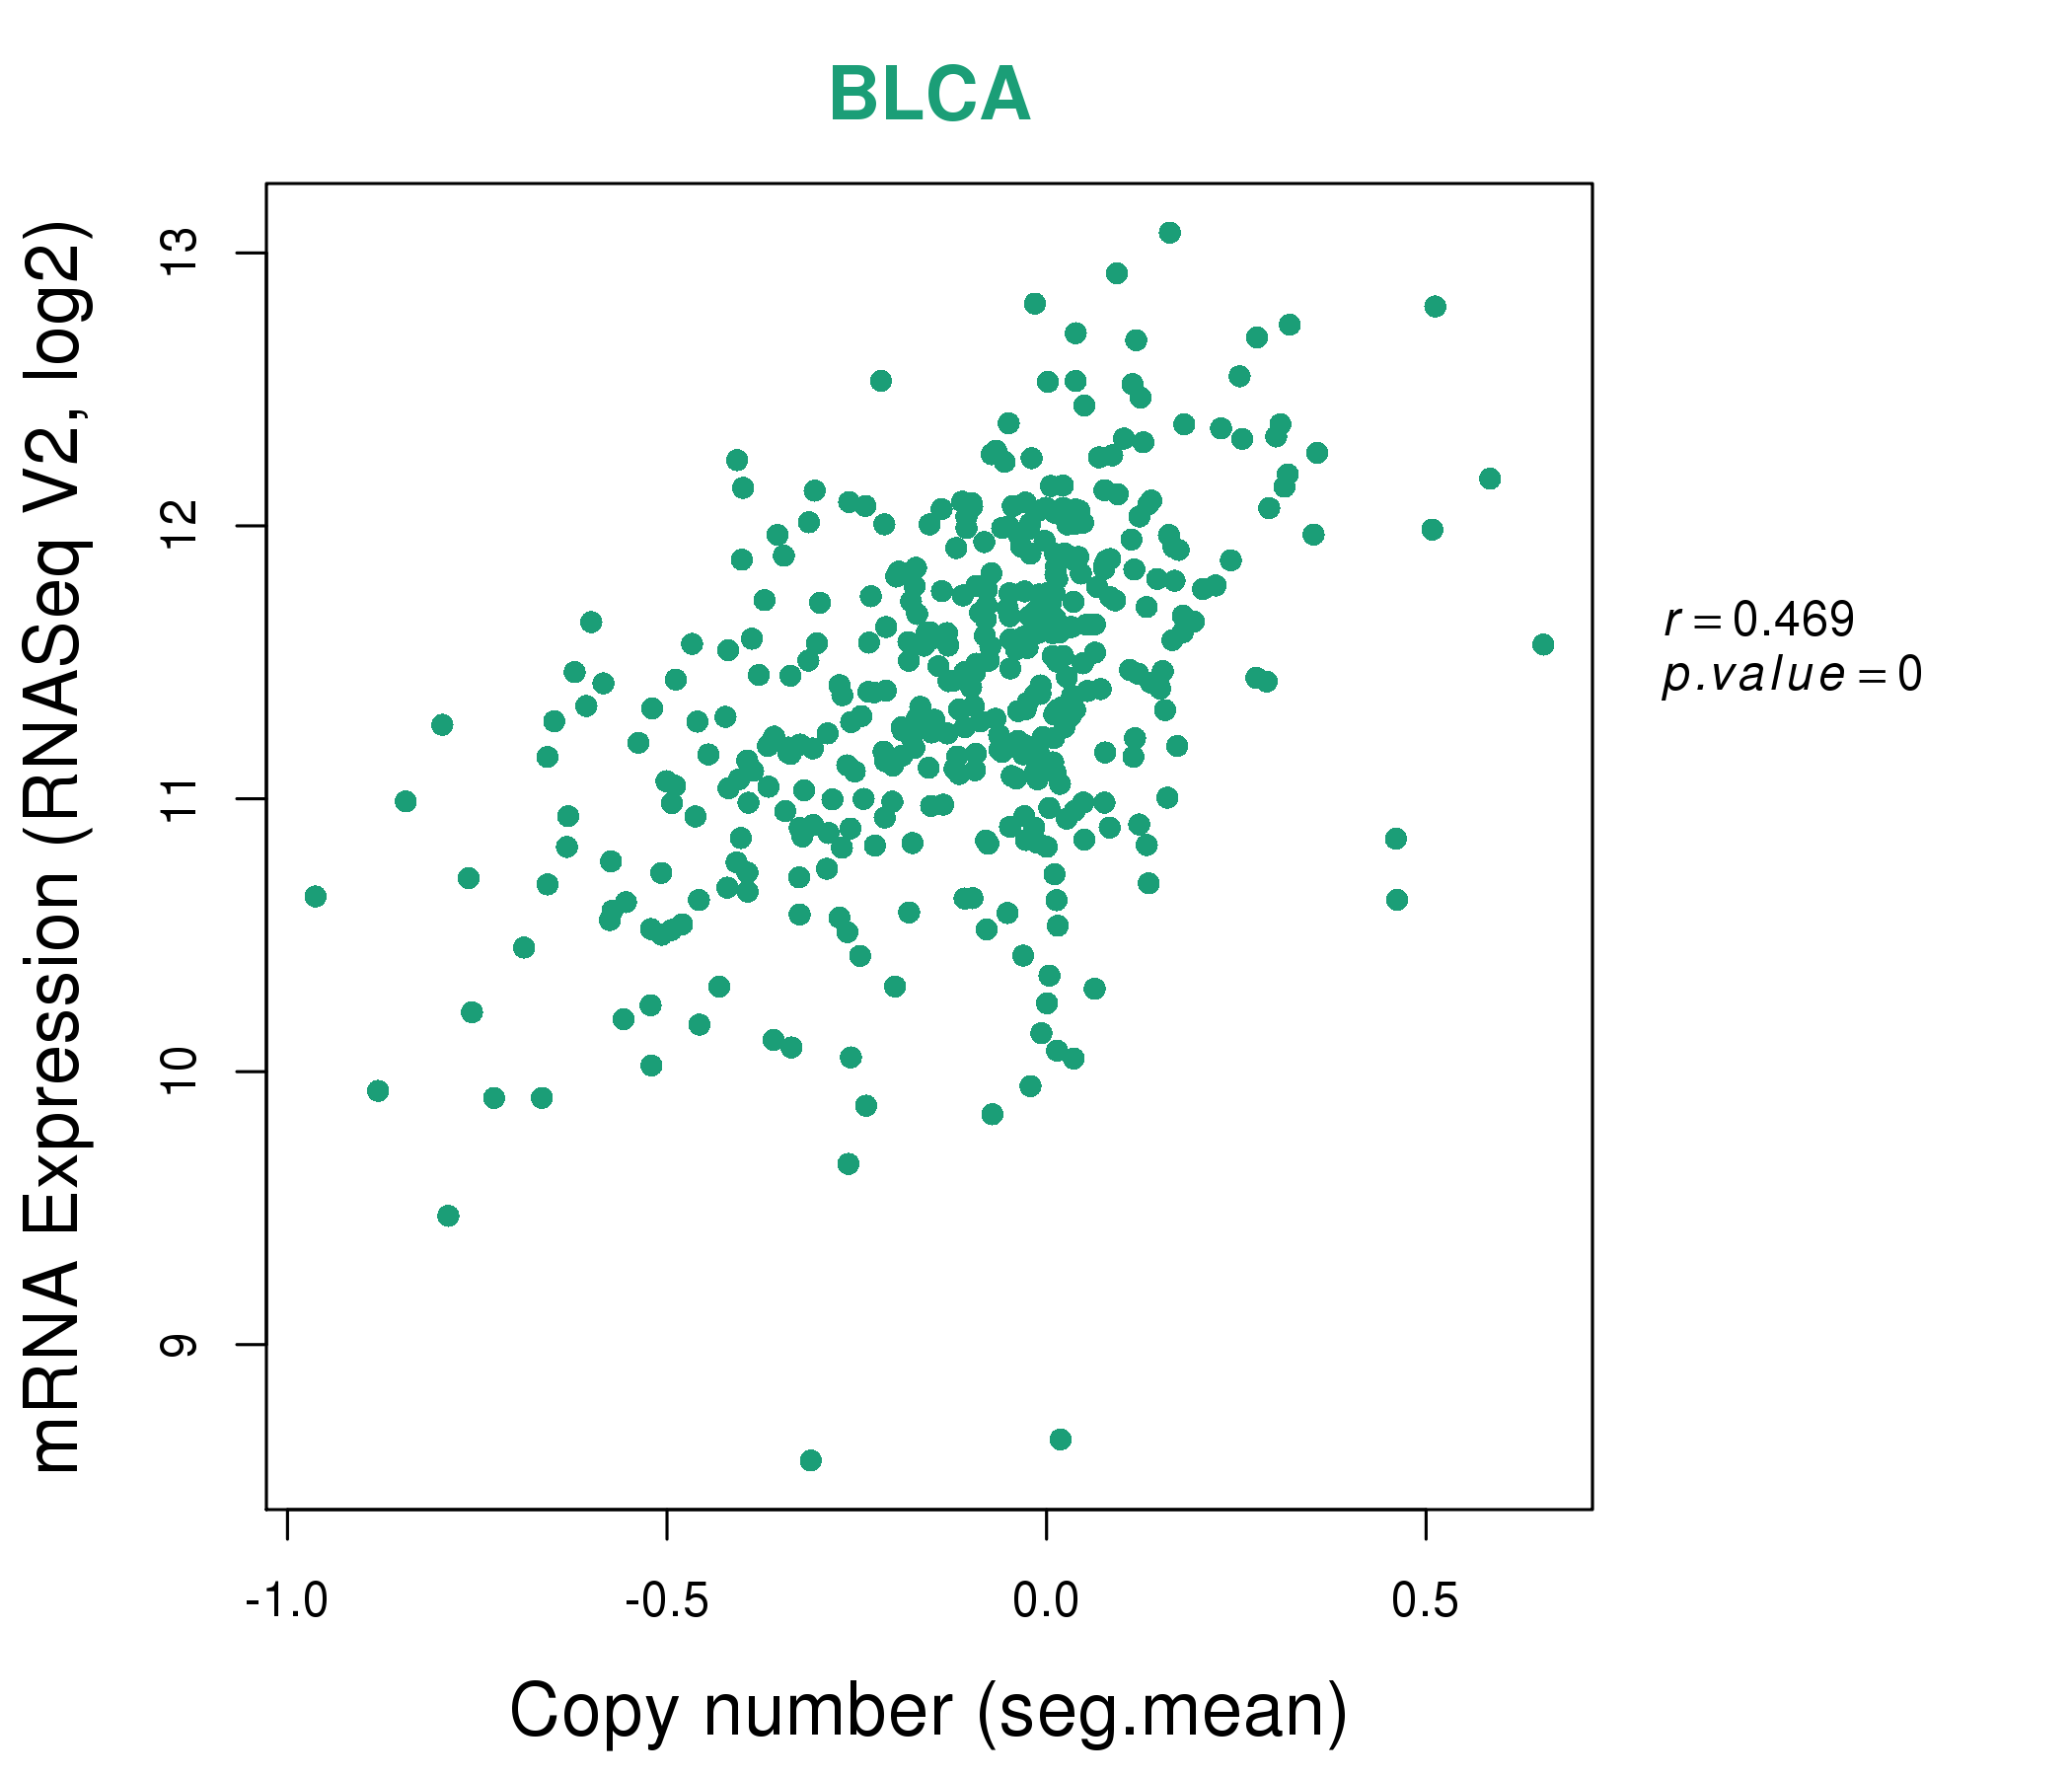
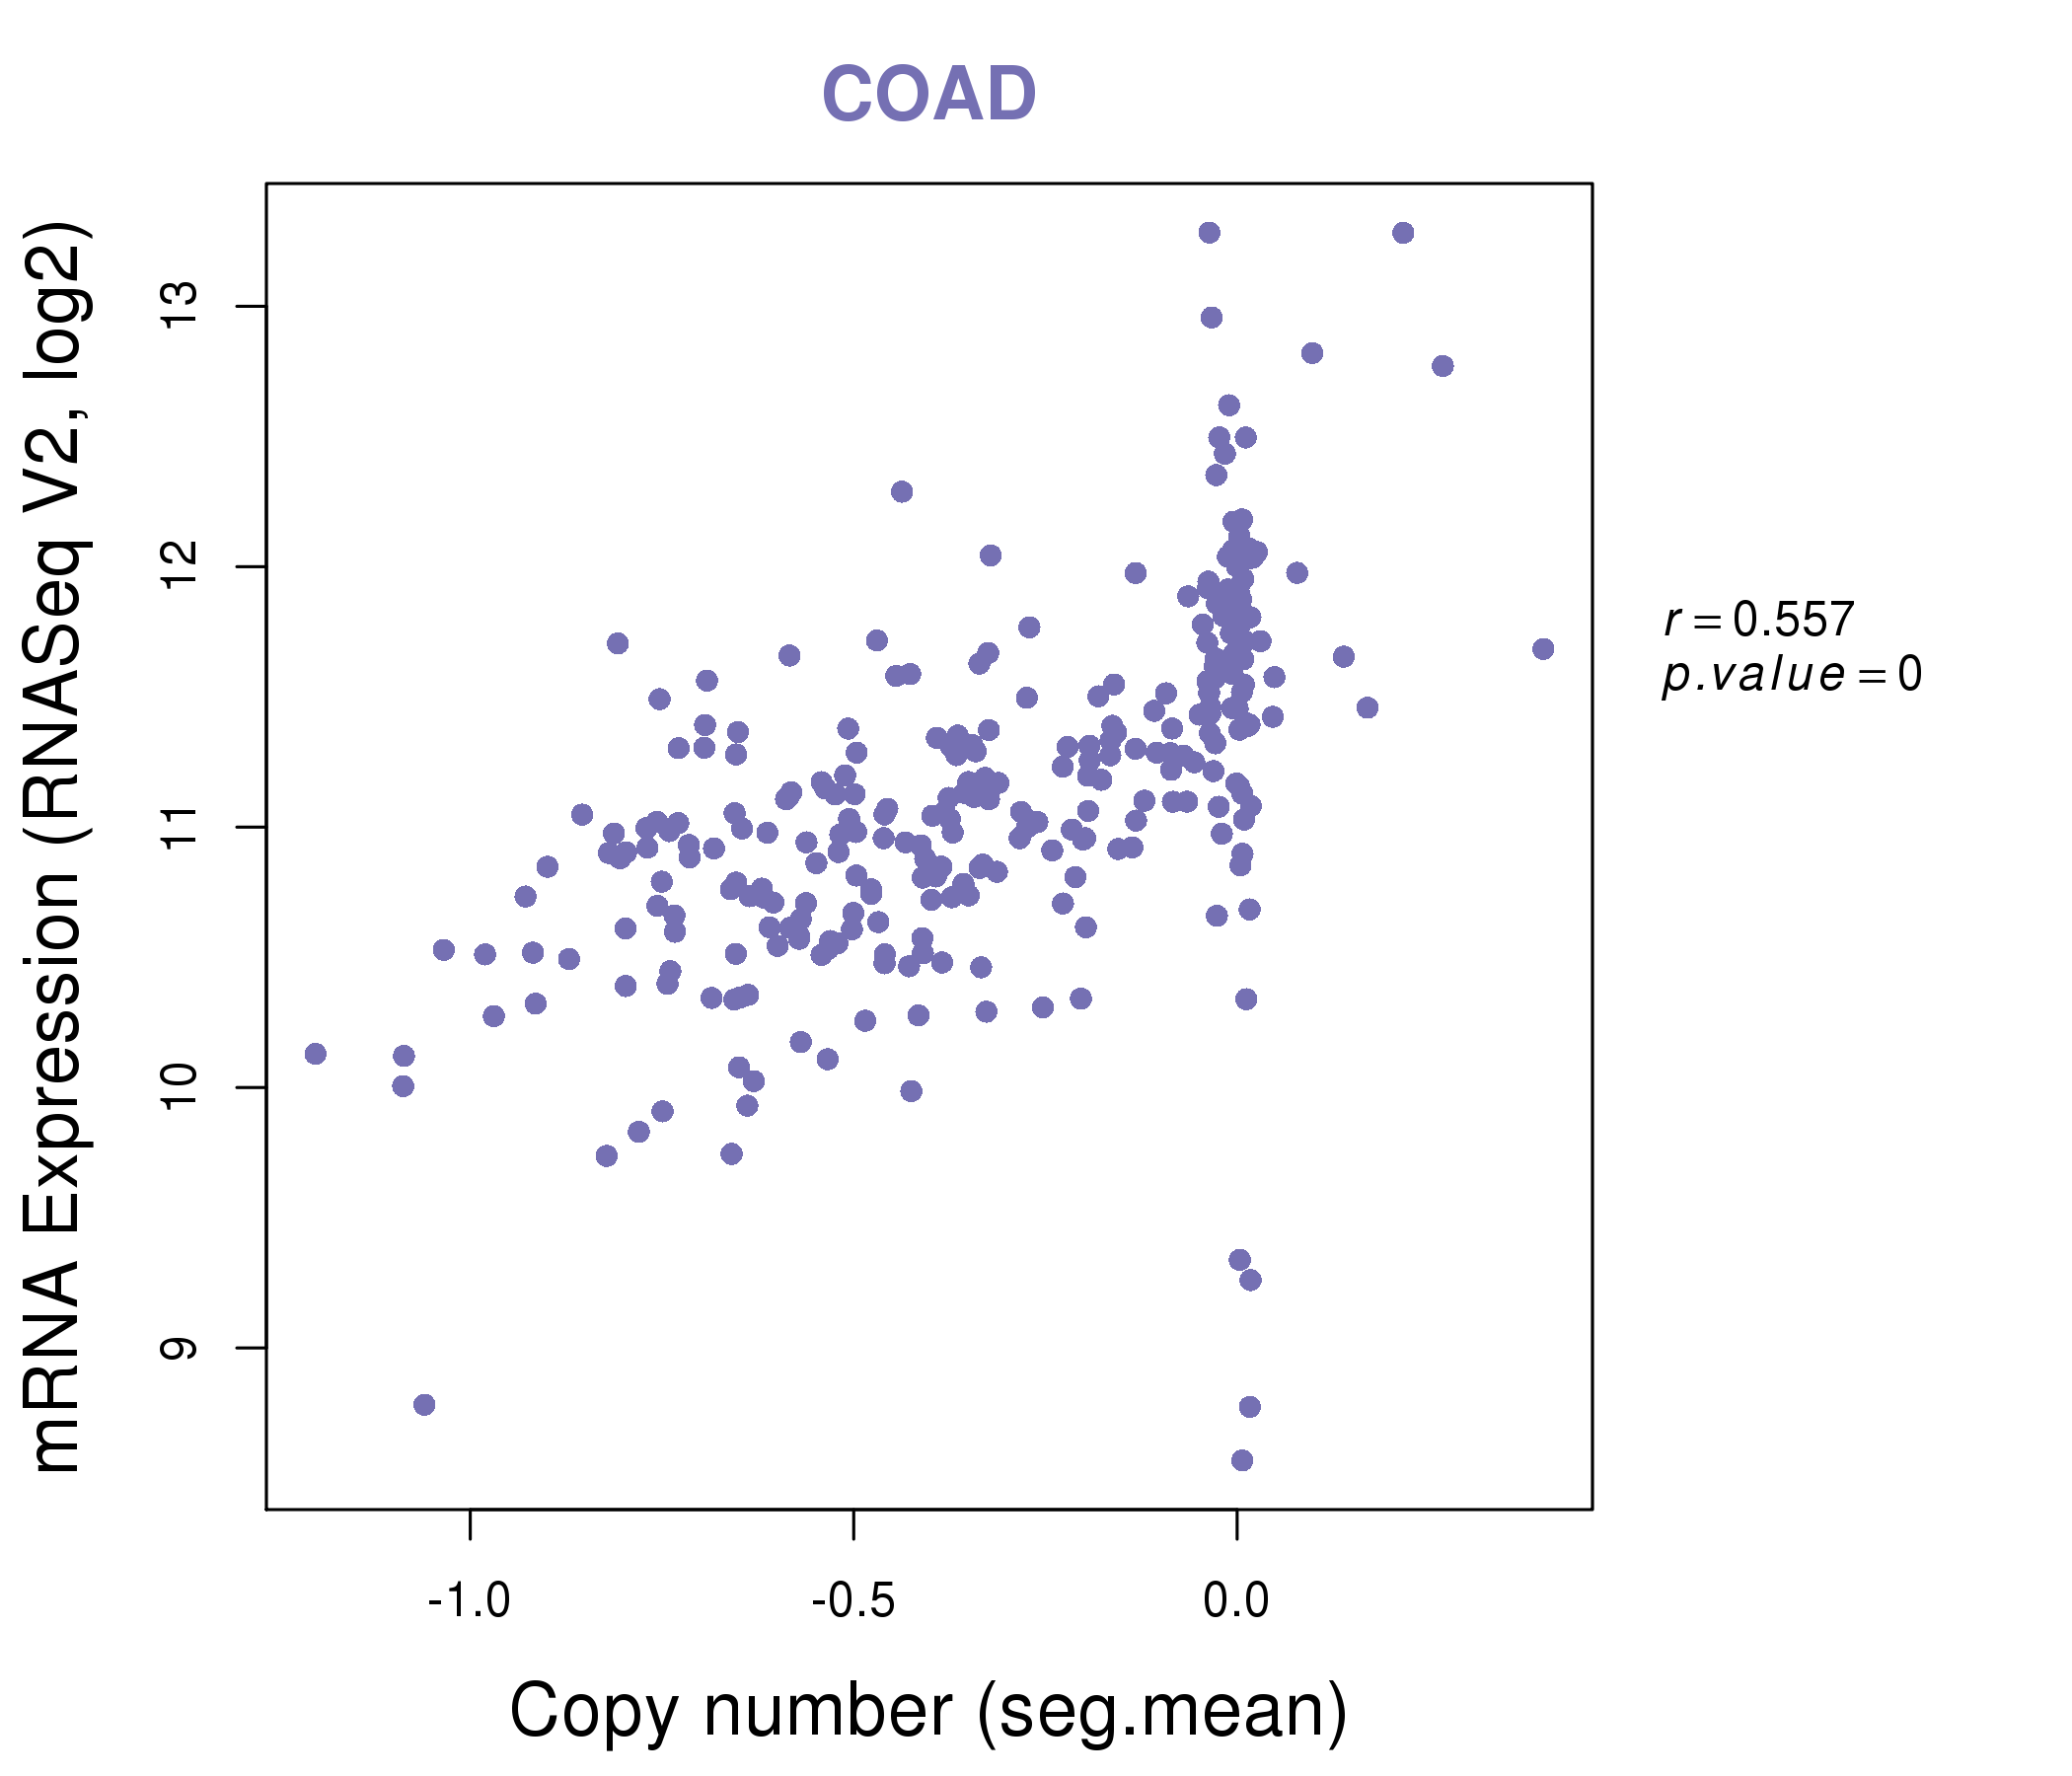
| * Copy number data were extracted from TCGA using R package TCGA-Assembler. The URLs of all public data files on TCGA DCC data server were gathered on Jan-05-2015. Function ProcessCNAData in TCGA-Assembler package was used to obtain gene-level copy number value which is calculated as the average copy number of the genomic region of a gene. |
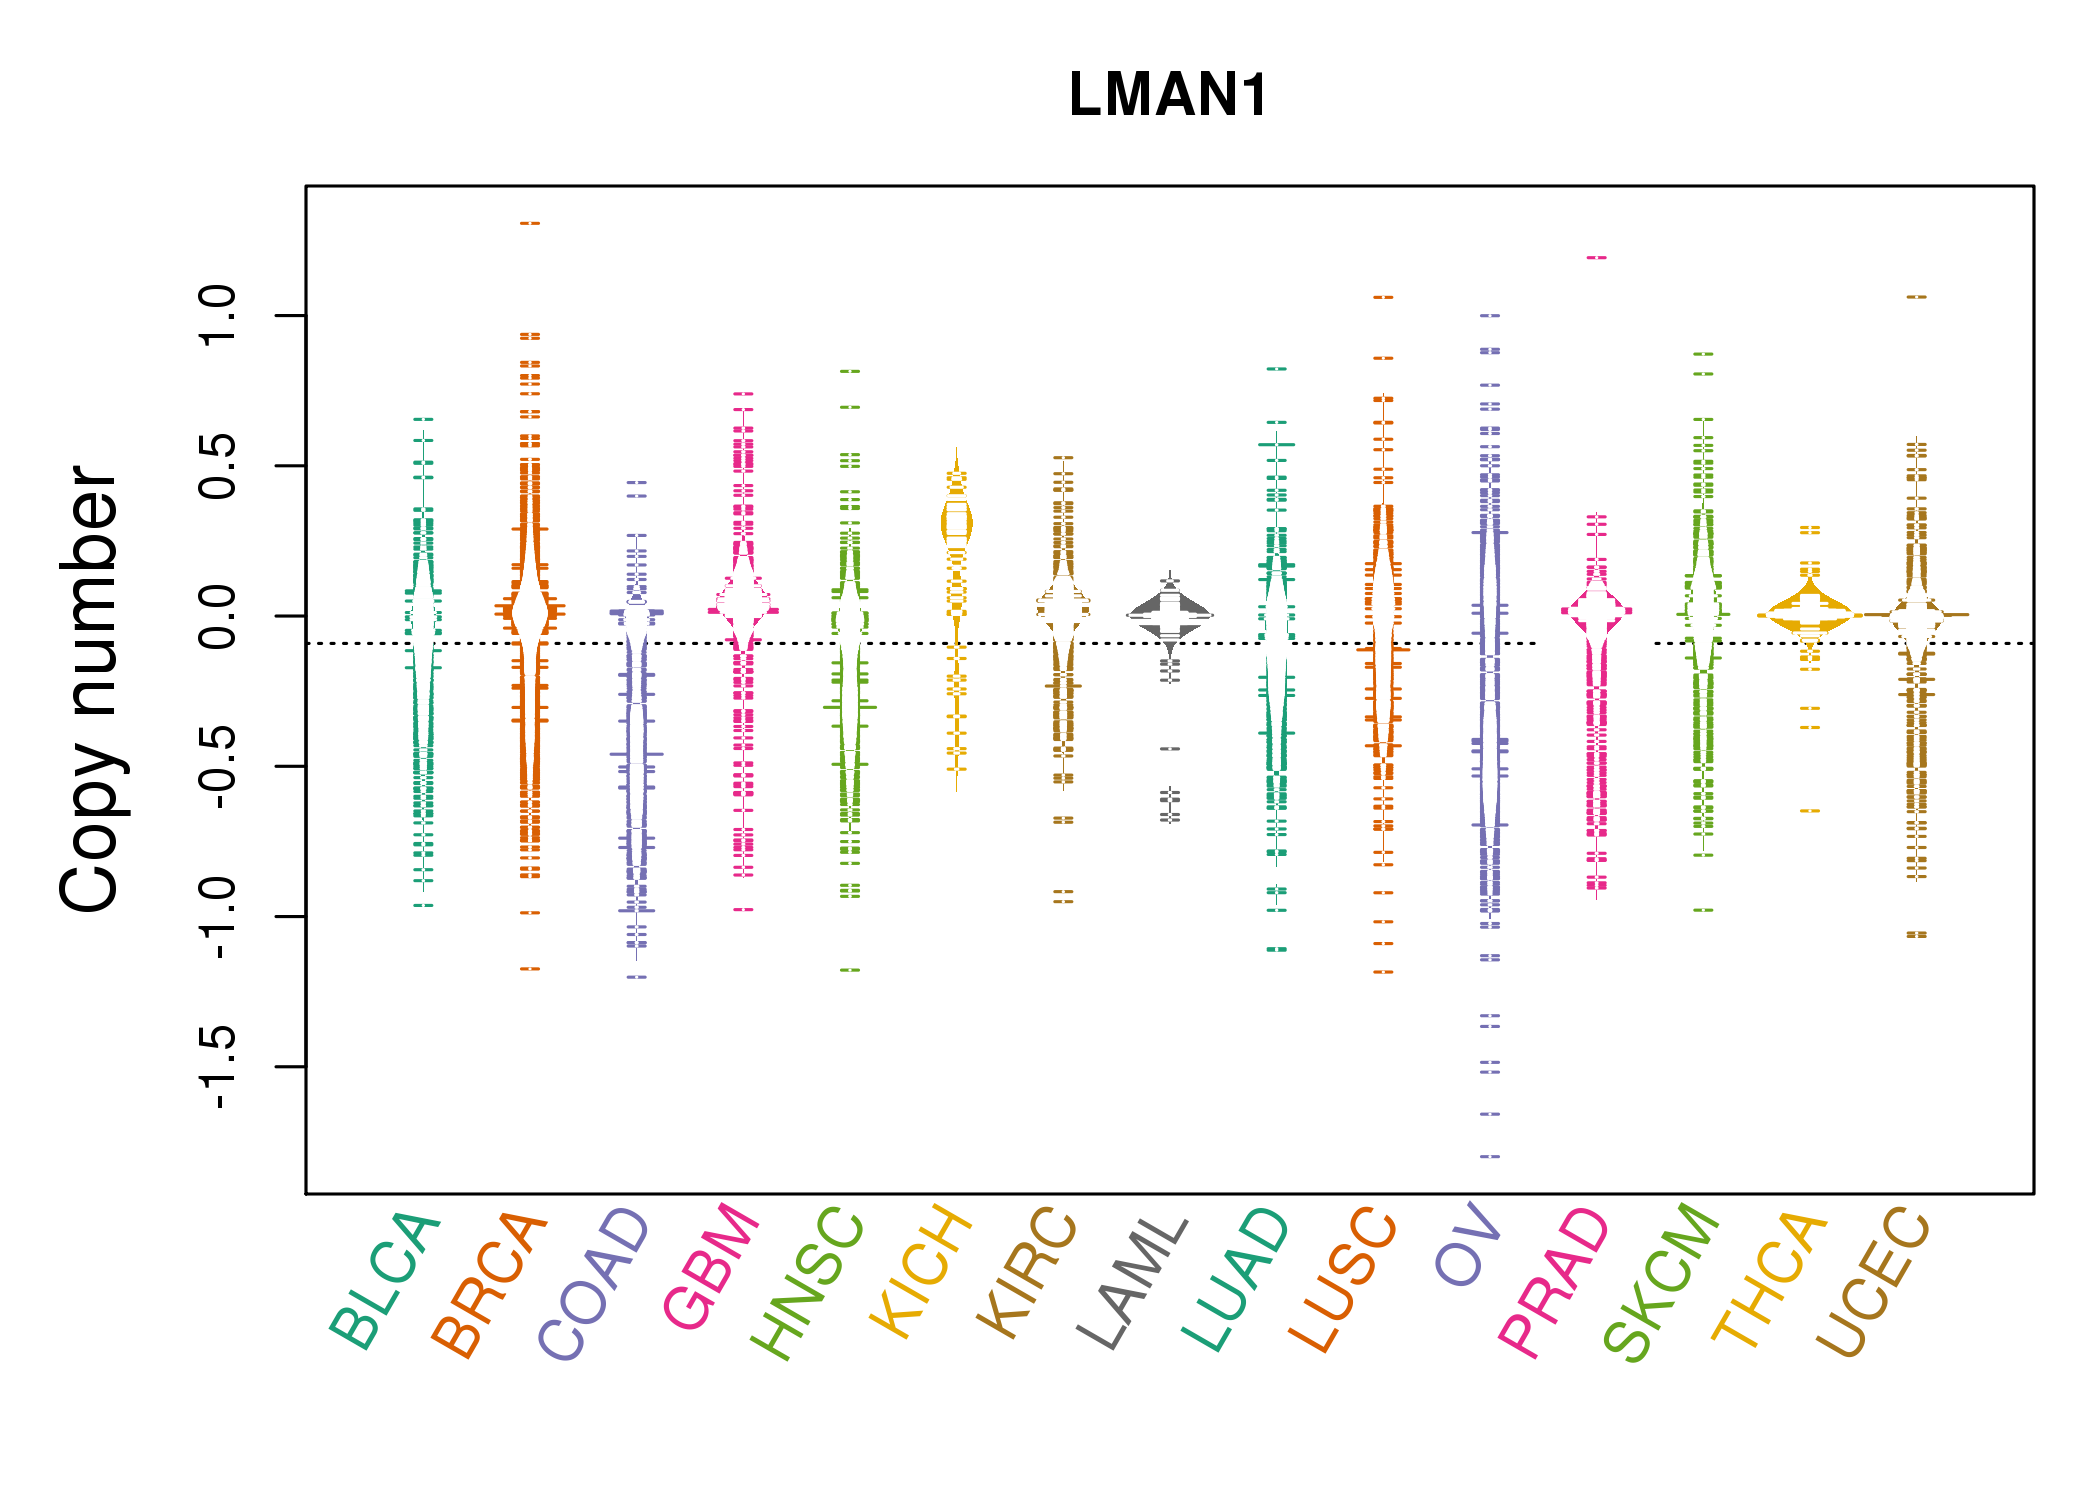 |
| cf) Tissue ID[Tissue type]: BLCA[Bladder Urothelial Carcinoma], BRCA[Breast invasive carcinoma], CESC[Cervical squamous cell carcinoma and endocervical adenocarcinoma], COAD[Colon adenocarcinoma], GBM[Glioblastoma multiforme], Glioma Low Grade, HNSC[Head and Neck squamous cell carcinoma], KICH[Kidney Chromophobe], KIRC[Kidney renal clear cell carcinoma], KIRP[Kidney renal papillary cell carcinoma], LAML[Acute Myeloid Leukemia], LUAD[Lung adenocarcinoma], LUSC[Lung squamous cell carcinoma], OV[Ovarian serous cystadenocarcinoma ], PAAD[Pancreatic adenocarcinoma], PRAD[Prostate adenocarcinoma], SKCM[Skin Cutaneous Melanoma], STAD[Stomach adenocarcinoma], THCA[Thyroid carcinoma], UCEC[Uterine Corpus Endometrial Carcinoma] |
| Top |
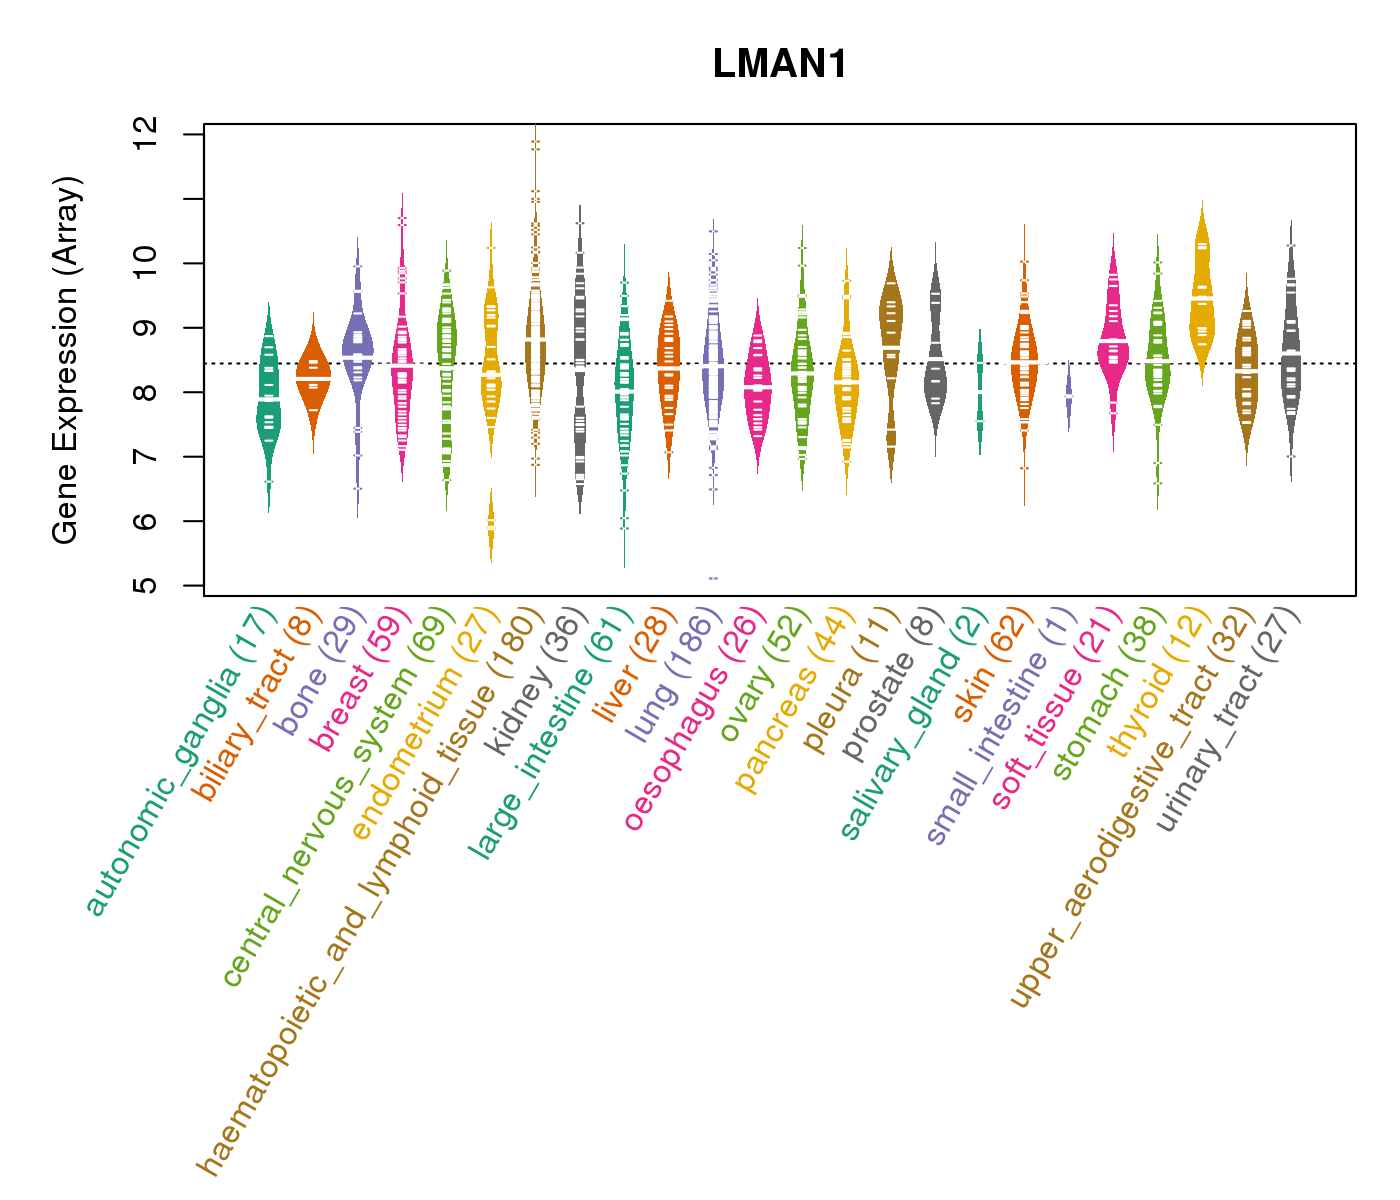
| Gene Expression for LMAN1 |
| * CCLE gene expression data were extracted from CCLE_Expression_Entrez_2012-10-18.res: Gene-centric RMA-normalized mRNA expression data. |
 |
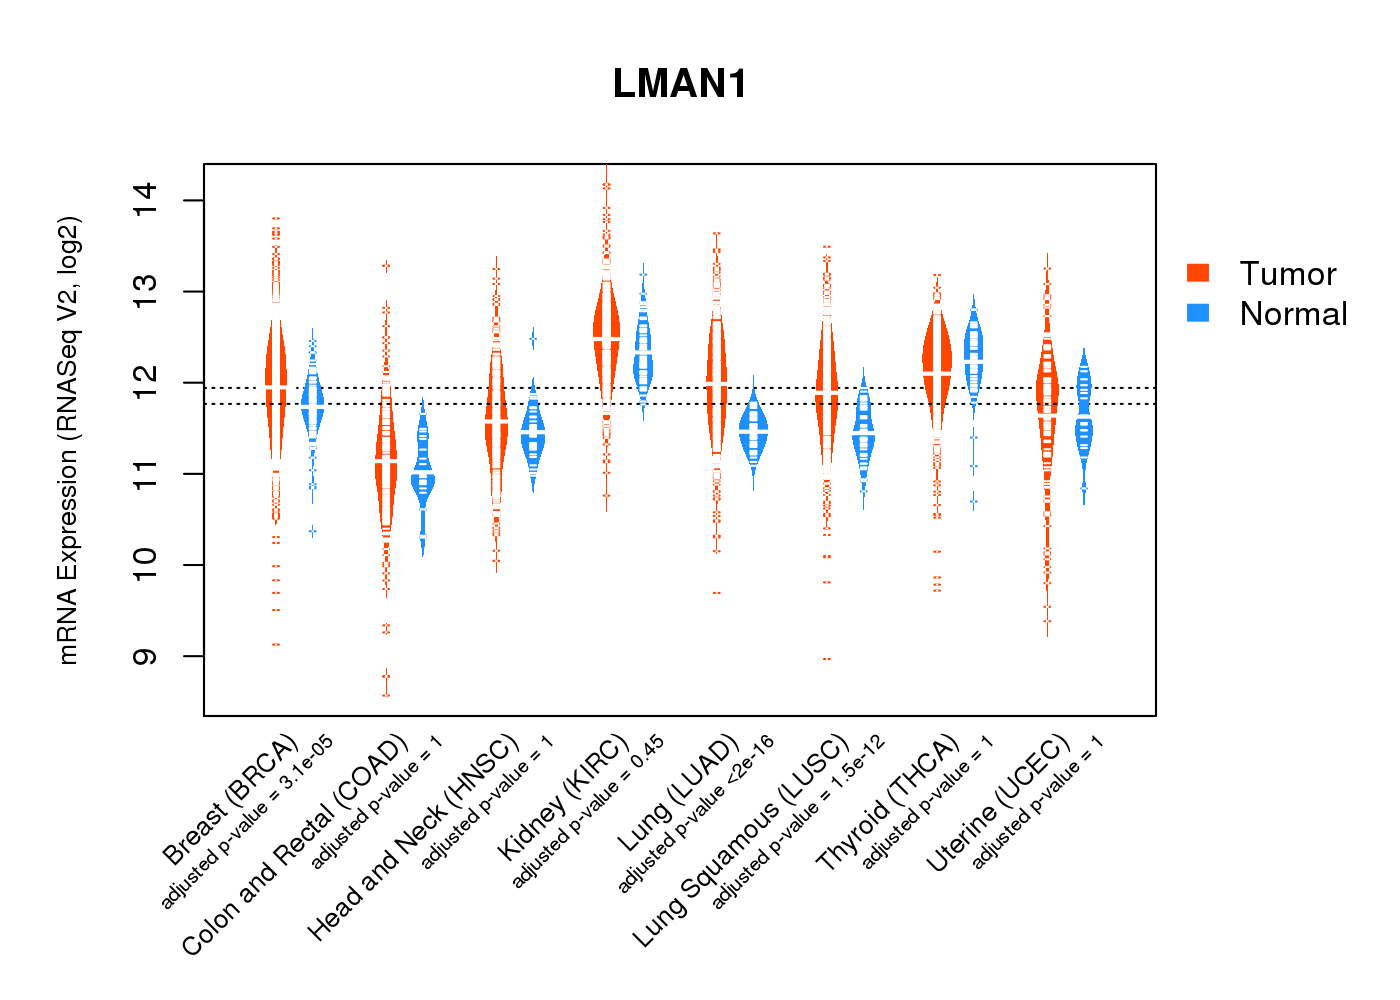
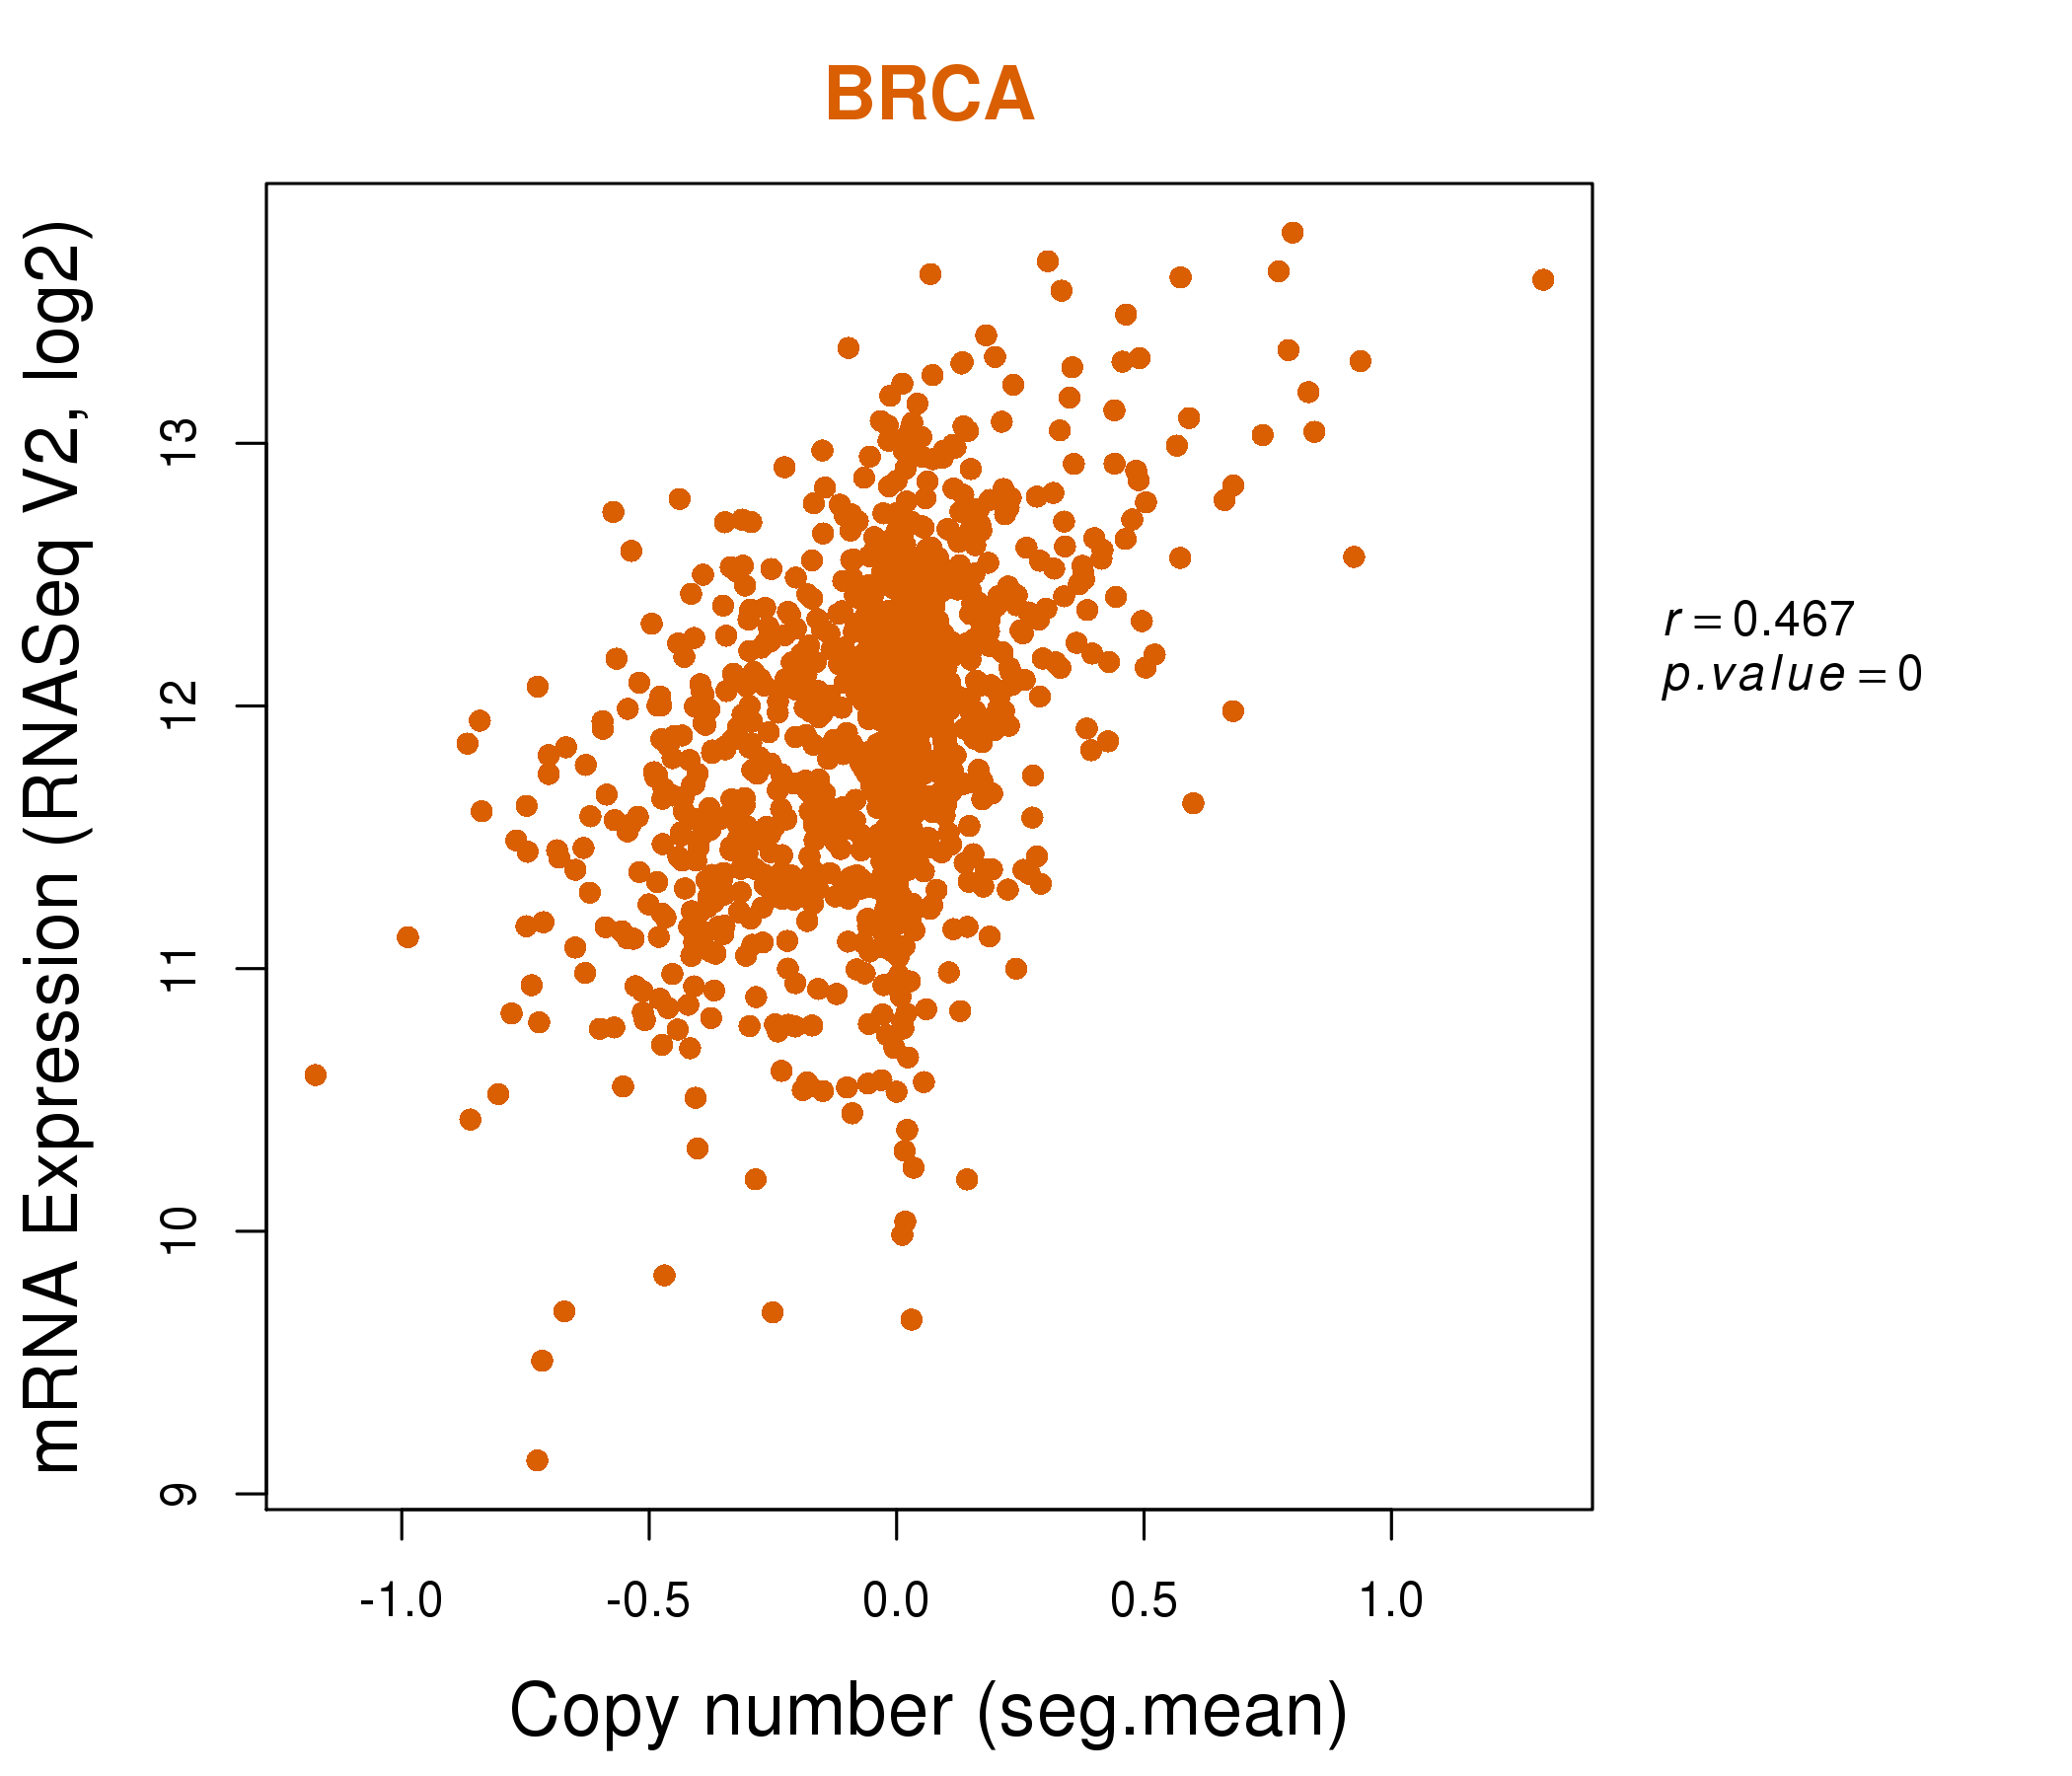
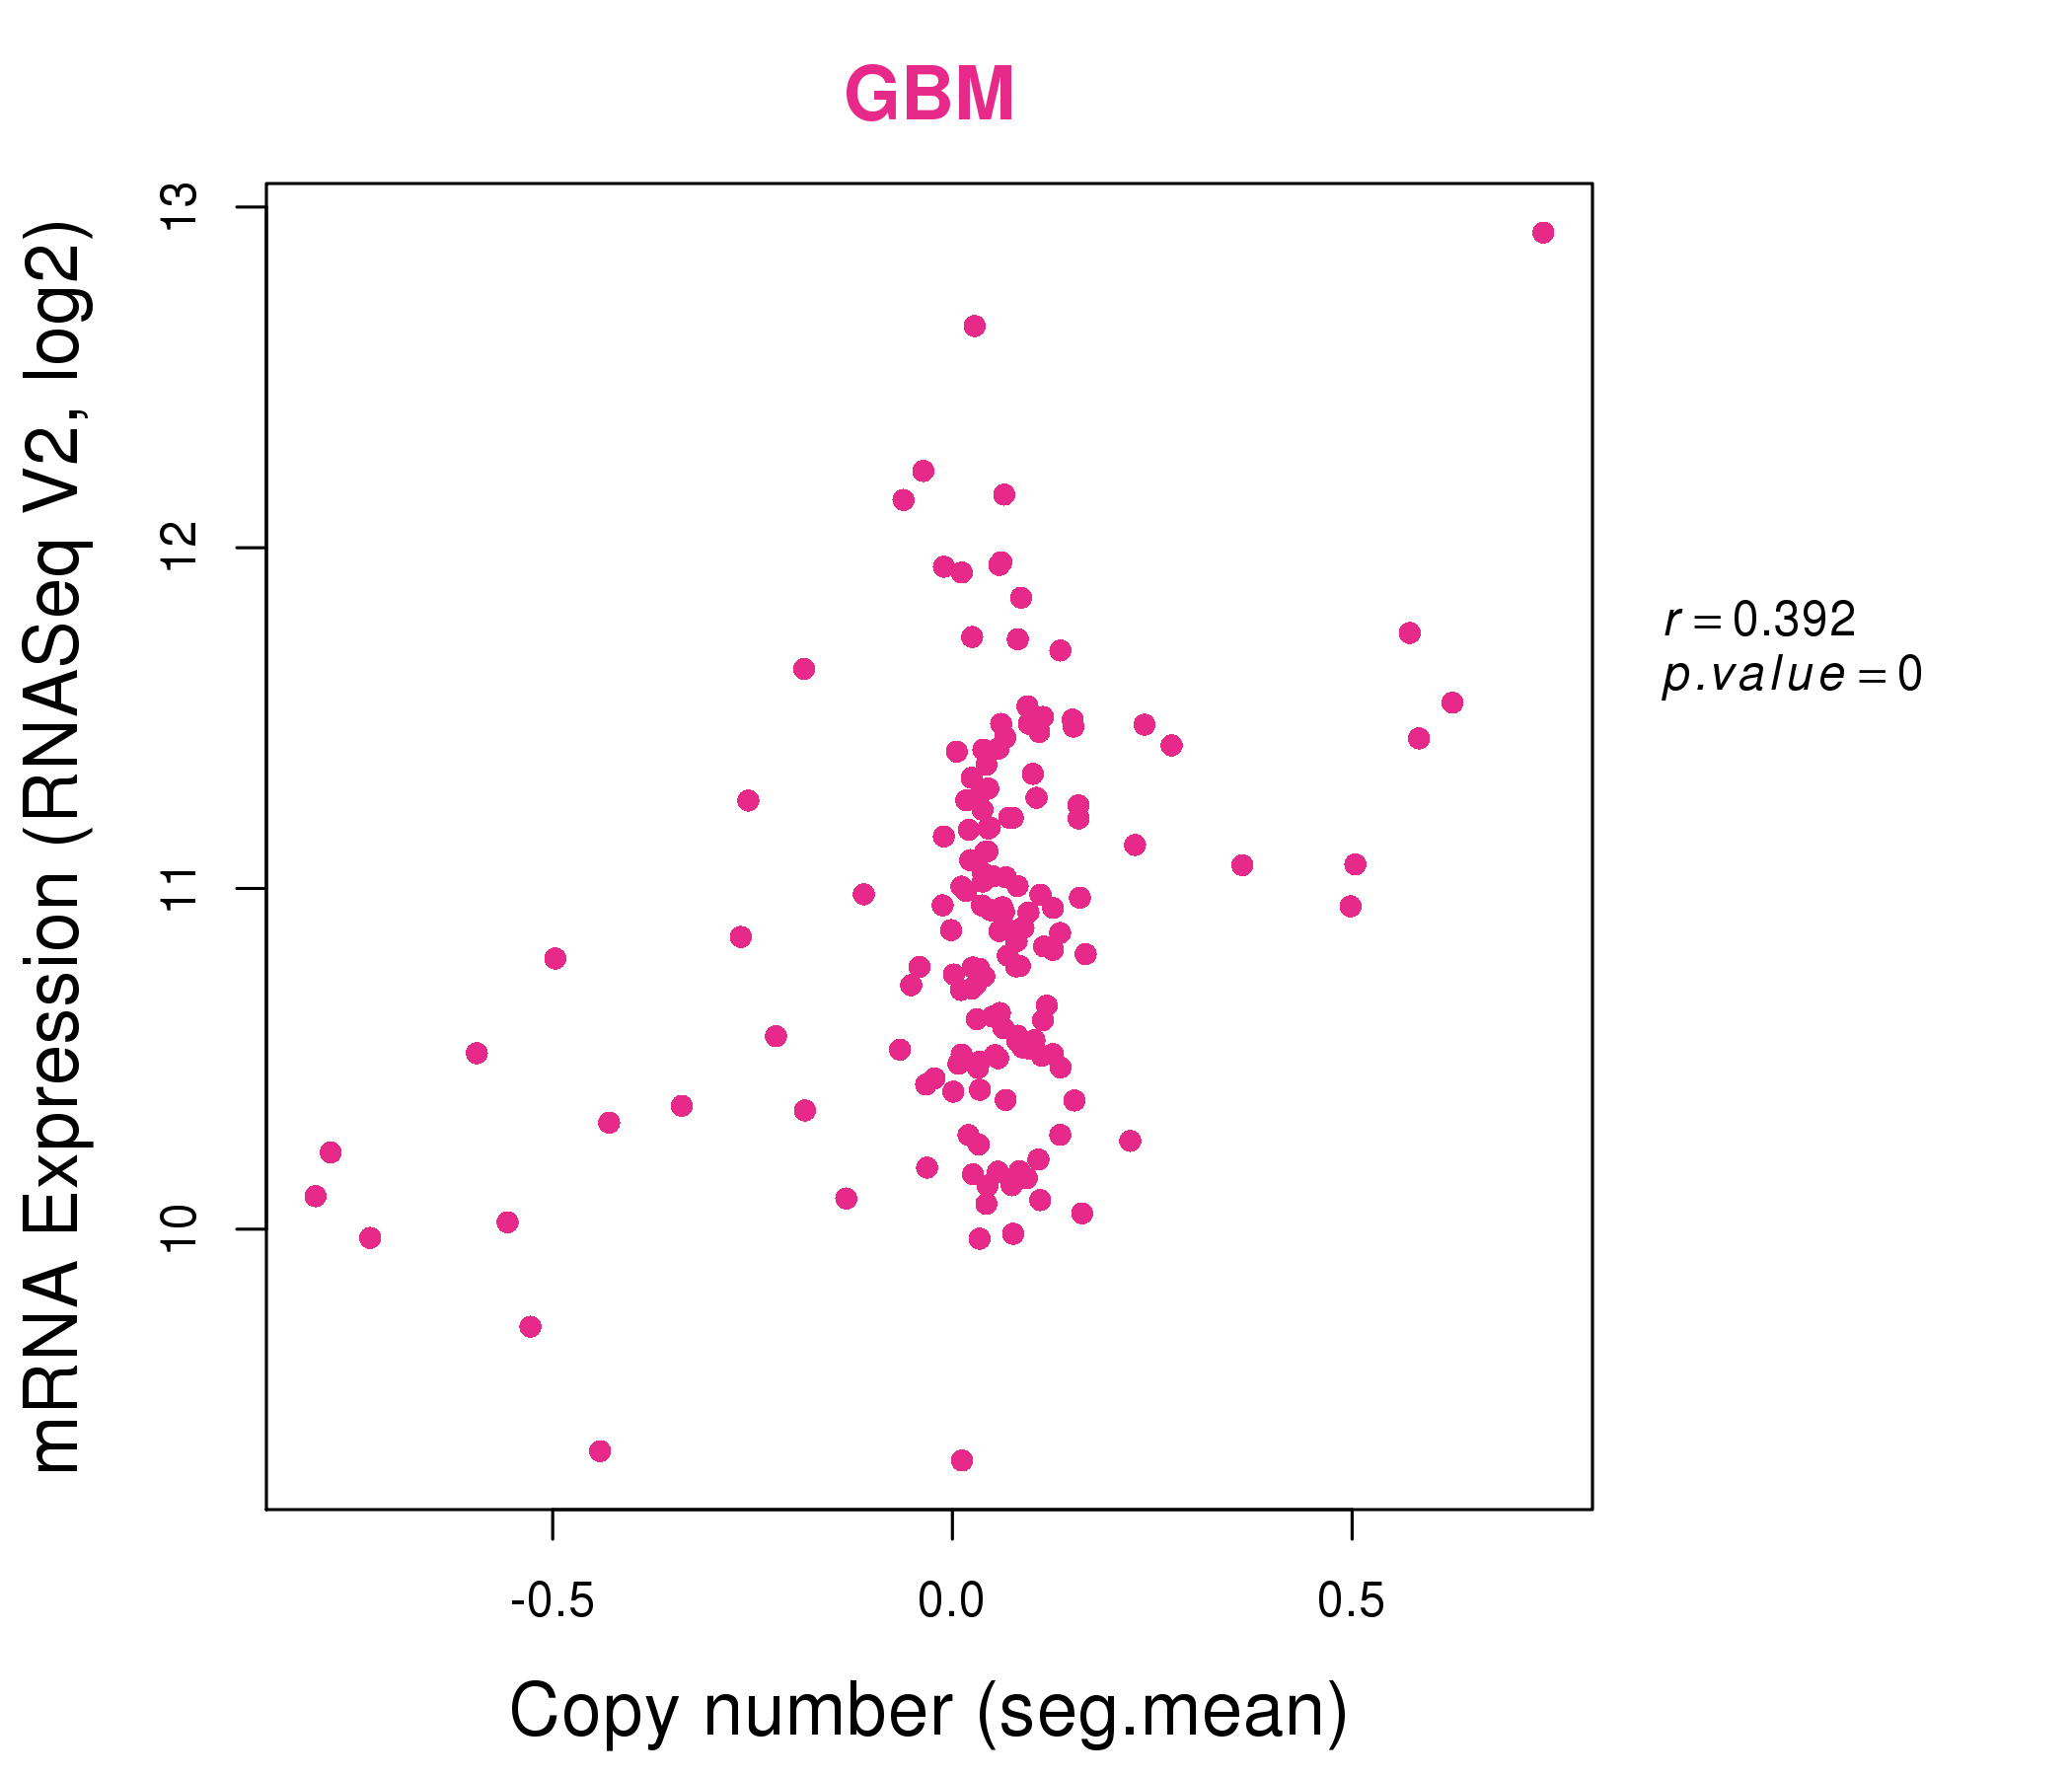
| * Normalized gene expression data of RNASeqV2 was extracted from TCGA using R package TCGA-Assembler. The URLs of all public data files on TCGA DCC data server were gathered at Jan-05-2015. Only eight cancer types have enough normal control samples for differential expression analysis. (t test, adjusted p<0.05 (using Benjamini-Hochberg FDR)) |
 |
| Top |
| * This plots show the correlation between CNV and gene expression. |
: Open all plots for all cancer types
 |
|
 |
|
| Top |
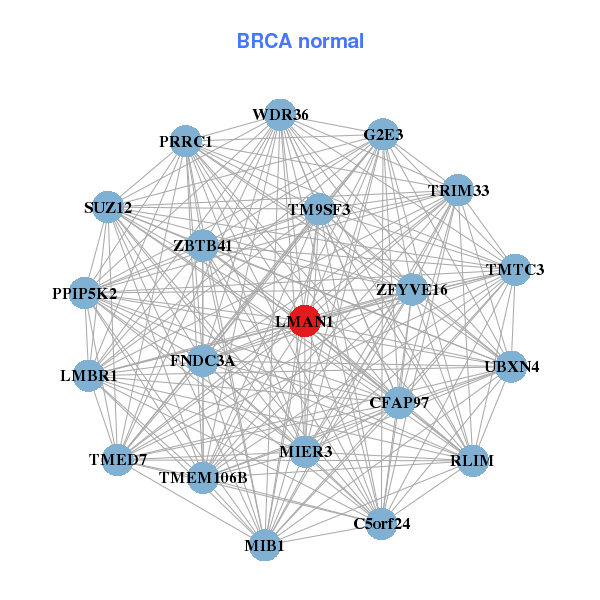
| Gene-Gene Network Information |
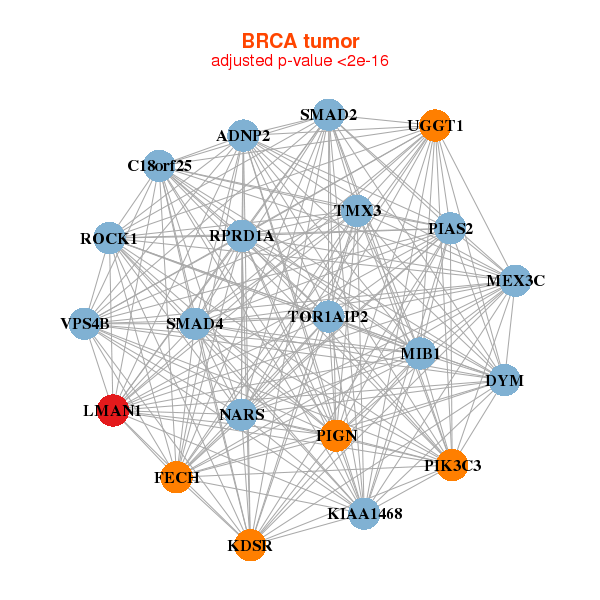
| * Co-Expression network figures were drawn using R package igraph. Only the top 20 genes with the highest correlations were shown. Red circle: input gene, orange circle: cell metabolism gene, sky circle: other gene |
: Open all plots for all cancer types
 |
|
| ADNP2,C18orf25,DYM,FECH,KDSR,KIAA1468,LMAN1, MEX3C,MIB1,NARS,PIAS2,PIGN,PIK3C3,ROCK1, RPRD1A,SMAD2,SMAD4,TMX3,TOR1AIP2,UGGT1,VPS4B | C5orf24,FNDC3A,G2E3,CFAP97,LMAN1,LMBR1,MIB1, MIER3,PPIP5K2,PRRC1,RLIM,SUZ12,TM9SF3,TMED7, TMEM106B,TMTC3,TRIM33,UBXN4,WDR36,ZBTB41,ZFYVE16 |
 |
|
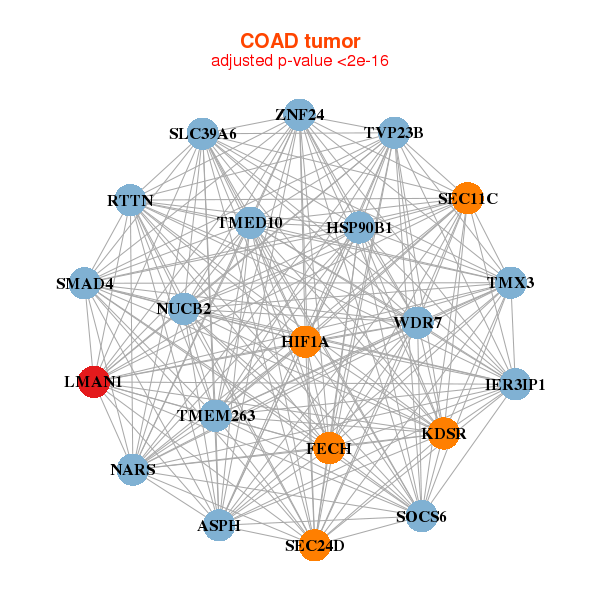
| ASPH,TMEM263,TVP23B,FECH,HIF1A,HSP90B1,IER3IP1, KDSR,LMAN1,NARS,NUCB2,RTTN,SEC11C,SEC24D, SLC39A6,SMAD4,SOCS6,TMED10,TMX3,WDR7,ZNF24 | CADPS2,CD44,CFH,DNAJC10,FNDC3A,GPR37,HIF1A, HRH2,HSP90B1,LMAN1,MCTP1,MORC4,NUCB2,PDIA5, RFX3,SEC24D,SLC10A7,SLC38A5,STT3A,USO1,XPO7 |
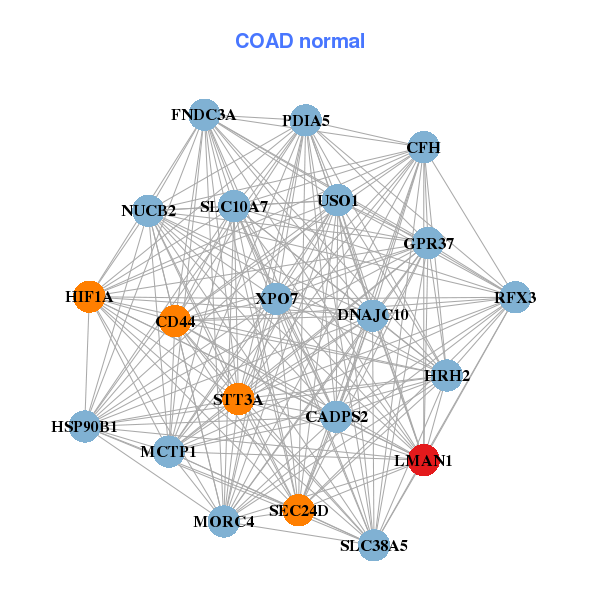
| * Co-Expression network figures were drawn using R package igraph. Only the top 20 genes with the highest correlations were shown. Red circle: input gene, orange circle: cell metabolism gene, sky circle: other gene |
: Open all plots for all cancer types
| Top |
: Open all interacting genes' information including KEGG pathway for all interacting genes from DAVID
| Top |
| Pharmacological Information for LMAN1 |
| There's no related Drug. |
| Top |
| Cross referenced IDs for LMAN1 |
| * We obtained these cross-references from Uniprot database. It covers 150 different DBs, 18 categories. http://www.uniprot.org/help/cross_references_section |
: Open all cross reference information
|
Copyright © 2016-Present - The Univsersity of Texas Health Science Center at Houston @ |