|
|||||||||||||||||||||||||||||||||||||||||||||||||||||||||||||||||||||||||||||||||||||||||||||||||||||||||||||||||||||||||||||||||||||||||||||||||||||||||||||||||||||||||||||||||||||||||||||||||||||||||||||||||||||||||||||||||||||||||||||||||||||||||||||||||||||||||||||||||||||||||||||||||||||||||||||||||||||||||||||||||||||||||||||
| |
| Phenotypic Information (metabolism pathway, cancer, disease, phenome) |
| |
| |
| Gene-Gene Network Information: Co-Expression Network, Interacting Genes & KEGG |
| |
|


| Gene Summary for LPA |
| Basic gene info. | Gene symbol | LPA |
| Gene name | lipoprotein, Lp(a) | |
| Synonyms | AK38|APOA|LP | |
| Cytomap | UCSC genome browser: 6q26 | |
| Genomic location | chr6 :160952514-161087407 | |
| Type of gene | protein-coding | |
| RefGenes | NM_005577.2, | |
| Ensembl id | ENSG00000198670 | |
| Description | antiangiogenic AK38 proteinapo(a)apolipoprotein(a)lp(a) | |
| Modification date | 20141222 | |
| dbXrefs | MIM : 152200 | |
| HGNC : HGNC | ||
| Ensembl : ENSG00000198670 | ||
| HPRD : 01063 | ||
| Vega : OTTHUMG00000015956 | ||
| Protein | UniProt: go to UniProt's Cross Reference DB Table | |
| Expression | CleanEX: HS_LPA | |
| BioGPS: 4018 | ||
| Gene Expression Atlas: ENSG00000198670 | ||
| The Human Protein Atlas: ENSG00000198670 | ||
| Pathway | NCI Pathway Interaction Database: LPA | |
| KEGG: LPA | ||
| REACTOME: LPA | ||
| ConsensusPathDB | ||
| Pathway Commons: LPA | ||
| Metabolism | MetaCyc: LPA | |
| HUMANCyc: LPA | ||
| Regulation | Ensembl's Regulation: ENSG00000198670 | |
| miRBase: chr6 :160,952,514-161,087,407 | ||
| TargetScan: NM_005577 | ||
| cisRED: ENSG00000198670 | ||
| Context | iHOP: LPA | |
| cancer metabolism search in PubMed: LPA | ||
| UCL Cancer Institute: LPA | ||
| Assigned class in ccmGDB | C | |
| Top |
| Phenotypic Information for LPA(metabolism pathway, cancer, disease, phenome) |
| Cancer | CGAP: LPA |
| Familial Cancer Database: LPA | |
| * This gene is included in those cancer gene databases. |
|
|
|
|
|
| . | |||||||||||||||||||||||||||||||||||||||||||||||||||||||||||||||||||||||||||||||||||||||||||||||||||||||||||||||||||||||||||||||||||||||||||||||||||||||||||||||||||||||||||||||||||||||||||||||||||||||||||||||||||||||||||||||||||||||||||||||||||||||||||||||||||||||||||||||||||||||||||||||||||||||||||||||||||||||||||||||||||||||
Oncogene 1 | Significant driver gene in | ||||||||||||||||||||||||||||||||||||||||||||||||||||||||||||||||||||||||||||||||||||||||||||||||||||||||||||||||||||||||||||||||||||||||||||||||||||||||||||||||||||||||||||||||||||||||||||||||||||||||||||||||||||||||||||||||||||||||||||||||||||||||||||||||||||||||||||||||||||||||||||||||||||||||||||||||||||||||||||||||||||||||||||
| cf) number; DB name 1 Oncogene; http://nar.oxfordjournals.org/content/35/suppl_1/D721.long, 2 Tumor Suppressor gene; https://bioinfo.uth.edu/TSGene/, 3 Cancer Gene Census; http://www.nature.com/nrc/journal/v4/n3/abs/nrc1299.html, 4 CancerGenes; http://nar.oxfordjournals.org/content/35/suppl_1/D721.long, 5 Network of Cancer Gene; http://ncg.kcl.ac.uk/index.php, 1Therapeutic Vulnerabilities in Cancer; http://cbio.mskcc.org/cancergenomics/statius/ |
| REACTOME_METABOLISM_OF_LIPIDS_AND_LIPOPROTEINS REACTOME_LIPOPROTEIN_METABOLISM | |
| OMIM | |
| Orphanet | |
| Disease | KEGG Disease: LPA |
| MedGen: LPA (Human Medical Genetics with Condition) | |
| ClinVar: LPA | |
| Phenotype | MGI: LPA (International Mouse Phenotyping Consortium) |
| PhenomicDB: LPA | |
| Mutations for LPA |
| * Under tables are showing count per each tissue to give us broad intuition about tissue specific mutation patterns.You can go to the detailed page for each mutation database's web site. |
| - Statistics for Tissue and Mutation type | Top |
 |
| - For Inter-chromosomal Variations |
| * Inter-chromosomal variantions includes 'interchromosomal amplicon to amplicon', 'interchromosomal amplicon to non-amplified dna', 'interchromosomal insertion', 'Interchromosomal unknown type'. |
 |
| - For Intra-chromosomal Variations |
| There's no intra-chromosomal structural variation. |
| Sample | Symbol_a | Chr_a | Start_a | End_a | Symbol_b | Chr_b | Start_b | End_b |
| ovary | LPA | chr6 | 161074913 | 161075113 | chr9 | 82548923 | 82549123 | |
| pancreas | LPA | chr6 | 160956231 | 160956251 | chr20 | 60957299 | 60957319 |
| cf) Tissue number; Tissue name (1;Breast, 2;Central_nervous_system, 3;Haematopoietic_and_lymphoid_tissue, 4;Large_intestine, 5;Liver, 6;Lung, 7;Ovary, 8;Pancreas, 9;Prostate, 10;Skin, 11;Soft_tissue, 12;Upper_aerodigestive_tract) |
| * From mRNA Sanger sequences, Chitars2.0 arranged chimeric transcripts. This table shows LPA related fusion information. |
| ID | Head Gene | Tail Gene | Accession | Gene_a | qStart_a | qEnd_a | Chromosome_a | tStart_a | tEnd_a | Gene_a | qStart_a | qEnd_a | Chromosome_a | tStart_a | tEnd_a |
| Top |
| Mutation type/ Tissue ID | brca | cns | cerv | endome | haematopo | kidn | Lintest | liver | lung | ns | ovary | pancre | prost | skin | stoma | thyro | urina | |||
| Total # sample | 1 | 1 | ||||||||||||||||||
| GAIN (# sample) | ||||||||||||||||||||
| LOSS (# sample) | 1 | 1 |
| cf) Tissue ID; Tissue type (1; Breast, 2; Central_nervous_system, 3; Cervix, 4; Endometrium, 5; Haematopoietic_and_lymphoid_tissue, 6; Kidney, 7; Large_intestine, 8; Liver, 9; Lung, 10; NS, 11; Ovary, 12; Pancreas, 13; Prostate, 14; Skin, 15; Stomach, 16; Thyroid, 17; Urinary_tract) |
| Top |
|
 |
| Top |
| Stat. for Non-Synonymous SNVs (# total SNVs=337) | (# total SNVs=99) |
 |  |
(# total SNVs=2) | (# total SNVs=1) |
 |  |
| Top |
| * When you move the cursor on each content, you can see more deailed mutation information on the Tooltip. Those are primary_site,primary_histology,mutation(aa),pubmedID. |
| GRCh37 position | Mutation(aa) | Unique sampleID count |
| chr6:160977190-160977190 | p.R1614R | 5 |
| chr6:161067344-161067344 | p.E98G | 5 |
| chr6:161050772-161050772 | p.N417K | 4 |
| chr6:161067362-161067362 | p.D92G | 4 |
| chr6:161006078-161006078 | p.A1430V | 4 |
| chr6:161027563-161027563 | p.V911F | 4 |
| chr6:161032668-161032668 | p.T843T | 4 |
| chr6:161067377-161067377 | p.Y87F | 4 |
| chr6:161045160-161045160 | p.E554G | 4 |
| chr6:161061871-161061871 | p.I187I | 3 |
| Top |
|
 |
| Point Mutation/ Tissue ID | 1 | 2 | 3 | 4 | 5 | 6 | 7 | 8 | 9 | 10 | 11 | 12 | 13 | 14 | 15 | 16 | 17 | 18 | 19 | 20 |
| # sample | 7 | 9 | 30 | 3 | 7 | 2 | 1 | 36 | 16 | 9 | 4 | 2 | 39 | 16 | 15 | |||||
| # mutation | 7 | 9 | 29 | 3 | 7 | 2 | 1 | 42 | 17 | 9 | 2 | 2 | 49 | 17 | 19 | |||||
| nonsynonymous SNV | 7 | 8 | 18 | 2 | 6 | 1 | 1 | 35 | 13 | 5 | 2 | 38 | 12 | 14 | ||||||
| synonymous SNV | 1 | 12 | 1 | 1 | 1 | 7 | 4 | 4 | 2 | 11 | 5 | 5 |
| cf) Tissue ID; Tissue type (1; BLCA[Bladder Urothelial Carcinoma], 2; BRCA[Breast invasive carcinoma], 3; CESC[Cervical squamous cell carcinoma and endocervical adenocarcinoma], 4; COAD[Colon adenocarcinoma], 5; GBM[Glioblastoma multiforme], 6; Glioma Low Grade, 7; HNSC[Head and Neck squamous cell carcinoma], 8; KICH[Kidney Chromophobe], 9; KIRC[Kidney renal clear cell carcinoma], 10; KIRP[Kidney renal papillary cell carcinoma], 11; LAML[Acute Myeloid Leukemia], 12; LUAD[Lung adenocarcinoma], 13; LUSC[Lung squamous cell carcinoma], 14; OV[Ovarian serous cystadenocarcinoma ], 15; PAAD[Pancreatic adenocarcinoma], 16; PRAD[Prostate adenocarcinoma], 17; SKCM[Skin Cutaneous Melanoma], 18:STAD[Stomach adenocarcinoma], 19:THCA[Thyroid carcinoma], 20:UCEC[Uterine Corpus Endometrial Carcinoma]) |
| Top |
| * We represented just top 10 SNVs. When you move the cursor on each content, you can see more deailed mutation information on the Tooltip. Those are primary_site, primary_histology, mutation(aa), pubmedID. |
| Genomic Position | Mutation(aa) | Unique sampleID count |
| chr6:160977190 | p.R1614W | 5 |
| chr6:161026093 | p.A977E | 5 |
| chr6:161006078 | p.A1430V | 4 |
| chr6:160977188 | p.V911I | 3 |
| chr6:161071386 | p.E65K | 3 |
| chr6:161027563 | p.R1614R | 3 |
| chr6:161022029 | p.P884T | 2 |
| chr6:160978466 | p.T1349M | 2 |
| chr6:161007564 | p.K2001I | 2 |
| chr6:161020597 | p.E1344G | 2 |
| * Copy number data were extracted from TCGA using R package TCGA-Assembler. The URLs of all public data files on TCGA DCC data server were gathered on Jan-05-2015. Function ProcessCNAData in TCGA-Assembler package was used to obtain gene-level copy number value which is calculated as the average copy number of the genomic region of a gene. |
 |
| cf) Tissue ID[Tissue type]: BLCA[Bladder Urothelial Carcinoma], BRCA[Breast invasive carcinoma], CESC[Cervical squamous cell carcinoma and endocervical adenocarcinoma], COAD[Colon adenocarcinoma], GBM[Glioblastoma multiforme], Glioma Low Grade, HNSC[Head and Neck squamous cell carcinoma], KICH[Kidney Chromophobe], KIRC[Kidney renal clear cell carcinoma], KIRP[Kidney renal papillary cell carcinoma], LAML[Acute Myeloid Leukemia], LUAD[Lung adenocarcinoma], LUSC[Lung squamous cell carcinoma], OV[Ovarian serous cystadenocarcinoma ], PAAD[Pancreatic adenocarcinoma], PRAD[Prostate adenocarcinoma], SKCM[Skin Cutaneous Melanoma], STAD[Stomach adenocarcinoma], THCA[Thyroid carcinoma], UCEC[Uterine Corpus Endometrial Carcinoma] |
| Top |
| Gene Expression for LPA |
| * CCLE gene expression data were extracted from CCLE_Expression_Entrez_2012-10-18.res: Gene-centric RMA-normalized mRNA expression data. |
 |
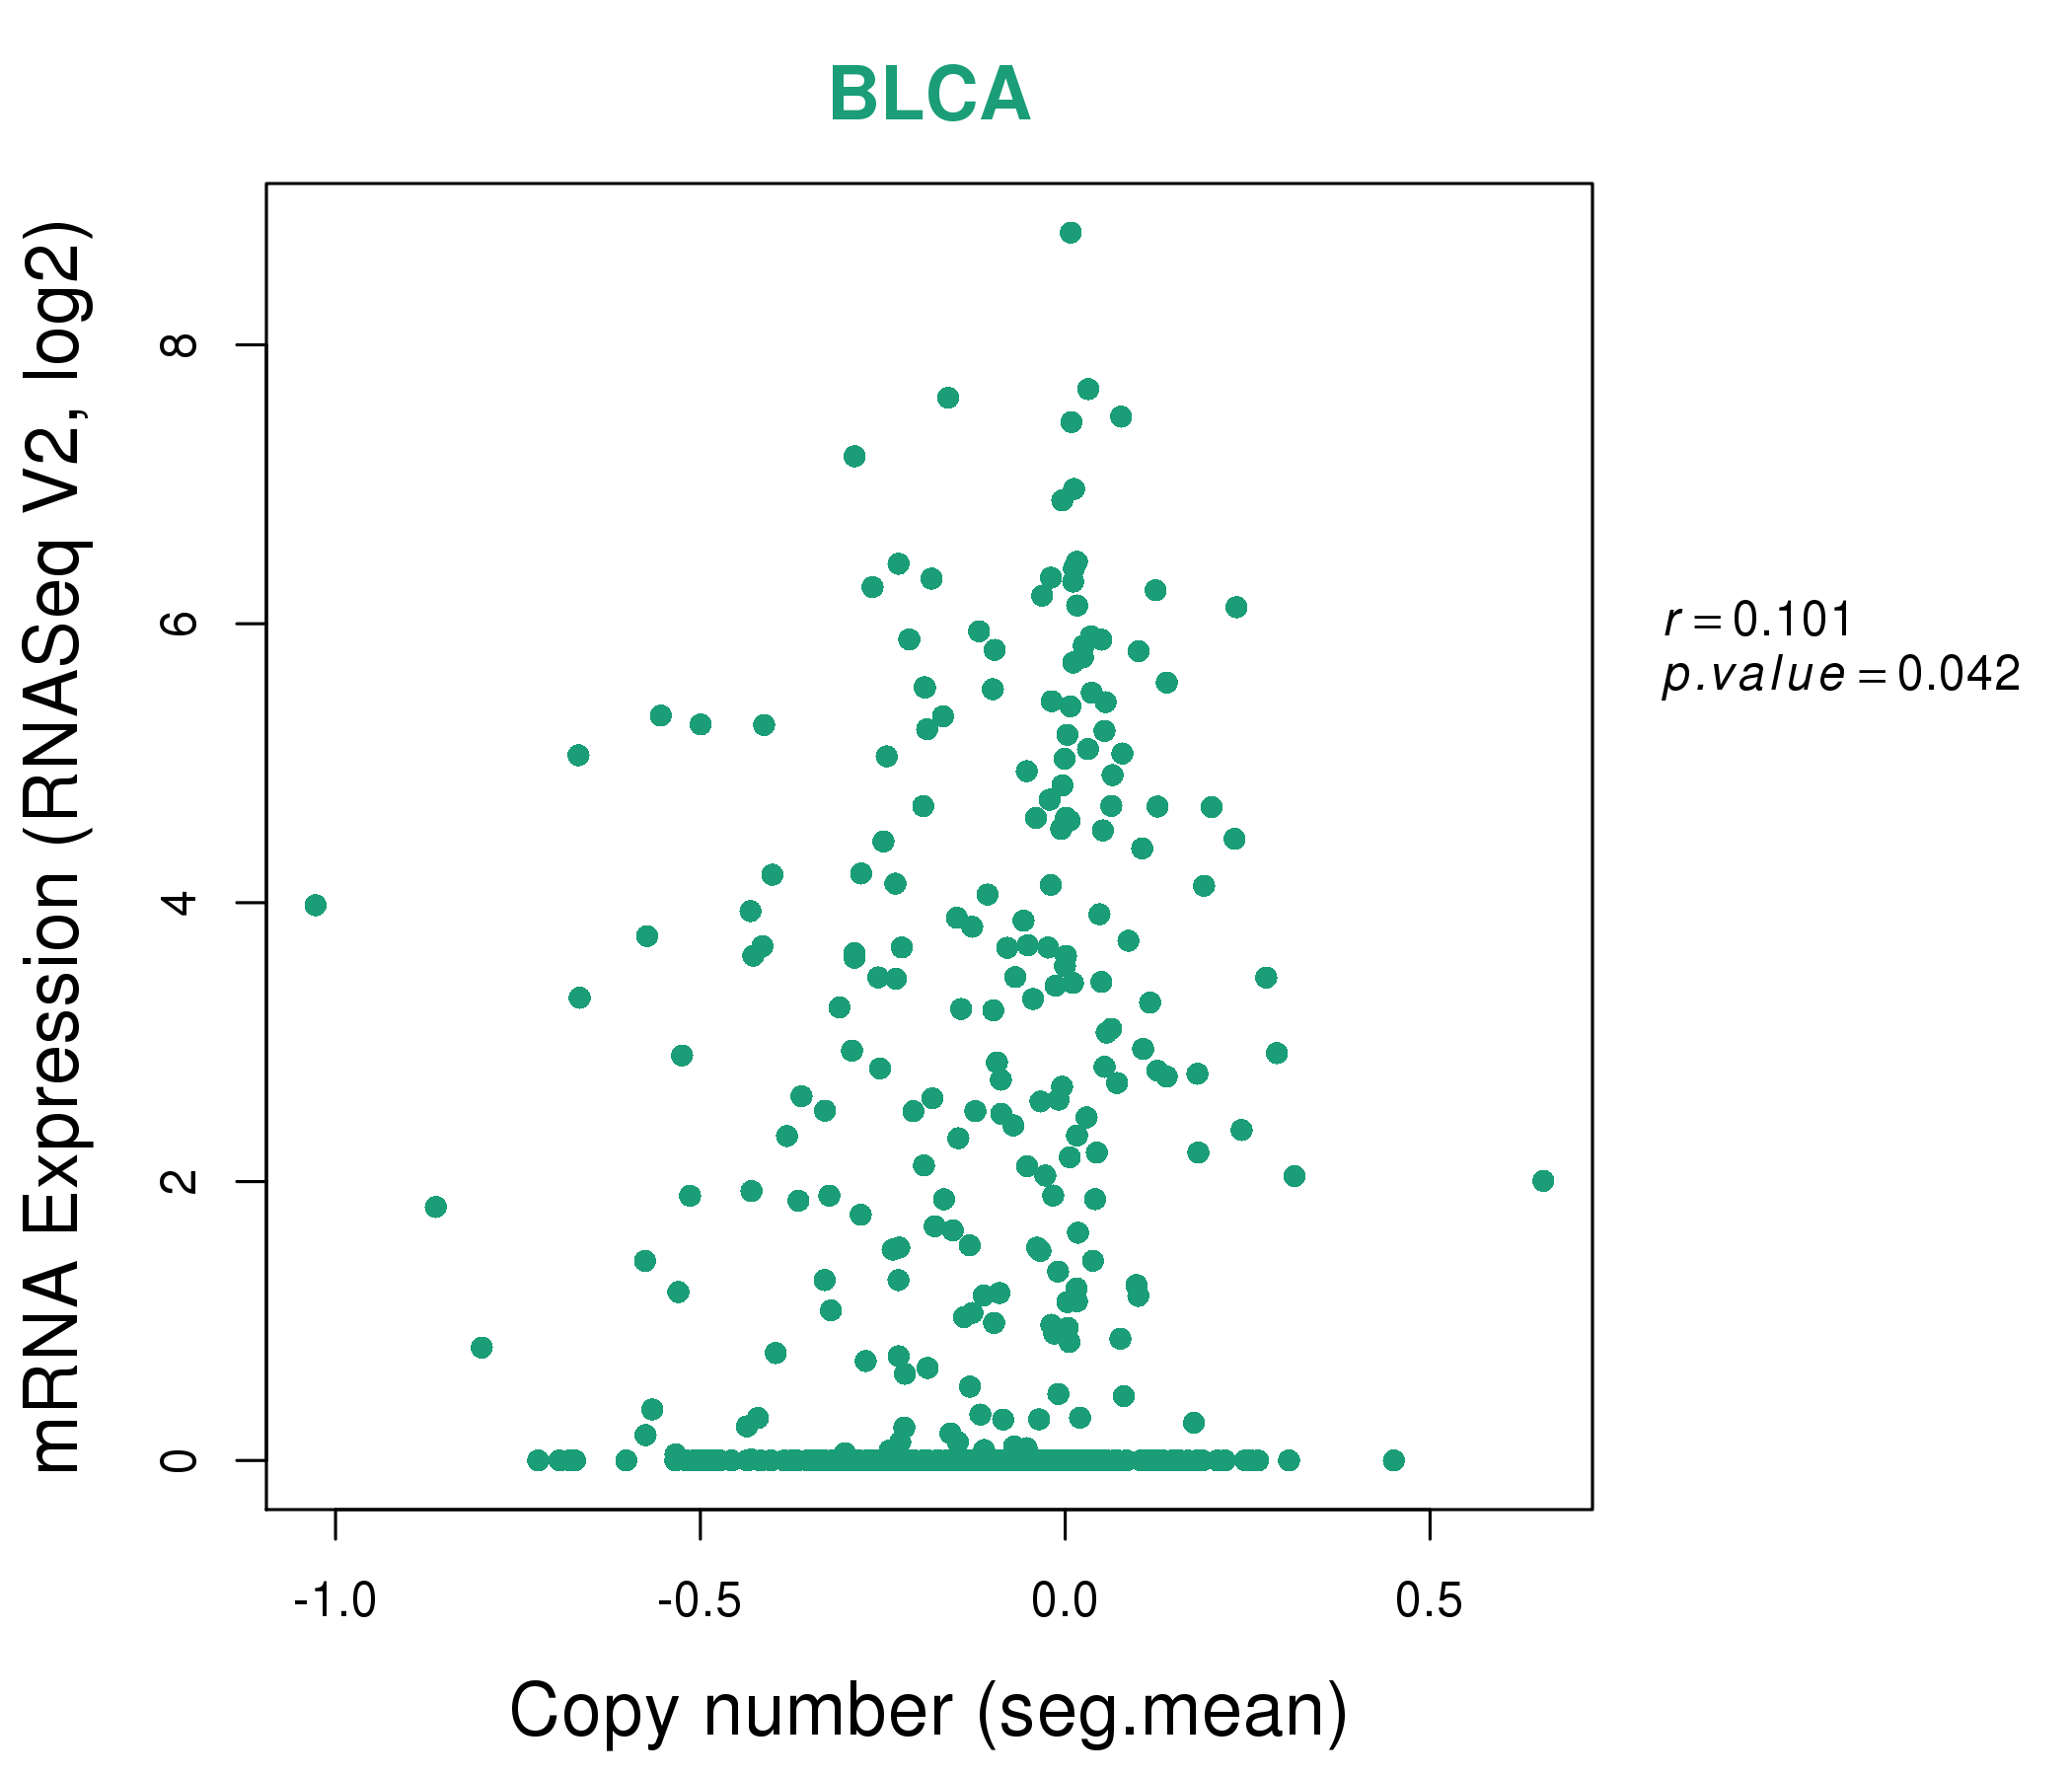
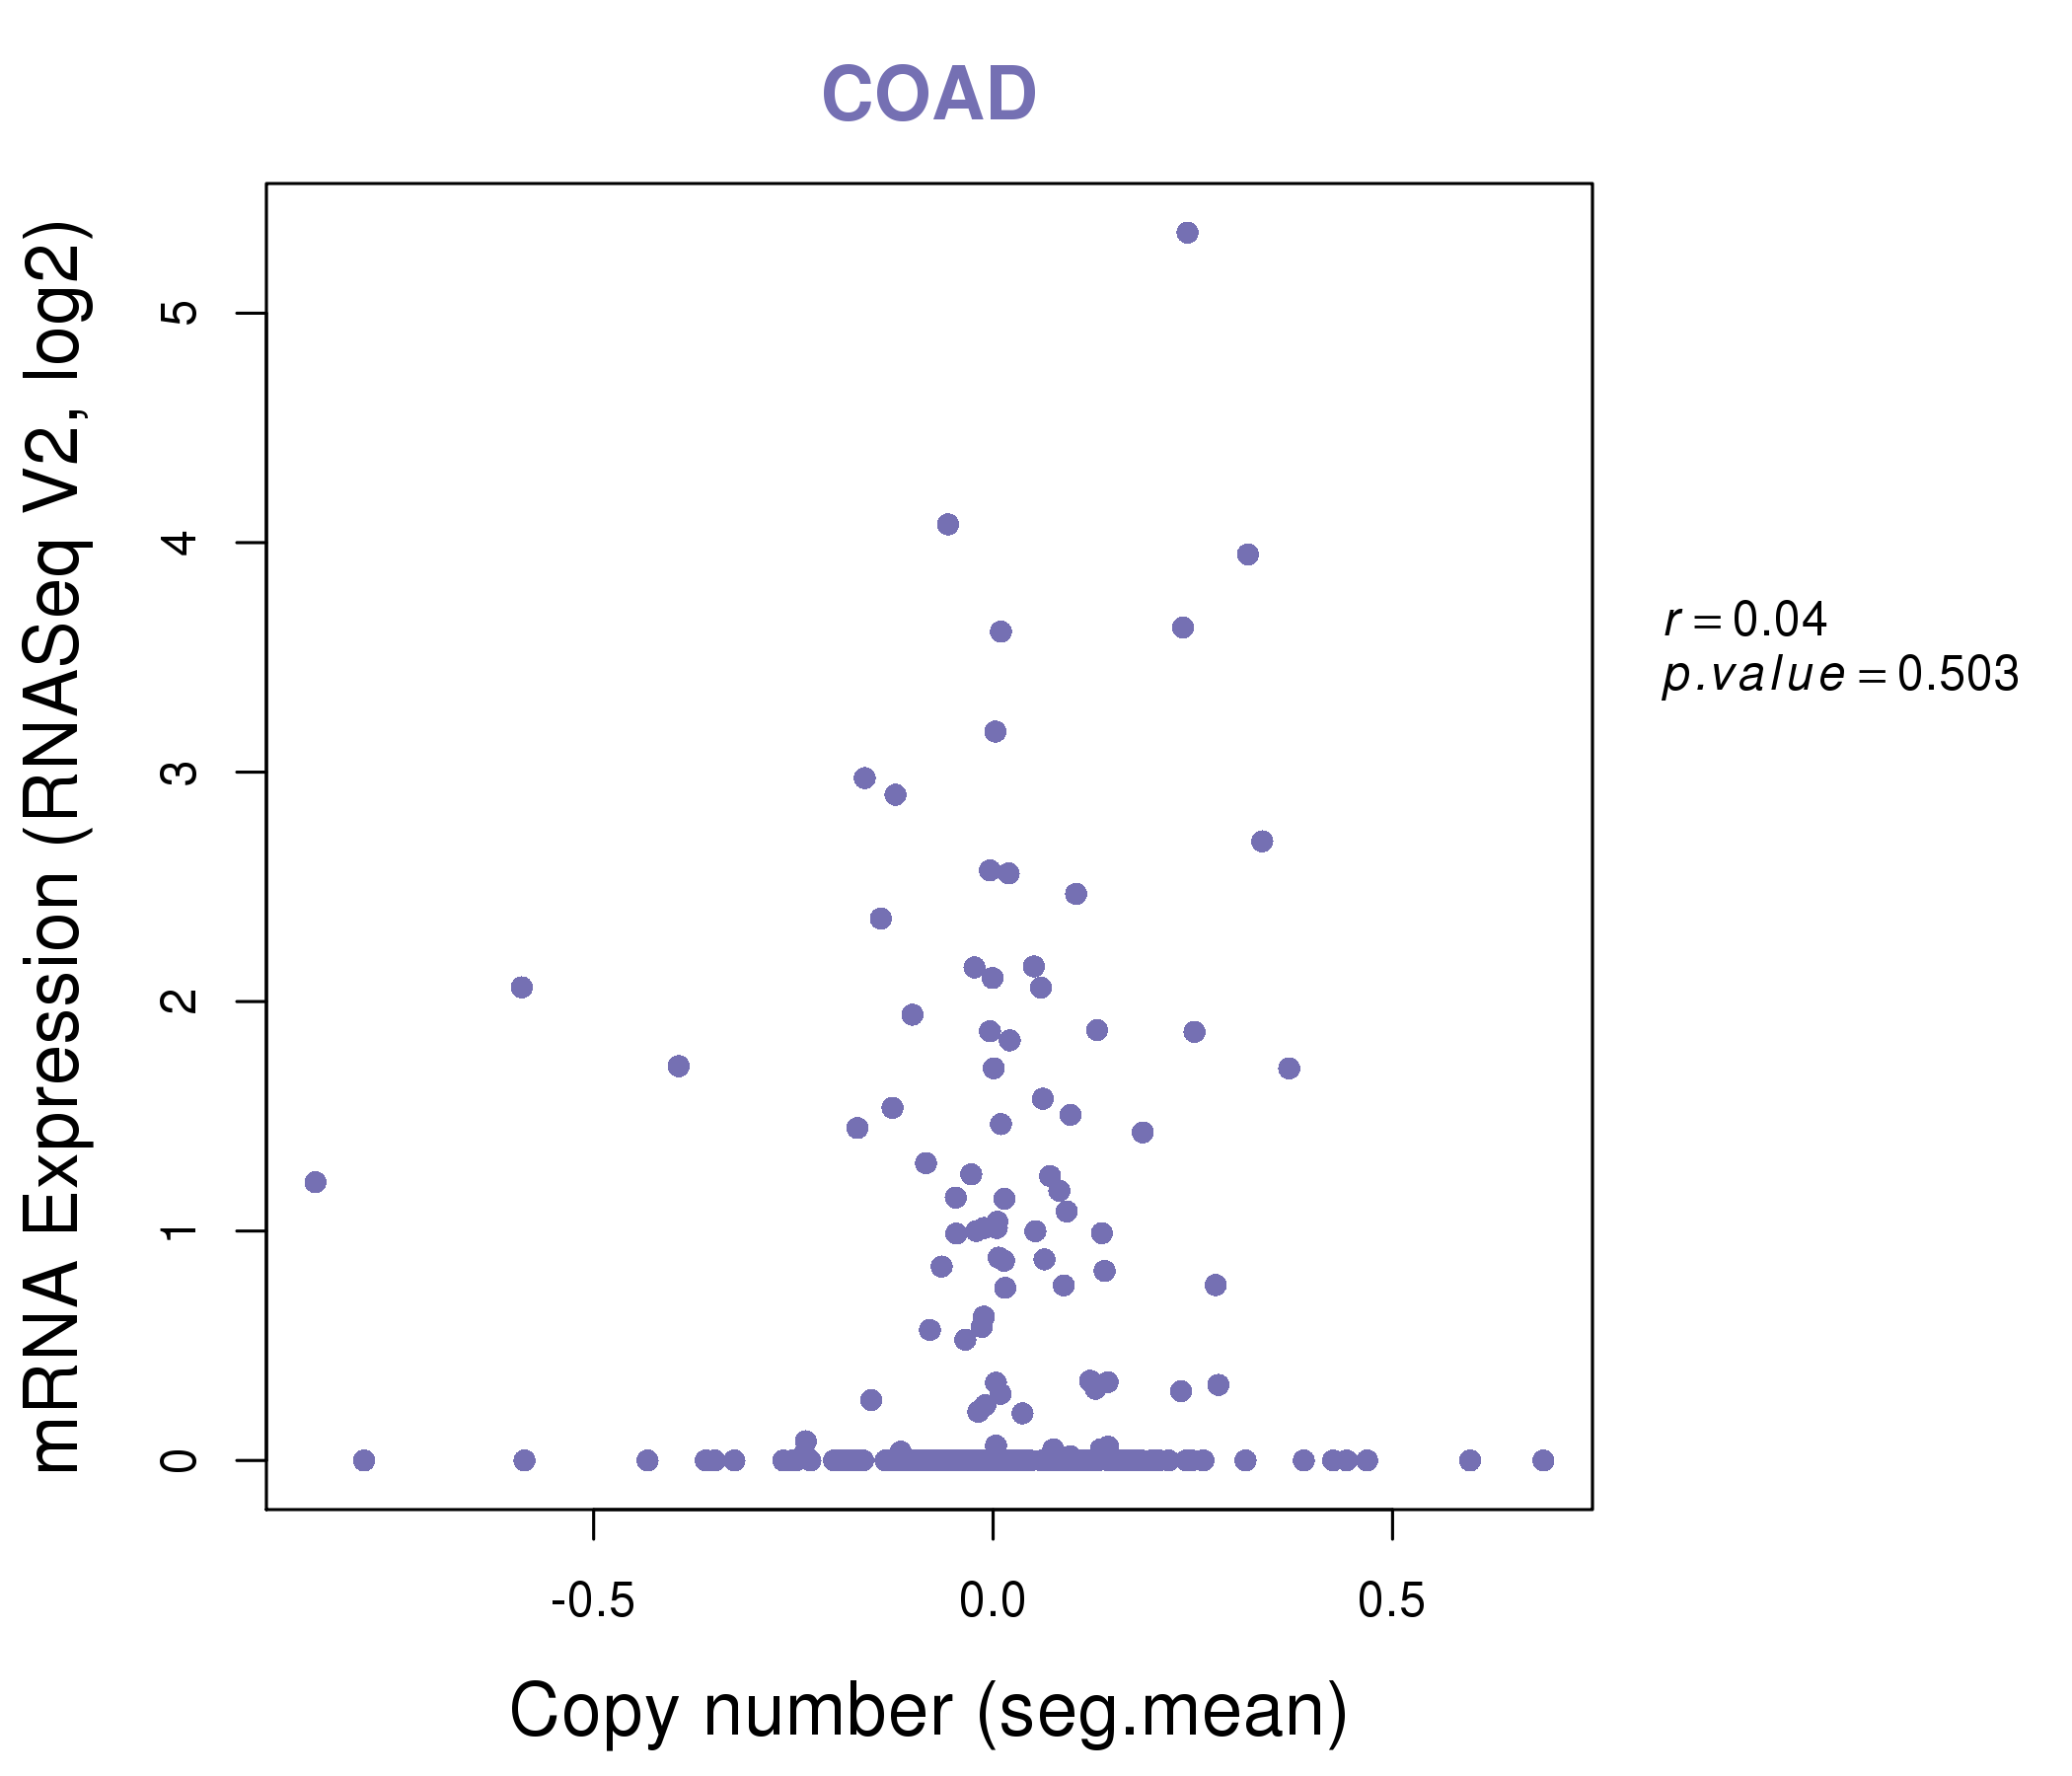
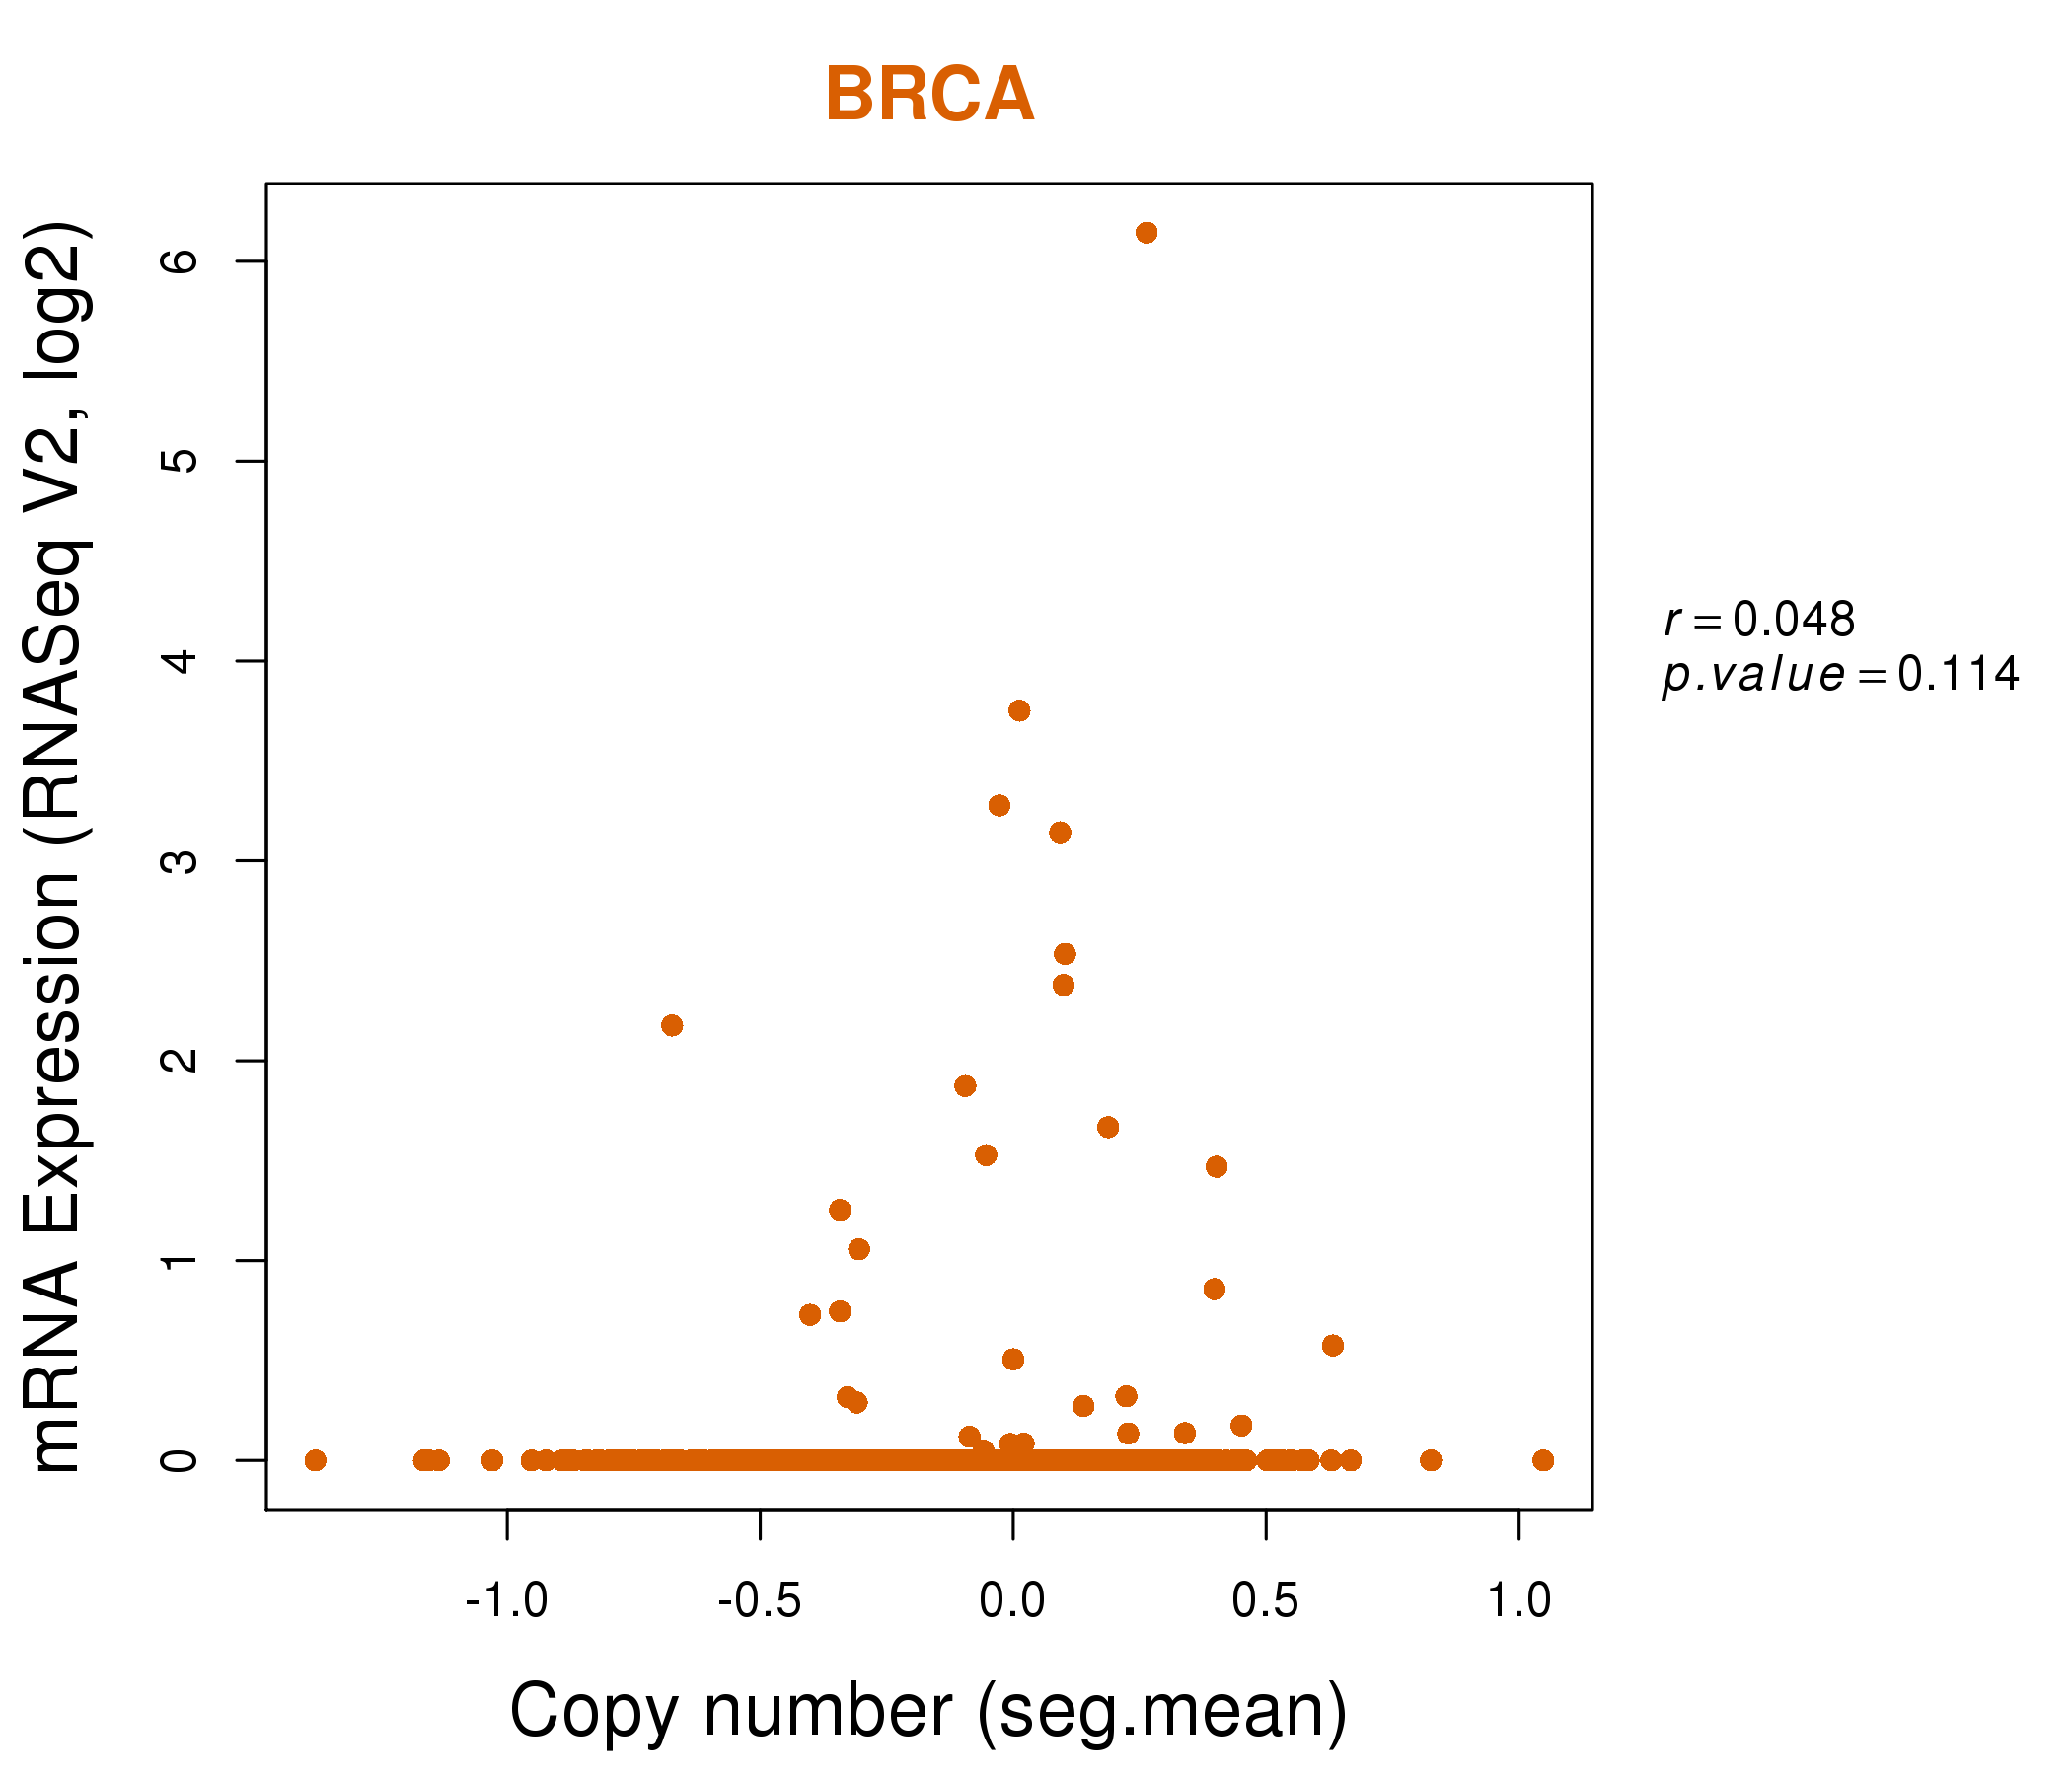
| * Normalized gene expression data of RNASeqV2 was extracted from TCGA using R package TCGA-Assembler. The URLs of all public data files on TCGA DCC data server were gathered at Jan-05-2015. Only eight cancer types have enough normal control samples for differential expression analysis. (t test, adjusted p<0.05 (using Benjamini-Hochberg FDR)) |
 |
| Top |
| * This plots show the correlation between CNV and gene expression. |
: Open all plots for all cancer types
 |
|
 |
|

| Top |
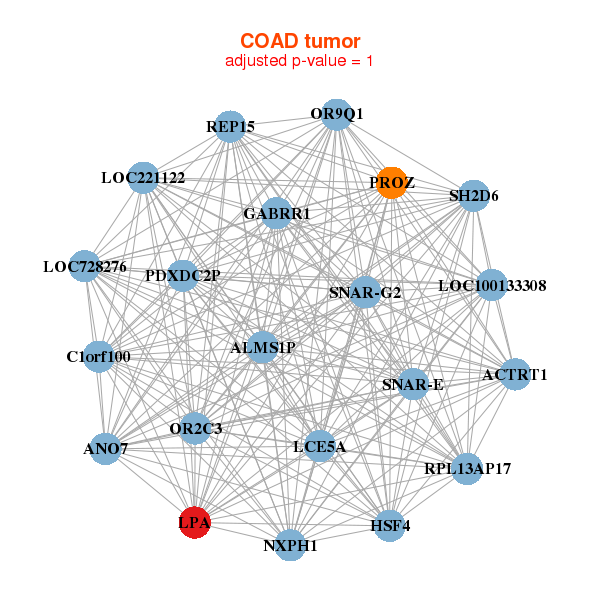
| Gene-Gene Network Information |
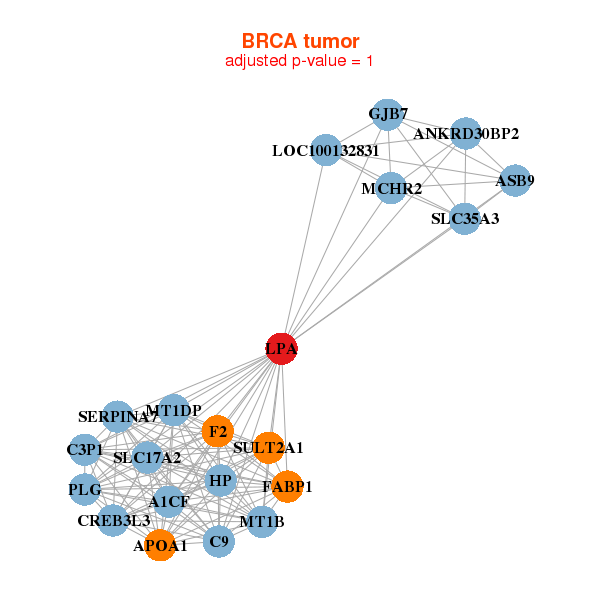
| * Co-Expression network figures were drawn using R package igraph. Only the top 20 genes with the highest correlations were shown. Red circle: input gene, orange circle: cell metabolism gene, sky circle: other gene |
: Open all plots for all cancer types
 |
| ||||
| A1CF,APOA1,ASB9,ANKRD30BP2,C3P1,C9,CREB3L3, F2,FABP1,GJB7,HP,LOC100132831,LPA,MCHR2, MT1B,MT1DP,PLG,SERPINA7,SLC17A2,SLC35A3,SULT2A1 | ALLC,AQP2,IZUMO2,CDH19,GFRA3,GJD4,GP2, LPA,MC2R,MMP27,NIPAL4,OLFM4,OLIG2,OR9I1, PCP4,PNCK,SNORA2B,SPDYE2,TNP2,UBE2DNL,UMOD | ||||
 |
| ||||
| ACTRT1,ALMS1P,ANO7,C1orf100,GABRR1,HSF4,LCE5A, LOC100133308,LOC221122,LOC728276,LPA,NXPH1,OR2C3,OR9Q1, PDXDC2P,PROZ,REP15,RPL13AP17,SH2D6,SNAR-E,SNAR-G2 | ACAN,C20orf141,NCOR1P1,CCDC129,CHAT,CLEC4G,GPX5, ITIH3,KPRP,LCE2C,LPA,MEPE,CHODL-AS1,OR2D2, PGLYRP3,POU2F3,SH2D7,SNORA79,TRIM6-TRIM34,TRPM5,ZSWIM2 |

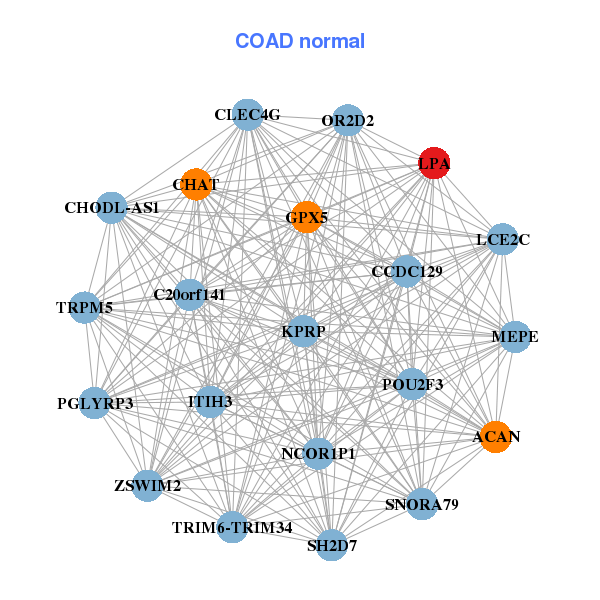
| * Co-Expression network figures were drawn using R package igraph. Only the top 20 genes with the highest correlations were shown. Red circle: input gene, orange circle: cell metabolism gene, sky circle: other gene |
: Open all plots for all cancer types
| Top |
: Open all interacting genes' information including KEGG pathway for all interacting genes from DAVID
| Top |
| Pharmacological Information for LPA |
| DB Category | DB Name | DB's ID and Url link |
| * Gene Centered Interaction Network. |
 |
| * Drug Centered Interaction Network. |
| DrugBank ID | Target Name | Drug Groups | Generic Name | Drug Centered Network | Drug Structure |
| DB00513 | lipoprotein, Lp(a) | approved; investigational | Aminocaproic Acid | 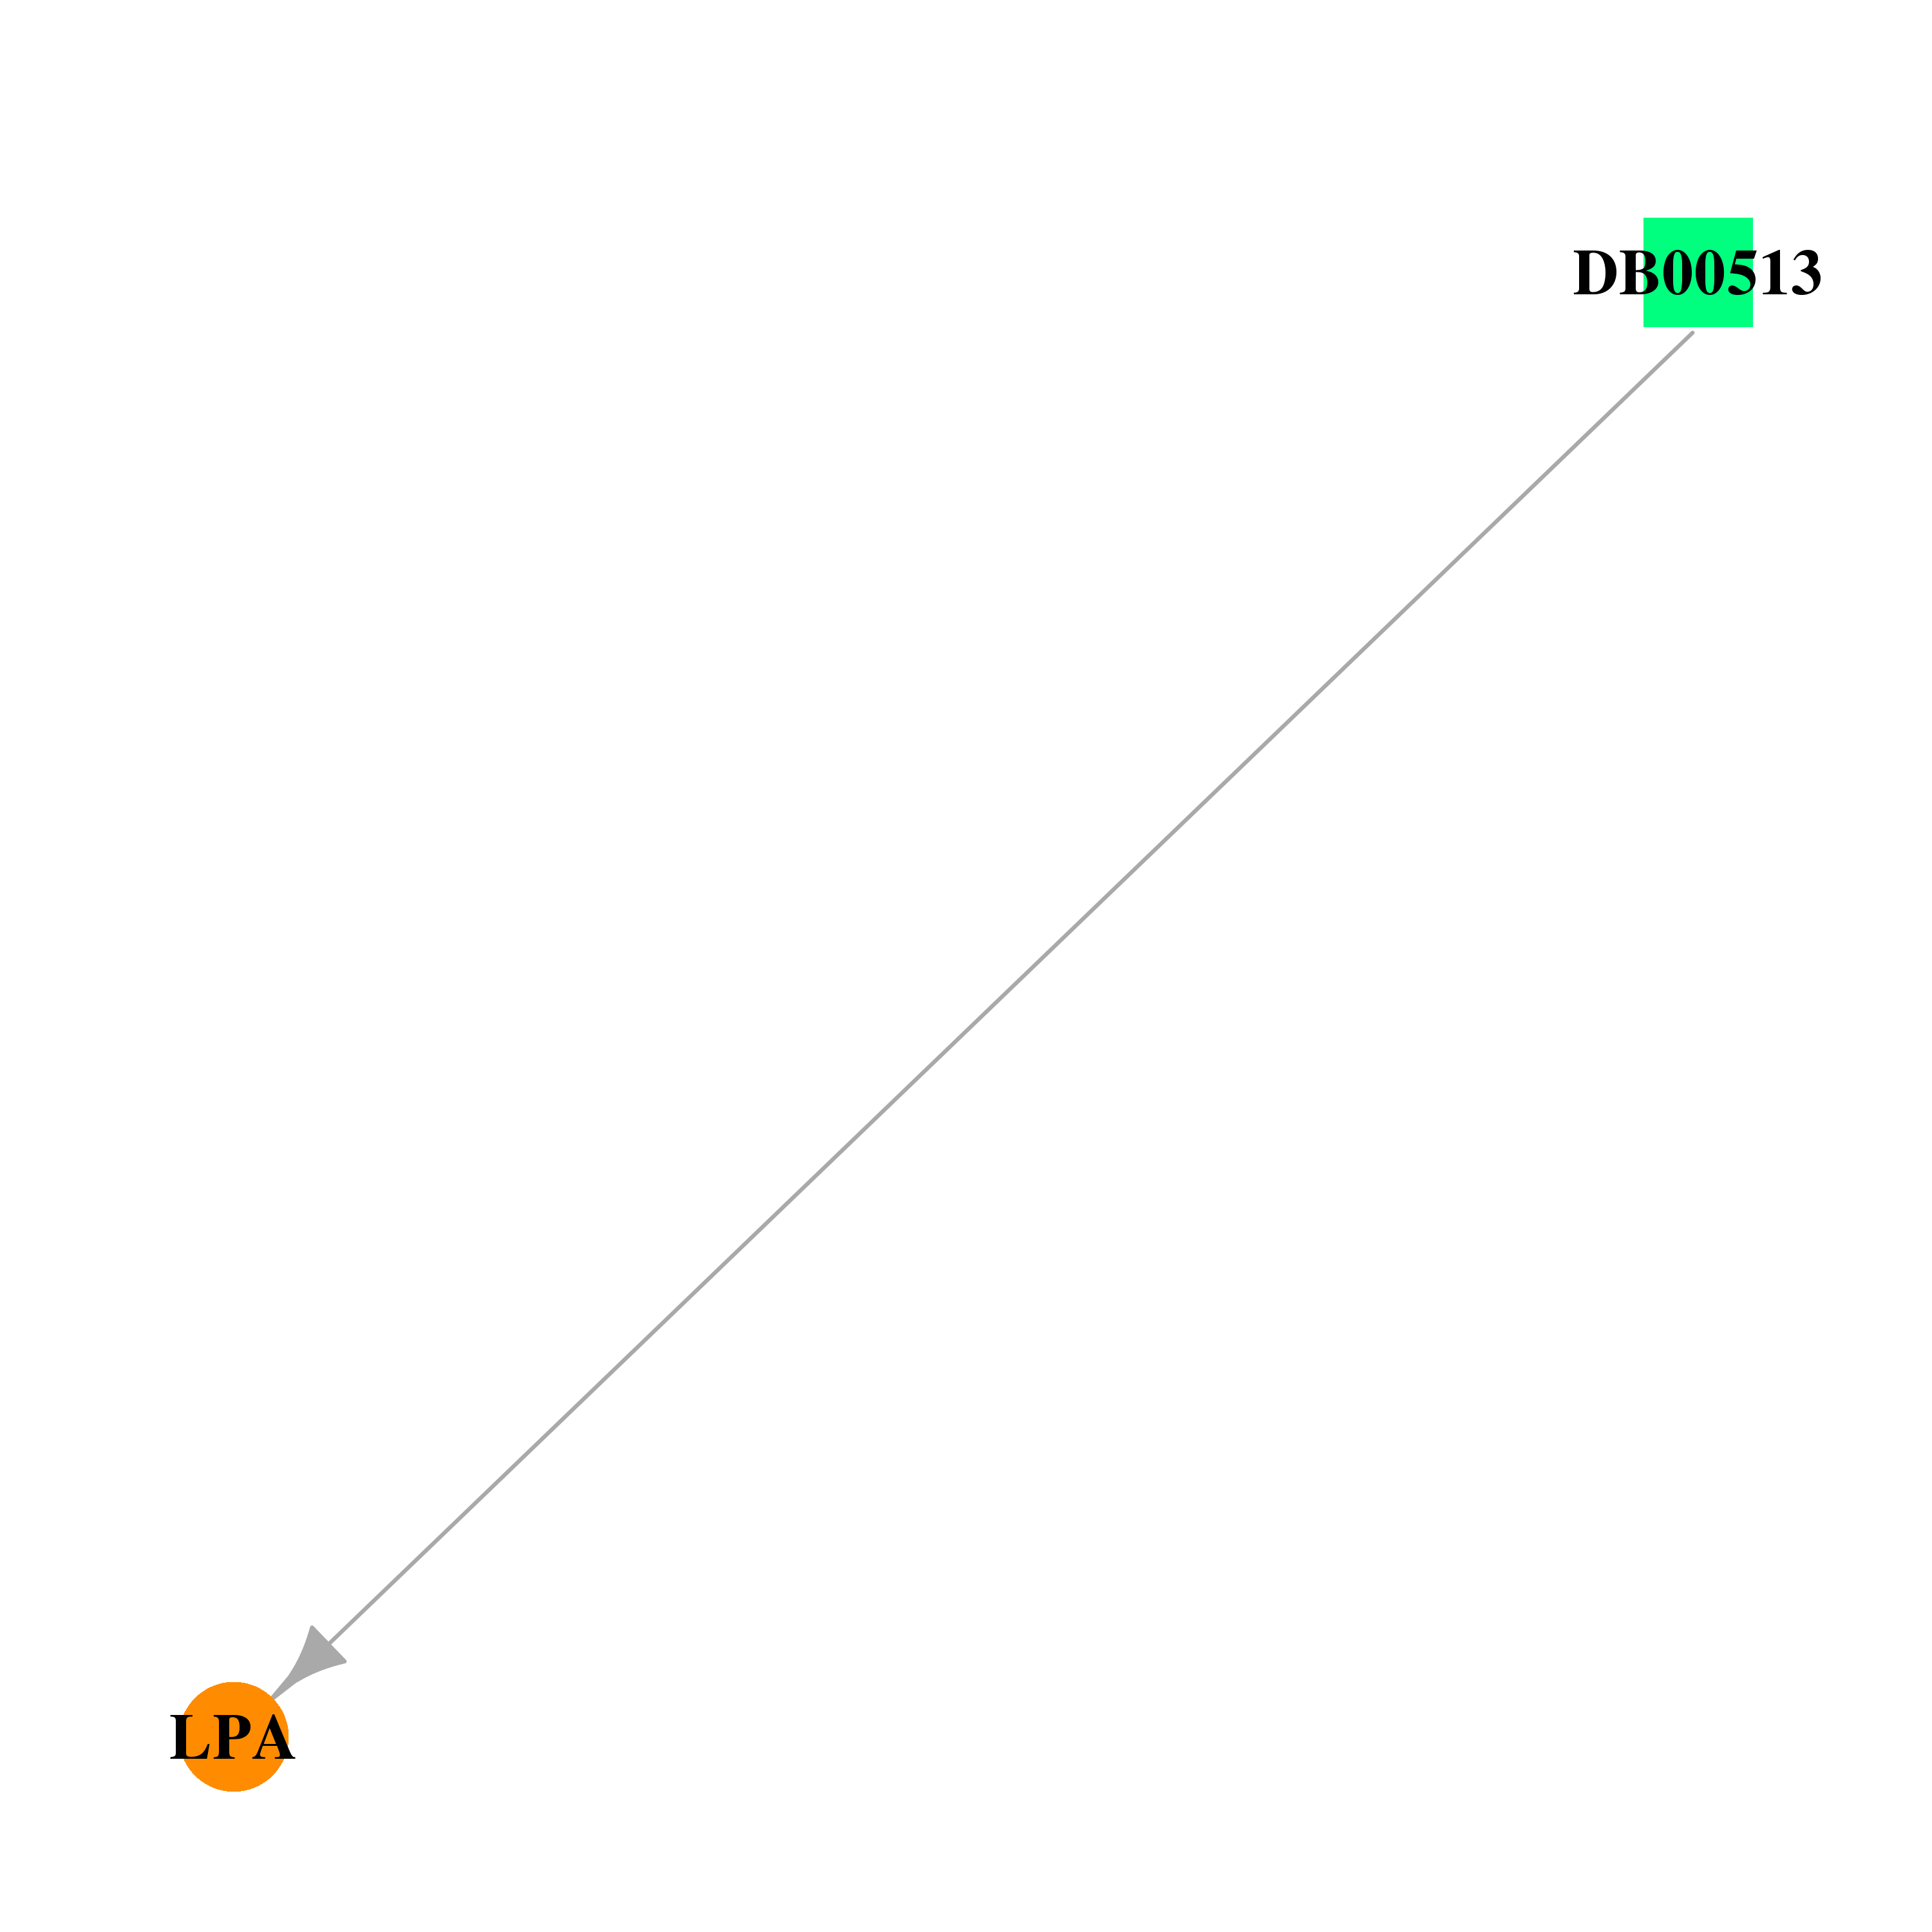 |  |
| Top |
| Cross referenced IDs for LPA |
| * We obtained these cross-references from Uniprot database. It covers 150 different DBs, 18 categories. http://www.uniprot.org/help/cross_references_section |
: Open all cross reference information
|
Copyright © 2016-Present - The Univsersity of Texas Health Science Center at Houston @ |