|
||||||||||||||||||||||||||||||||||||||||||||||||||||||||||||||||||||||||||||||||||||||||||||||||||||||||||||||||||||||||||||||||||||||||||||||||||||||||||||||||||||||||||||||||||||||||||||||||||||||||||||||||||||||||||||||||||||||||||||||||||||||||||||||||||||||||||||||||||||||||||||||||||||||||||||||||||||||||||||||||||||||||||||||||||||||||||||||||||||||||||||||||||||||||||||||||||||||||||||||||||||||||||||||||||||||||||||||||||||||||||||||||||||||||||||||||||||
| |
| Phenotypic Information (metabolism pathway, cancer, disease, phenome) |
| |
| |
| Gene-Gene Network Information: Co-Expression Network, Interacting Genes & KEGG |
| |
|


| Gene Summary for LTA4H |
| Basic gene info. | Gene symbol | LTA4H |
| Gene name | leukotriene A4 hydrolase | |
| Synonyms | - | |
| Cytomap | UCSC genome browser: 12q22 | |
| Genomic location | chr12 :96394530-96437298 | |
| Type of gene | protein-coding | |
| RefGenes | NM_000895.2, NM_001256643.1,NM_001256644.1, | |
| Ensembl id | ENSG00000111144 | |
| Description | LTA-4 hydrolaseleukotriene A-4 hydrolase | |
| Modification date | 20141207 | |
| dbXrefs | MIM : 151570 | |
| HGNC : HGNC | ||
| Ensembl : ENSG00000111144 | ||
| HPRD : 01056 | ||
| Vega : OTTHUMG00000170355 | ||
| Protein | UniProt: P09960 go to UniProt's Cross Reference DB Table | |
| Expression | CleanEX: HS_LTA4H | |
| BioGPS: 4048 | ||
| Gene Expression Atlas: ENSG00000111144 | ||
| The Human Protein Atlas: ENSG00000111144 | ||
| Pathway | NCI Pathway Interaction Database: LTA4H | |
| KEGG: LTA4H | ||
| REACTOME: LTA4H | ||
| ConsensusPathDB | ||
| Pathway Commons: LTA4H | ||
| Metabolism | MetaCyc: LTA4H | |
| HUMANCyc: LTA4H | ||
| Regulation | Ensembl's Regulation: ENSG00000111144 | |
| miRBase: chr12 :96,394,530-96,437,298 | ||
| TargetScan: NM_000895 | ||
| cisRED: ENSG00000111144 | ||
| Context | iHOP: LTA4H | |
| cancer metabolism search in PubMed: LTA4H | ||
| UCL Cancer Institute: LTA4H | ||
| Assigned class in ccmGDB | A - This gene has a literature evidence and it belongs to cancer gene. | |
| References showing role of LTA4H in cancer cell metabolism | 1. Guo Y, Wang X, Zhang X, Sun Z, Chen X (2011) Ethanol promotes chemically induced oral cancer in mice through activation of the 5-lipoxygenase pathway of arachidonic acid metabolism. Cancer Prev Res (Phila) 4: 1863-1872. doi: 10.1158/1940-6207.CAPR-11-0206. pmid: 3208736. go to article 2. Sun Z, Sood S, Li N, Ramji D, Yang P, et al. (2006) Involvement of the 5-lipoxygenase/leukotriene A4 hydrolase pathway in 7,12-dimethylbenz[a]anthracene (DMBA)-induced oral carcinogenesis in hamster cheek pouch, and inhibition of carcinogenesis by its inhibitors. Carcinogenesis 27: 1902-1908. doi: 10.1093/carcin/bgl039. go to article | |
| Top |
| Phenotypic Information for LTA4H(metabolism pathway, cancer, disease, phenome) |
| Cancer | CGAP: LTA4H |
| Familial Cancer Database: LTA4H | |
| * This gene is included in those cancer gene databases. |
|
|
|
|
|
| . | ||||||||||||||||||||||||||||||||||||||||||||||||||||||||||||||||||||||||||||||||||||||||||||||||||||||||||||||||||||||||||||||||||||||||||||||||||||||||||||||||||||||||||||||||||||||||||||||||||||||||||||||||||||||||||||||||||||||||||||||||||||||||||||||||||||||||||||||||||||||||||||||||||||||||||||||||||||||||||||||||||||||||||||||||||||||||||||||||||||||||||||||||||||||||||||||||||||||||||||||||||||||||||||||||||||||||||||||||||||||||||||||||||||||||||||||
Oncogene 1 | Significant driver gene in | |||||||||||||||||||||||||||||||||||||||||||||||||||||||||||||||||||||||||||||||||||||||||||||||||||||||||||||||||||||||||||||||||||||||||||||||||||||||||||||||||||||||||||||||||||||||||||||||||||||||||||||||||||||||||||||||||||||||||||||||||||||||||||||||||||||||||||||||||||||||||||||||||||||||||||||||||||||||||||||||||||||||||||||||||||||||||||||||||||||||||||||||||||||||||||||||||||||||||||||||||||||||||||||||||||||||||||||||||||||||||||||||||||||||||||||||||||
| cf) number; DB name 1 Oncogene; http://nar.oxfordjournals.org/content/35/suppl_1/D721.long, 2 Tumor Suppressor gene; https://bioinfo.uth.edu/TSGene/, 3 Cancer Gene Census; http://www.nature.com/nrc/journal/v4/n3/abs/nrc1299.html, 4 CancerGenes; http://nar.oxfordjournals.org/content/35/suppl_1/D721.long, 5 Network of Cancer Gene; http://ncg.kcl.ac.uk/index.php, 1Therapeutic Vulnerabilities in Cancer; http://cbio.mskcc.org/cancergenomics/statius/ |
| KEGG_ARACHIDONIC_ACID_METABOLISM | |
| OMIM | 151570; gene. |
| Orphanet | |
| Disease | KEGG Disease: LTA4H |
| MedGen: LTA4H (Human Medical Genetics with Condition) | |
| ClinVar: LTA4H | |
| Phenotype | MGI: LTA4H (International Mouse Phenotyping Consortium) |
| PhenomicDB: LTA4H | |
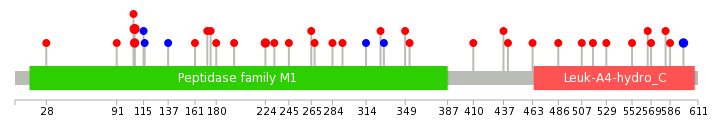
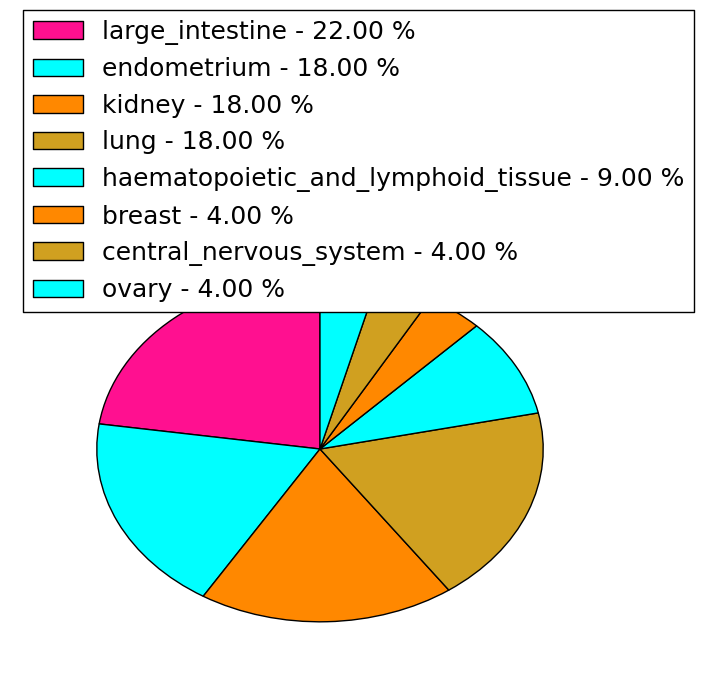
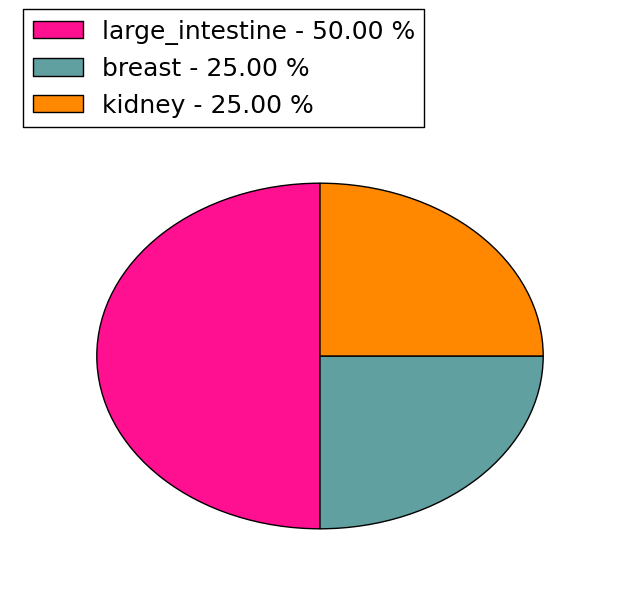
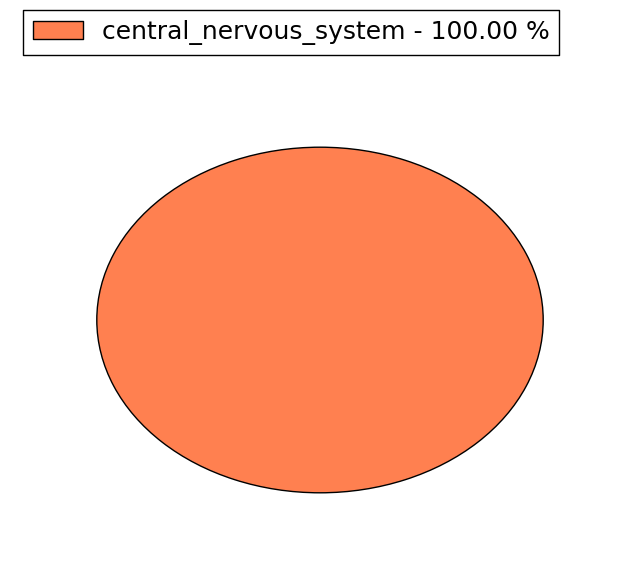
| Mutations for LTA4H |
| * Under tables are showing count per each tissue to give us broad intuition about tissue specific mutation patterns.You can go to the detailed page for each mutation database's web site. |
| There's no structural variation information in COSMIC data for this gene. |
| * From mRNA Sanger sequences, Chitars2.0 arranged chimeric transcripts. This table shows LTA4H related fusion information. |
| ID | Head Gene | Tail Gene | Accession | Gene_a | qStart_a | qEnd_a | Chromosome_a | tStart_a | tEnd_a | Gene_a | qStart_a | qEnd_a | Chromosome_a | tStart_a | tEnd_a |
| BQ335002 | LTA4H | 4 | 114 | 12 | 96394856 | 96396821 | RPLP2 | 104 | 371 | 11 | 810308 | 812822 | |
| BE875453 | LTA4H | 10 | 179 | 12 | 96400145 | 96407038 | ADCY2 | 173 | 334 | 1 | 152004982 | 152005144 | |
| Top |
| Mutation type/ Tissue ID | brca | cns | cerv | endome | haematopo | kidn | Lintest | liver | lung | ns | ovary | pancre | prost | skin | stoma | thyro | urina | |||
| Total # sample | 1 | 1 | 1 | 1 | ||||||||||||||||
| GAIN (# sample) | 1 | 1 | 1 | |||||||||||||||||
| LOSS (# sample) | 1 |
| cf) Tissue ID; Tissue type (1; Breast, 2; Central_nervous_system, 3; Cervix, 4; Endometrium, 5; Haematopoietic_and_lymphoid_tissue, 6; Kidney, 7; Large_intestine, 8; Liver, 9; Lung, 10; NS, 11; Ovary, 12; Pancreas, 13; Prostate, 14; Skin, 15; Stomach, 16; Thyroid, 17; Urinary_tract) |
| Top |
|
 |
| Top |
| Stat. for Non-Synonymous SNVs (# total SNVs=22) | (# total SNVs=4) |
 |  |
(# total SNVs=1) | (# total SNVs=0) |
 |
| Top |
| * When you move the cursor on each content, you can see more deailed mutation information on the Tooltip. Those are primary_site,primary_histology,mutation(aa),pubmedID. |
| GRCh37 position | Mutation(aa) | Unique sampleID count |
| chr12:96421313-96421313 | p.F107S | 3 |
| chr12:96412987-96412987 | p.E224Q | 2 |
| chr12:96421314-96421314 | p.F107L | 2 |
| chr12:96394809-96394809 | p.P598P | 2 |
| chr12:96412660-96412660 | p.A245T | 1 |
| chr12:96396750-96396750 | p.R569Q | 1 |
| chr12:96421285-96421285 | p.L116L | 1 |
| chr12:96408781-96408781 | p.? | 1 |
| chr12:96412944-96412944 | p.? | 1 |
| chr12:96396759-96396759 | p.K566R | 1 |
| Top |
|
 |
| Point Mutation/ Tissue ID | 1 | 2 | 3 | 4 | 5 | 6 | 7 | 8 | 9 | 10 | 11 | 12 | 13 | 14 | 15 | 16 | 17 | 18 | 19 | 20 |
| # sample | 1 | 1 | 3 | 5 | 1 | 3 | 2 | 1 | 5 | 4 | 3 | |||||||||
| # mutation | 1 | 1 | 3 | 4 | 1 | 3 | 2 | 1 | 5 | 4 | 3 | |||||||||
| nonsynonymous SNV | 1 | 2 | 3 | 1 | 2 | 2 | 1 | 4 | 4 | 3 | ||||||||||
| synonymous SNV | 1 | 1 | 1 | 1 | 1 |
| cf) Tissue ID; Tissue type (1; BLCA[Bladder Urothelial Carcinoma], 2; BRCA[Breast invasive carcinoma], 3; CESC[Cervical squamous cell carcinoma and endocervical adenocarcinoma], 4; COAD[Colon adenocarcinoma], 5; GBM[Glioblastoma multiforme], 6; Glioma Low Grade, 7; HNSC[Head and Neck squamous cell carcinoma], 8; KICH[Kidney Chromophobe], 9; KIRC[Kidney renal clear cell carcinoma], 10; KIRP[Kidney renal papillary cell carcinoma], 11; LAML[Acute Myeloid Leukemia], 12; LUAD[Lung adenocarcinoma], 13; LUSC[Lung squamous cell carcinoma], 14; OV[Ovarian serous cystadenocarcinoma ], 15; PAAD[Pancreatic adenocarcinoma], 16; PRAD[Prostate adenocarcinoma], 17; SKCM[Skin Cutaneous Melanoma], 18:STAD[Stomach adenocarcinoma], 19:THCA[Thyroid carcinoma], 20:UCEC[Uterine Corpus Endometrial Carcinoma]) |
| Top |
| * We represented just top 10 SNVs. When you move the cursor on each content, you can see more deailed mutation information on the Tooltip. Those are primary_site, primary_histology, mutation(aa), pubmedID. |
| Genomic Position | Mutation(aa) | Unique sampleID count |
| chr12:96421313 | p.F107S,LTA4H | 2 |
| chr12:96421314 | p.F107L,LTA4H | 2 |
| chr12:96421285 | p.K566R,LTA4H | 1 |
| chr12:96396759 | p.S265T,LTA4H | 1 |
| chr12:96408740 | p.I552T,LTA4H | 1 |
| chr12:96421288 | p.A232V,LTA4H | 1 |
| chr12:96396801 | p.A529T,LTA4H | 1 |
| chr12:96409430 | p.V196F,LTA4H | 1 |
| chr12:96397644 | p.H517Y,LTA4H | 1 |
| chr12:96409440 | p.R175C,LTA4H | 1 |
| * Copy number data were extracted from TCGA using R package TCGA-Assembler. The URLs of all public data files on TCGA DCC data server were gathered on Jan-05-2015. Function ProcessCNAData in TCGA-Assembler package was used to obtain gene-level copy number value which is calculated as the average copy number of the genomic region of a gene. |
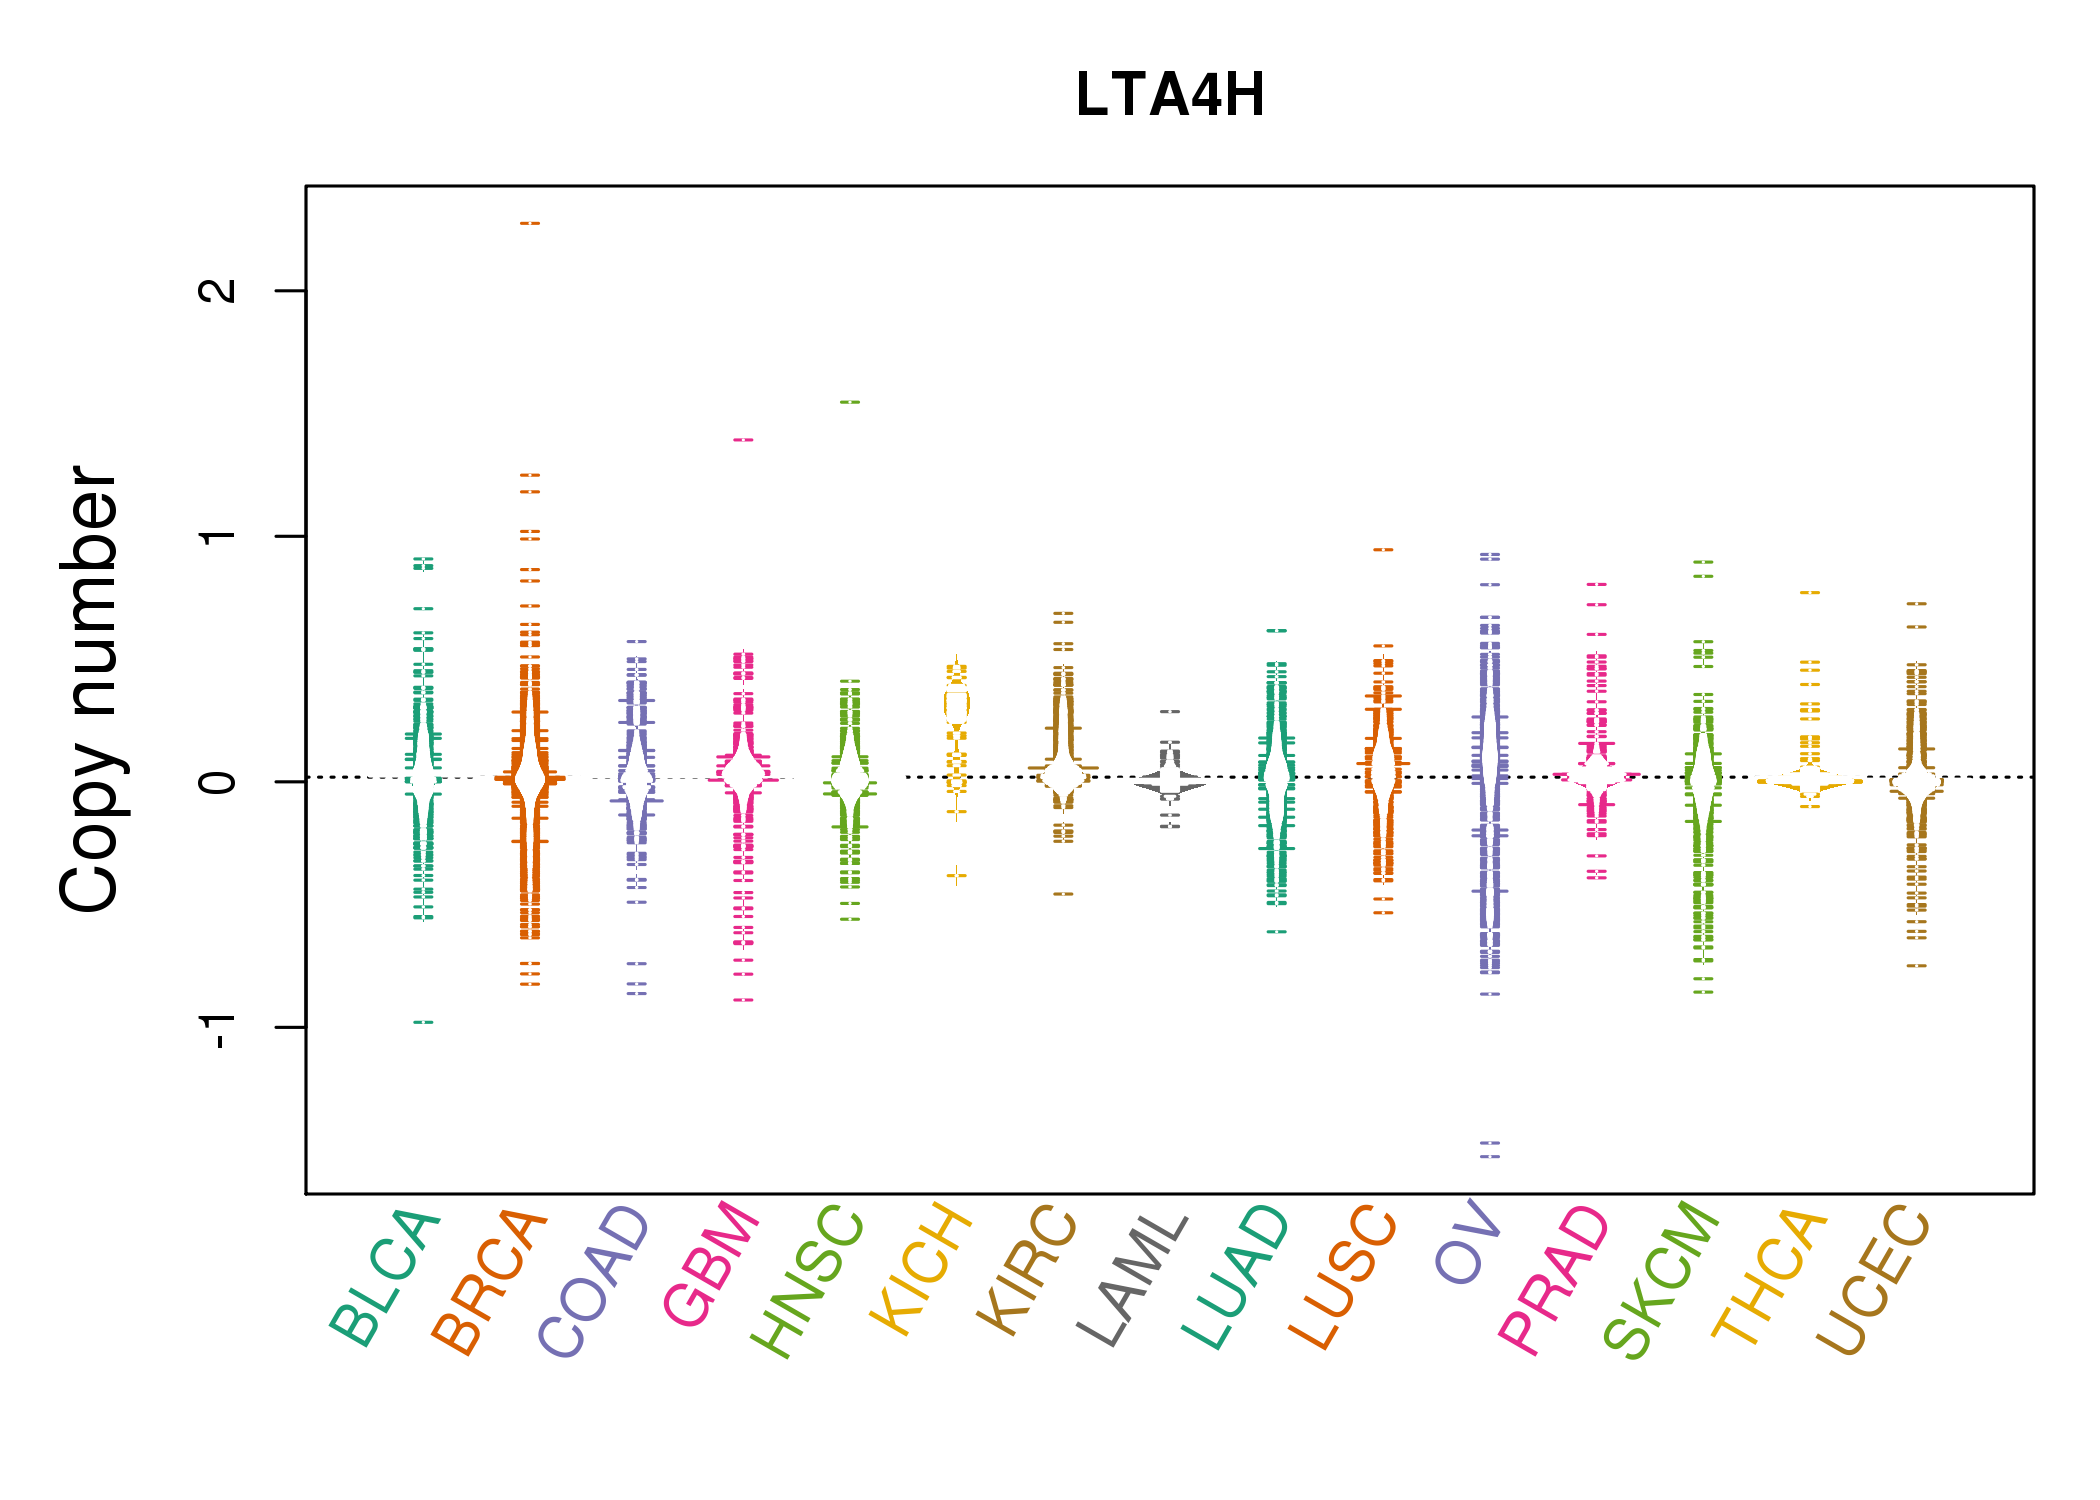 |
| cf) Tissue ID[Tissue type]: BLCA[Bladder Urothelial Carcinoma], BRCA[Breast invasive carcinoma], CESC[Cervical squamous cell carcinoma and endocervical adenocarcinoma], COAD[Colon adenocarcinoma], GBM[Glioblastoma multiforme], Glioma Low Grade, HNSC[Head and Neck squamous cell carcinoma], KICH[Kidney Chromophobe], KIRC[Kidney renal clear cell carcinoma], KIRP[Kidney renal papillary cell carcinoma], LAML[Acute Myeloid Leukemia], LUAD[Lung adenocarcinoma], LUSC[Lung squamous cell carcinoma], OV[Ovarian serous cystadenocarcinoma ], PAAD[Pancreatic adenocarcinoma], PRAD[Prostate adenocarcinoma], SKCM[Skin Cutaneous Melanoma], STAD[Stomach adenocarcinoma], THCA[Thyroid carcinoma], UCEC[Uterine Corpus Endometrial Carcinoma] |
| Top |
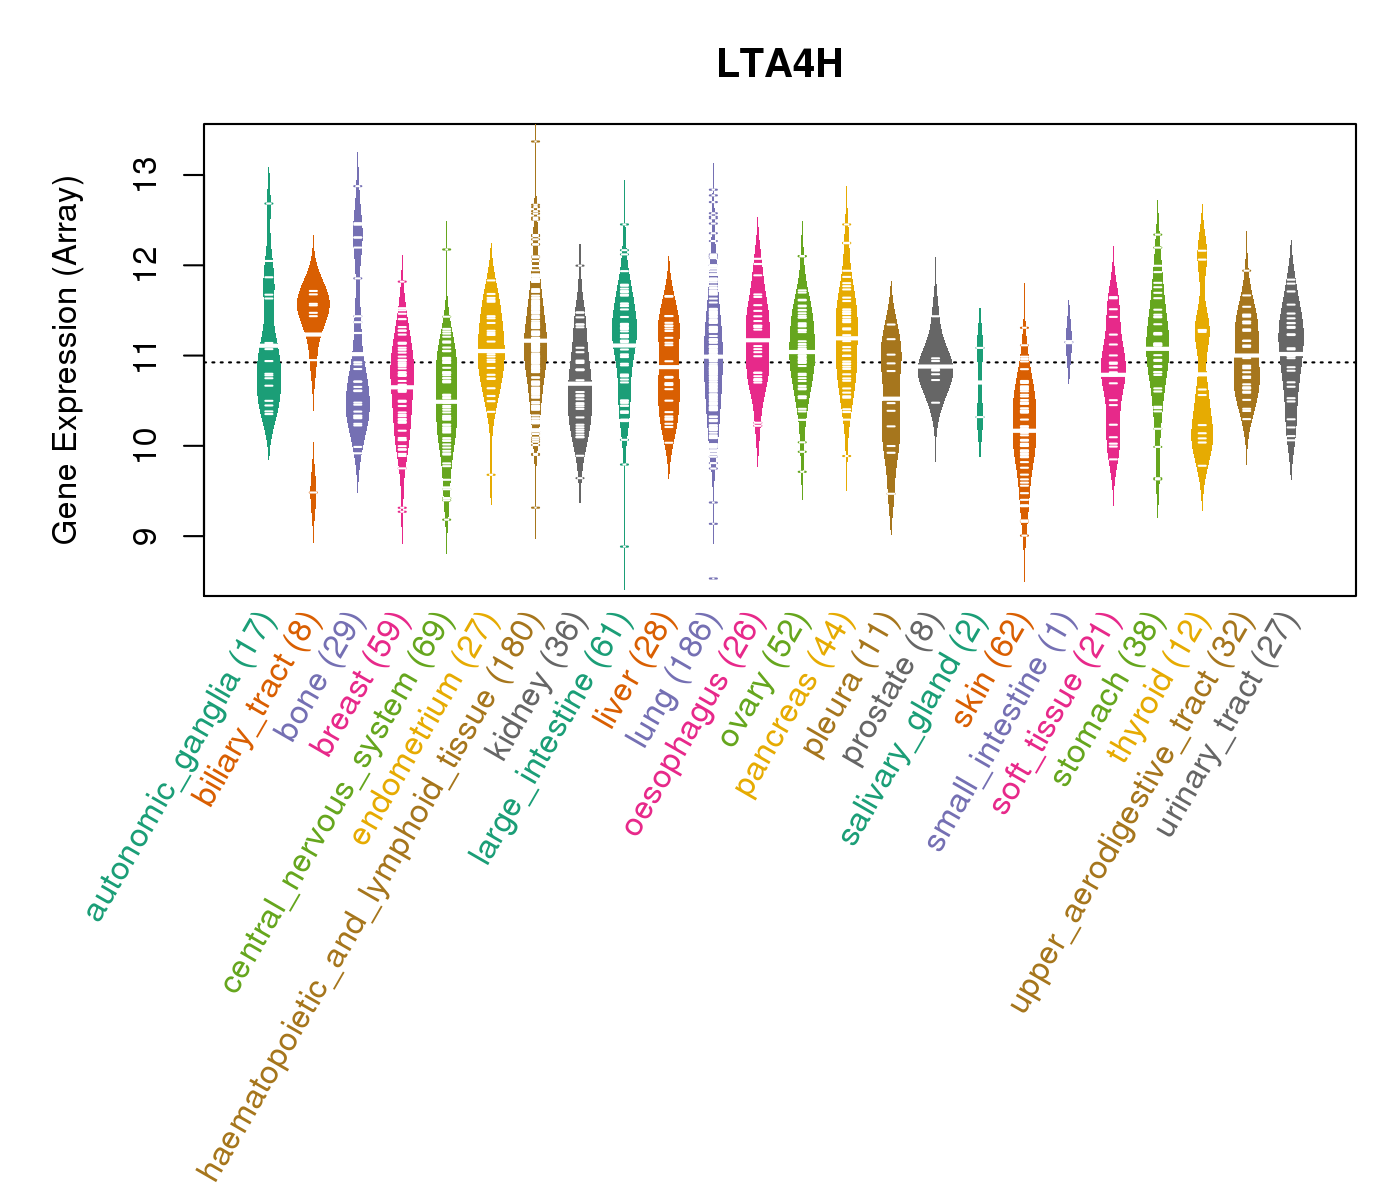
| Gene Expression for LTA4H |
| * CCLE gene expression data were extracted from CCLE_Expression_Entrez_2012-10-18.res: Gene-centric RMA-normalized mRNA expression data. |
 |
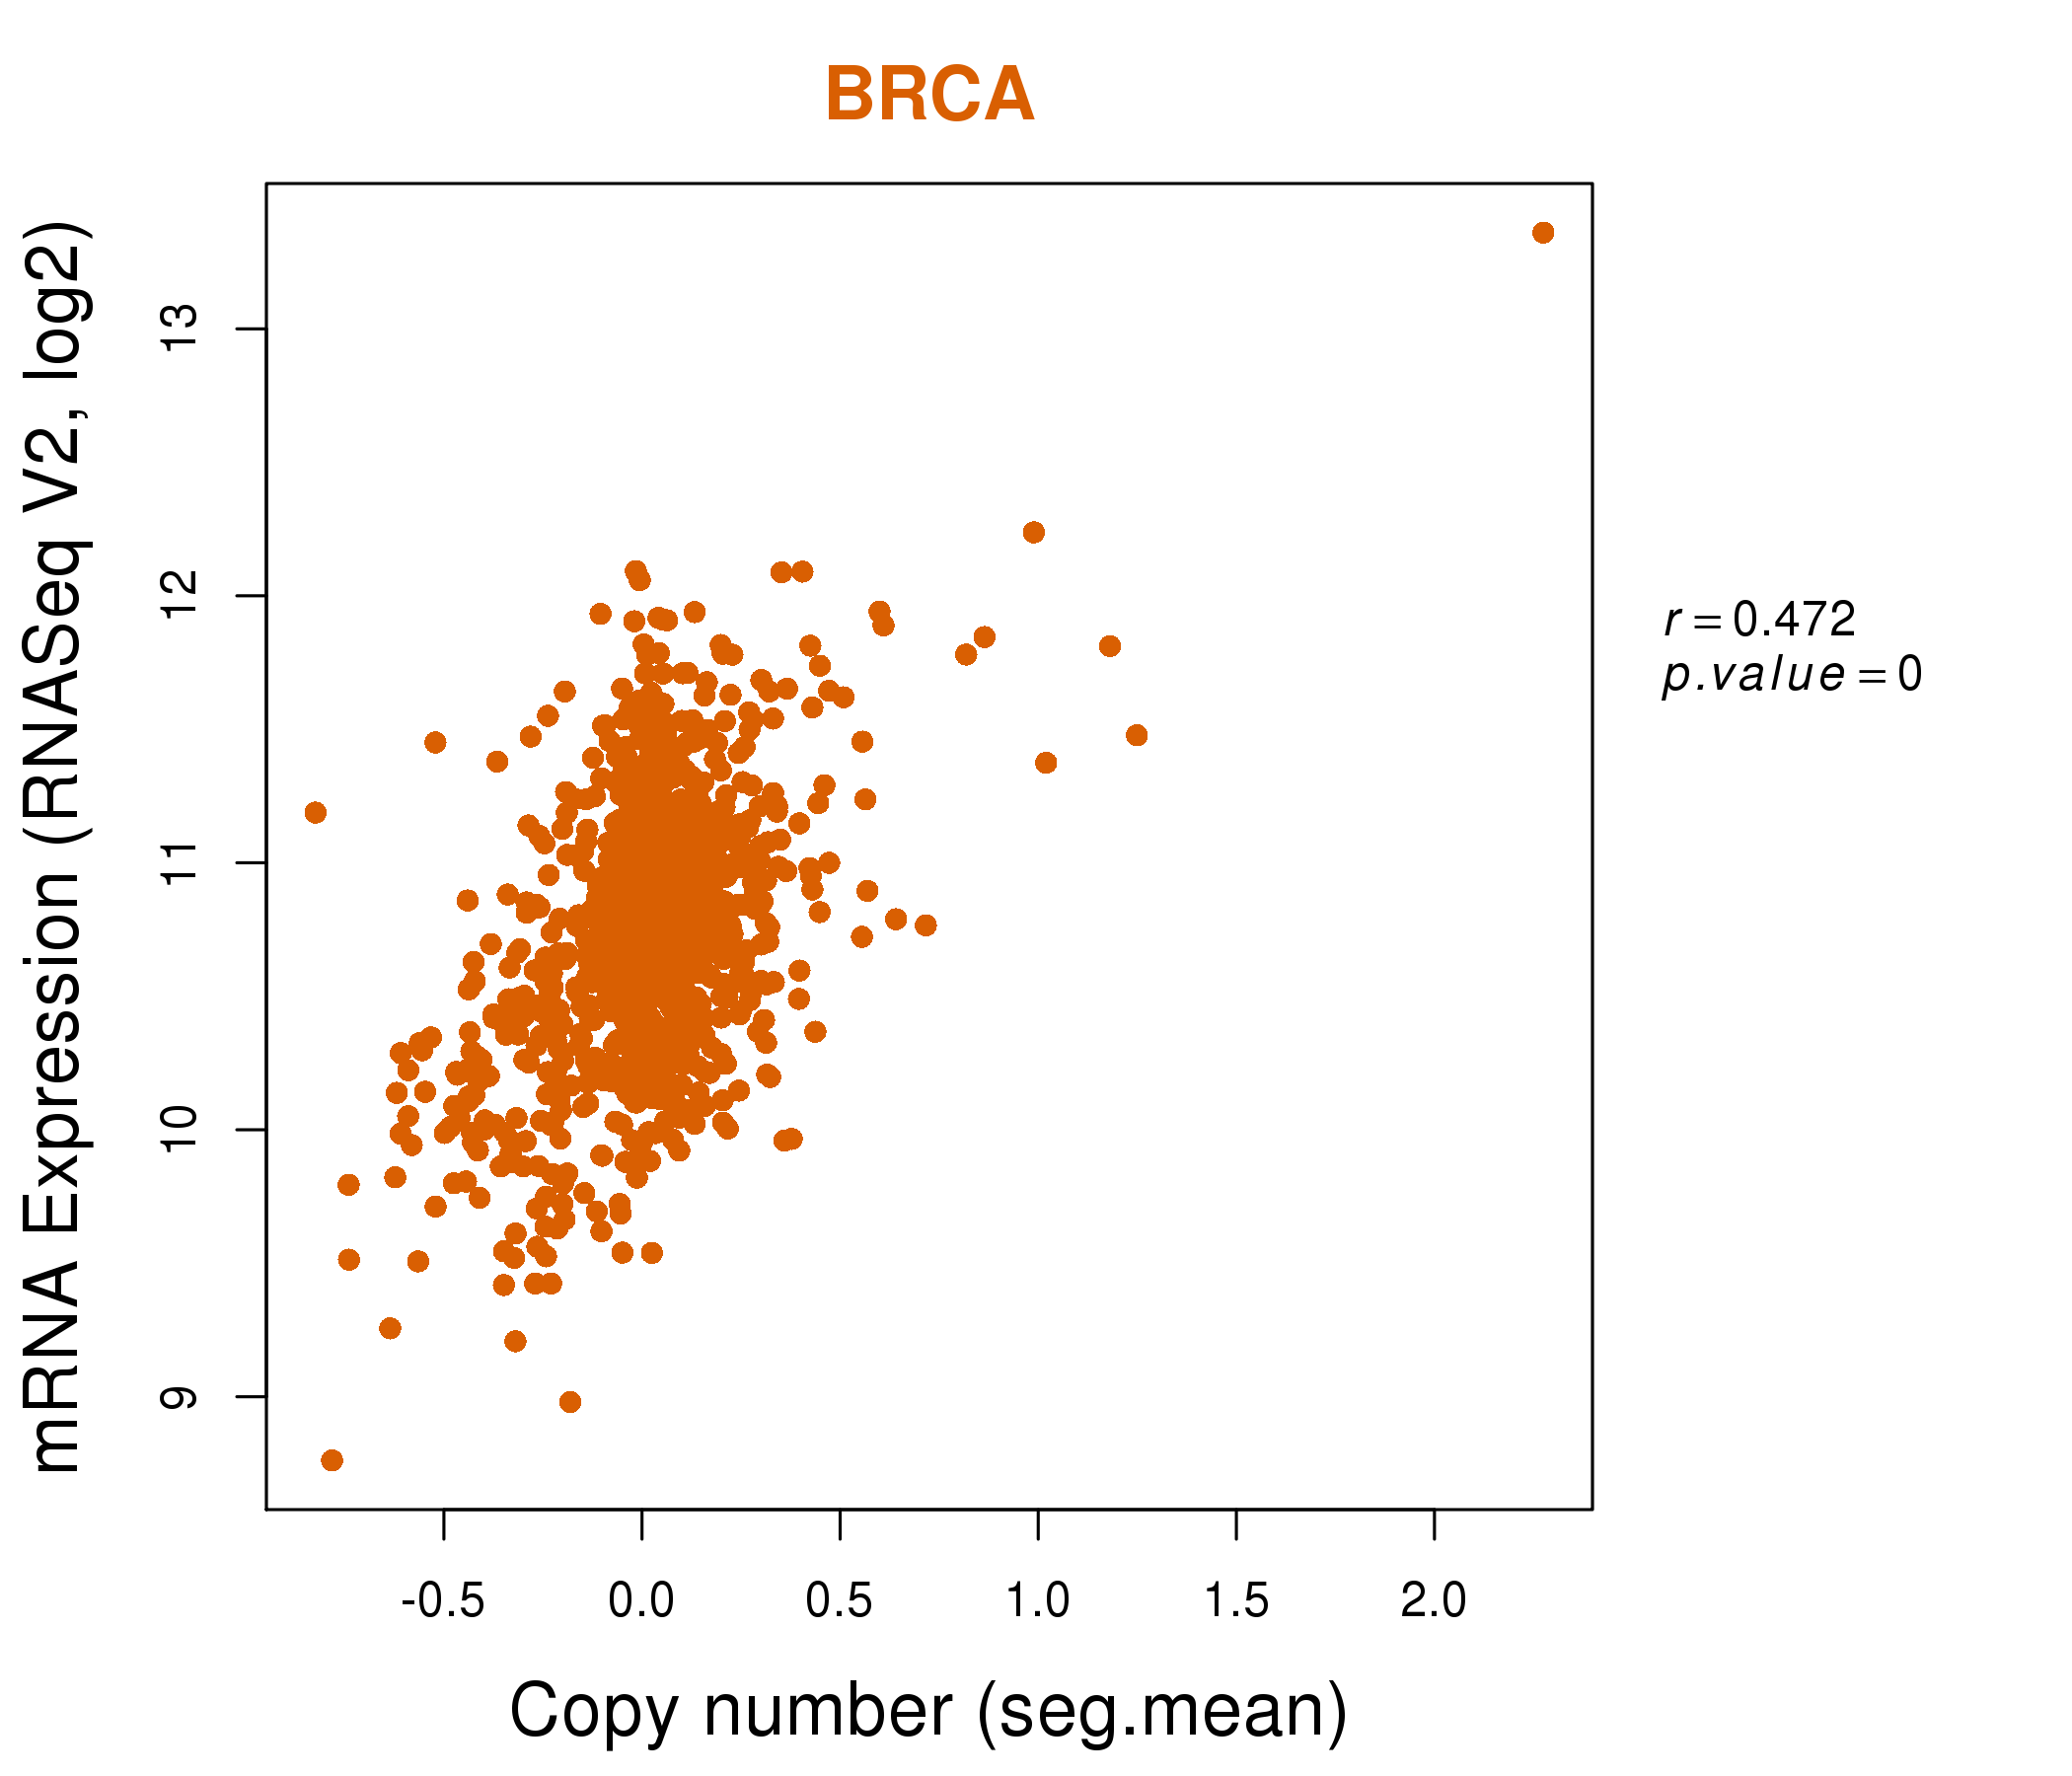
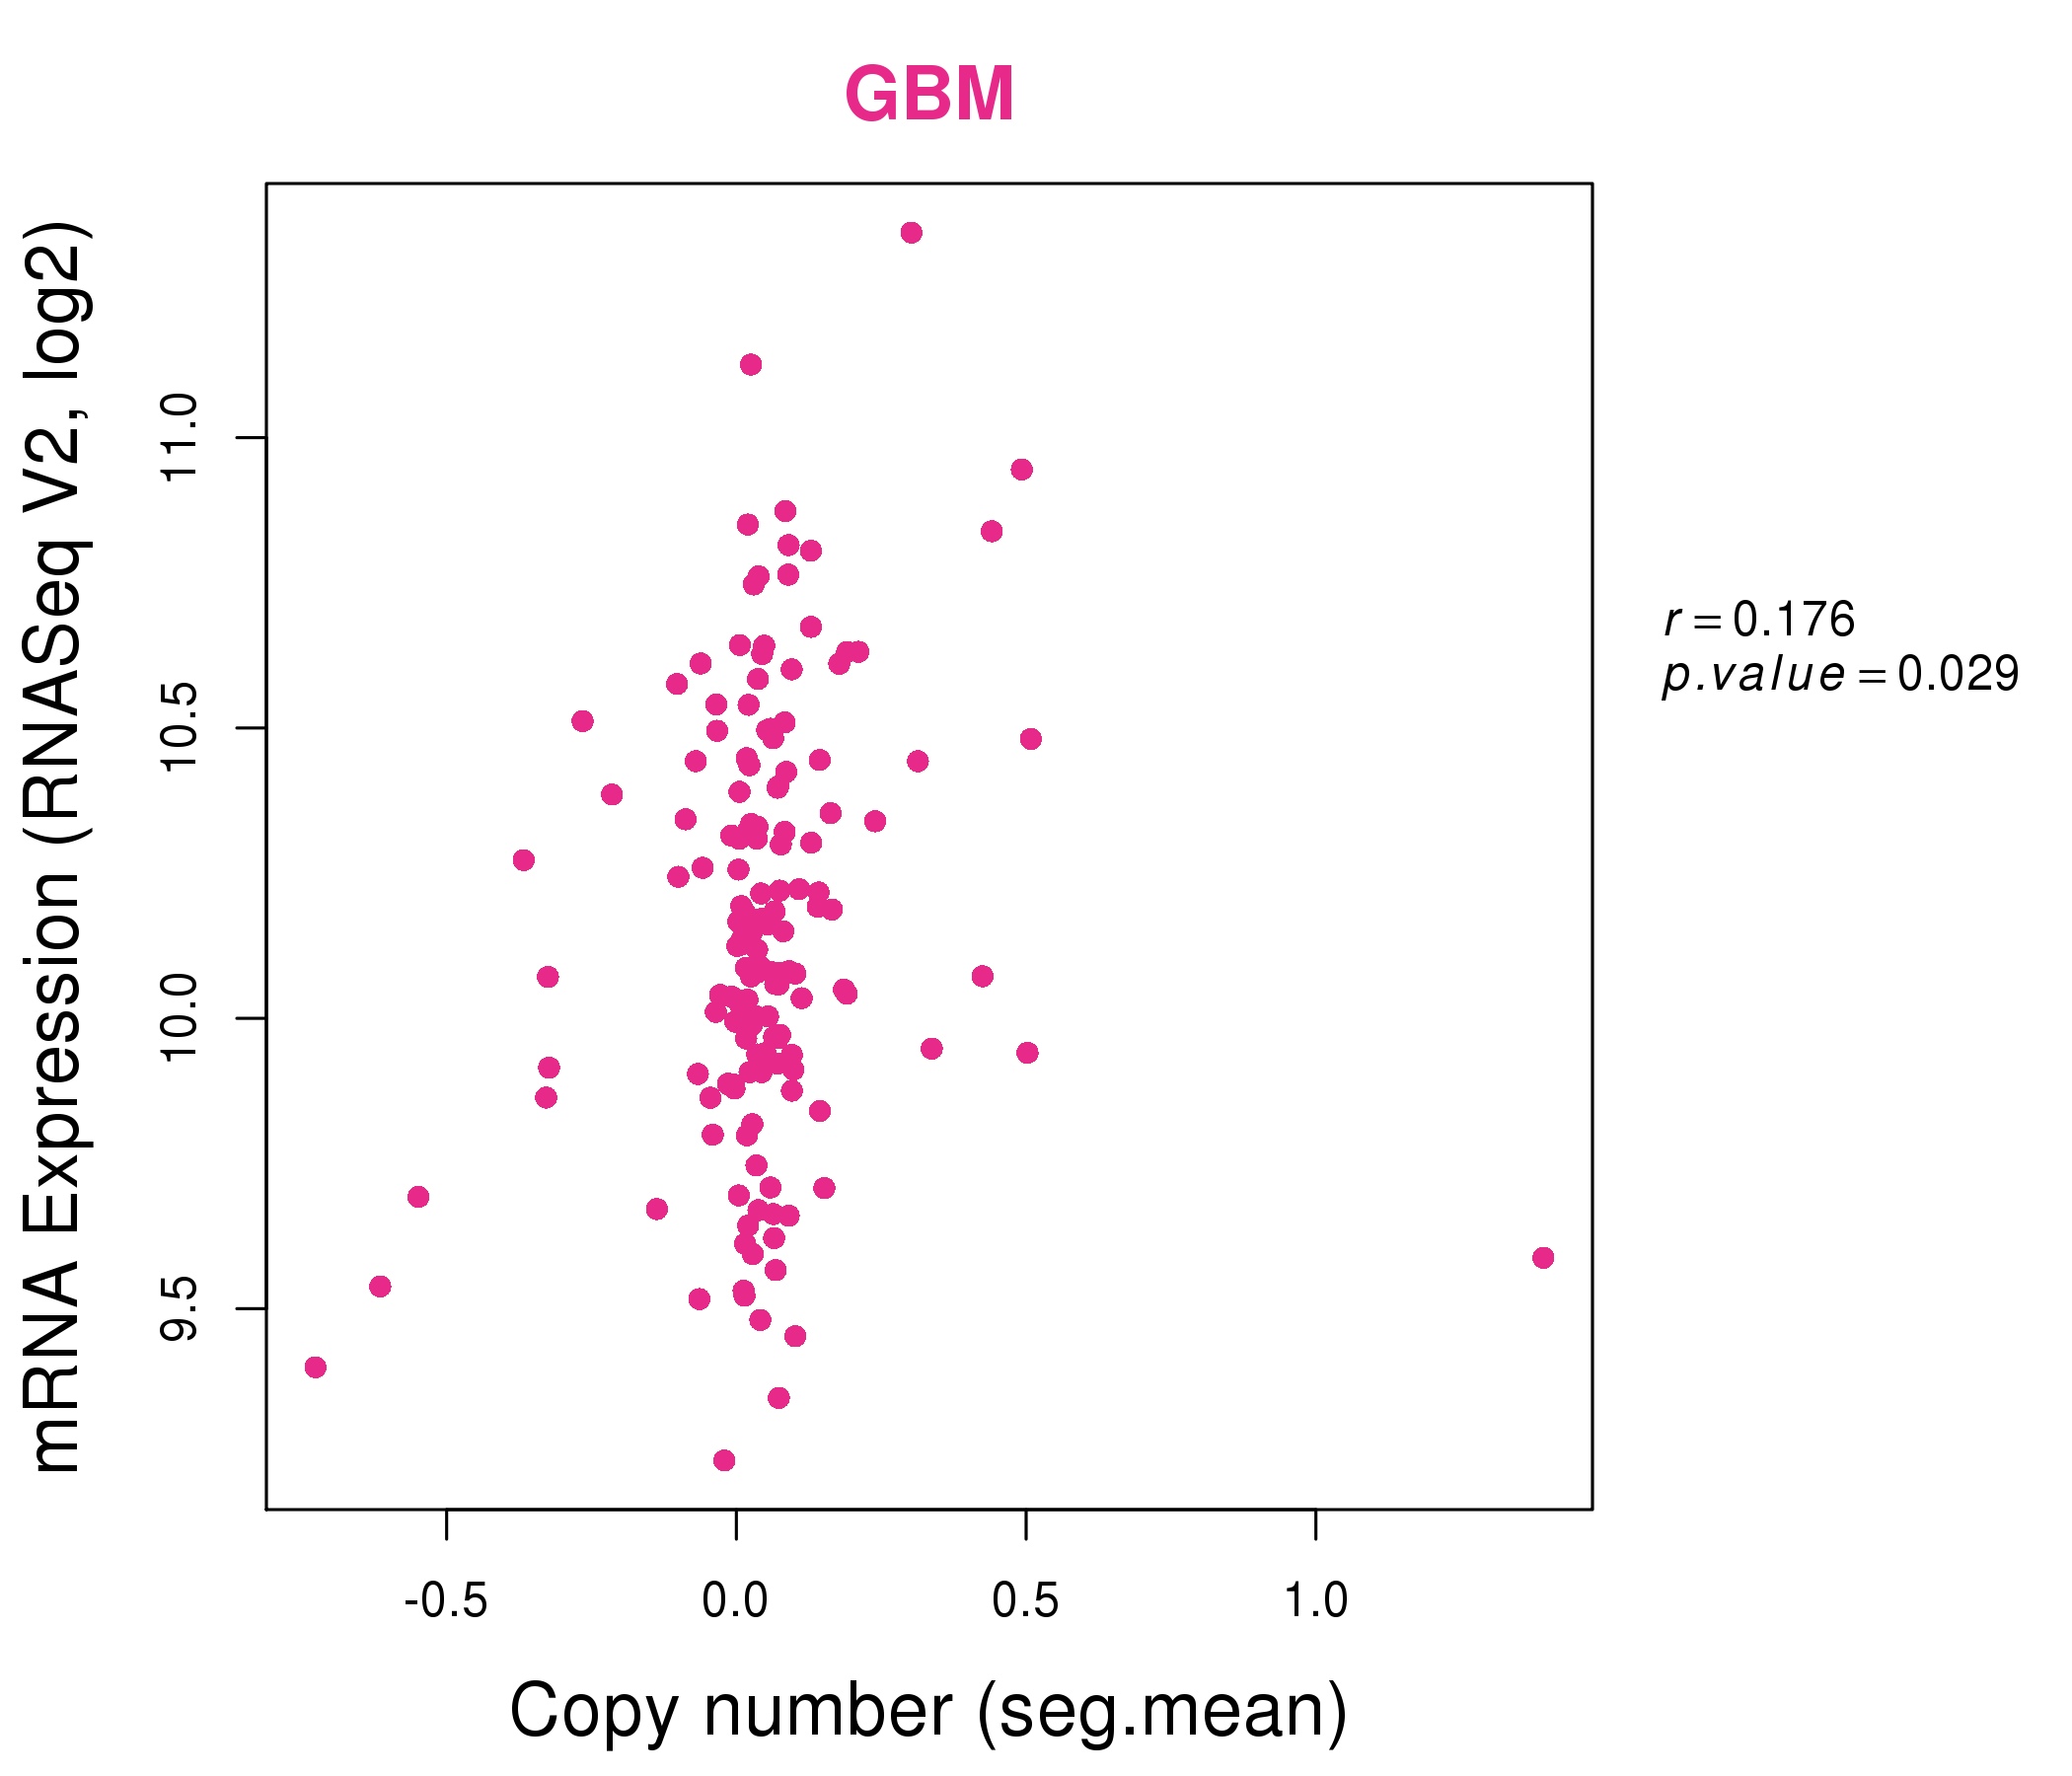
| * Normalized gene expression data of RNASeqV2 was extracted from TCGA using R package TCGA-Assembler. The URLs of all public data files on TCGA DCC data server were gathered at Jan-05-2015. Only eight cancer types have enough normal control samples for differential expression analysis. (t test, adjusted p<0.05 (using Benjamini-Hochberg FDR)) |
 |
| Top |
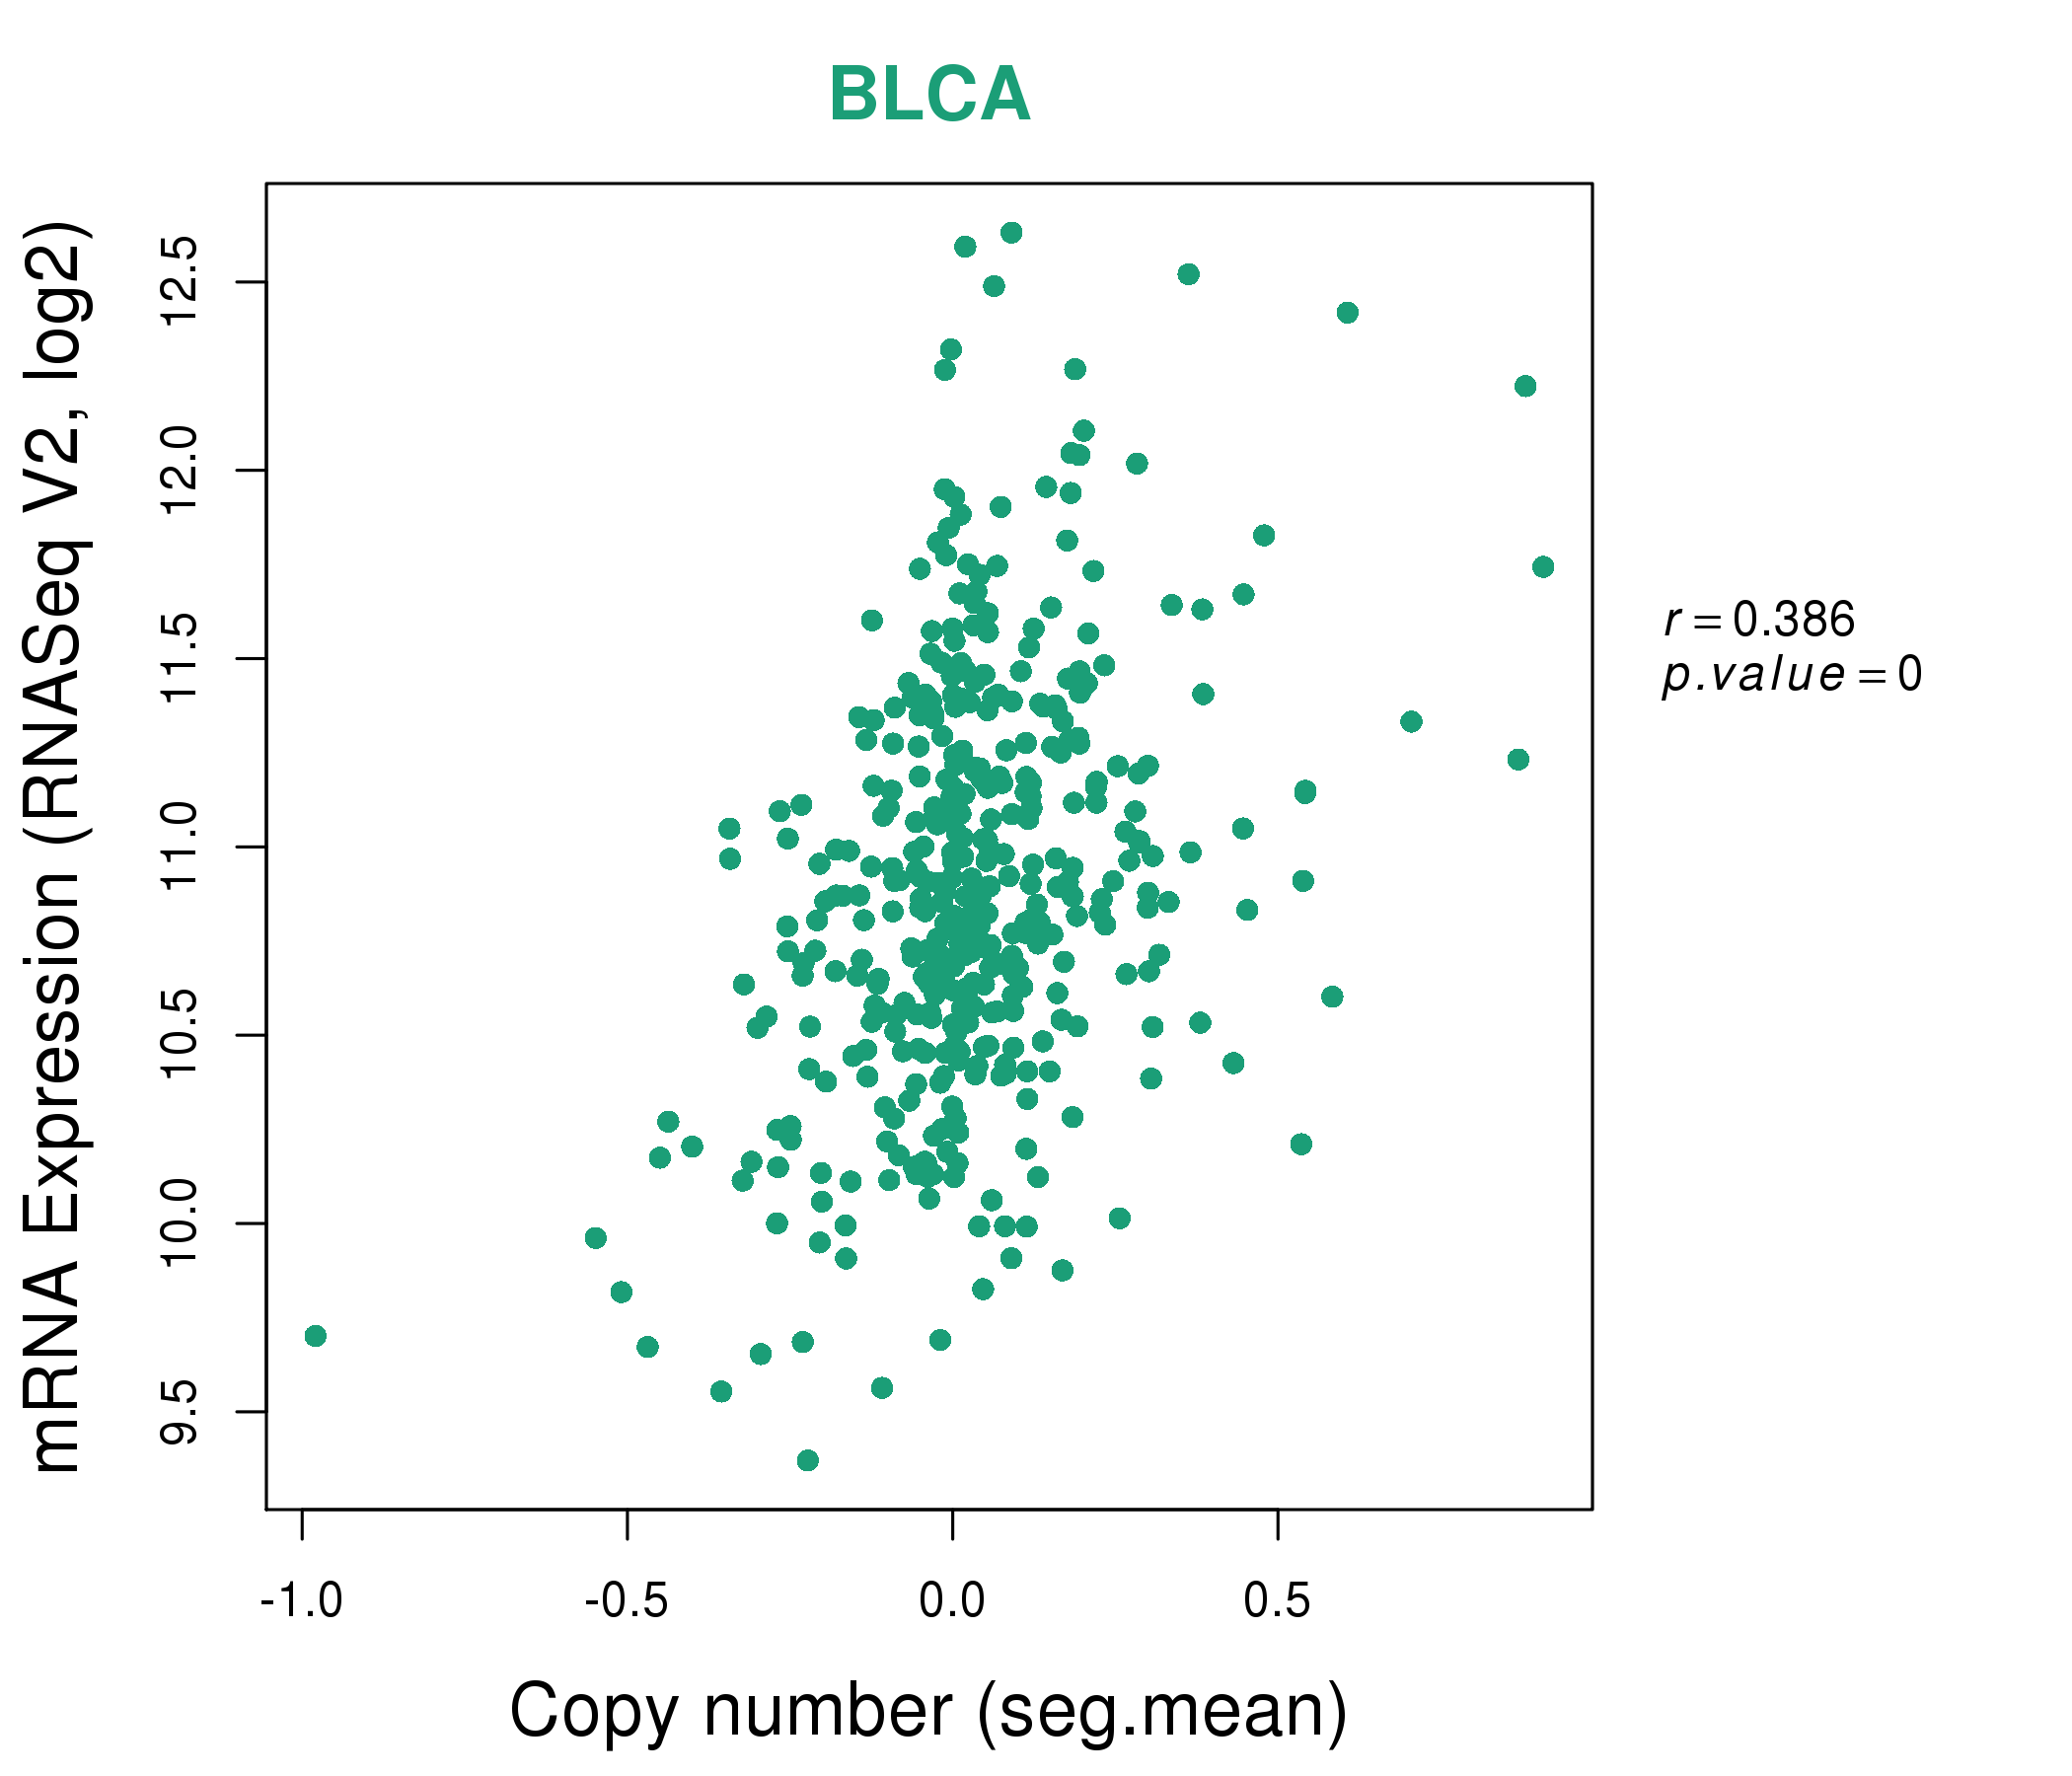
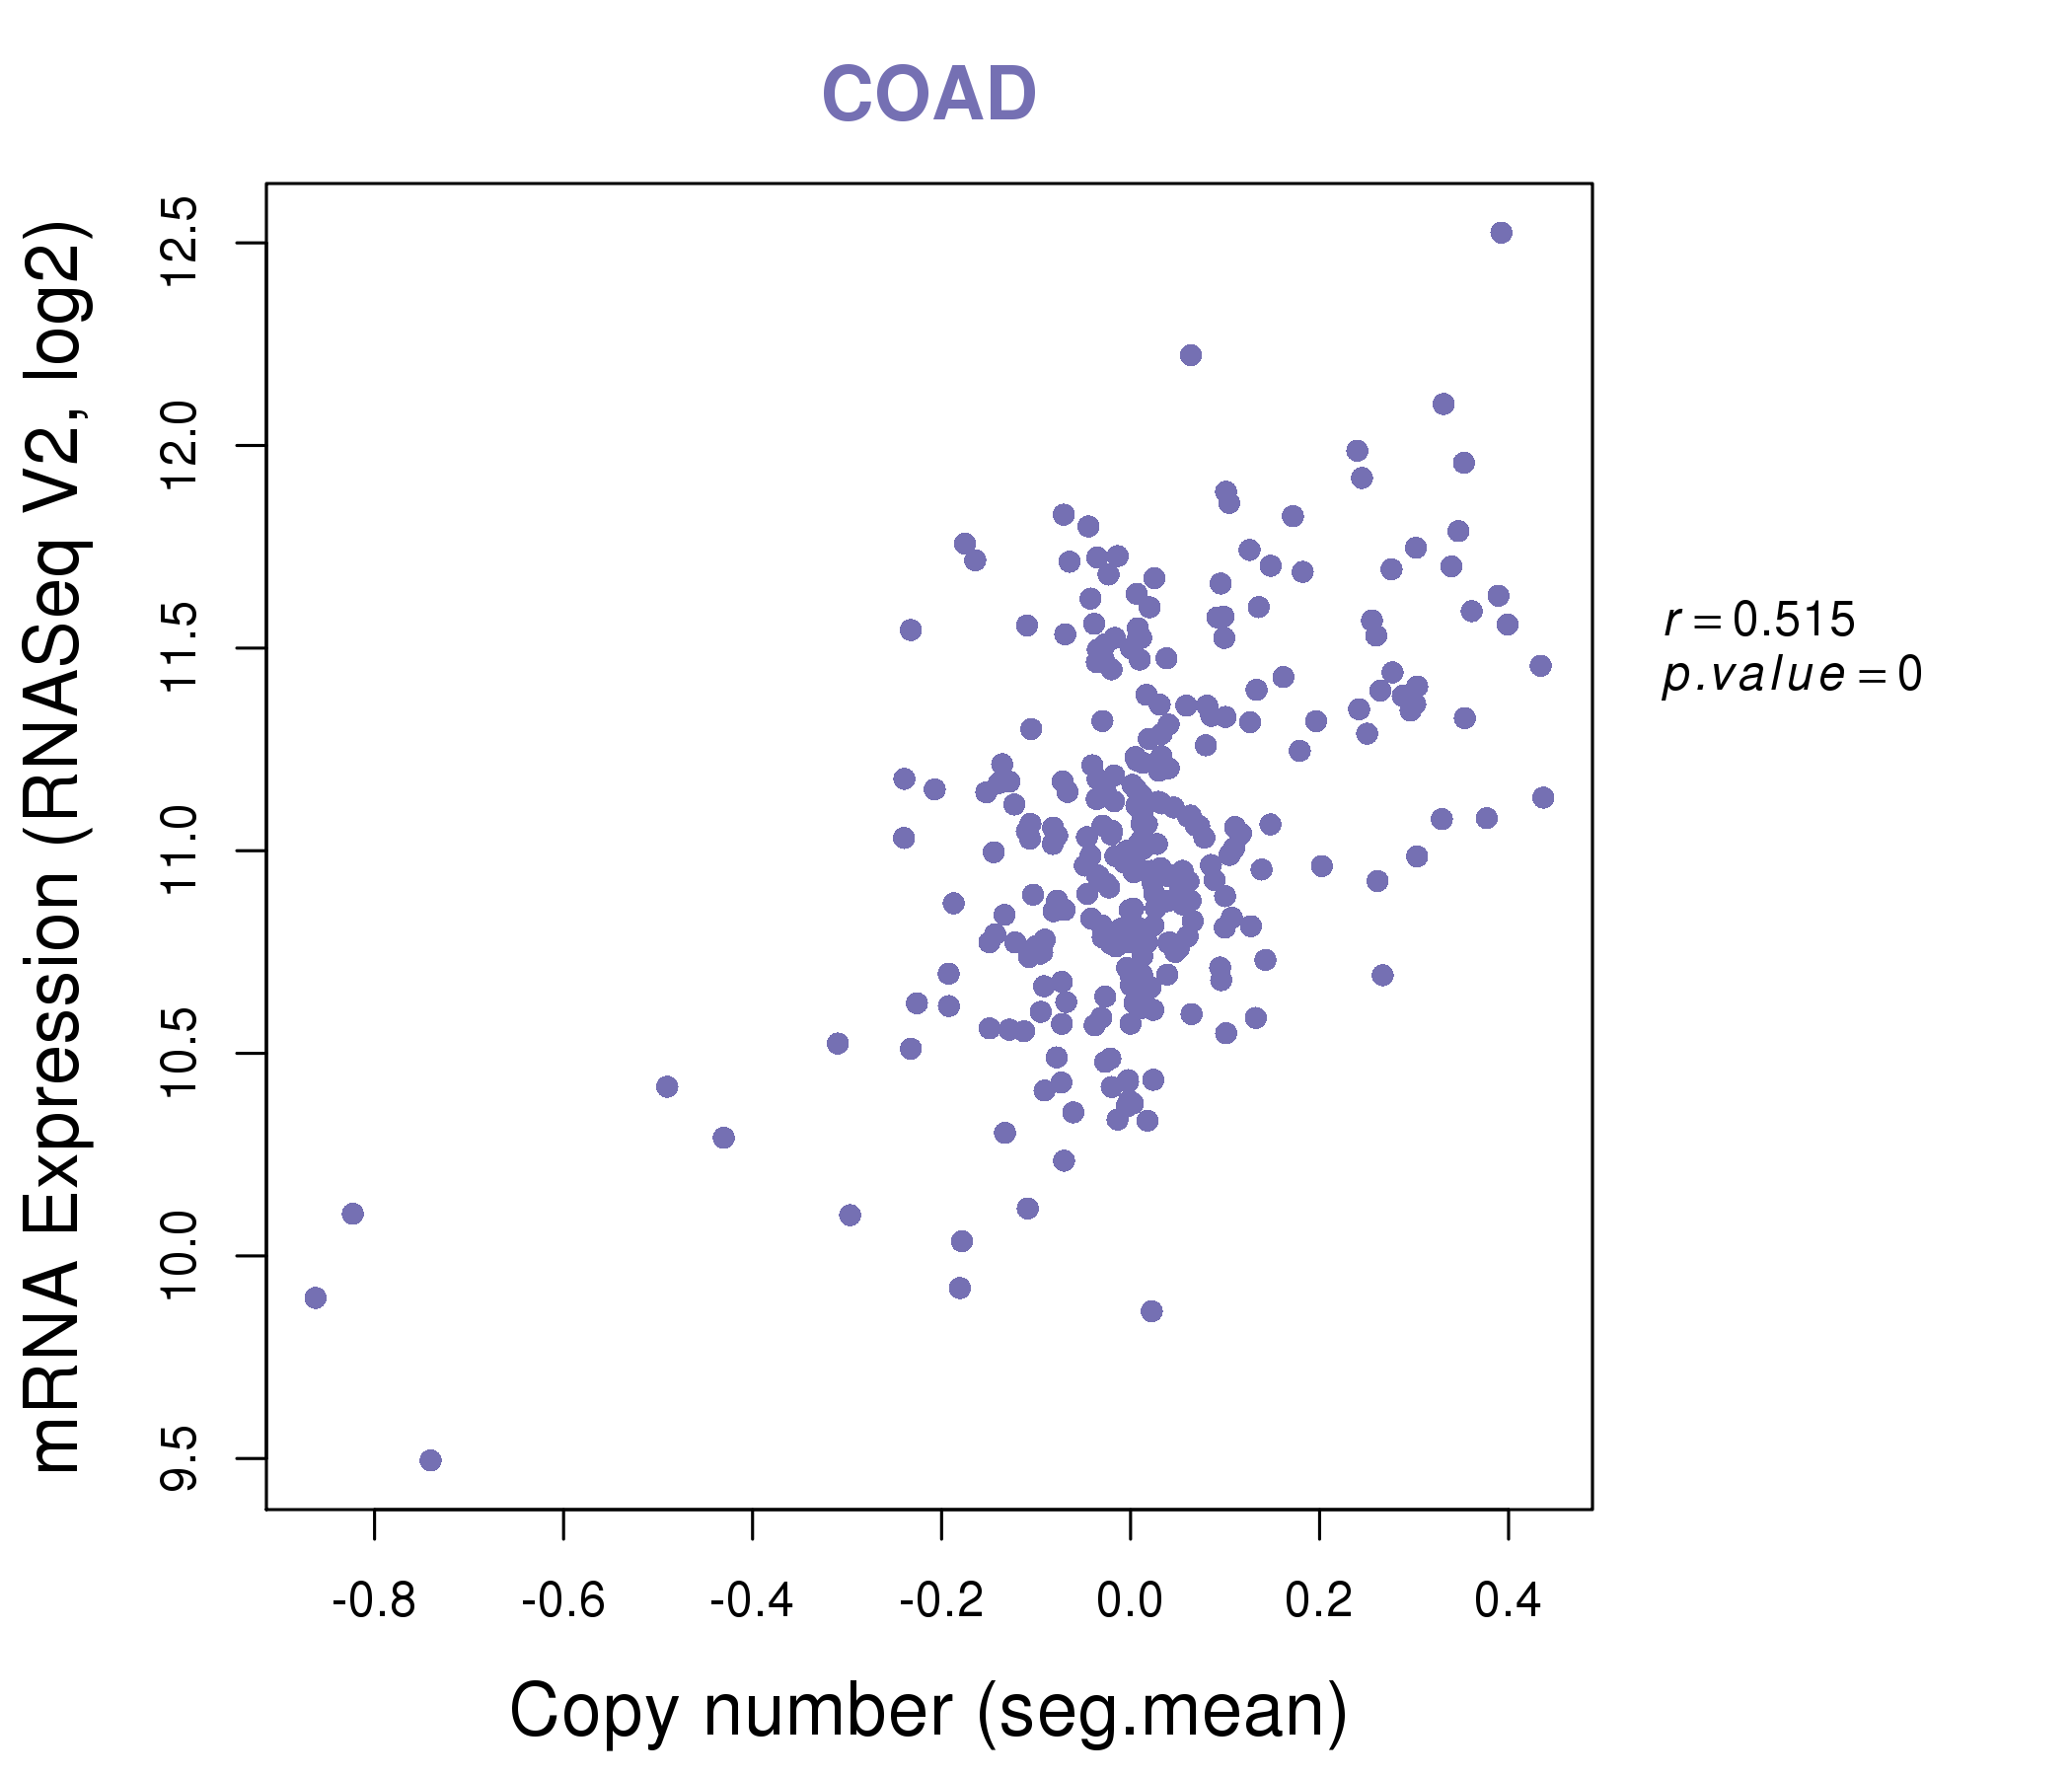
| * This plots show the correlation between CNV and gene expression. |
: Open all plots for all cancer types
 |
|
 |
|
| Top |
| Gene-Gene Network Information |
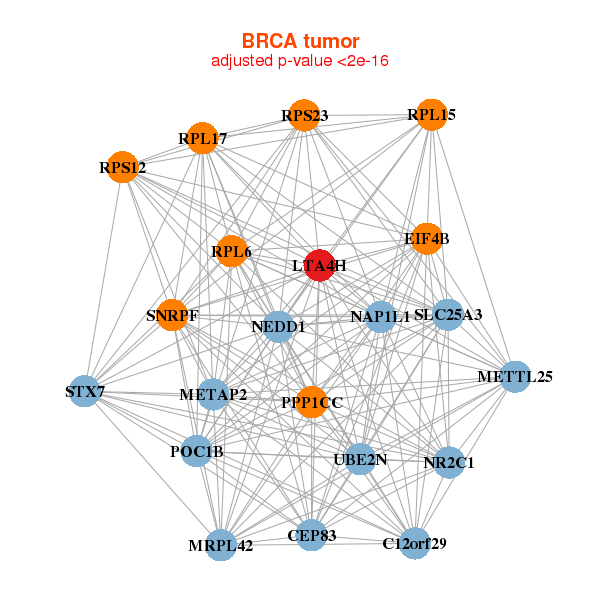
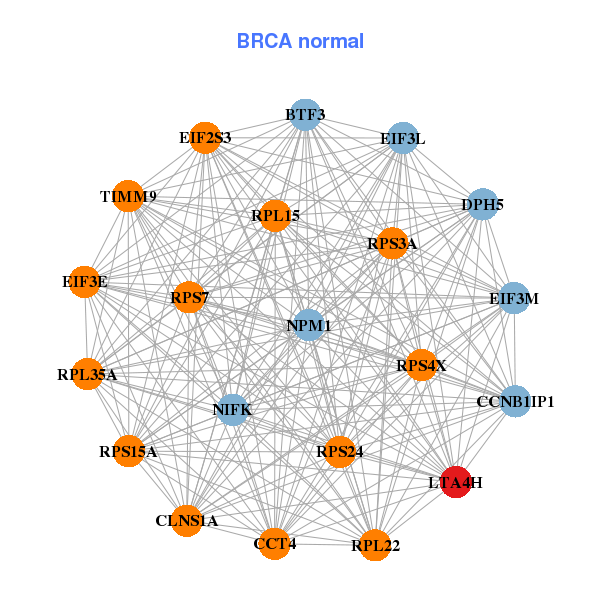
| * Co-Expression network figures were drawn using R package igraph. Only the top 20 genes with the highest correlations were shown. Red circle: input gene, orange circle: cell metabolism gene, sky circle: other gene |
: Open all plots for all cancer types
 |
| ||||
| METTL25,C12orf29,CEP83,EIF4B,LTA4H,METAP2,MRPL42, NAP1L1,NEDD1,NR2C1,POC1B,PPP1CC,RPL15,RPL17, RPL6,RPS12,RPS23,SLC25A3,SNRPF,STX7,UBE2N | BTF3,CCNB1IP1,CCT4,CLNS1A,DPH5,EIF2S3,EIF3E, EIF3L,EIF3M,LTA4H,NIFK,NPM1,RPL15,RPL22, RPL35A,RPS15A,RPS24,RPS3A,RPS4X,RPS7,TIMM9 | ||||
 |
| ||||
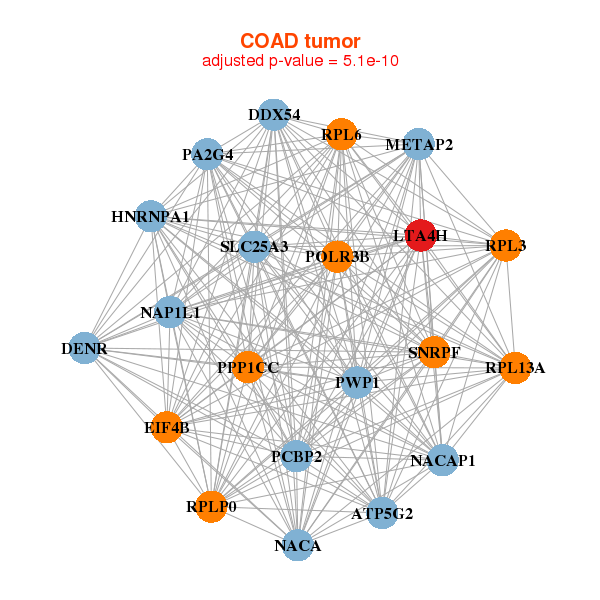
| ATP5G2,DDX54,DENR,EIF4B,HNRNPA1,LTA4H,METAP2, NACA,NACAP1,NAP1L1,PA2G4,PCBP2,POLR3B,PPP1CC, PWP1,RPL13A,RPL3,RPL6,RPLP0,SLC25A3,SNRPF | ABCB7,ACRBP,AZGP1,CDC14B,CLPX,CREBL2,EIF2S3, EIF3H,EIF4B,FGGY,IGBP1,LETMD1,LTA4H,PCBP2, ECI2,PLAG1,RAG1,RMND1,RPL22,TMEM19,WDR48 |

| * Co-Expression network figures were drawn using R package igraph. Only the top 20 genes with the highest correlations were shown. Red circle: input gene, orange circle: cell metabolism gene, sky circle: other gene |
: Open all plots for all cancer types
| Top |
: Open all interacting genes' information including KEGG pathway for all interacting genes from DAVID
| Top |
| Pharmacological Information for LTA4H |
| DB Category | DB Name | DB's ID and Url link |
| Chemistry | BindingDB | P09960; -. |
| Chemistry | ChEMBL | CHEMBL4618; -. |
| Chemistry | GuidetoPHARMACOLOGY | 1395; -. |
| Organism-specific databases | PharmGKB | PA24345; -. |
| Organism-specific databases | CTD | 4048; -. |
| * Gene Centered Interaction Network. |
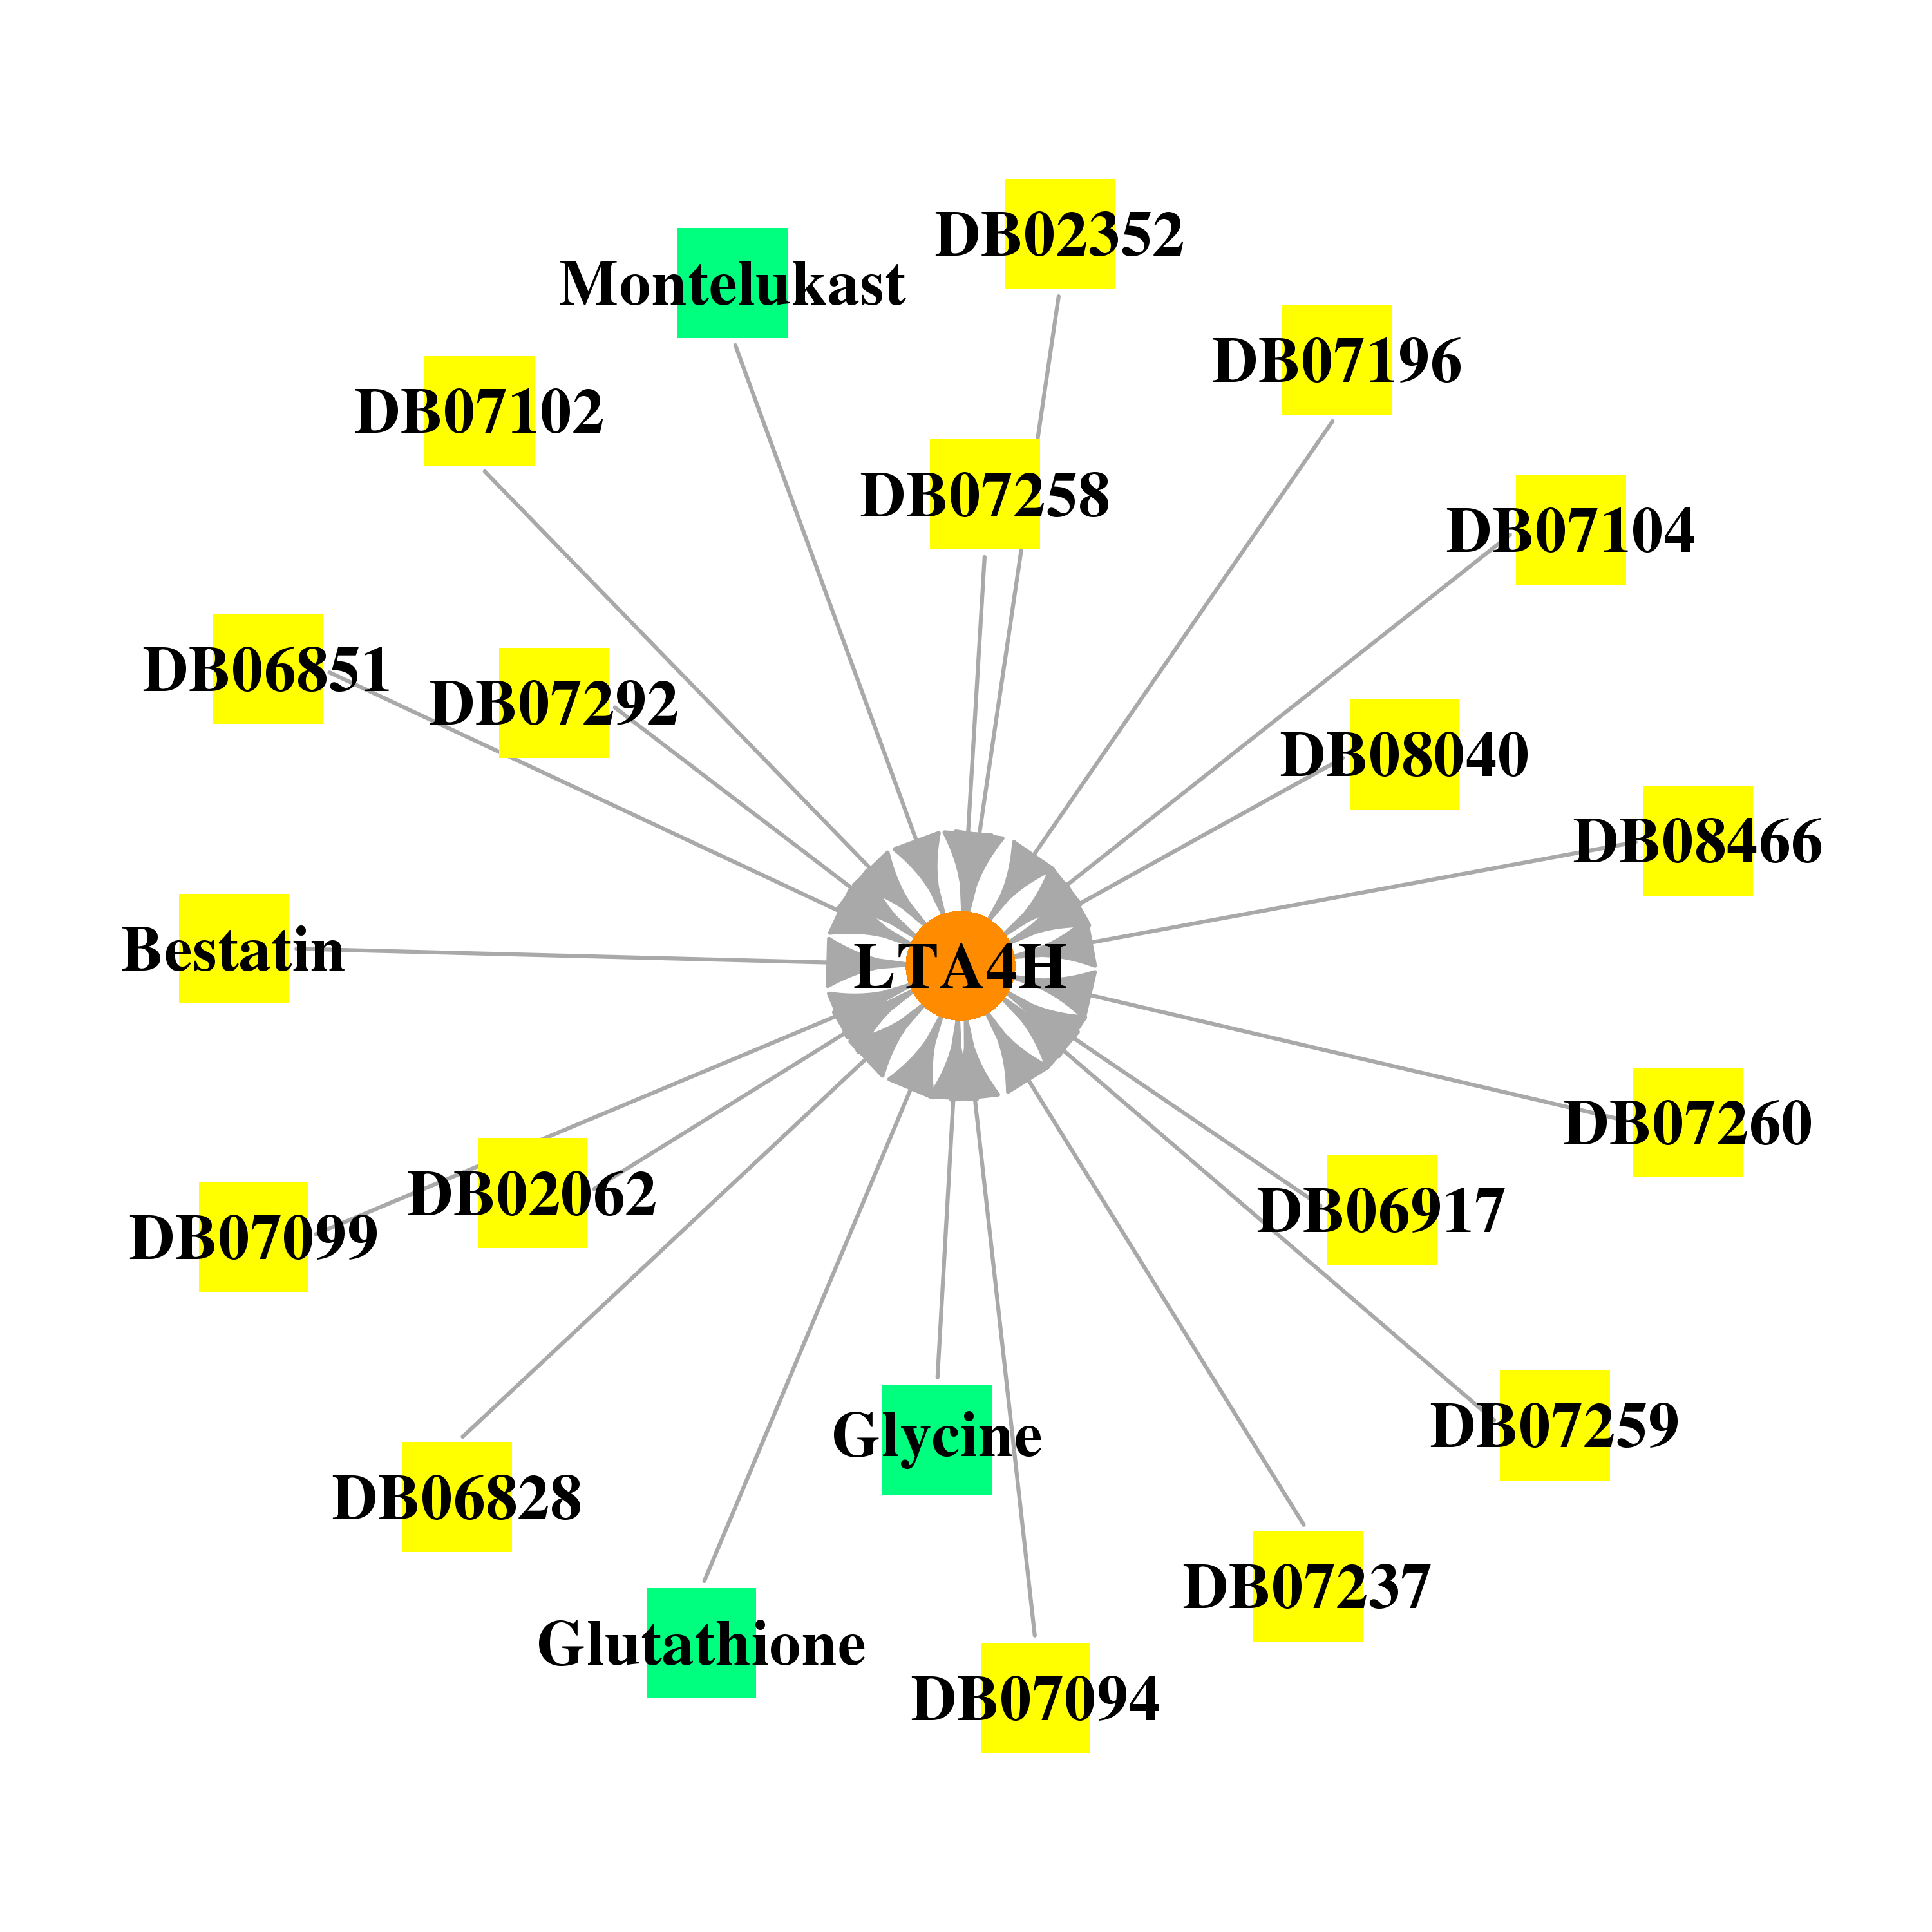 |
| * Drug Centered Interaction Network. |
| DrugBank ID | Target Name | Drug Groups | Generic Name | Drug Centered Network | Drug Structure |
| DB02062 | leukotriene A4 hydrolase | experimental | N-[3-[(1-Aminoethyl)(Hydroxy)Phosphoryl]-2-(1,1'-Biphenyl-4-Ylmethyl)Propanoyl]Alanine |  |  |
| DB02352 | leukotriene A4 hydrolase | experimental | 3-(Benzyloxy)Pyridin-2-Amine |  | 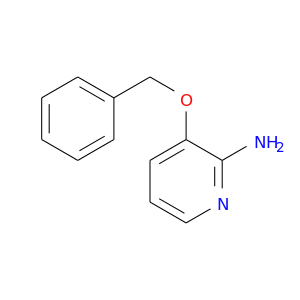 |
| DB03424 | leukotriene A4 hydrolase | experimental | Bestatin | 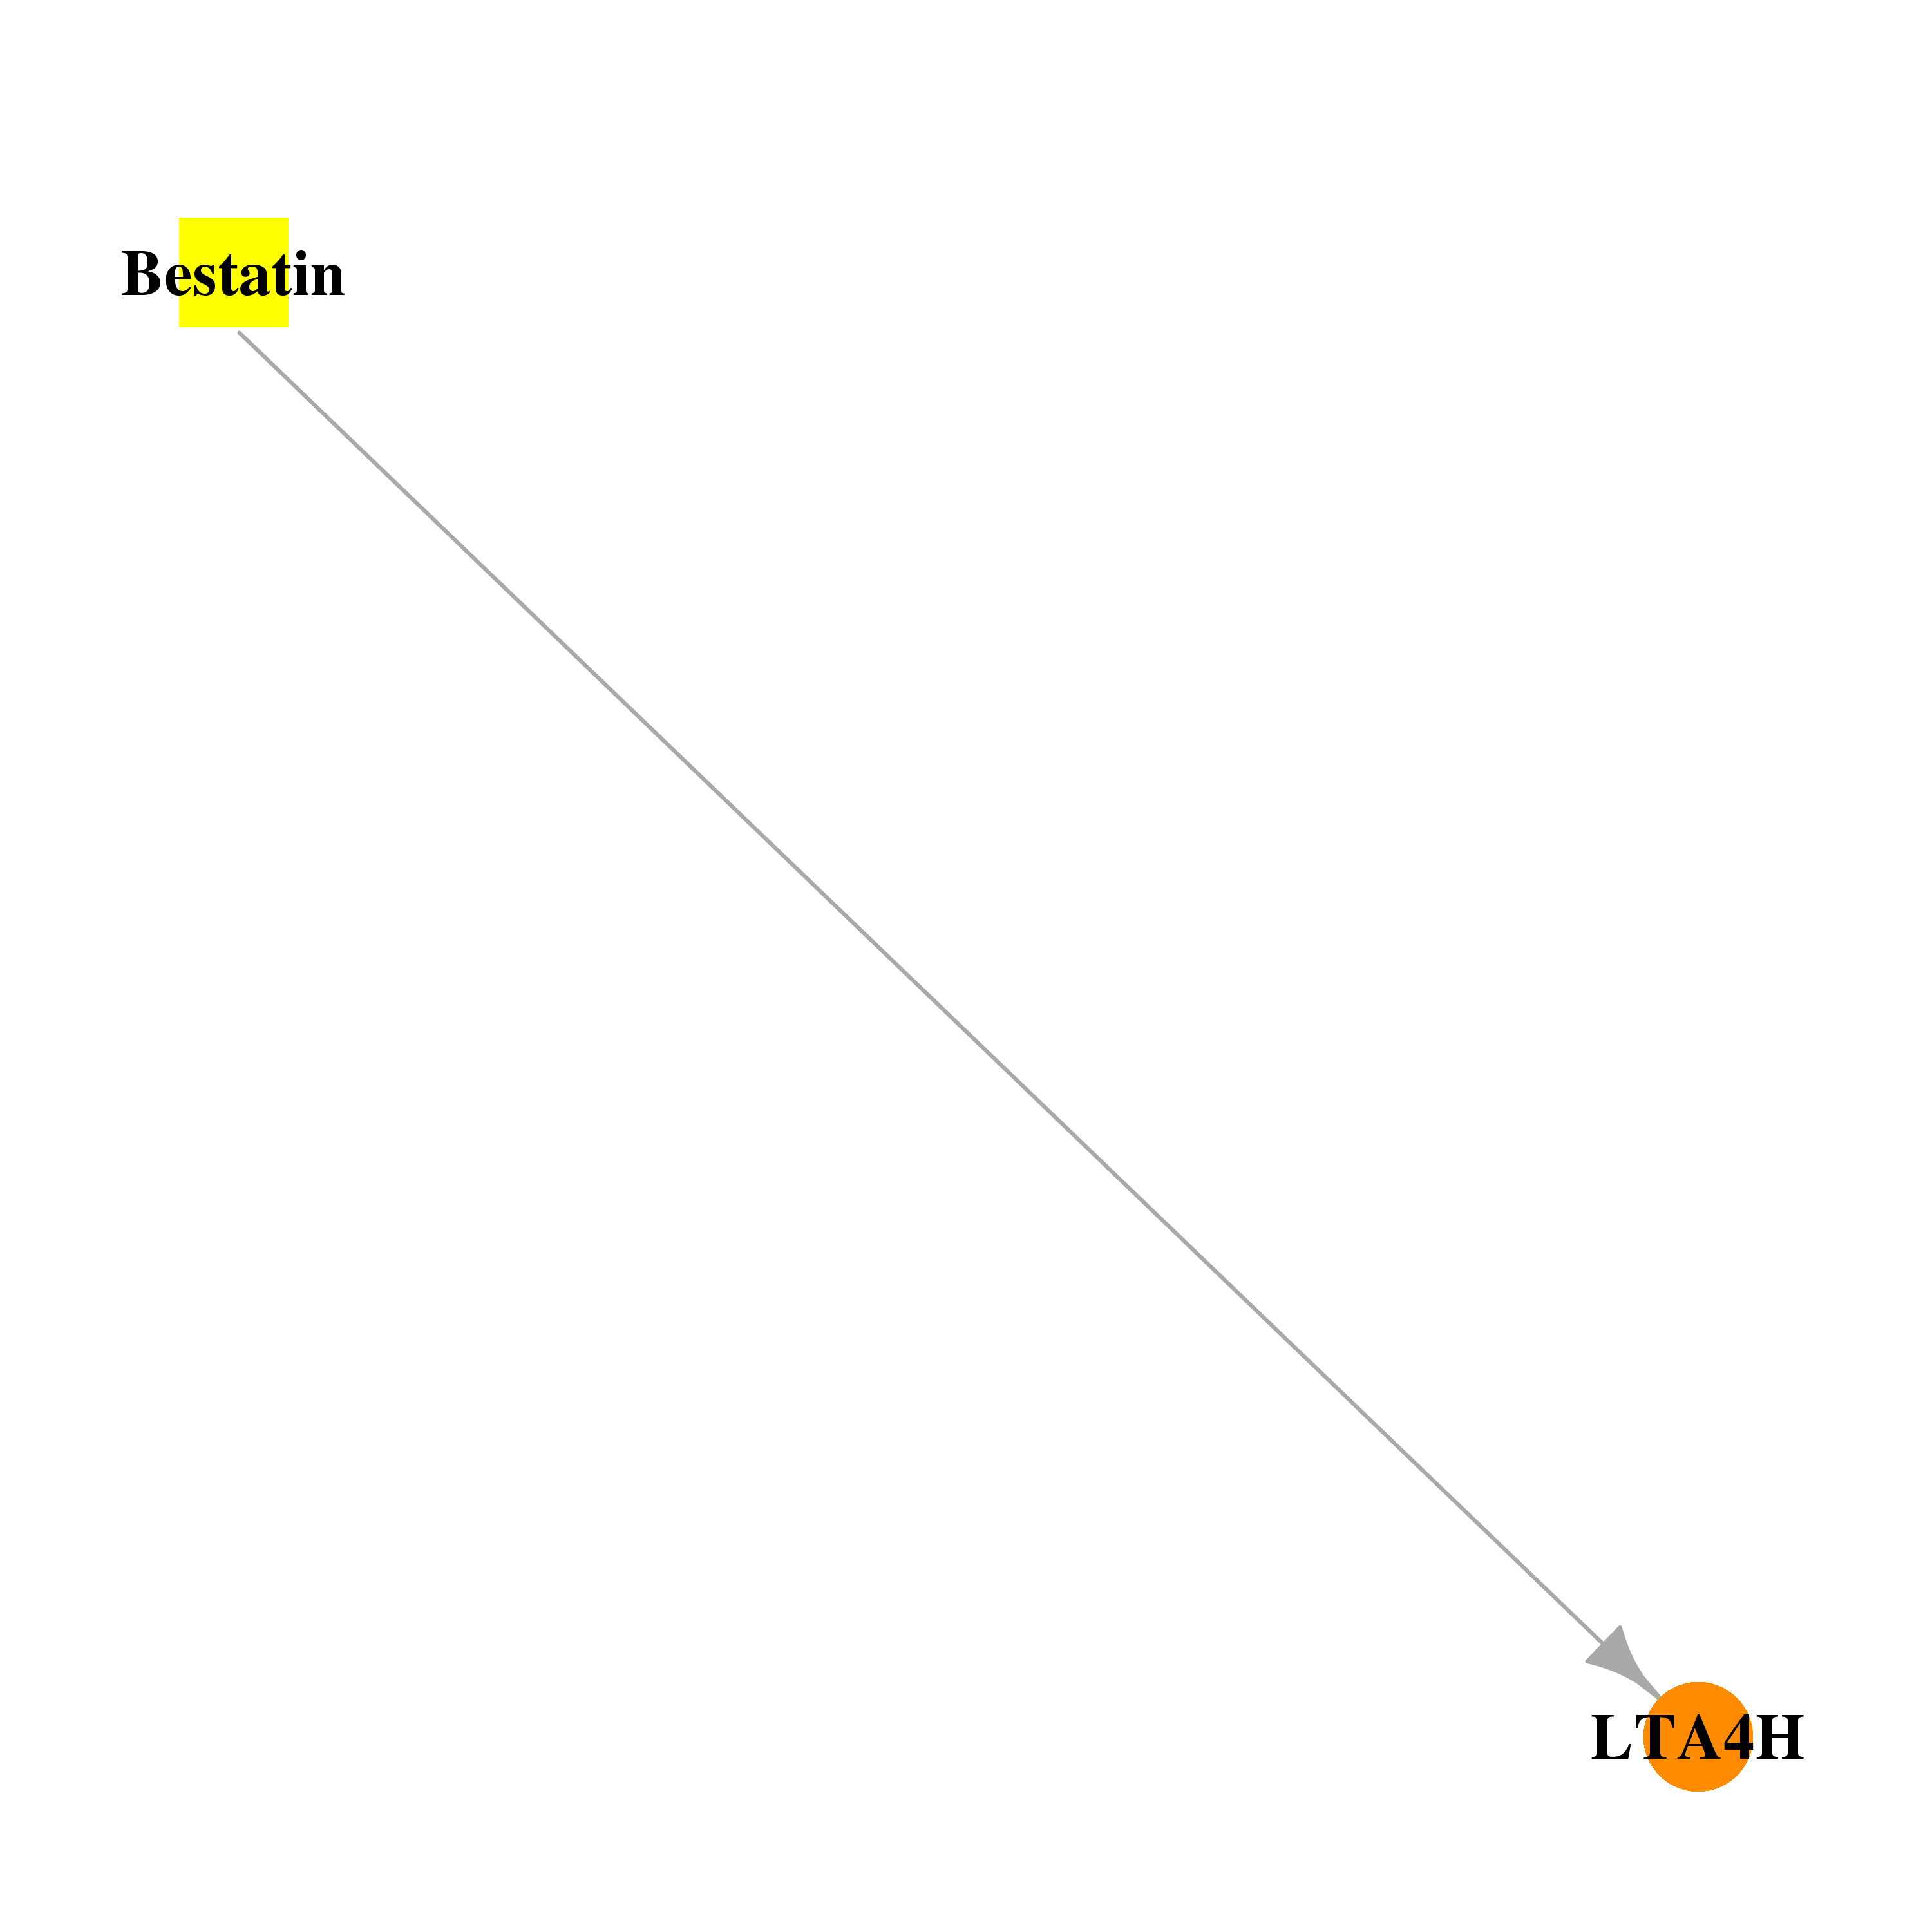 |  |
| DB06828 | leukotriene A4 hydrolase | experimental | 5-[2-(1H-pyrrol-1-yl)ethoxy]-1H-indole | 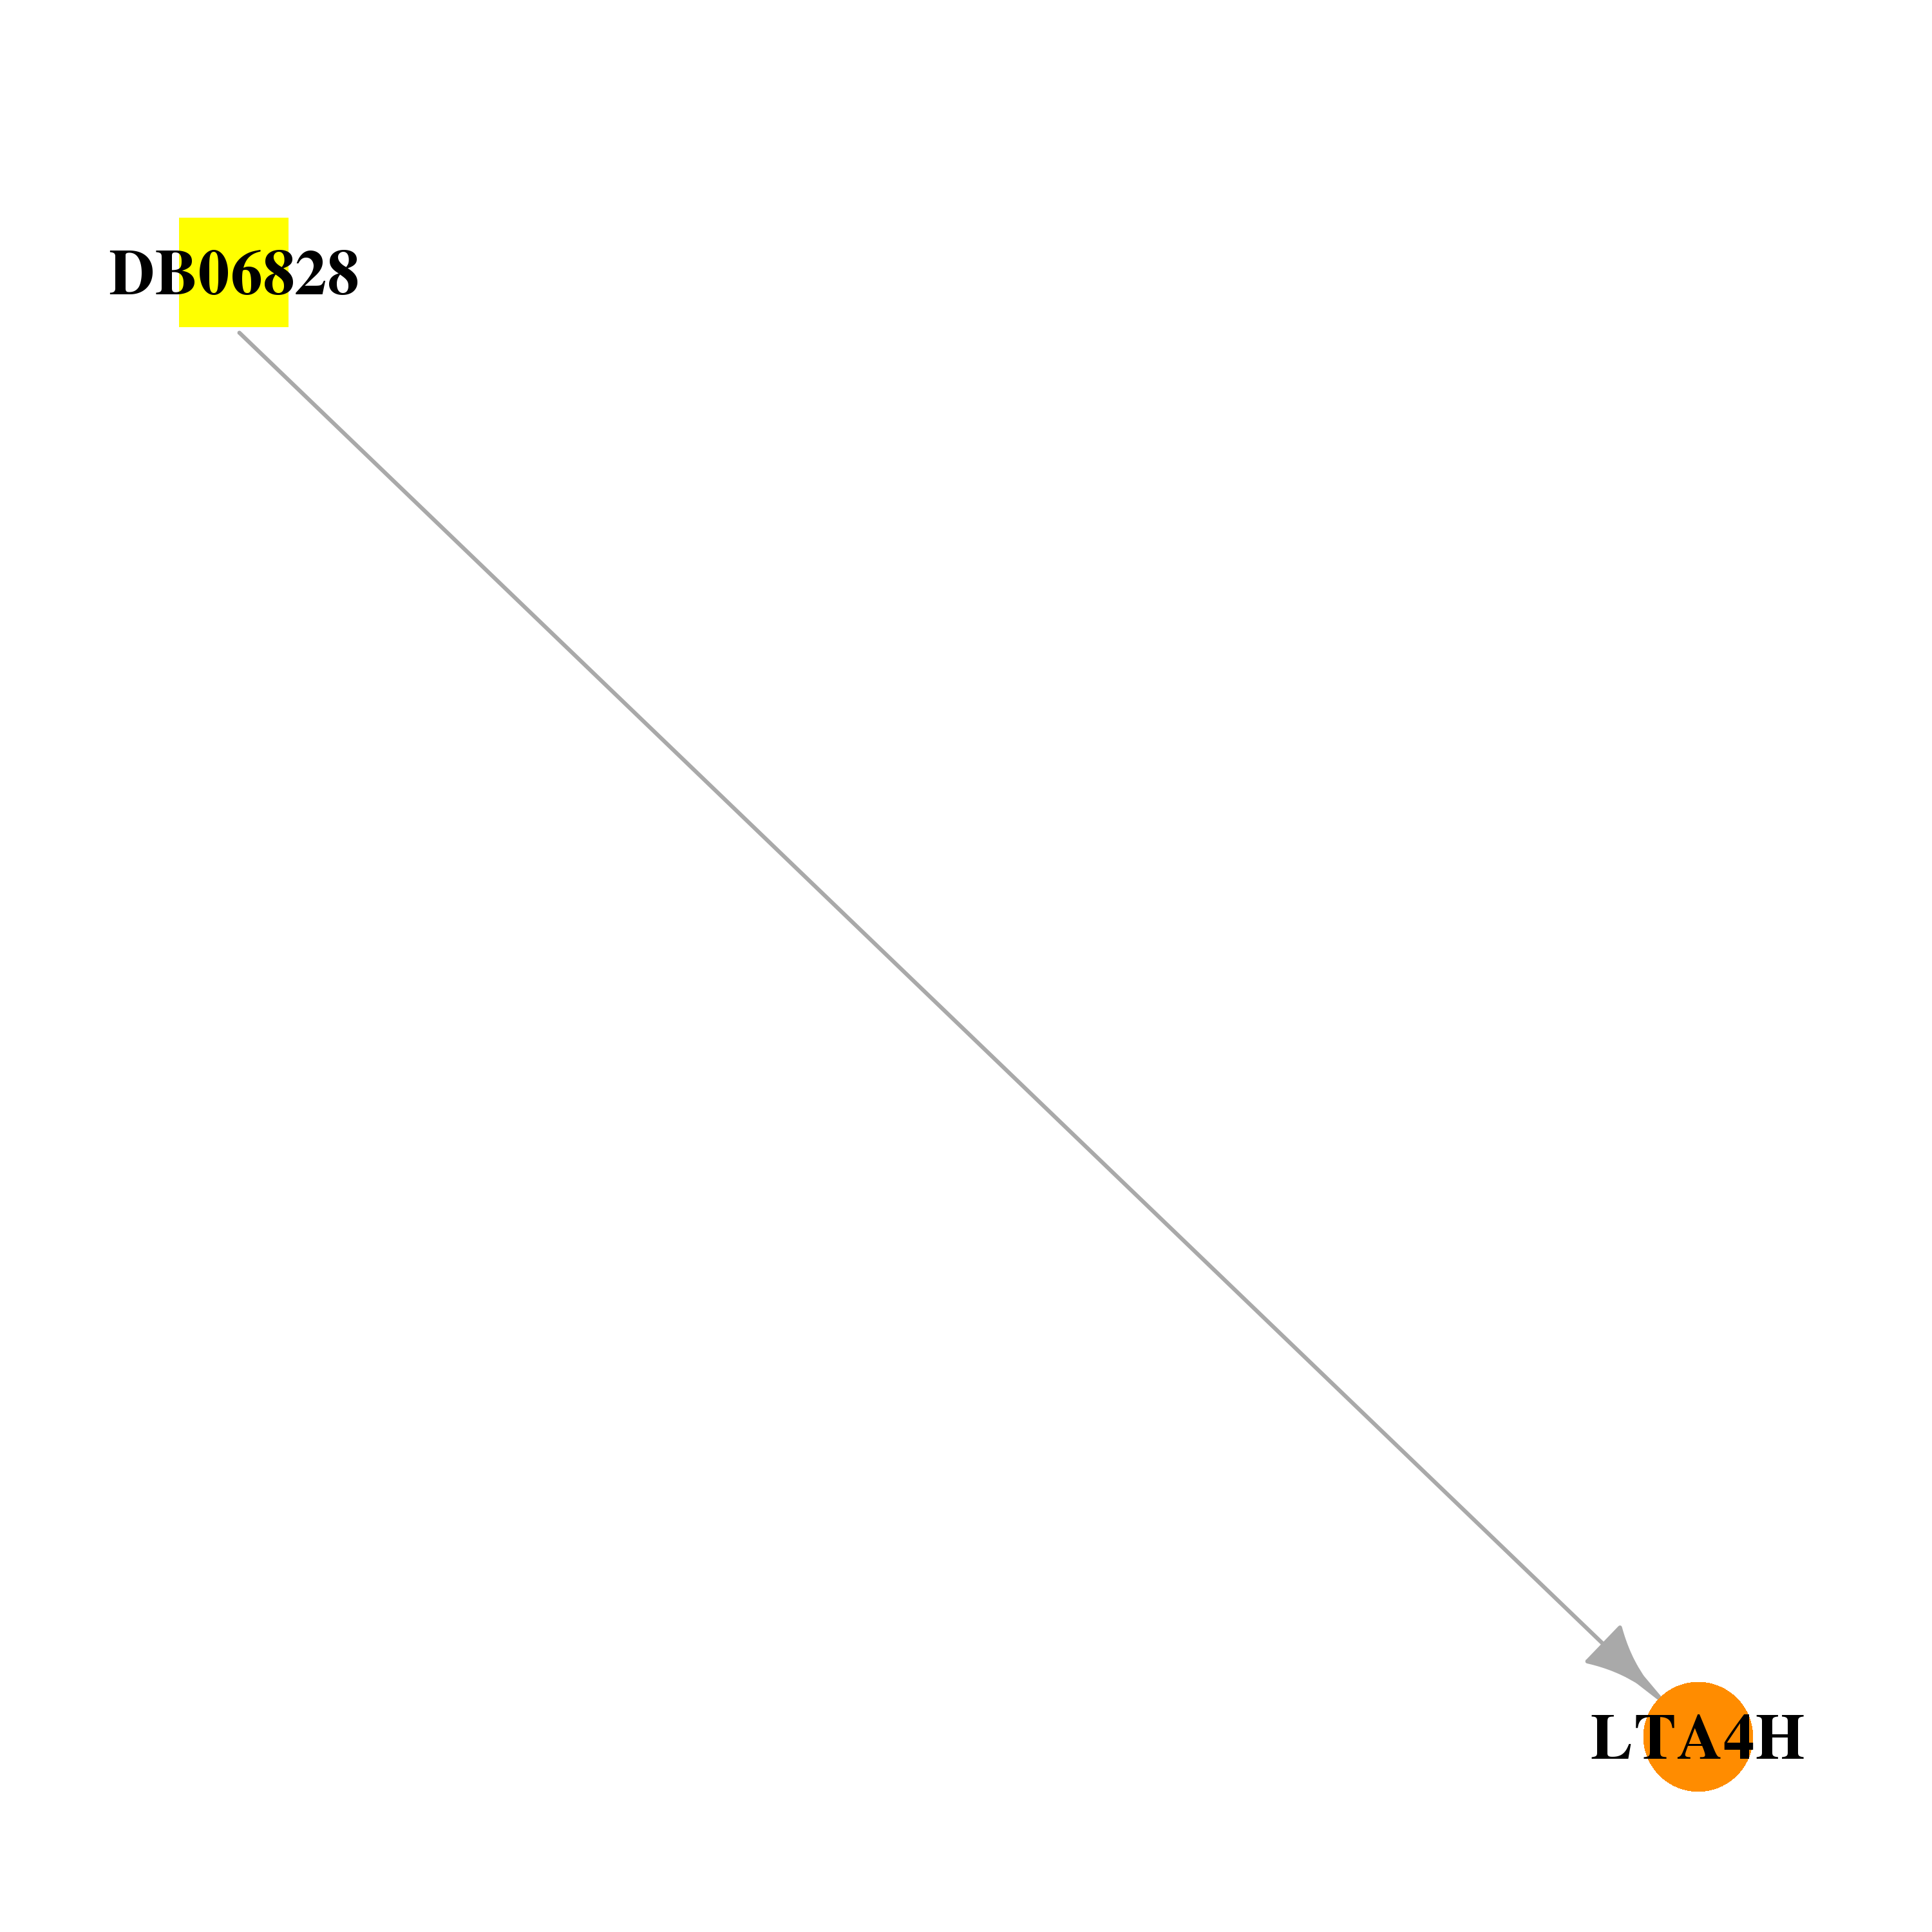 |  |
| DB06851 | leukotriene A4 hydrolase | experimental | N-(pyridin-3-ylmethyl)aniline | 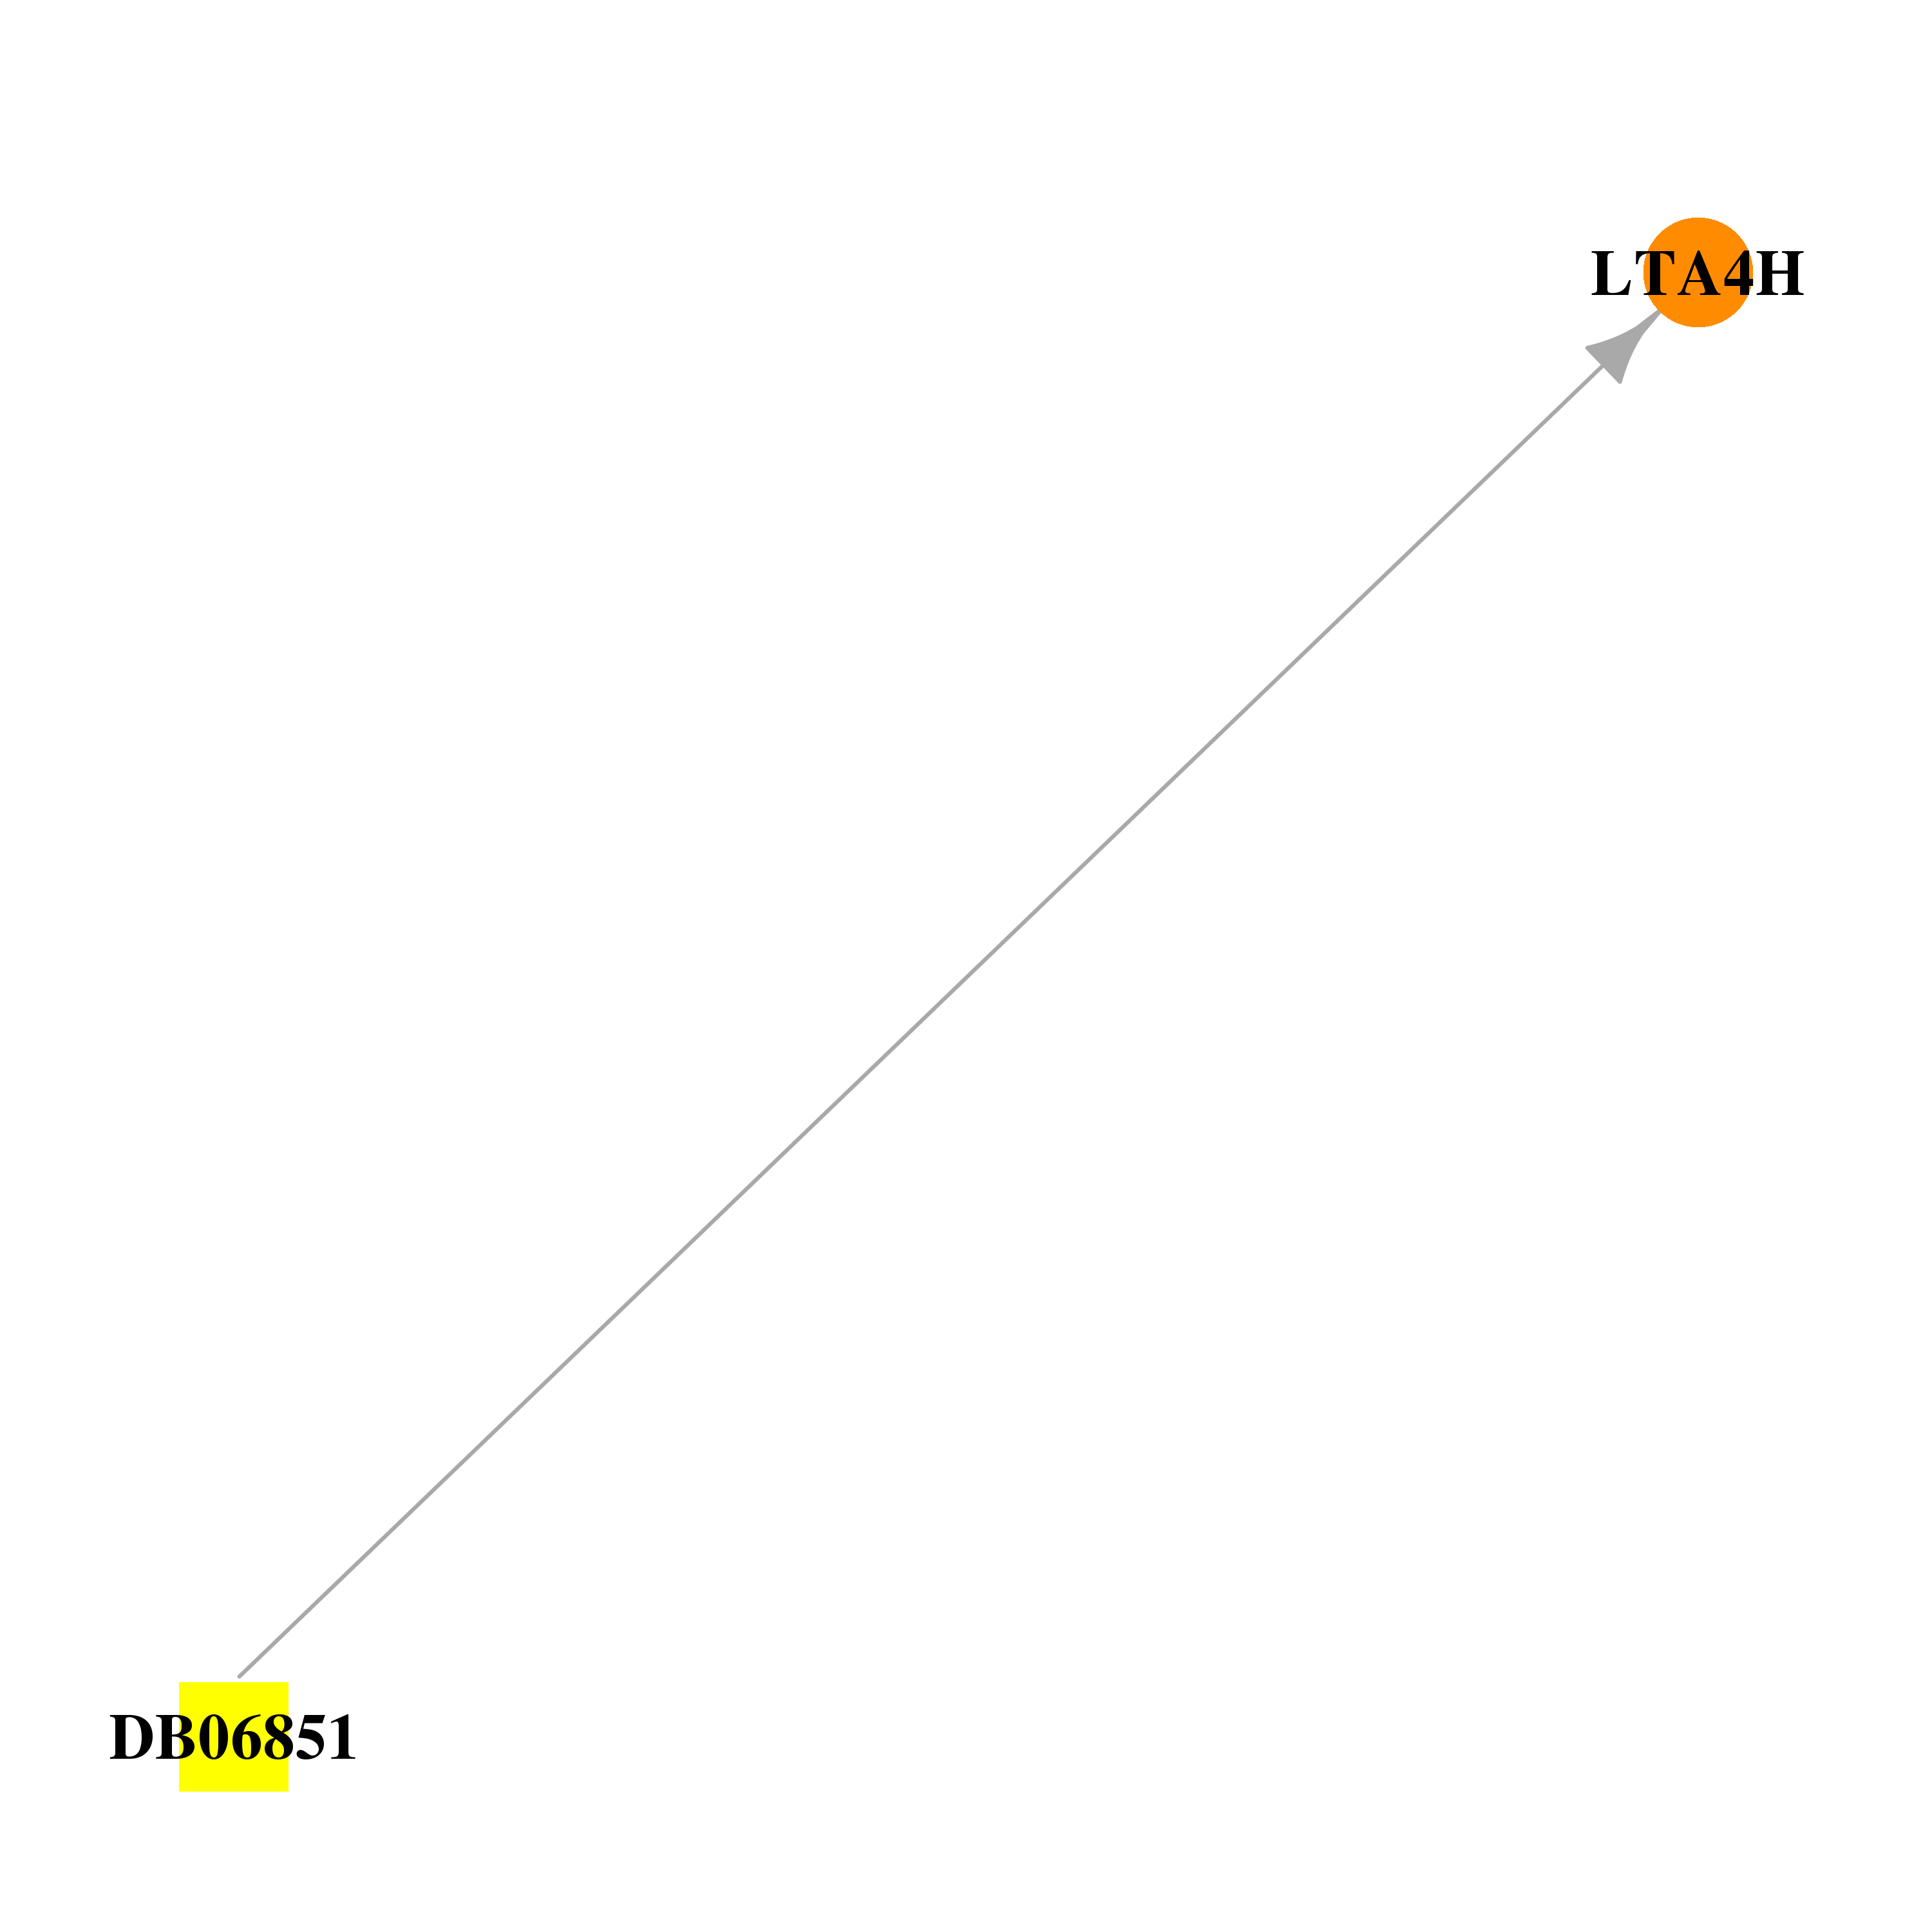 |  |
| DB06917 | leukotriene A4 hydrolase | experimental | (4-fluorophenyl)(pyridin-4-yl)methanone |  |  |
| DB07094 | leukotriene A4 hydrolase | experimental | 1-(2,2'-bithiophen-5-yl)methanamine |  |  |
| DB07099 | leukotriene A4 hydrolase | experimental | N-[4-(benzyloxy)phenyl]glycinamide |  |  |
| DB07102 | leukotriene A4 hydrolase | experimental | (2S)-2-amino-5-oxo-5-[(4-phenylmethoxyphenyl)amino]pentanoic acid |  |  |
| DB07104 | leukotriene A4 hydrolase | experimental | 4-amino-N-[4-(benzyloxy)phenyl]butanamide |  |  |
| DB07196 | leukotriene A4 hydrolase | experimental | N-methyl-1-(2-thiophen-2-ylphenyl)methanamine |  |  |
| DB07237 | leukotriene A4 hydrolase | experimental | {4-[(2R)-pyrrolidin-2-ylmethoxy]phenyl}(4-thiophen-3-ylphenyl)methanone |  |  |
| DB07258 | leukotriene A4 hydrolase | experimental | (R)-pyridin-4-yl[4-(2-pyrrolidin-1-ylethoxy)phenyl]methanol | 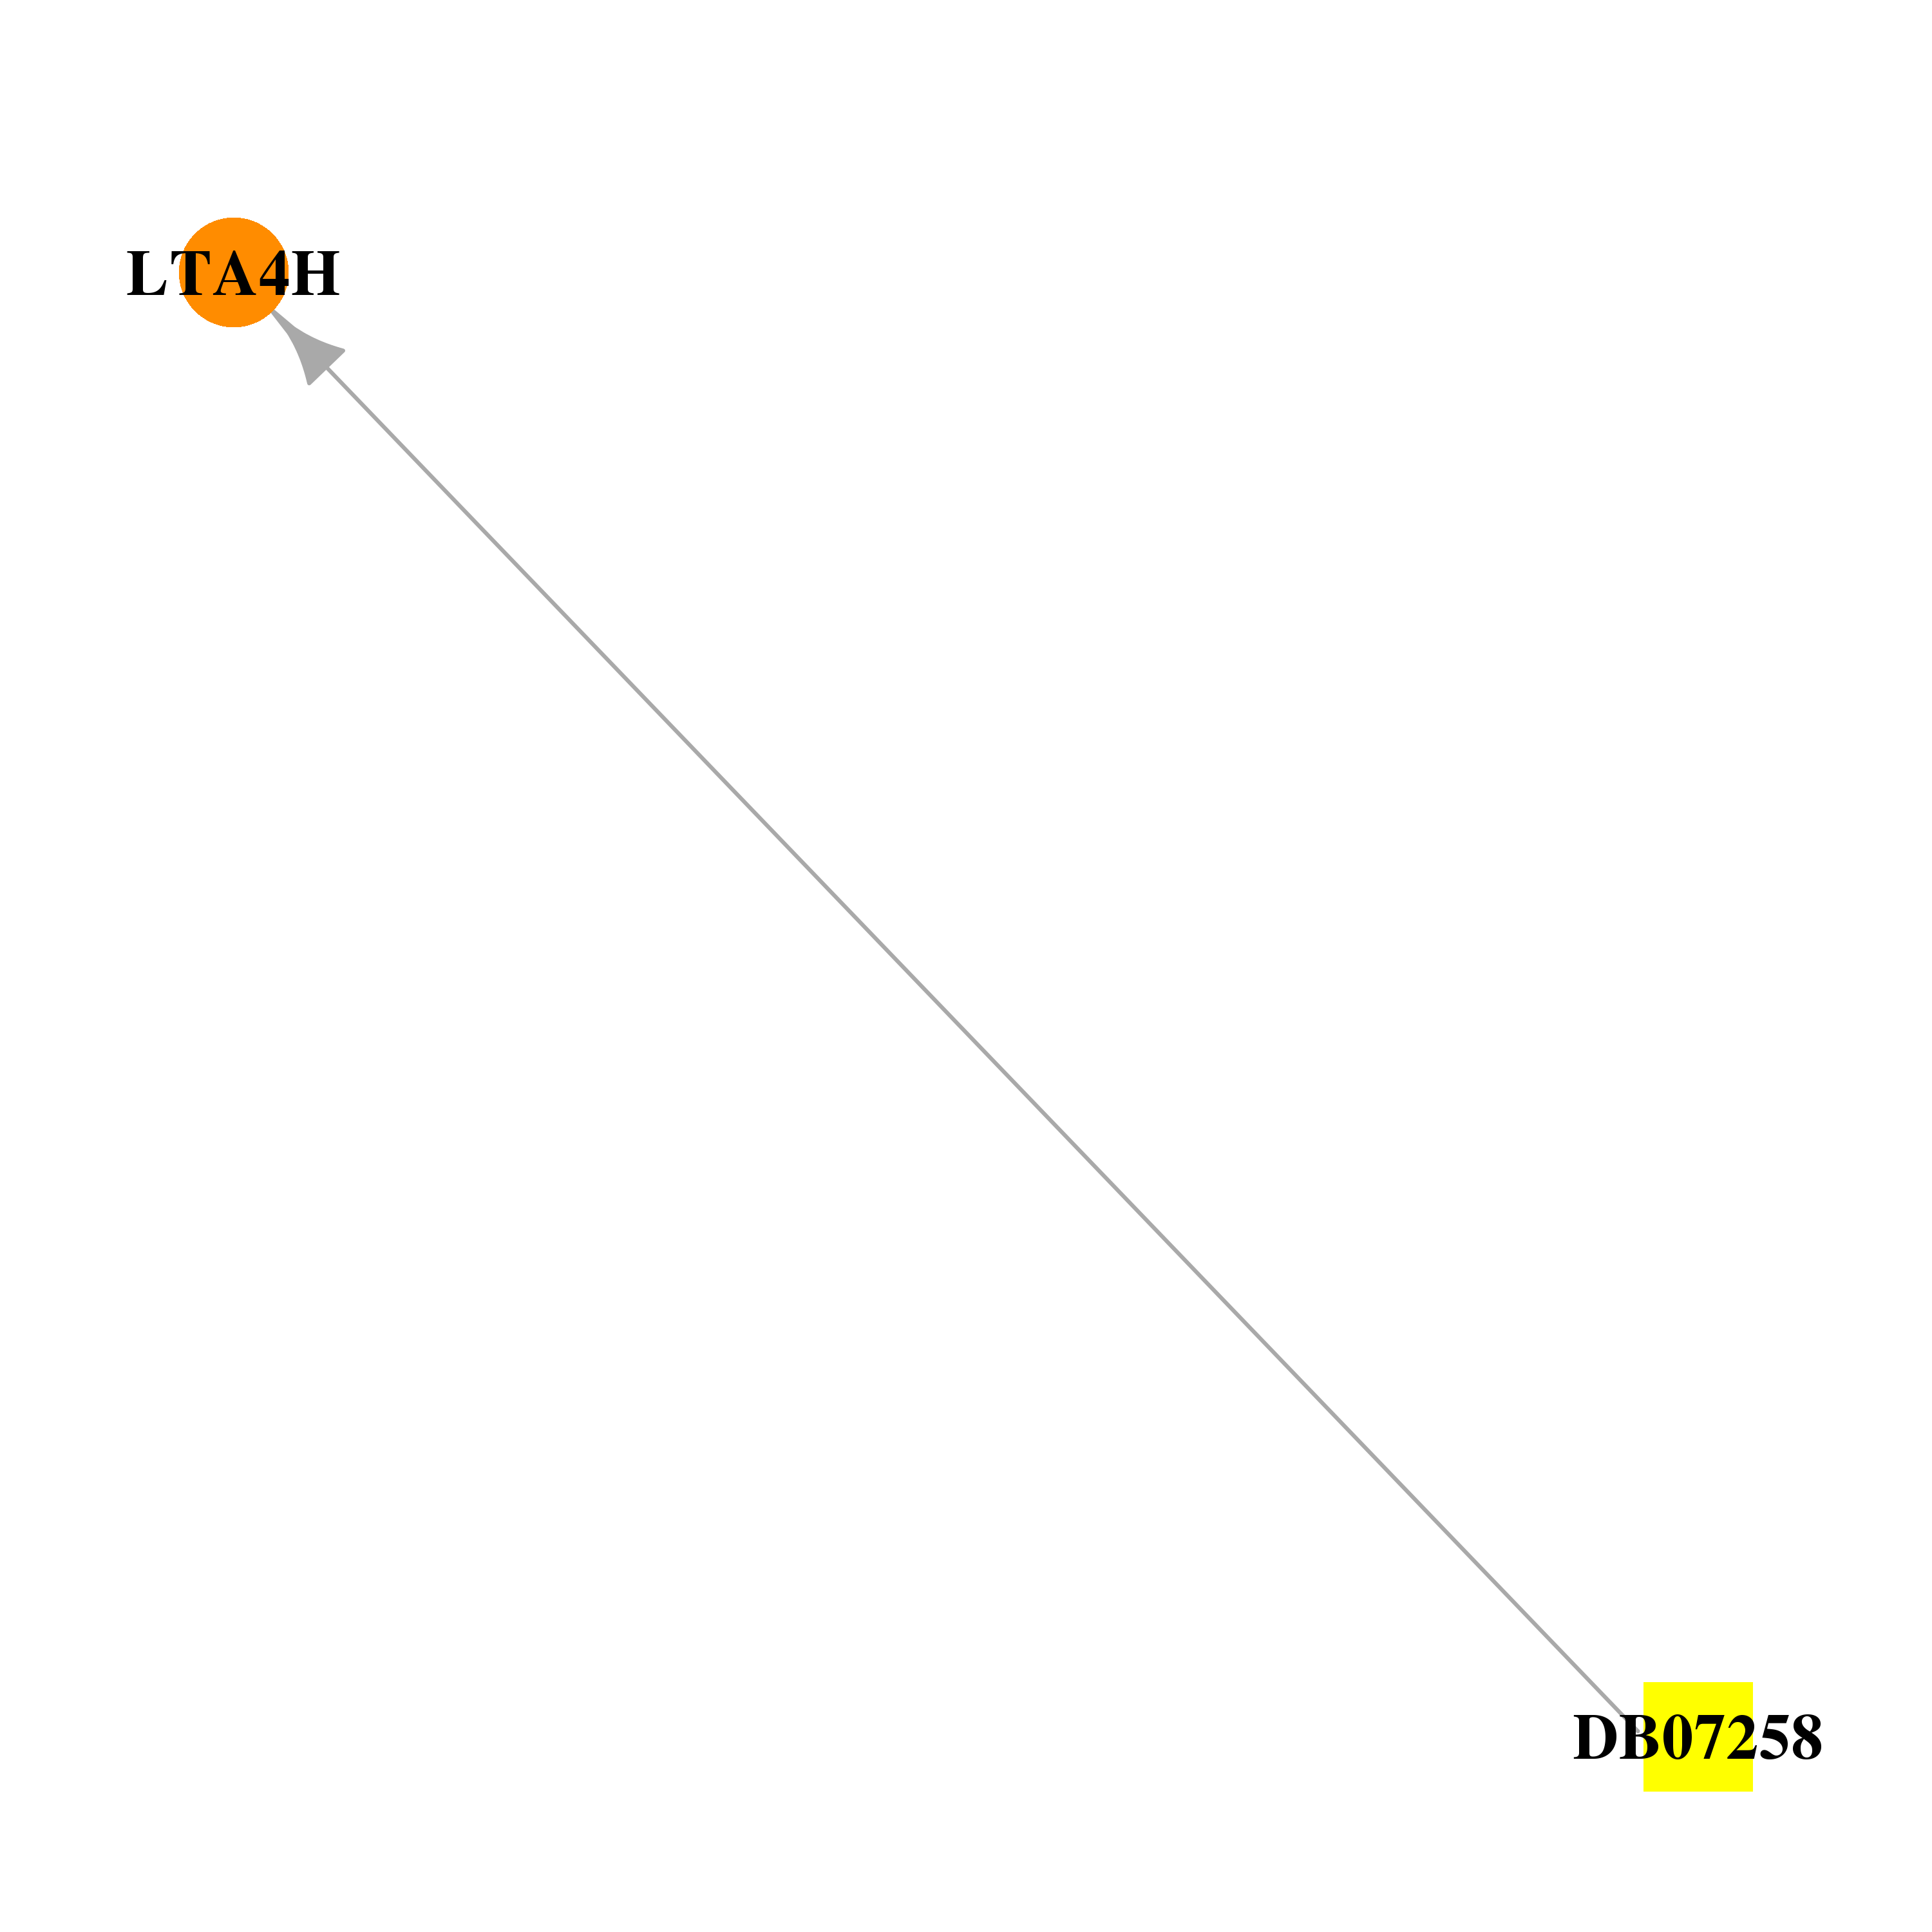 |  |
| DB07259 | leukotriene A4 hydrolase | experimental | 1-(4-thiophen-2-ylphenyl)methanamine |  |  |
| DB07260 | leukotriene A4 hydrolase | experimental | N-benzyl-4-[(2R)-pyrrolidin-2-ylmethoxy]aniline |  |  |
| DB07292 | leukotriene A4 hydrolase | experimental | 4-(2-amino-1,3-thiazol-4-yl)phenol | 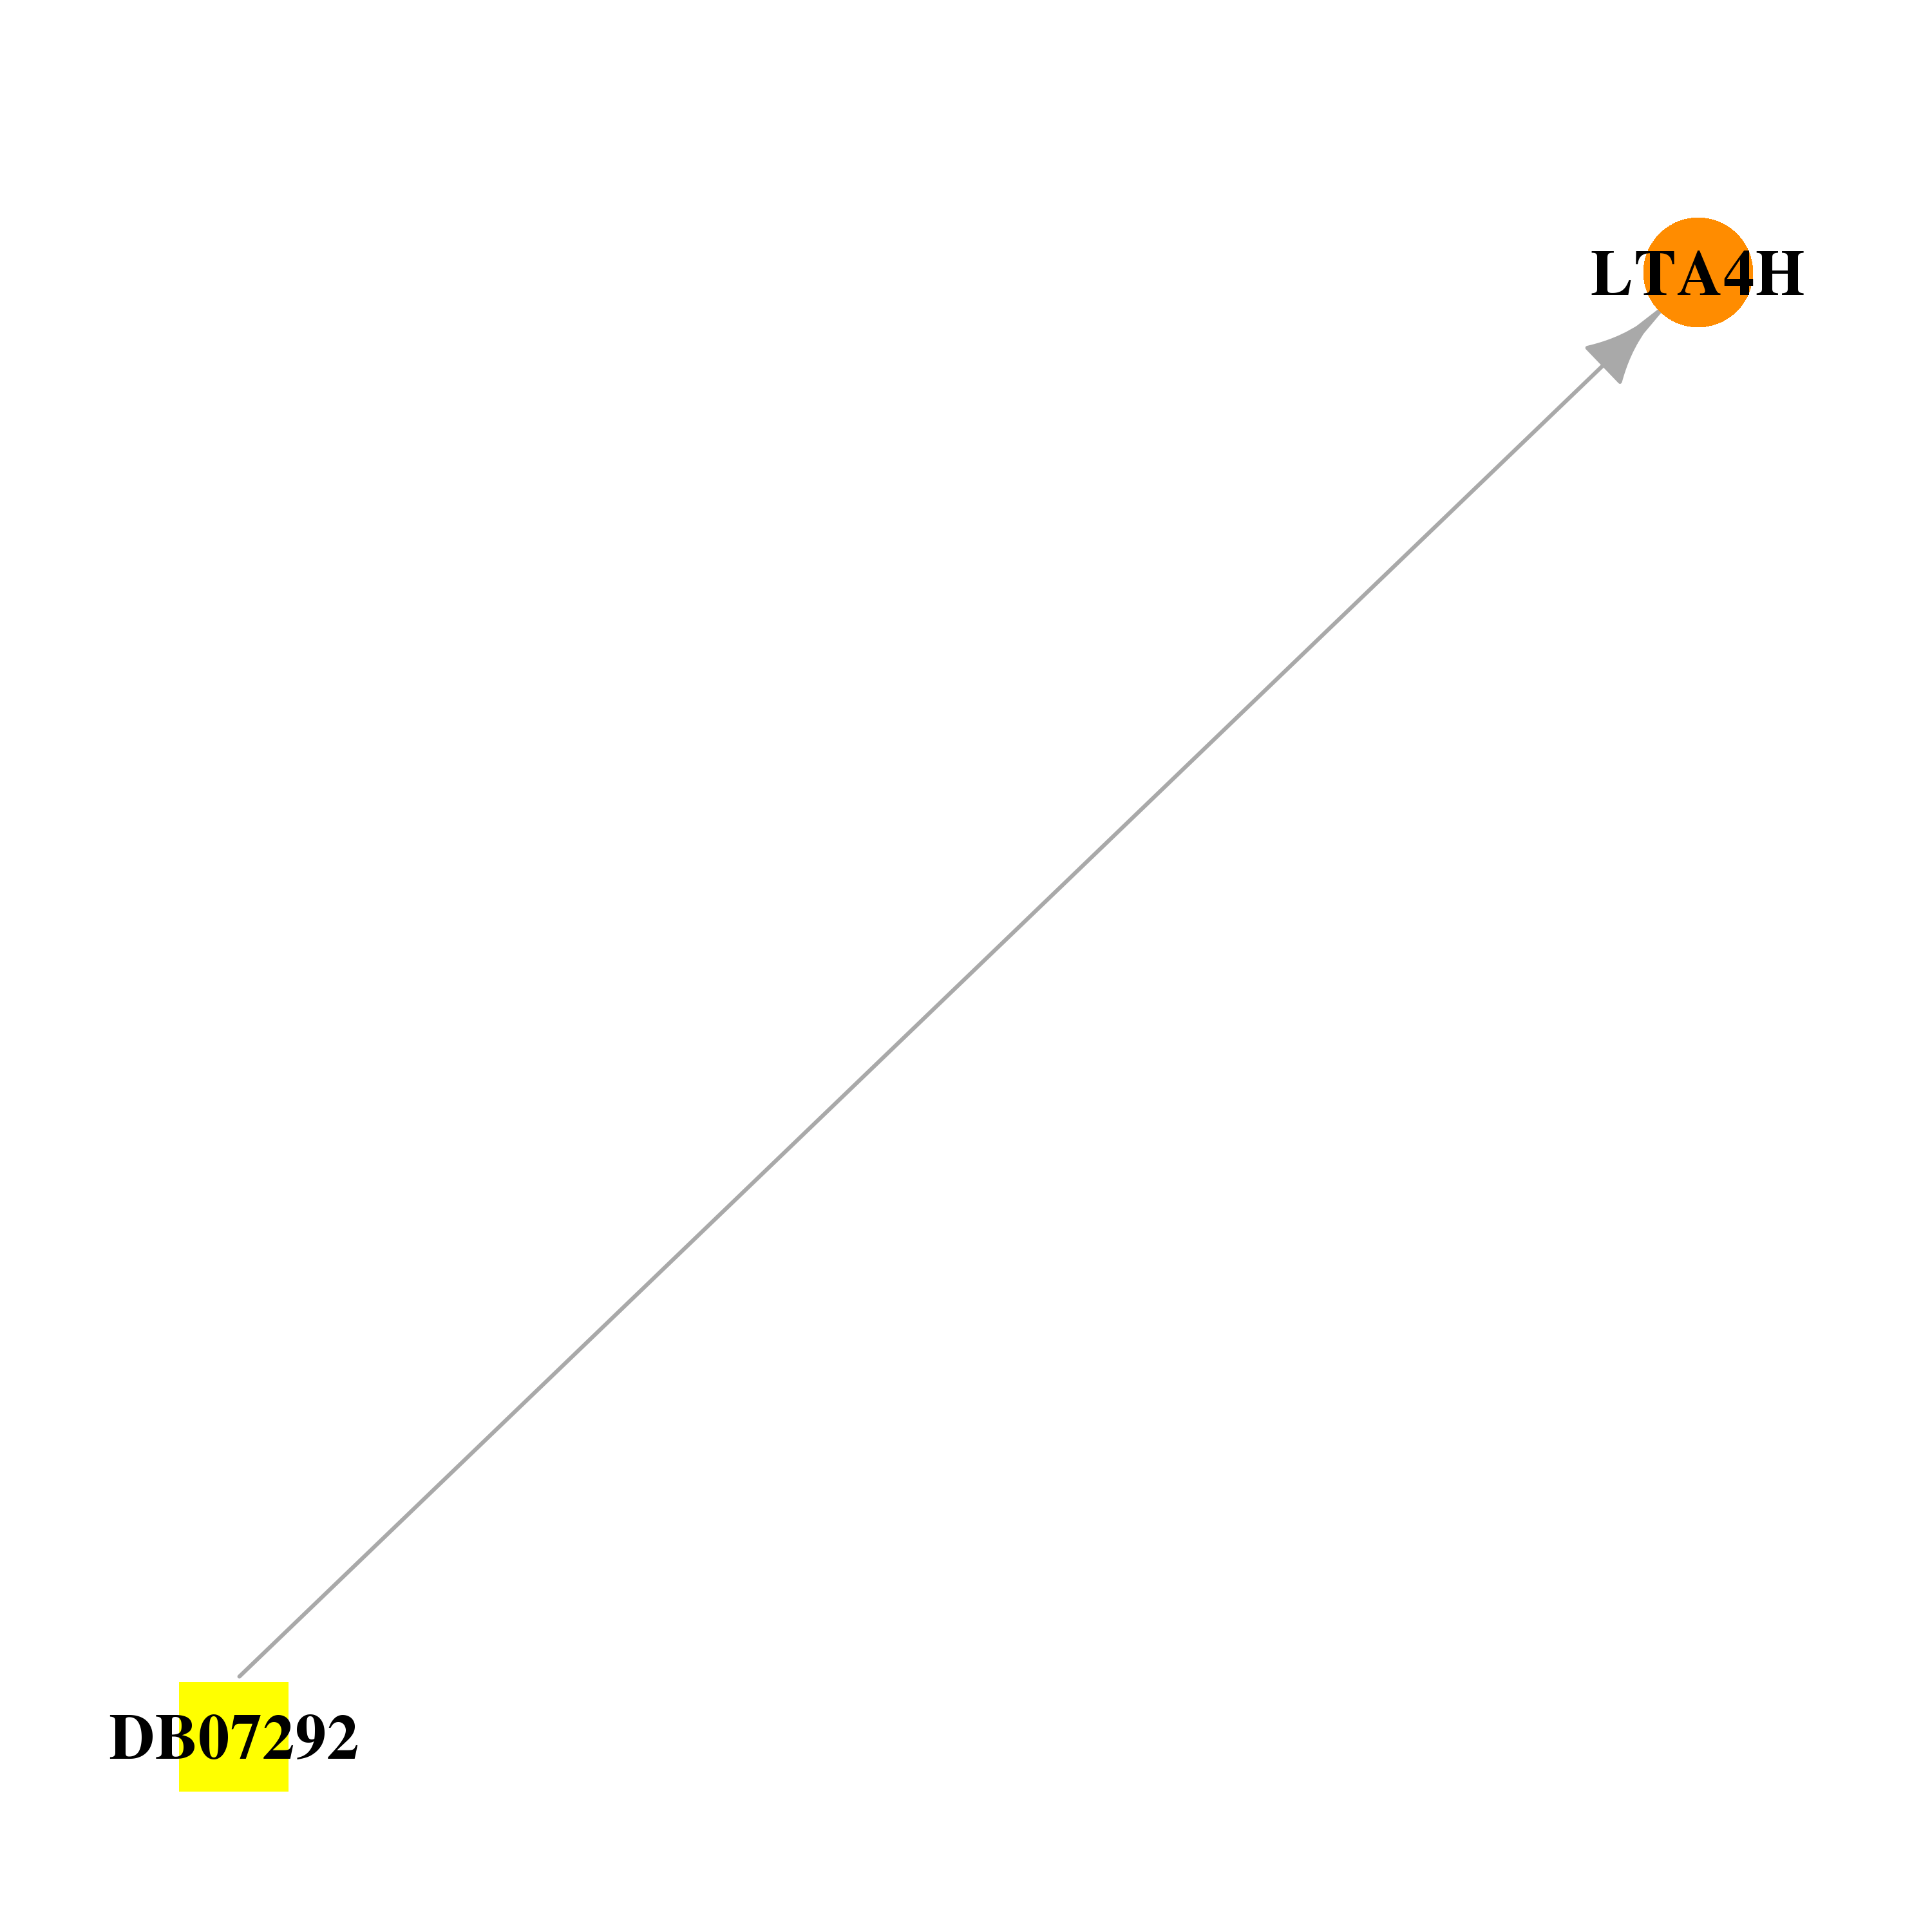 |  |
| DB08040 | leukotriene A4 hydrolase | experimental | N-[(2R)-2-benzyl-4-(hydroxyamino)-4-oxobutanoyl]-L-alanine |  | 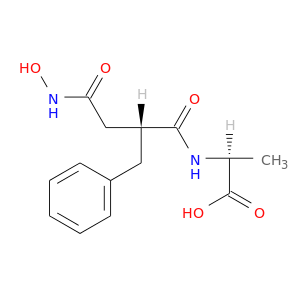 |
| DB08466 | leukotriene A4 hydrolase | experimental | 5-[2-(4-hydroxyphenyl)ethyl]benzene-1,3-diol |  | 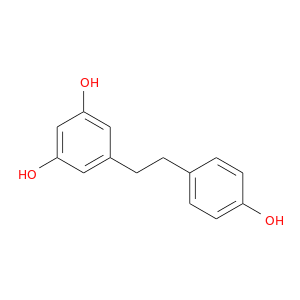 |
| DB00143 | leukotriene A4 hydrolase | approved; nutraceutical | Glutathione |  |  |
| DB00145 | leukotriene A4 hydrolase | approved; nutraceutical | Glycine |  |  |
| DB00471 | leukotriene A4 hydrolase | approved | Montelukast | 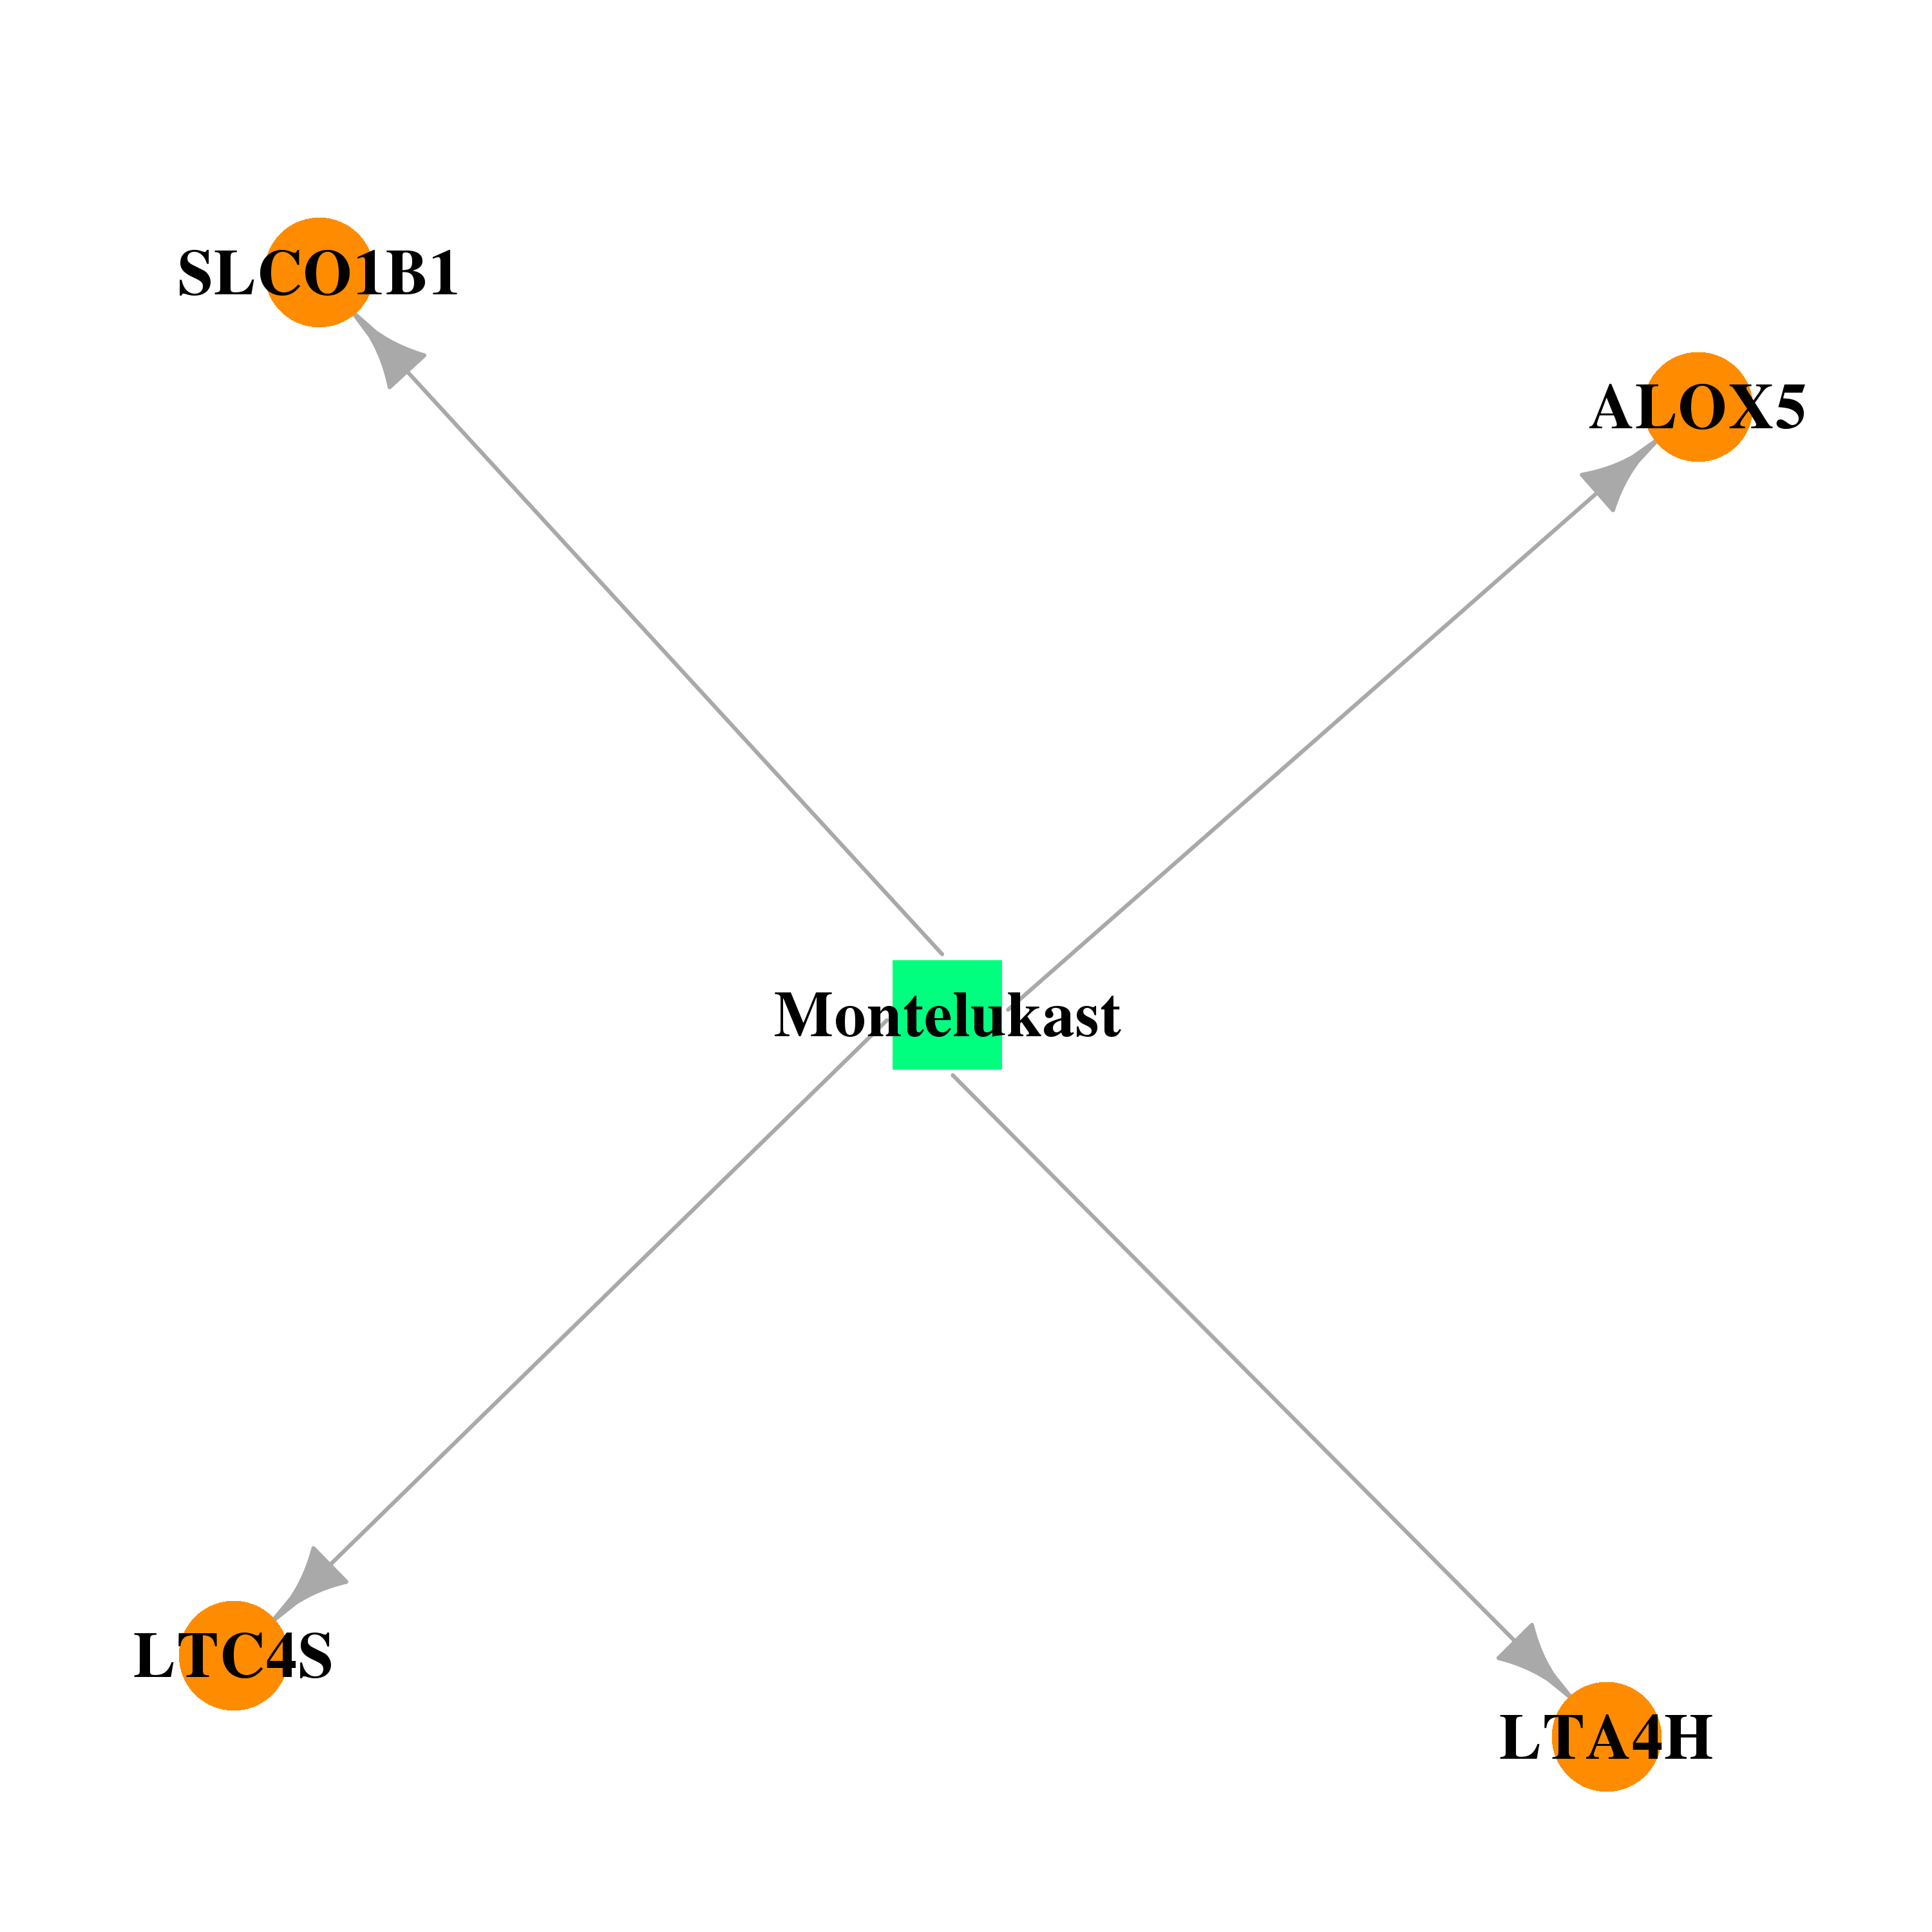 | 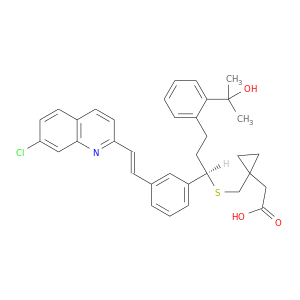 |
| Top |
| Cross referenced IDs for LTA4H |
| * We obtained these cross-references from Uniprot database. It covers 150 different DBs, 18 categories. http://www.uniprot.org/help/cross_references_section |
: Open all cross reference information
|
Copyright © 2016-Present - The Univsersity of Texas Health Science Center at Houston @ |