|
||||||||||||||||||||
| |
| Phenotypic Information (metabolism pathway, cancer, disease, phenome) |
| |
| |
| Gene-Gene Network Information: Co-Expression Network, Interacting Genes & KEGG |
| |
|


| Gene Summary for LTC4S |
| Basic gene info. | Gene symbol | LTC4S |
| Gene name | leukotriene C4 synthase | |
| Synonyms | - | |
| Cytomap | UCSC genome browser: 5q35 | |
| Genomic location | chr5 :179220985-179223513 | |
| Type of gene | protein-coding | |
| RefGenes | NM_145867.1, | |
| Ensembl id | ENSG00000213316 | |
| Description | LTC4 synthase | |
| Modification date | 20141207 | |
| dbXrefs | MIM : 246530 | |
| HGNC : HGNC | ||
| Ensembl : ENSG00000213316 | ||
| HPRD : 02004 | ||
| Vega : OTTHUMG00000150314 | ||
| Protein | UniProt: go to UniProt's Cross Reference DB Table | |
| Expression | CleanEX: HS_LTC4S | |
| BioGPS: 4056 | ||
| Gene Expression Atlas: ENSG00000213316 | ||
| The Human Protein Atlas: ENSG00000213316 | ||
| Pathway | NCI Pathway Interaction Database: LTC4S | |
| KEGG: LTC4S | ||
| REACTOME: LTC4S | ||
| ConsensusPathDB | ||
| Pathway Commons: LTC4S | ||
| Metabolism | MetaCyc: LTC4S | |
| HUMANCyc: LTC4S | ||
| Regulation | Ensembl's Regulation: ENSG00000213316 | |
| miRBase: chr5 :179,220,985-179,223,513 | ||
| TargetScan: NM_145867 | ||
| cisRED: ENSG00000213316 | ||
| Context | iHOP: LTC4S | |
| cancer metabolism search in PubMed: LTC4S | ||
| UCL Cancer Institute: LTC4S | ||
| Assigned class in ccmGDB | C | |
| Top |
| Phenotypic Information for LTC4S(metabolism pathway, cancer, disease, phenome) |
| Cancer | CGAP: LTC4S |
| Familial Cancer Database: LTC4S | |
| * This gene is included in those cancer gene databases. |
|
|
|
|
|
| . | ||||||||||||||
Oncogene 1 | Significant driver gene in | |||||||||||||||||||
| cf) number; DB name 1 Oncogene; http://nar.oxfordjournals.org/content/35/suppl_1/D721.long, 2 Tumor Suppressor gene; https://bioinfo.uth.edu/TSGene/, 3 Cancer Gene Census; http://www.nature.com/nrc/journal/v4/n3/abs/nrc1299.html, 4 CancerGenes; http://nar.oxfordjournals.org/content/35/suppl_1/D721.long, 5 Network of Cancer Gene; http://ncg.kcl.ac.uk/index.php, 1Therapeutic Vulnerabilities in Cancer; http://cbio.mskcc.org/cancergenomics/statius/ |
| KEGG_ARACHIDONIC_ACID_METABOLISM | |
| OMIM | |
| Orphanet | |
| Disease | KEGG Disease: LTC4S |
| MedGen: LTC4S (Human Medical Genetics with Condition) | |
| ClinVar: LTC4S | |
| Phenotype | MGI: LTC4S (International Mouse Phenotyping Consortium) |
| PhenomicDB: LTC4S | |
| Mutations for LTC4S |
| * Under tables are showing count per each tissue to give us broad intuition about tissue specific mutation patterns.You can go to the detailed page for each mutation database's web site. |
| There's no structural variation information in COSMIC data for this gene. |
| * From mRNA Sanger sequences, Chitars2.0 arranged chimeric transcripts. This table shows LTC4S related fusion information. |
| ID | Head Gene | Tail Gene | Accession | Gene_a | qStart_a | qEnd_a | Chromosome_a | tStart_a | tEnd_a | Gene_a | qStart_a | qEnd_a | Chromosome_a | tStart_a | tEnd_a |
| Top |
| There's no copy number variation information in COSMIC data for this gene. |
| Top |
|
 |
| Top |
| Stat. for Non-Synonymous SNVs (# total SNVs=0) | (# total SNVs=1) |
 | |
(# total SNVs=0) | (# total SNVs=0) |
| Top |
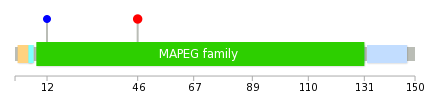
| * When you move the cursor on each content, you can see more deailed mutation information on the Tooltip. Those are primary_site,primary_histology,mutation(aa),pubmedID. |
| GRCh37 position | Mutation(aa) | Unique sampleID count |
| chr5:179222664-179222664 | p.F46L | 2 |
| chr5:179221117-179221117 | p.T12T | 1 |
| chr5:179222575-179222575 | p.? | 1 |
| Top |
|
 |
| Point Mutation/ Tissue ID | 1 | 2 | 3 | 4 | 5 | 6 | 7 | 8 | 9 | 10 | 11 | 12 | 13 | 14 | 15 | 16 | 17 | 18 | 19 | 20 |
| # sample | 1 | |||||||||||||||||||
| # mutation | 1 | |||||||||||||||||||
| nonsynonymous SNV | ||||||||||||||||||||
| synonymous SNV | 1 |
| cf) Tissue ID; Tissue type (1; BLCA[Bladder Urothelial Carcinoma], 2; BRCA[Breast invasive carcinoma], 3; CESC[Cervical squamous cell carcinoma and endocervical adenocarcinoma], 4; COAD[Colon adenocarcinoma], 5; GBM[Glioblastoma multiforme], 6; Glioma Low Grade, 7; HNSC[Head and Neck squamous cell carcinoma], 8; KICH[Kidney Chromophobe], 9; KIRC[Kidney renal clear cell carcinoma], 10; KIRP[Kidney renal papillary cell carcinoma], 11; LAML[Acute Myeloid Leukemia], 12; LUAD[Lung adenocarcinoma], 13; LUSC[Lung squamous cell carcinoma], 14; OV[Ovarian serous cystadenocarcinoma ], 15; PAAD[Pancreatic adenocarcinoma], 16; PRAD[Prostate adenocarcinoma], 17; SKCM[Skin Cutaneous Melanoma], 18:STAD[Stomach adenocarcinoma], 19:THCA[Thyroid carcinoma], 20:UCEC[Uterine Corpus Endometrial Carcinoma]) |
| Top |
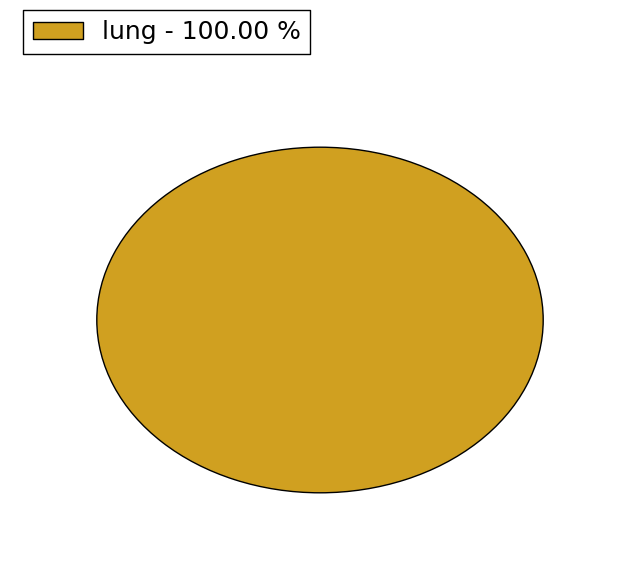
| * We represented just top 10 SNVs. When you move the cursor on each content, you can see more deailed mutation information on the Tooltip. Those are primary_site, primary_histology, mutation(aa), pubmedID. |
| Genomic Position | Mutation(aa) | Unique sampleID count |
| chr5:179221117 | p.T12T | 1 |
| * Copy number data were extracted from TCGA using R package TCGA-Assembler. The URLs of all public data files on TCGA DCC data server were gathered on Jan-05-2015. Function ProcessCNAData in TCGA-Assembler package was used to obtain gene-level copy number value which is calculated as the average copy number of the genomic region of a gene. |
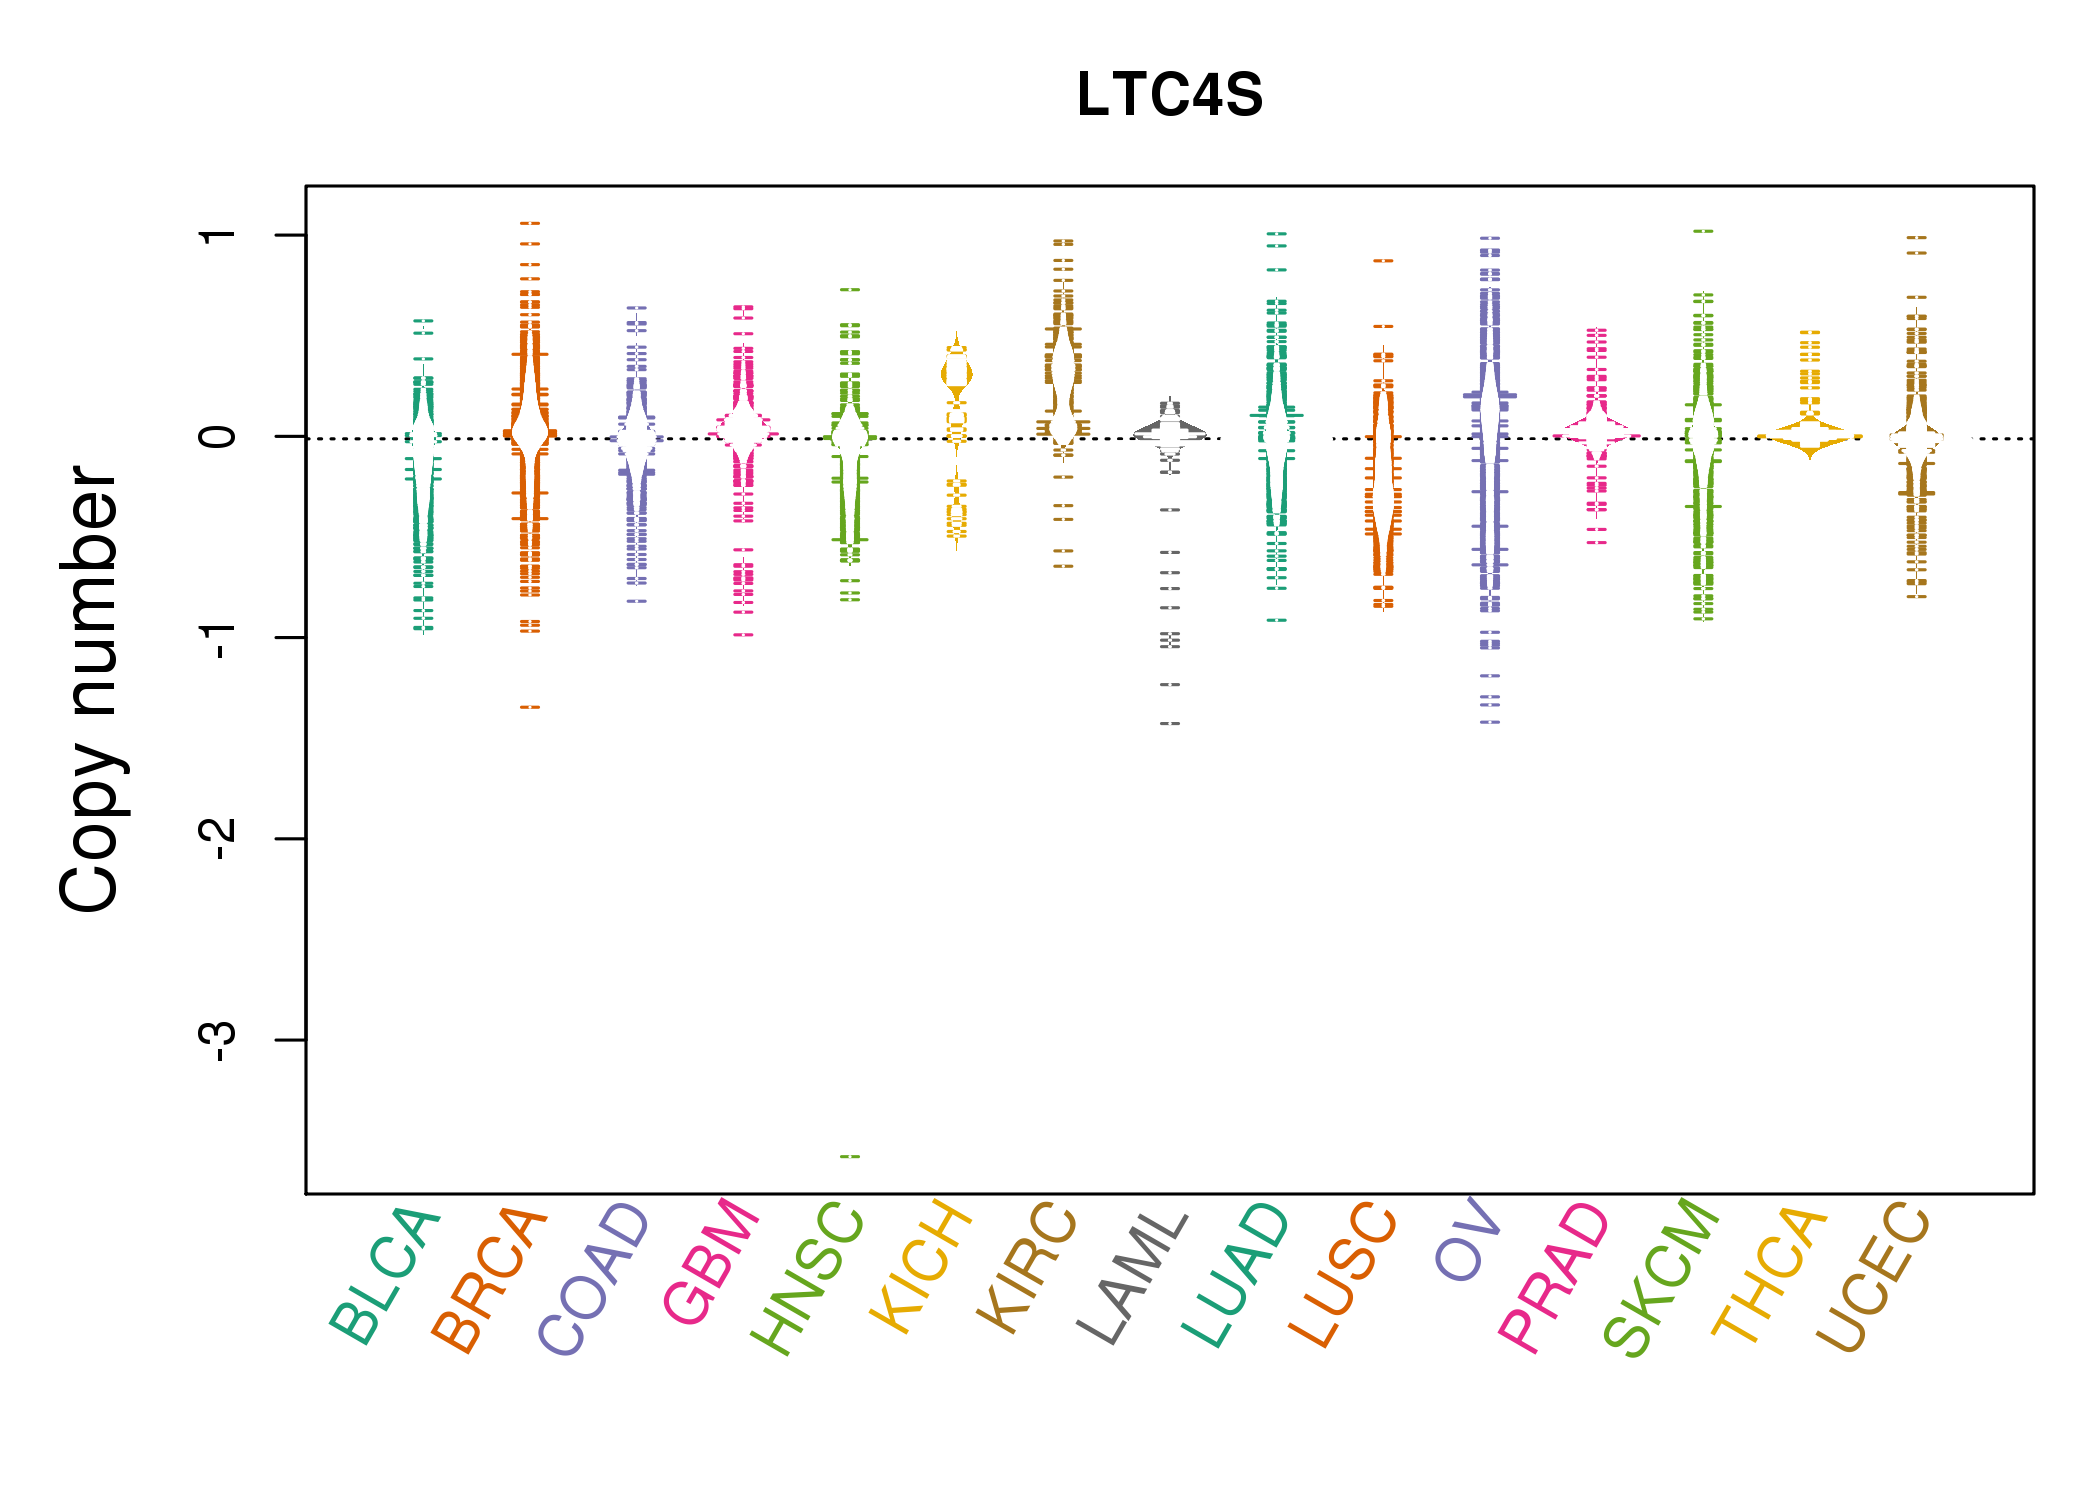 |
| cf) Tissue ID[Tissue type]: BLCA[Bladder Urothelial Carcinoma], BRCA[Breast invasive carcinoma], CESC[Cervical squamous cell carcinoma and endocervical adenocarcinoma], COAD[Colon adenocarcinoma], GBM[Glioblastoma multiforme], Glioma Low Grade, HNSC[Head and Neck squamous cell carcinoma], KICH[Kidney Chromophobe], KIRC[Kidney renal clear cell carcinoma], KIRP[Kidney renal papillary cell carcinoma], LAML[Acute Myeloid Leukemia], LUAD[Lung adenocarcinoma], LUSC[Lung squamous cell carcinoma], OV[Ovarian serous cystadenocarcinoma ], PAAD[Pancreatic adenocarcinoma], PRAD[Prostate adenocarcinoma], SKCM[Skin Cutaneous Melanoma], STAD[Stomach adenocarcinoma], THCA[Thyroid carcinoma], UCEC[Uterine Corpus Endometrial Carcinoma] |
| Top |
| Gene Expression for LTC4S |
| * CCLE gene expression data were extracted from CCLE_Expression_Entrez_2012-10-18.res: Gene-centric RMA-normalized mRNA expression data. |
 |
| * Normalized gene expression data of RNASeqV2 was extracted from TCGA using R package TCGA-Assembler. The URLs of all public data files on TCGA DCC data server were gathered at Jan-05-2015. Only eight cancer types have enough normal control samples for differential expression analysis. (t test, adjusted p<0.05 (using Benjamini-Hochberg FDR)) |
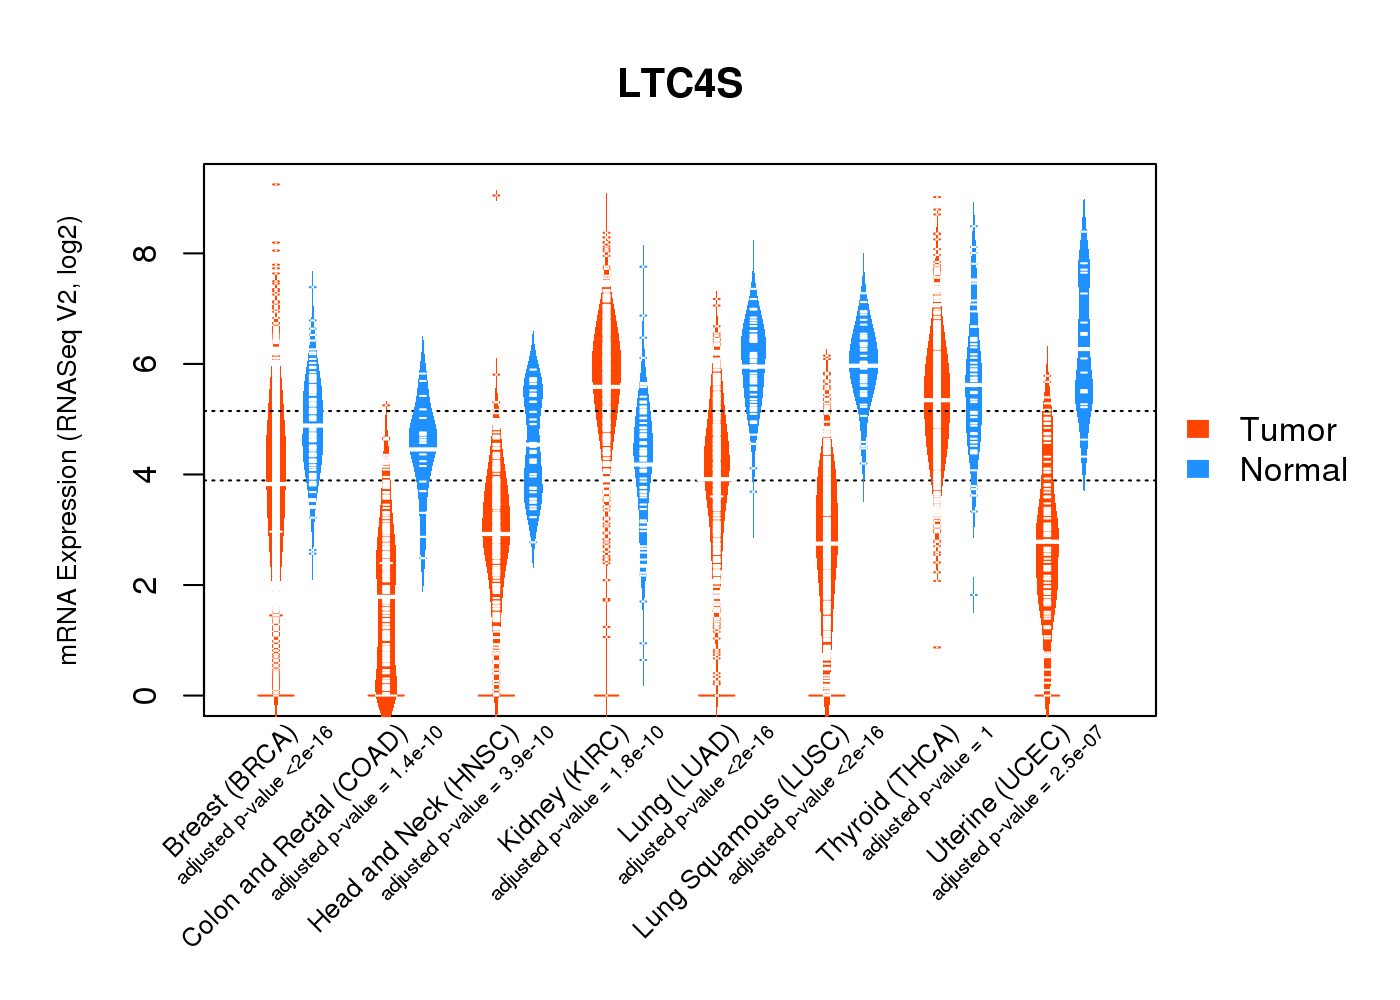 |
| Top |
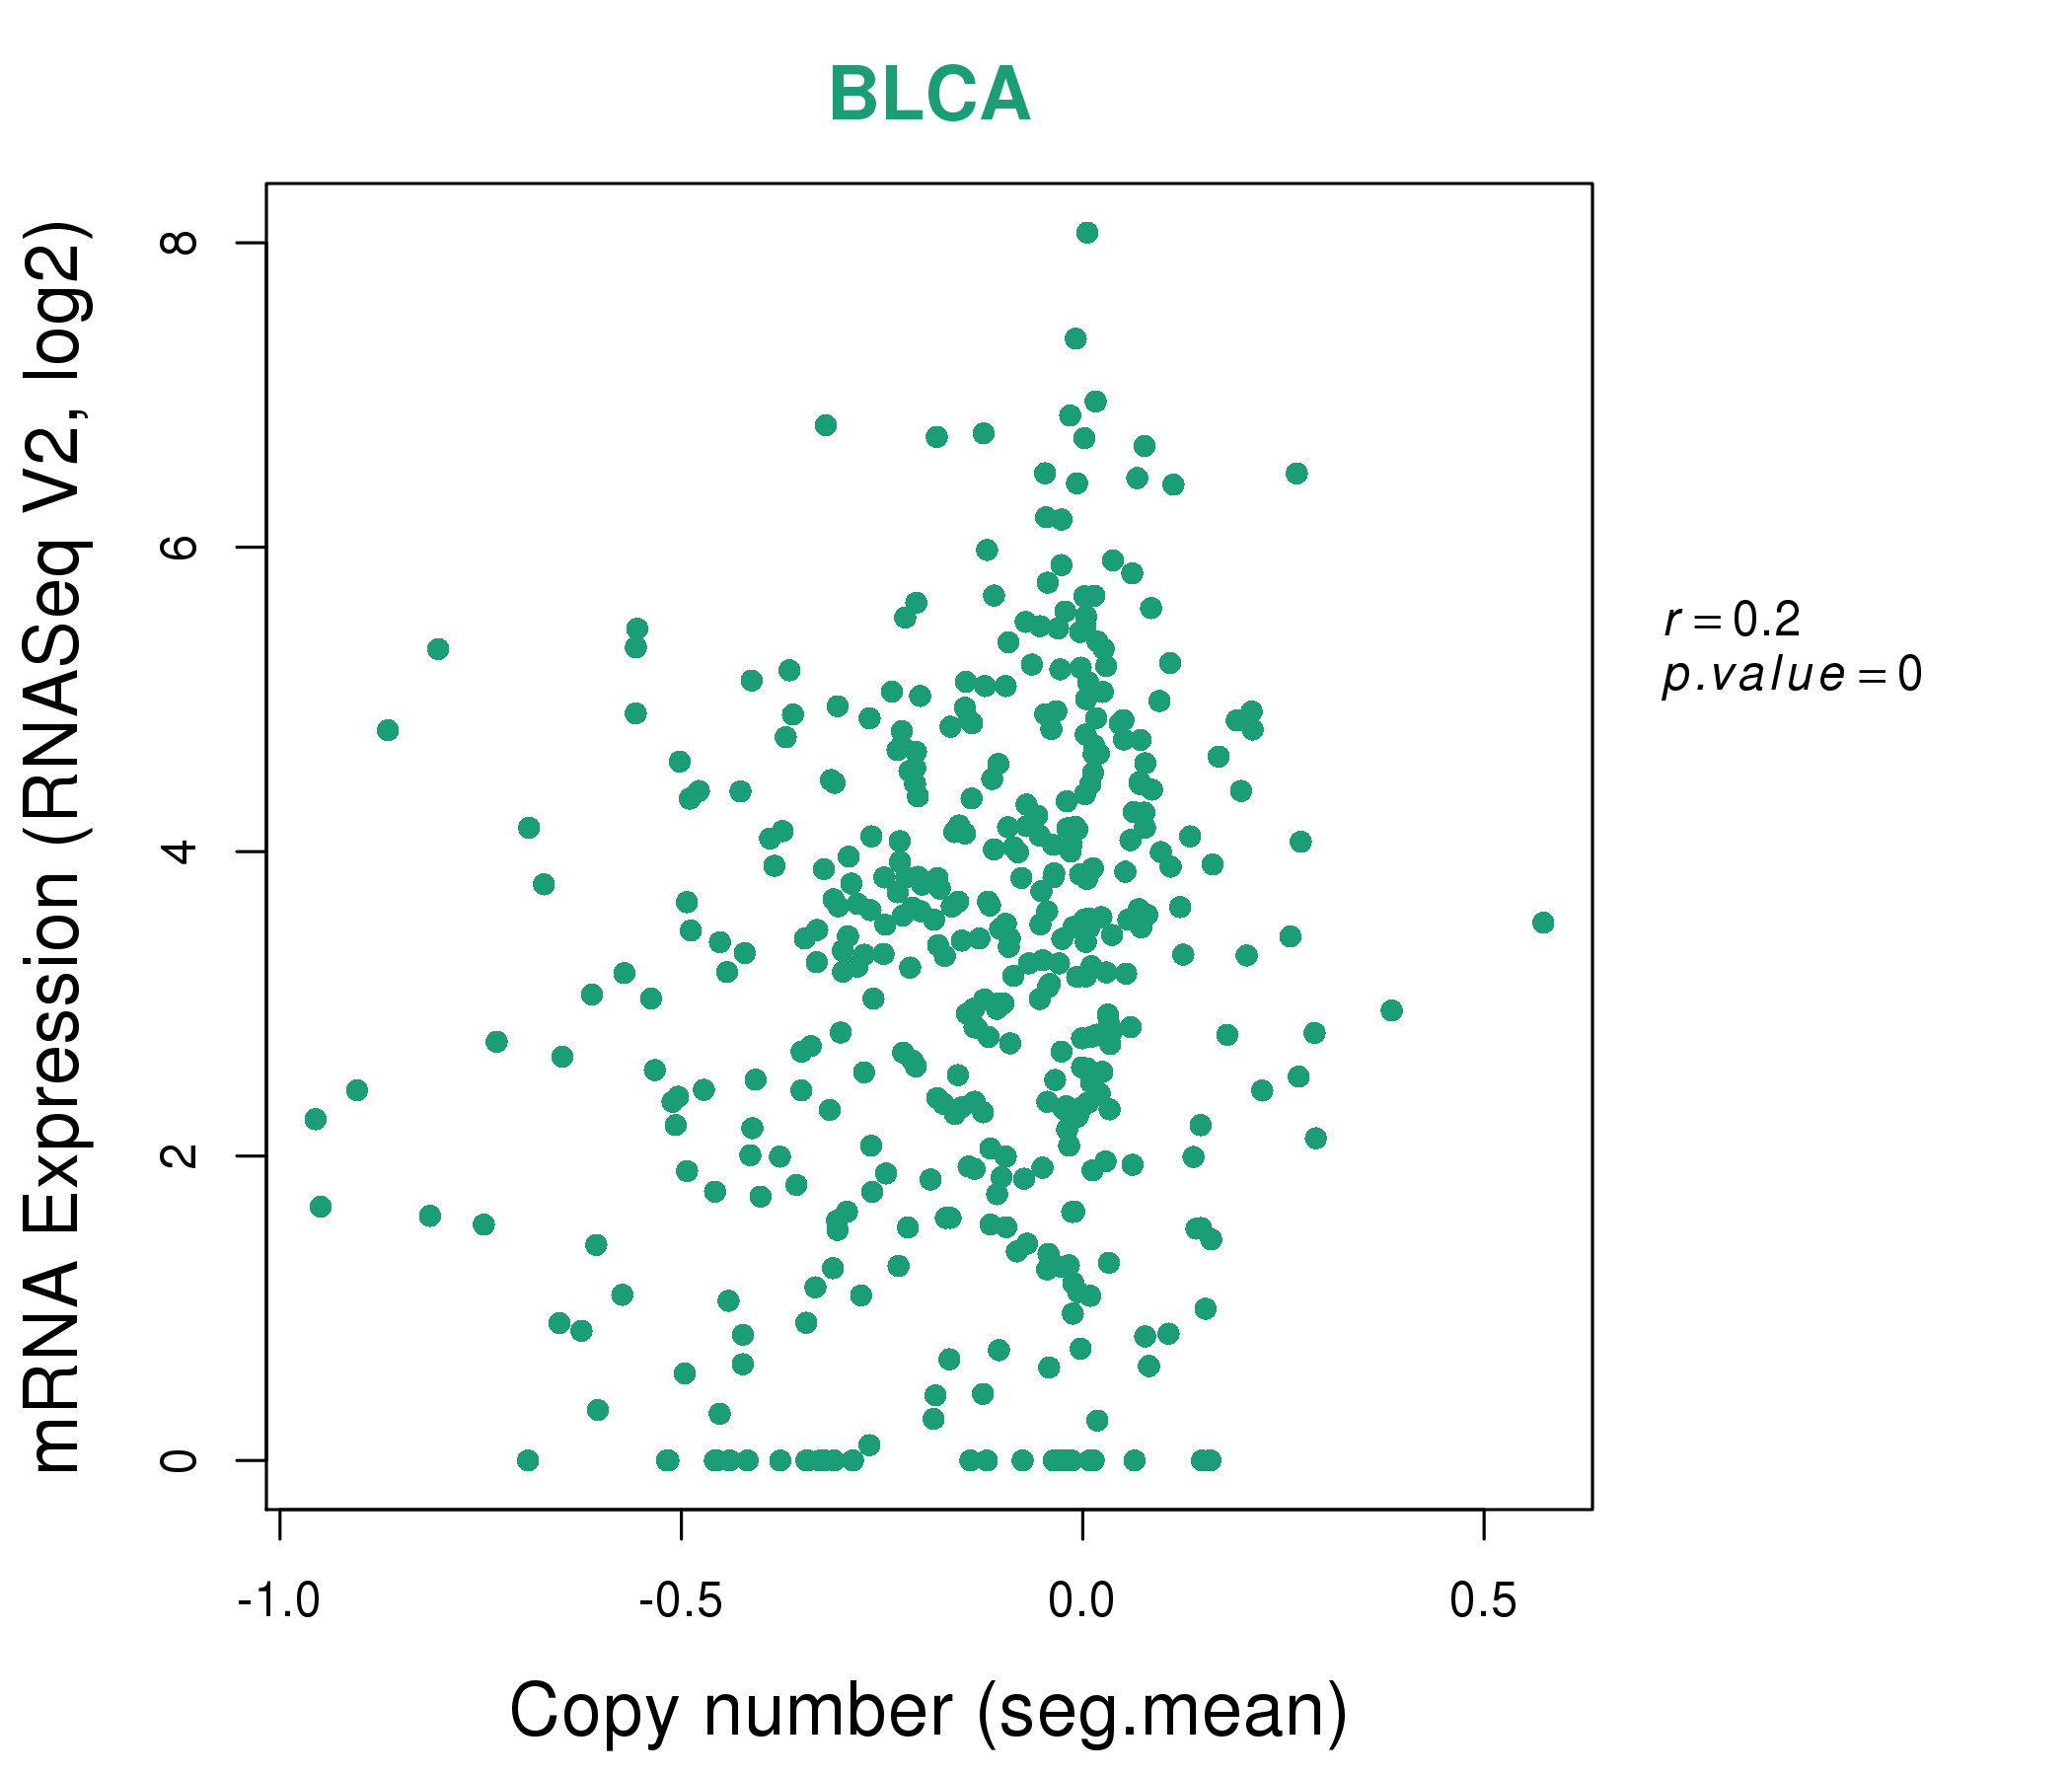
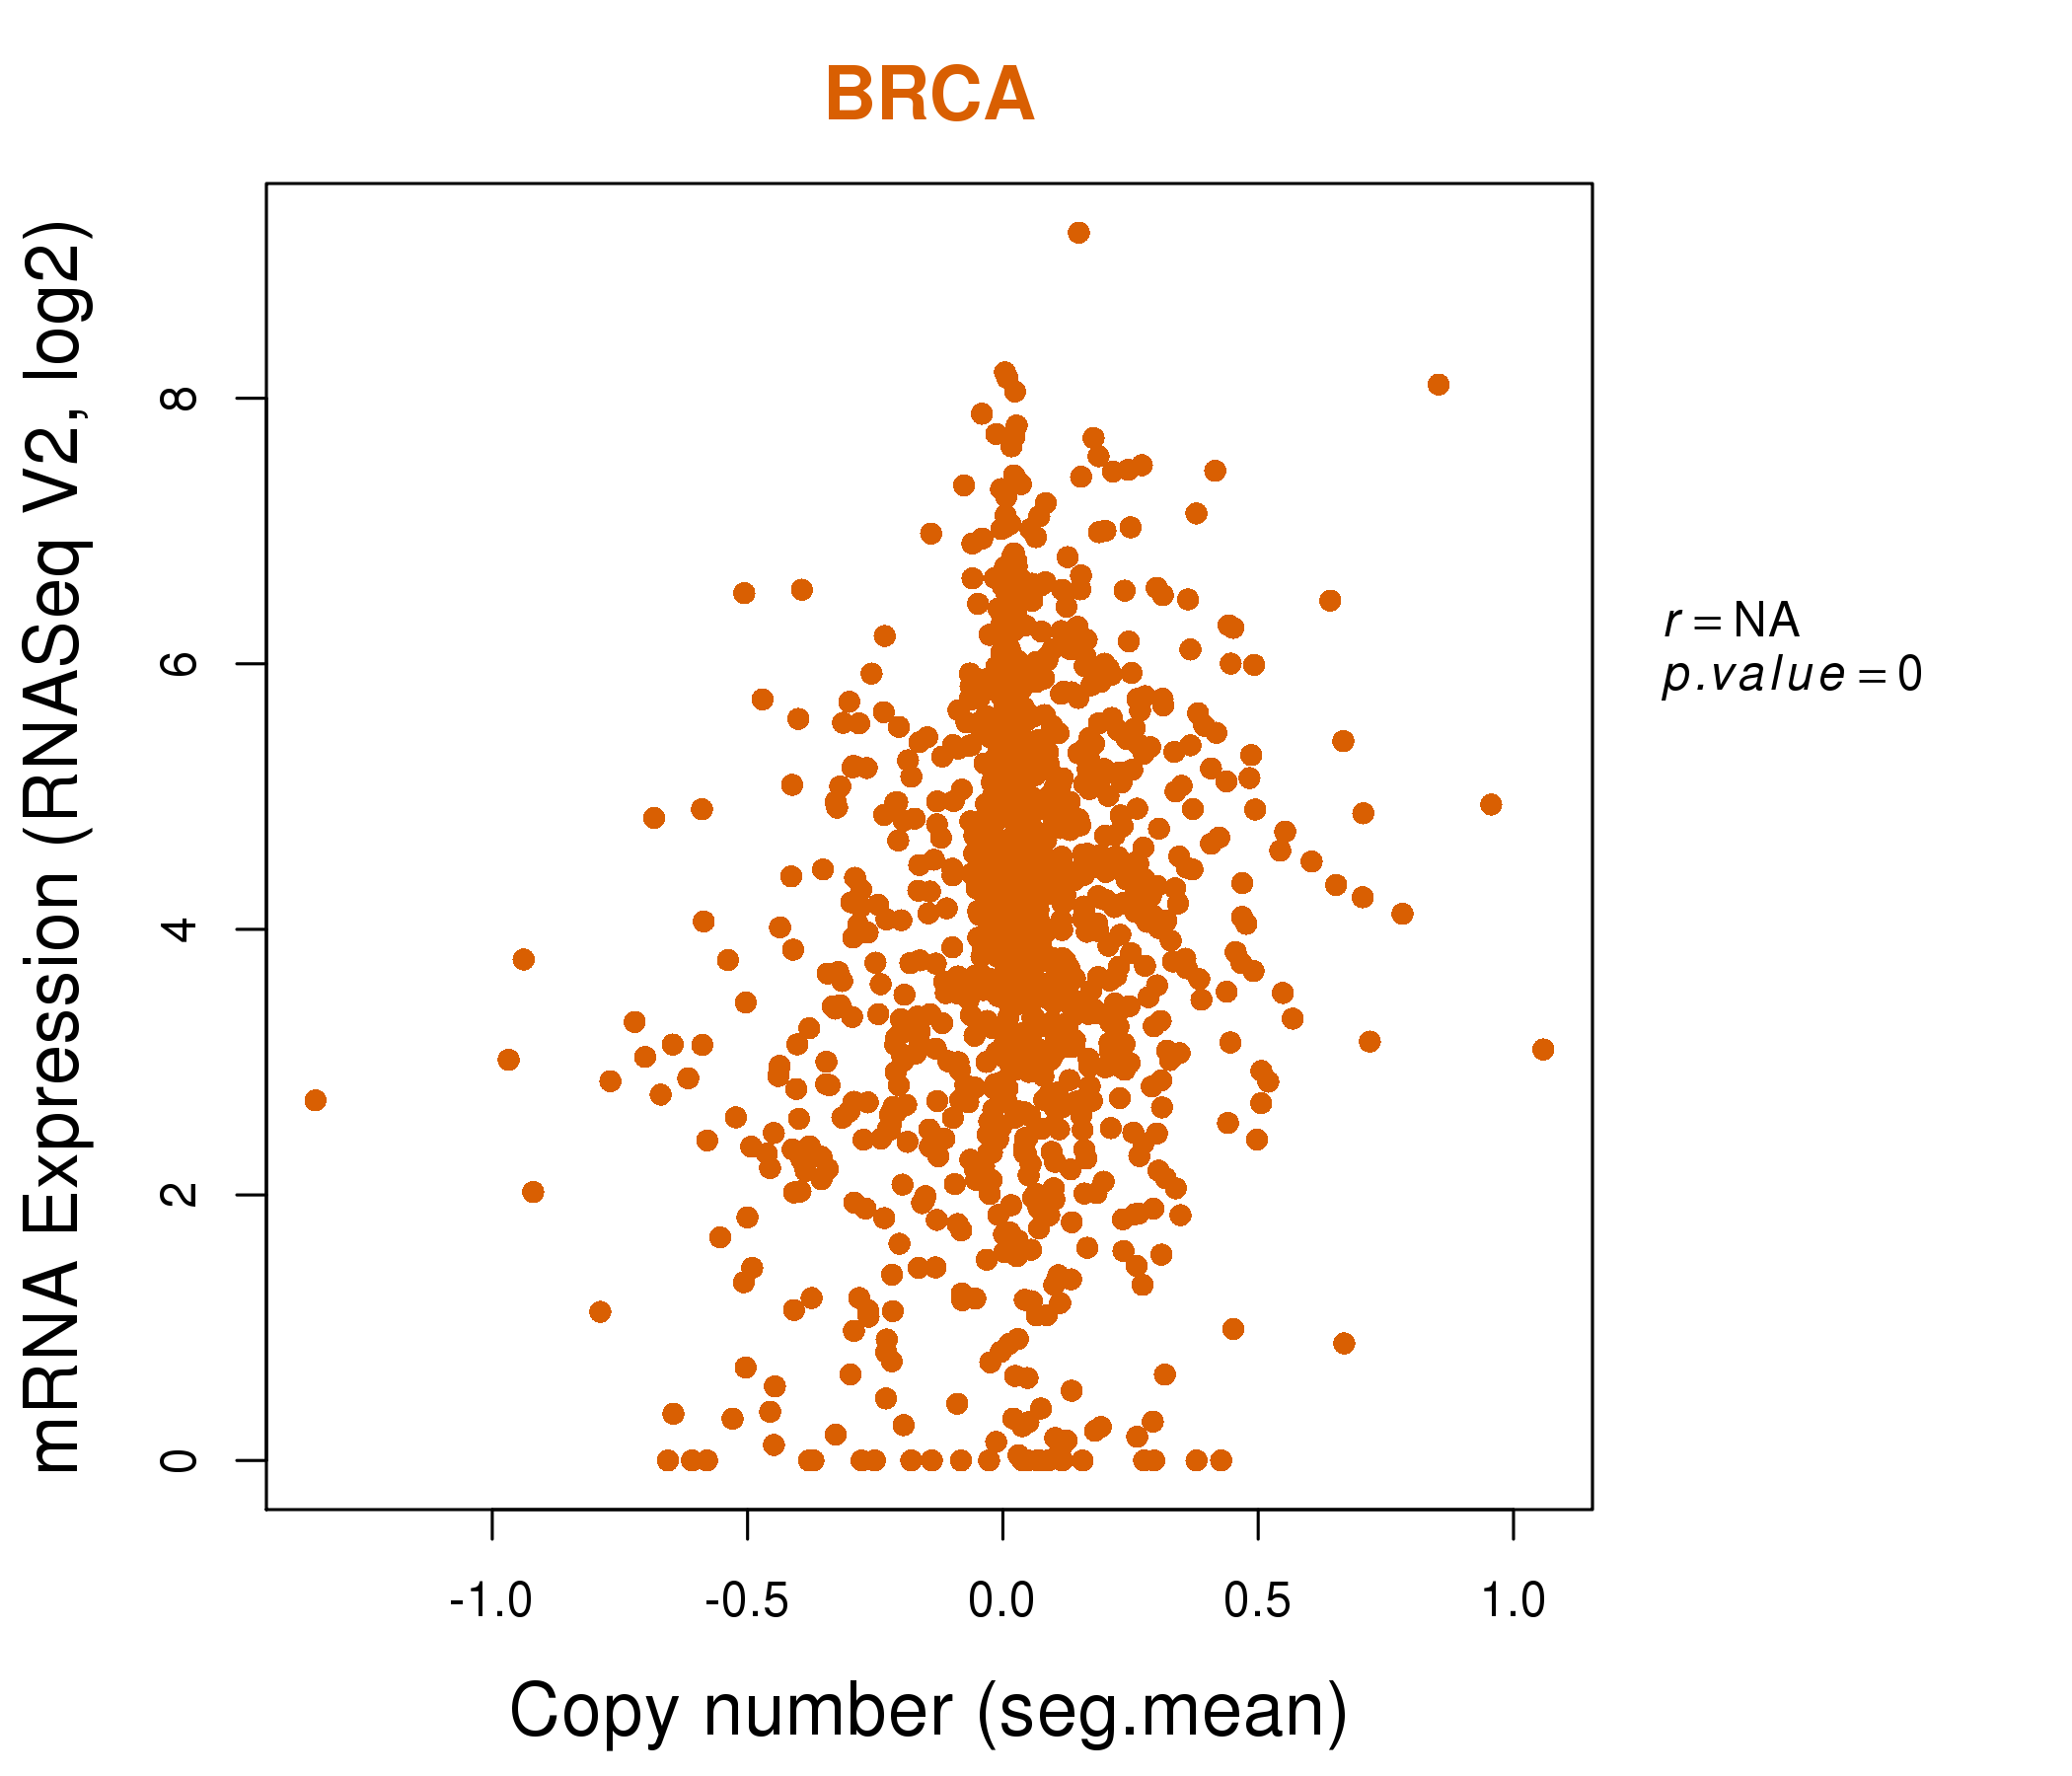
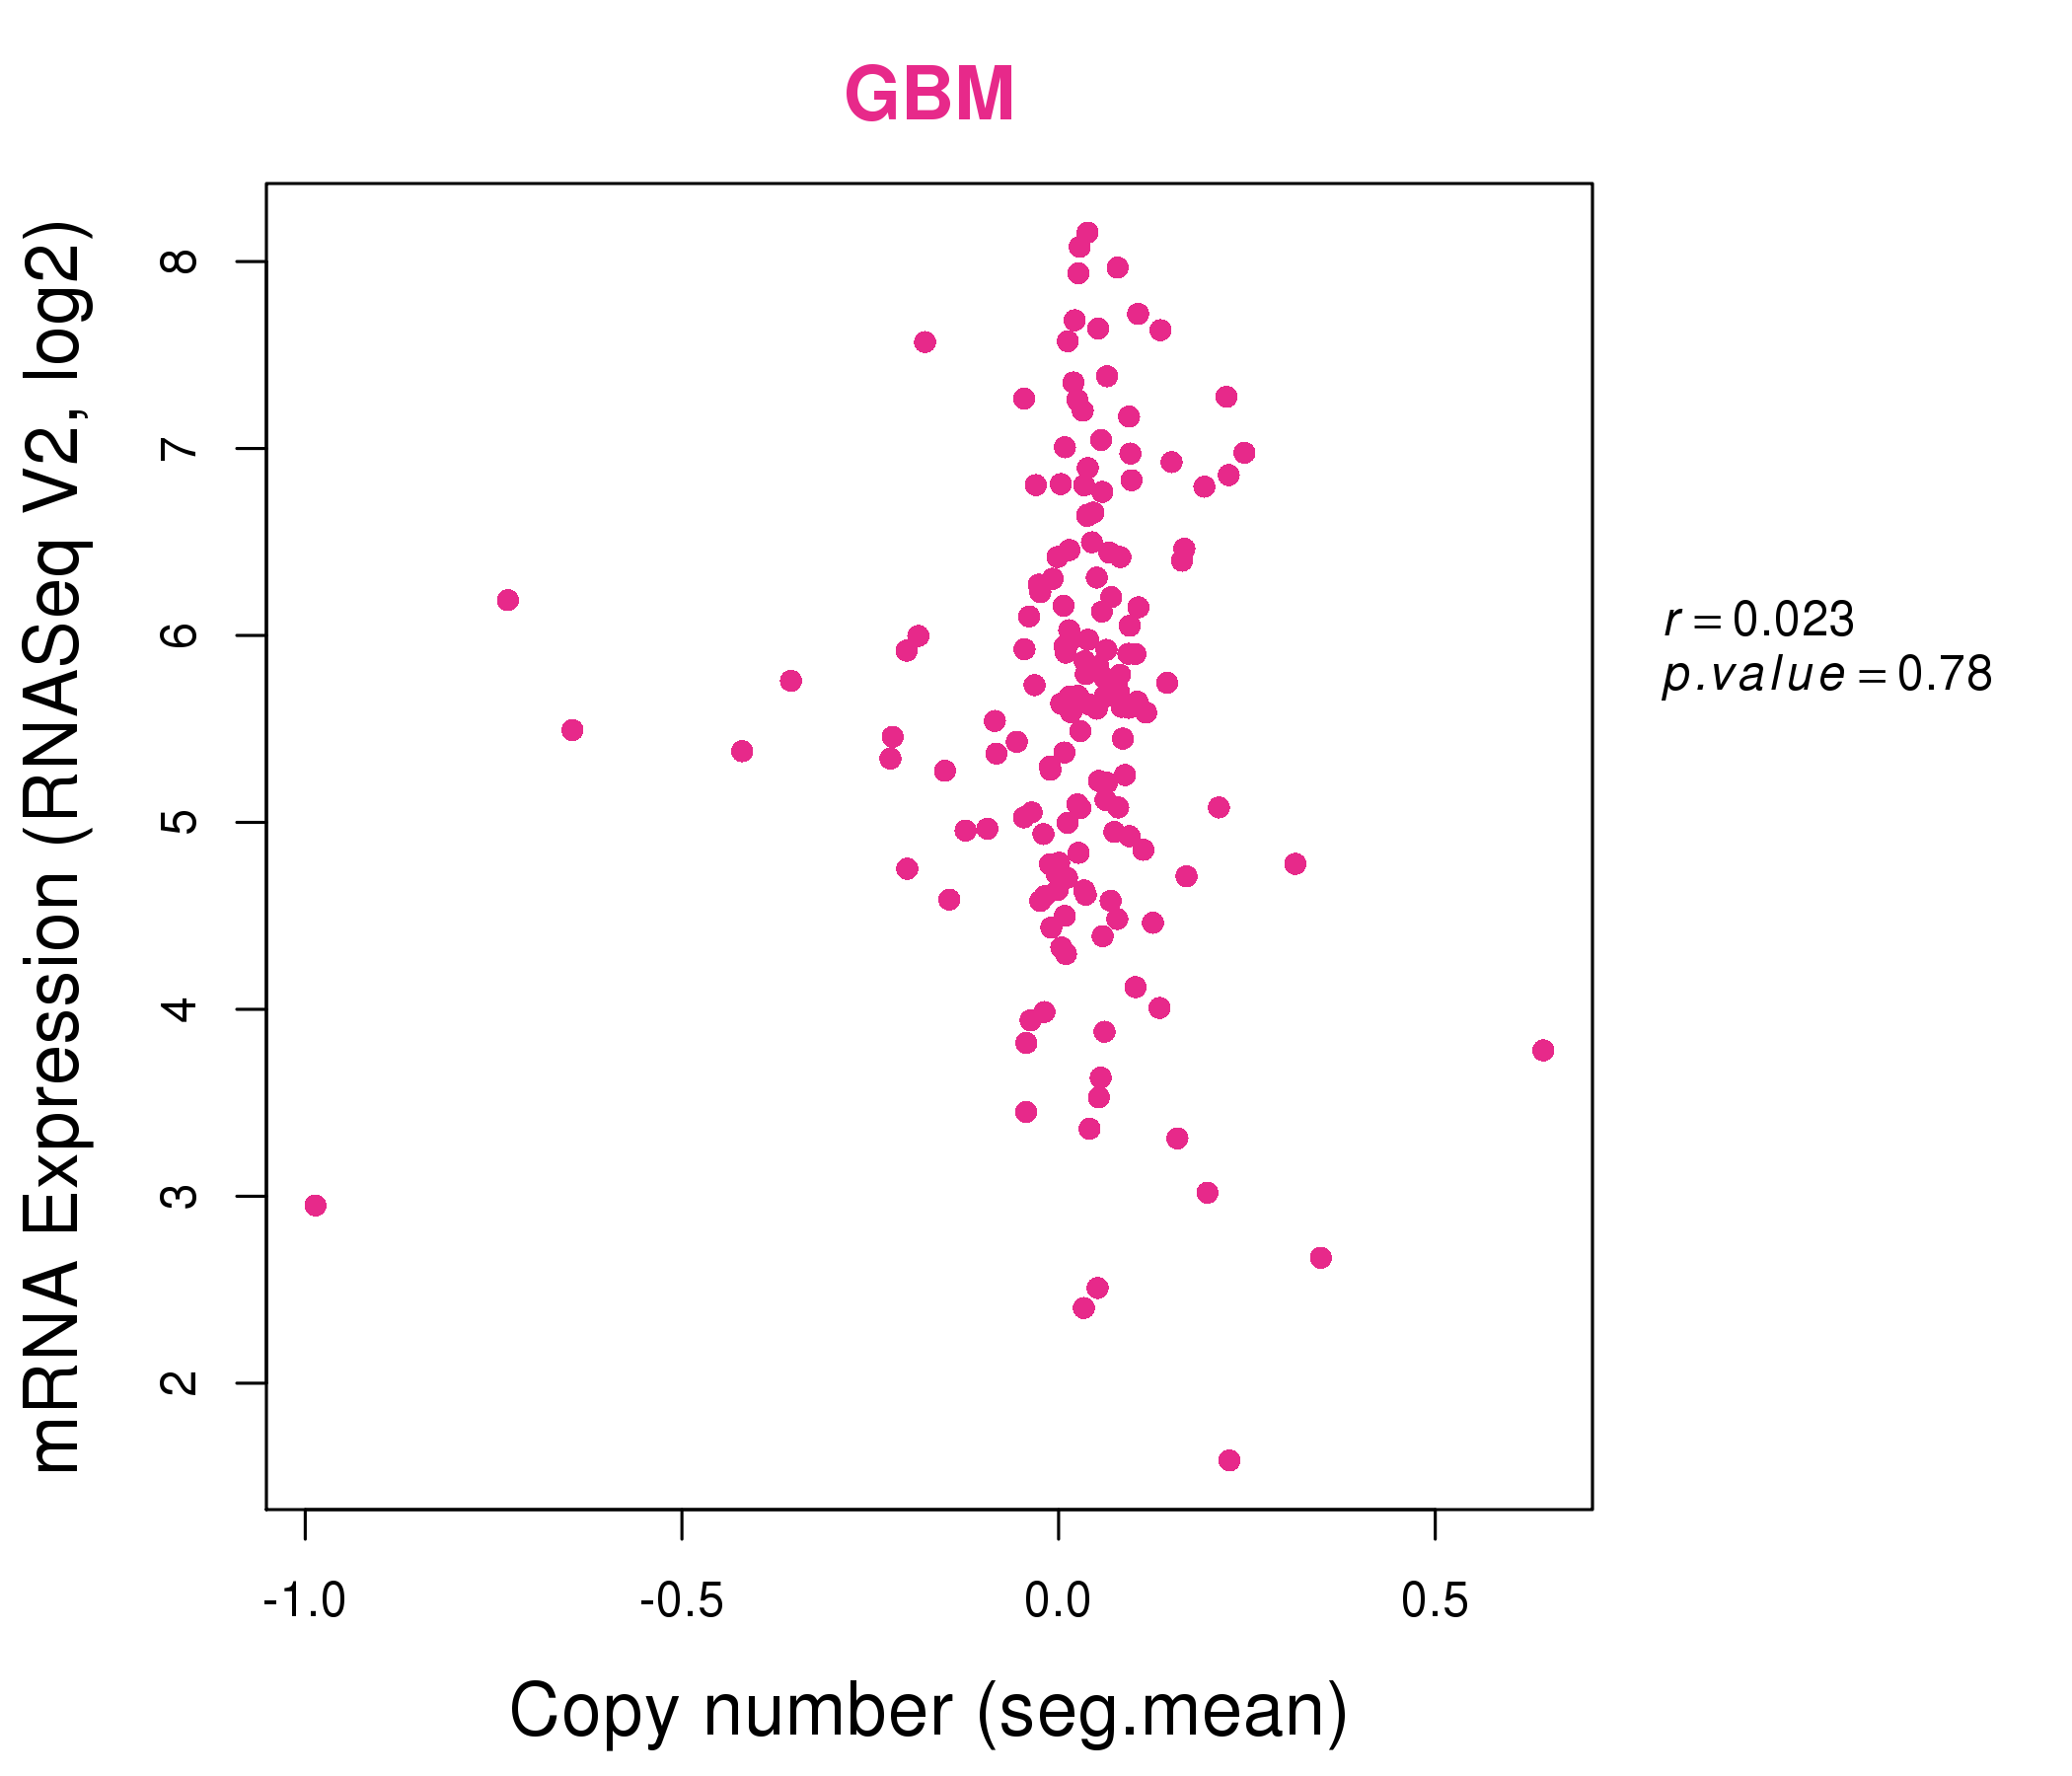
| * This plots show the correlation between CNV and gene expression. |
: Open all plots for all cancer types
 |
|
 |
|
| Top |
| Gene-Gene Network Information |
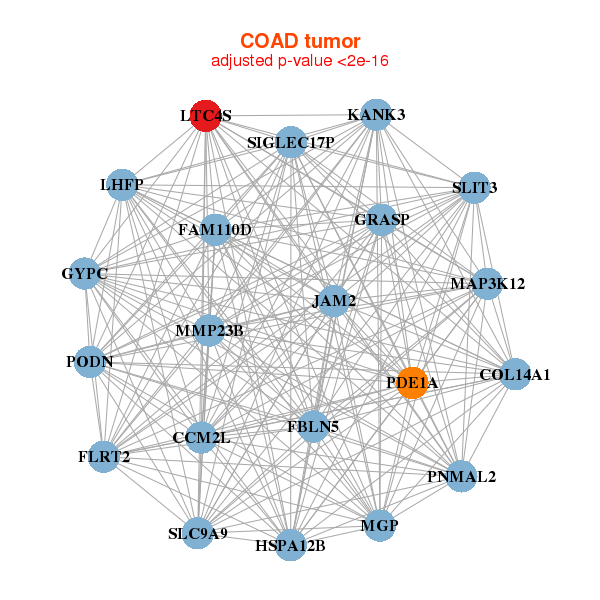
| * Co-Expression network figures were drawn using R package igraph. Only the top 20 genes with the highest correlations were shown. Red circle: input gene, orange circle: cell metabolism gene, sky circle: other gene |
: Open all plots for all cancer types
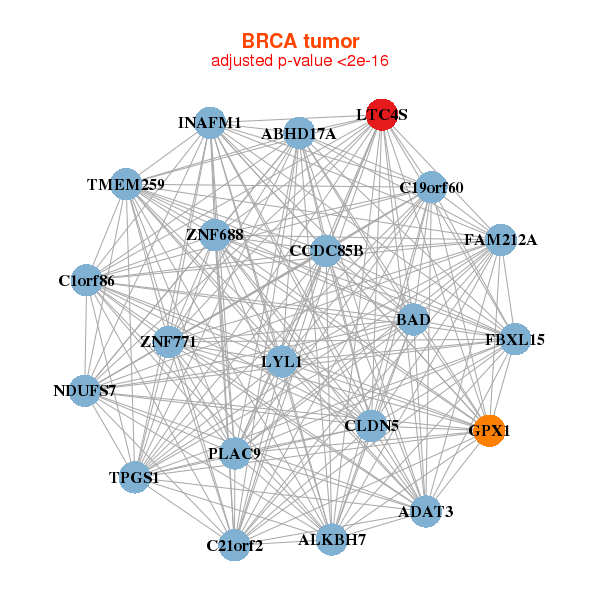 |
| ||||
| ADAT3,ALKBH7,BAD,TPGS1,C19orf60,TMEM259,C1orf86, C21orf2,FAM212A,CCDC85B,CLDN5,ABHD17A,FBXL15,GPX1, LTC4S,LYL1,NDUFS7,PLAC9,INAFM1,ZNF688,ZNF771 | BAD,C1orf122,C6orf226,CCDC85B,CHST12,CRIP2,DUSP23, ABHD17A,FAM195B,FBXL15,IFI27L2,JOSD2,LTC4S,PRKCDBP, RABAC1,RHOG,SELM,SLC10A3,SSBP4,TAX1BP3,VKORC1 | ||||
 |
| ||||
| CCM2L,COL14A1,FBLN5,FLRT2,GRASP,FAM110D,GYPC, HSPA12B,JAM2,KANK3,LHFP,LTC4S,MAP3K12,MGP, MMP23B,PDE1A,PNMAL2,PODN,SIGLEC17P,SLC9A9,SLIT3 | APBA3,C1orf35,DNAJC4,DPP7,EVA1B,FBXL16,HAGHL, HIST3H2A,HMG20B,INO80B,LRRC26,LTC4S,MOSPD3,LINC00092, NME3,PRICKLE3,LEPREL4,STK25,TP53I13,TPSAB1,USF2 |
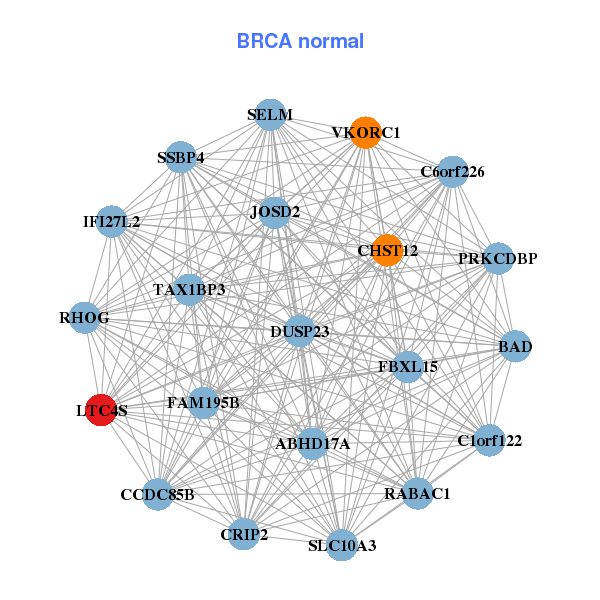
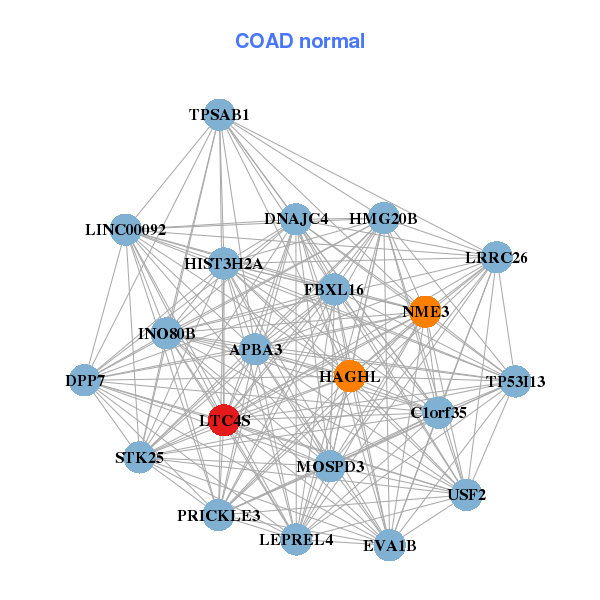
| * Co-Expression network figures were drawn using R package igraph. Only the top 20 genes with the highest correlations were shown. Red circle: input gene, orange circle: cell metabolism gene, sky circle: other gene |
: Open all plots for all cancer types
| Top |
: Open all interacting genes' information including KEGG pathway for all interacting genes from DAVID
| Top |
| Pharmacological Information for LTC4S |
| DB Category | DB Name | DB's ID and Url link |
| * Gene Centered Interaction Network. |
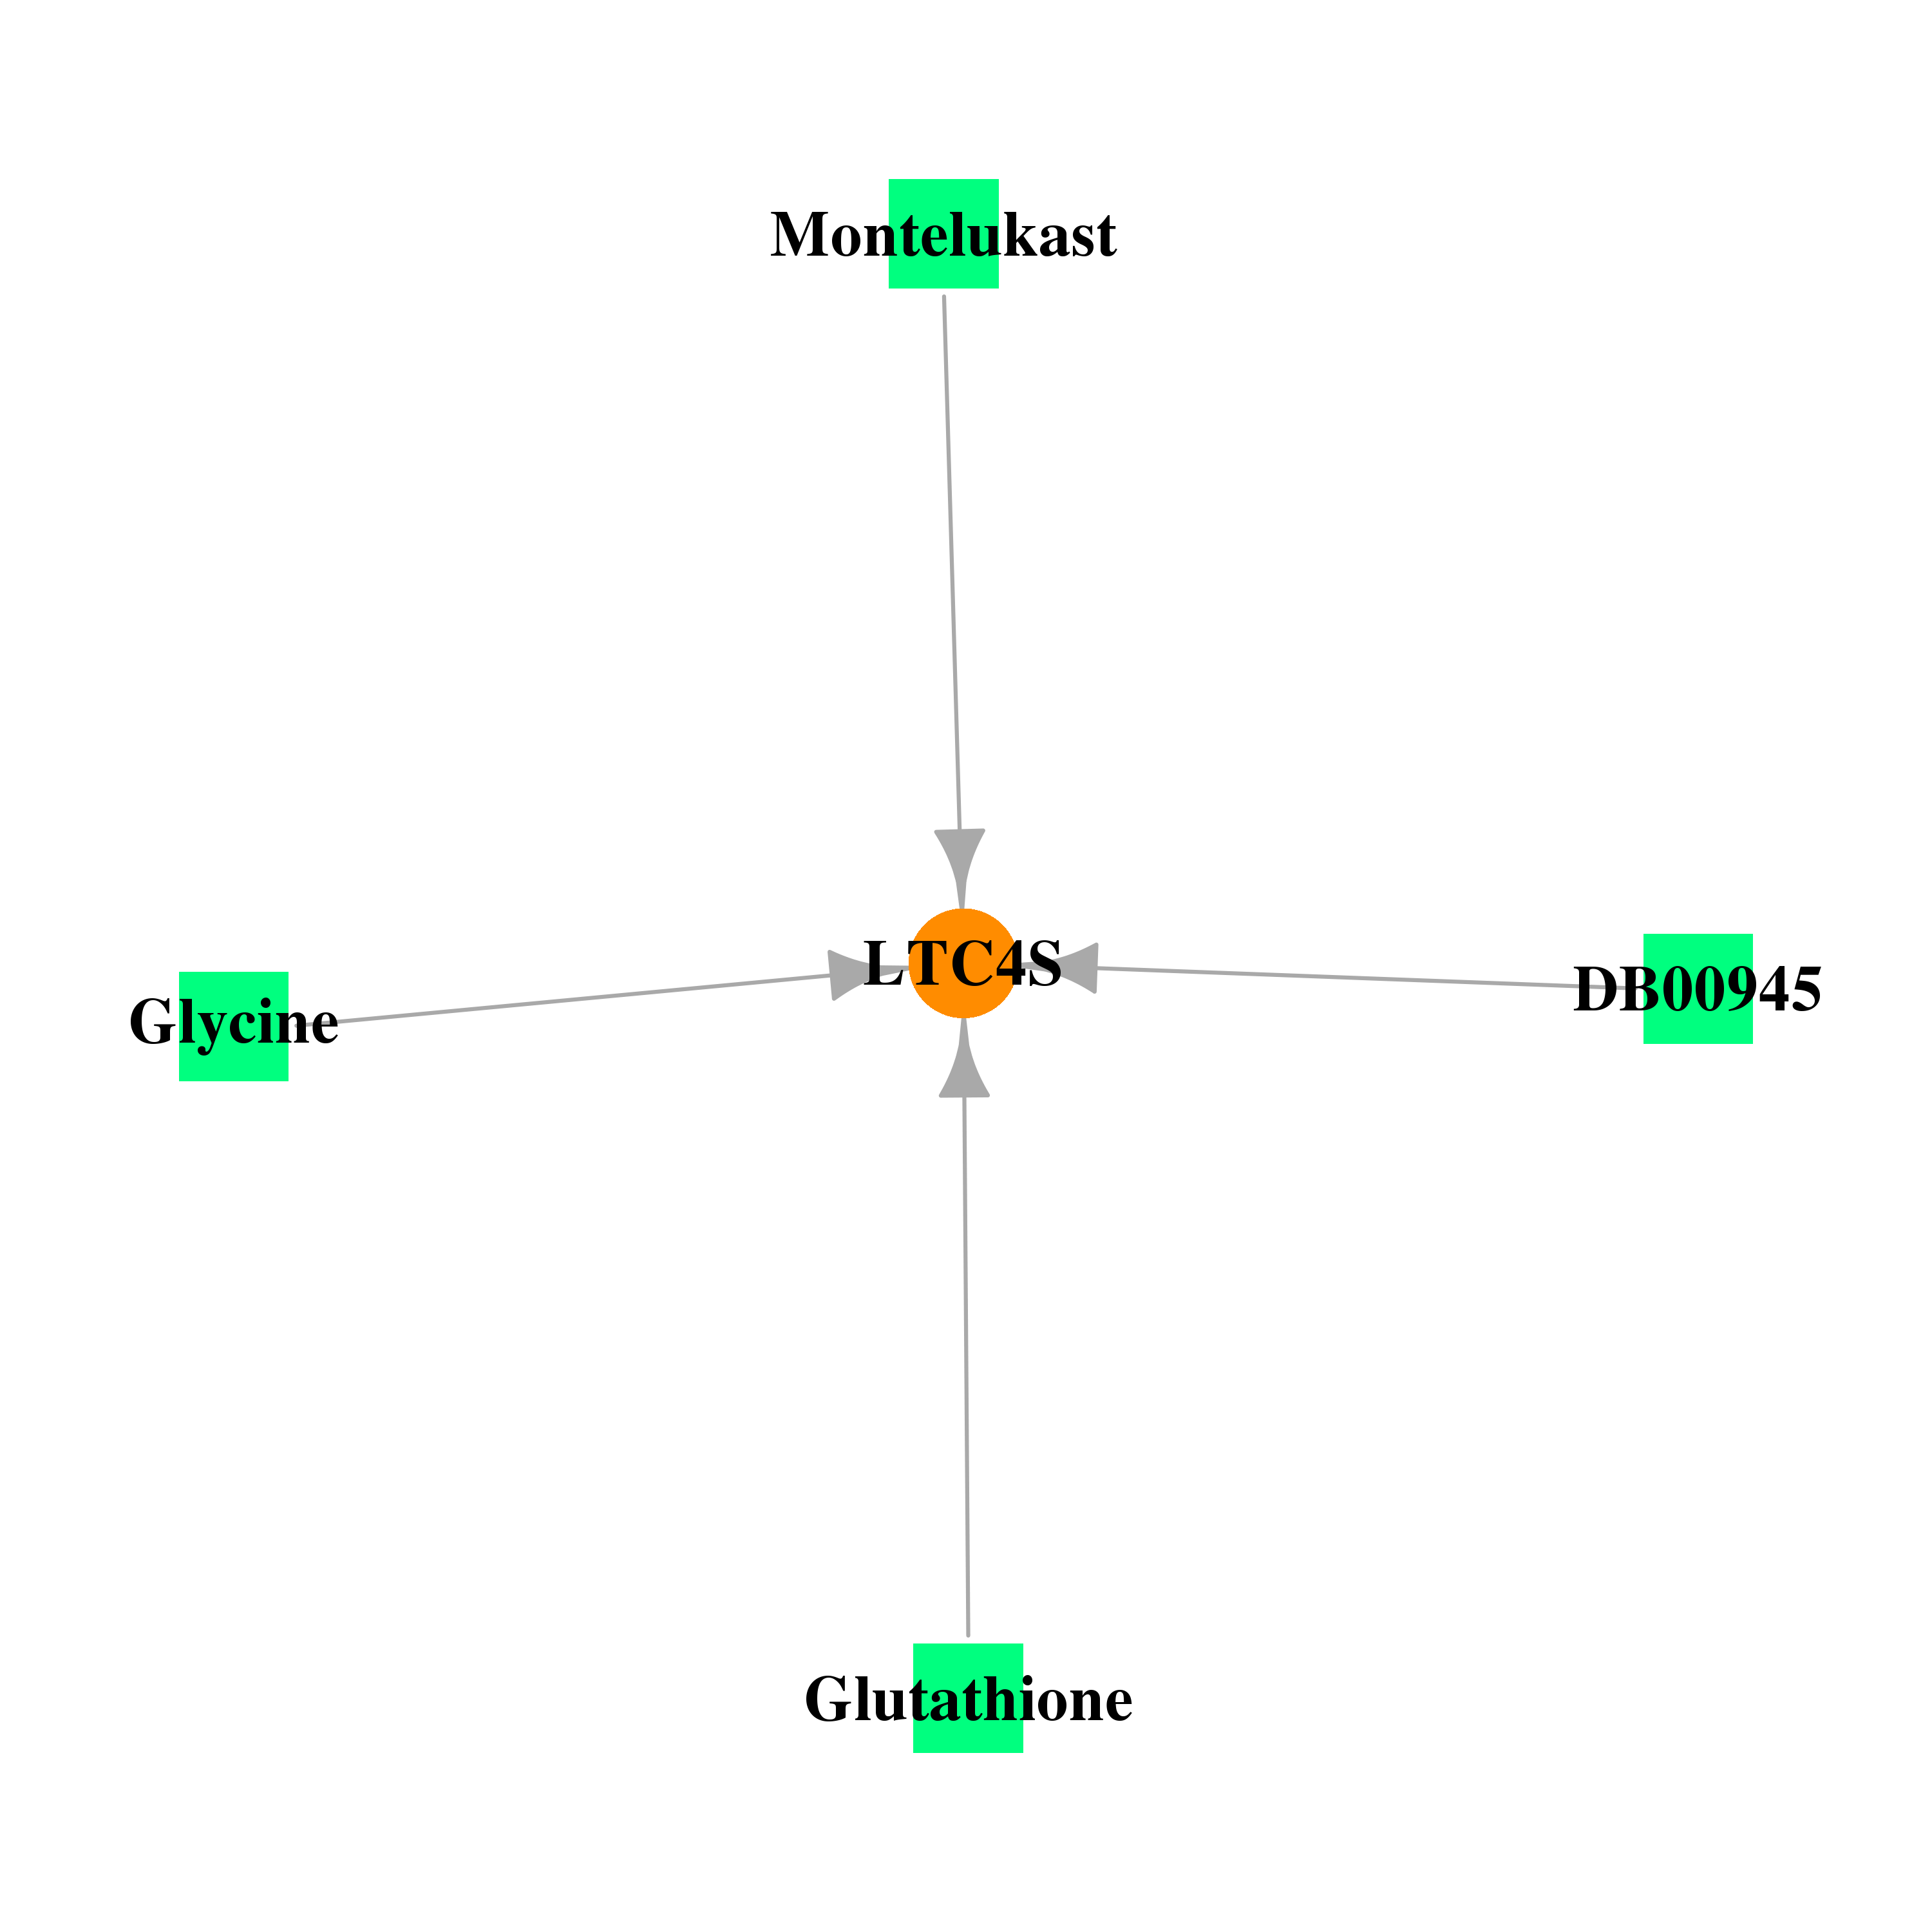 |
| * Drug Centered Interaction Network. |
| DrugBank ID | Target Name | Drug Groups | Generic Name | Drug Centered Network | Drug Structure |
| DB00143 | leukotriene C4 synthase | approved; nutraceutical | Glutathione |  |  |
| DB00145 | leukotriene C4 synthase | approved; nutraceutical | Glycine |  |  |
| DB00945 | leukotriene C4 synthase | approved | Acetylsalicylic acid | 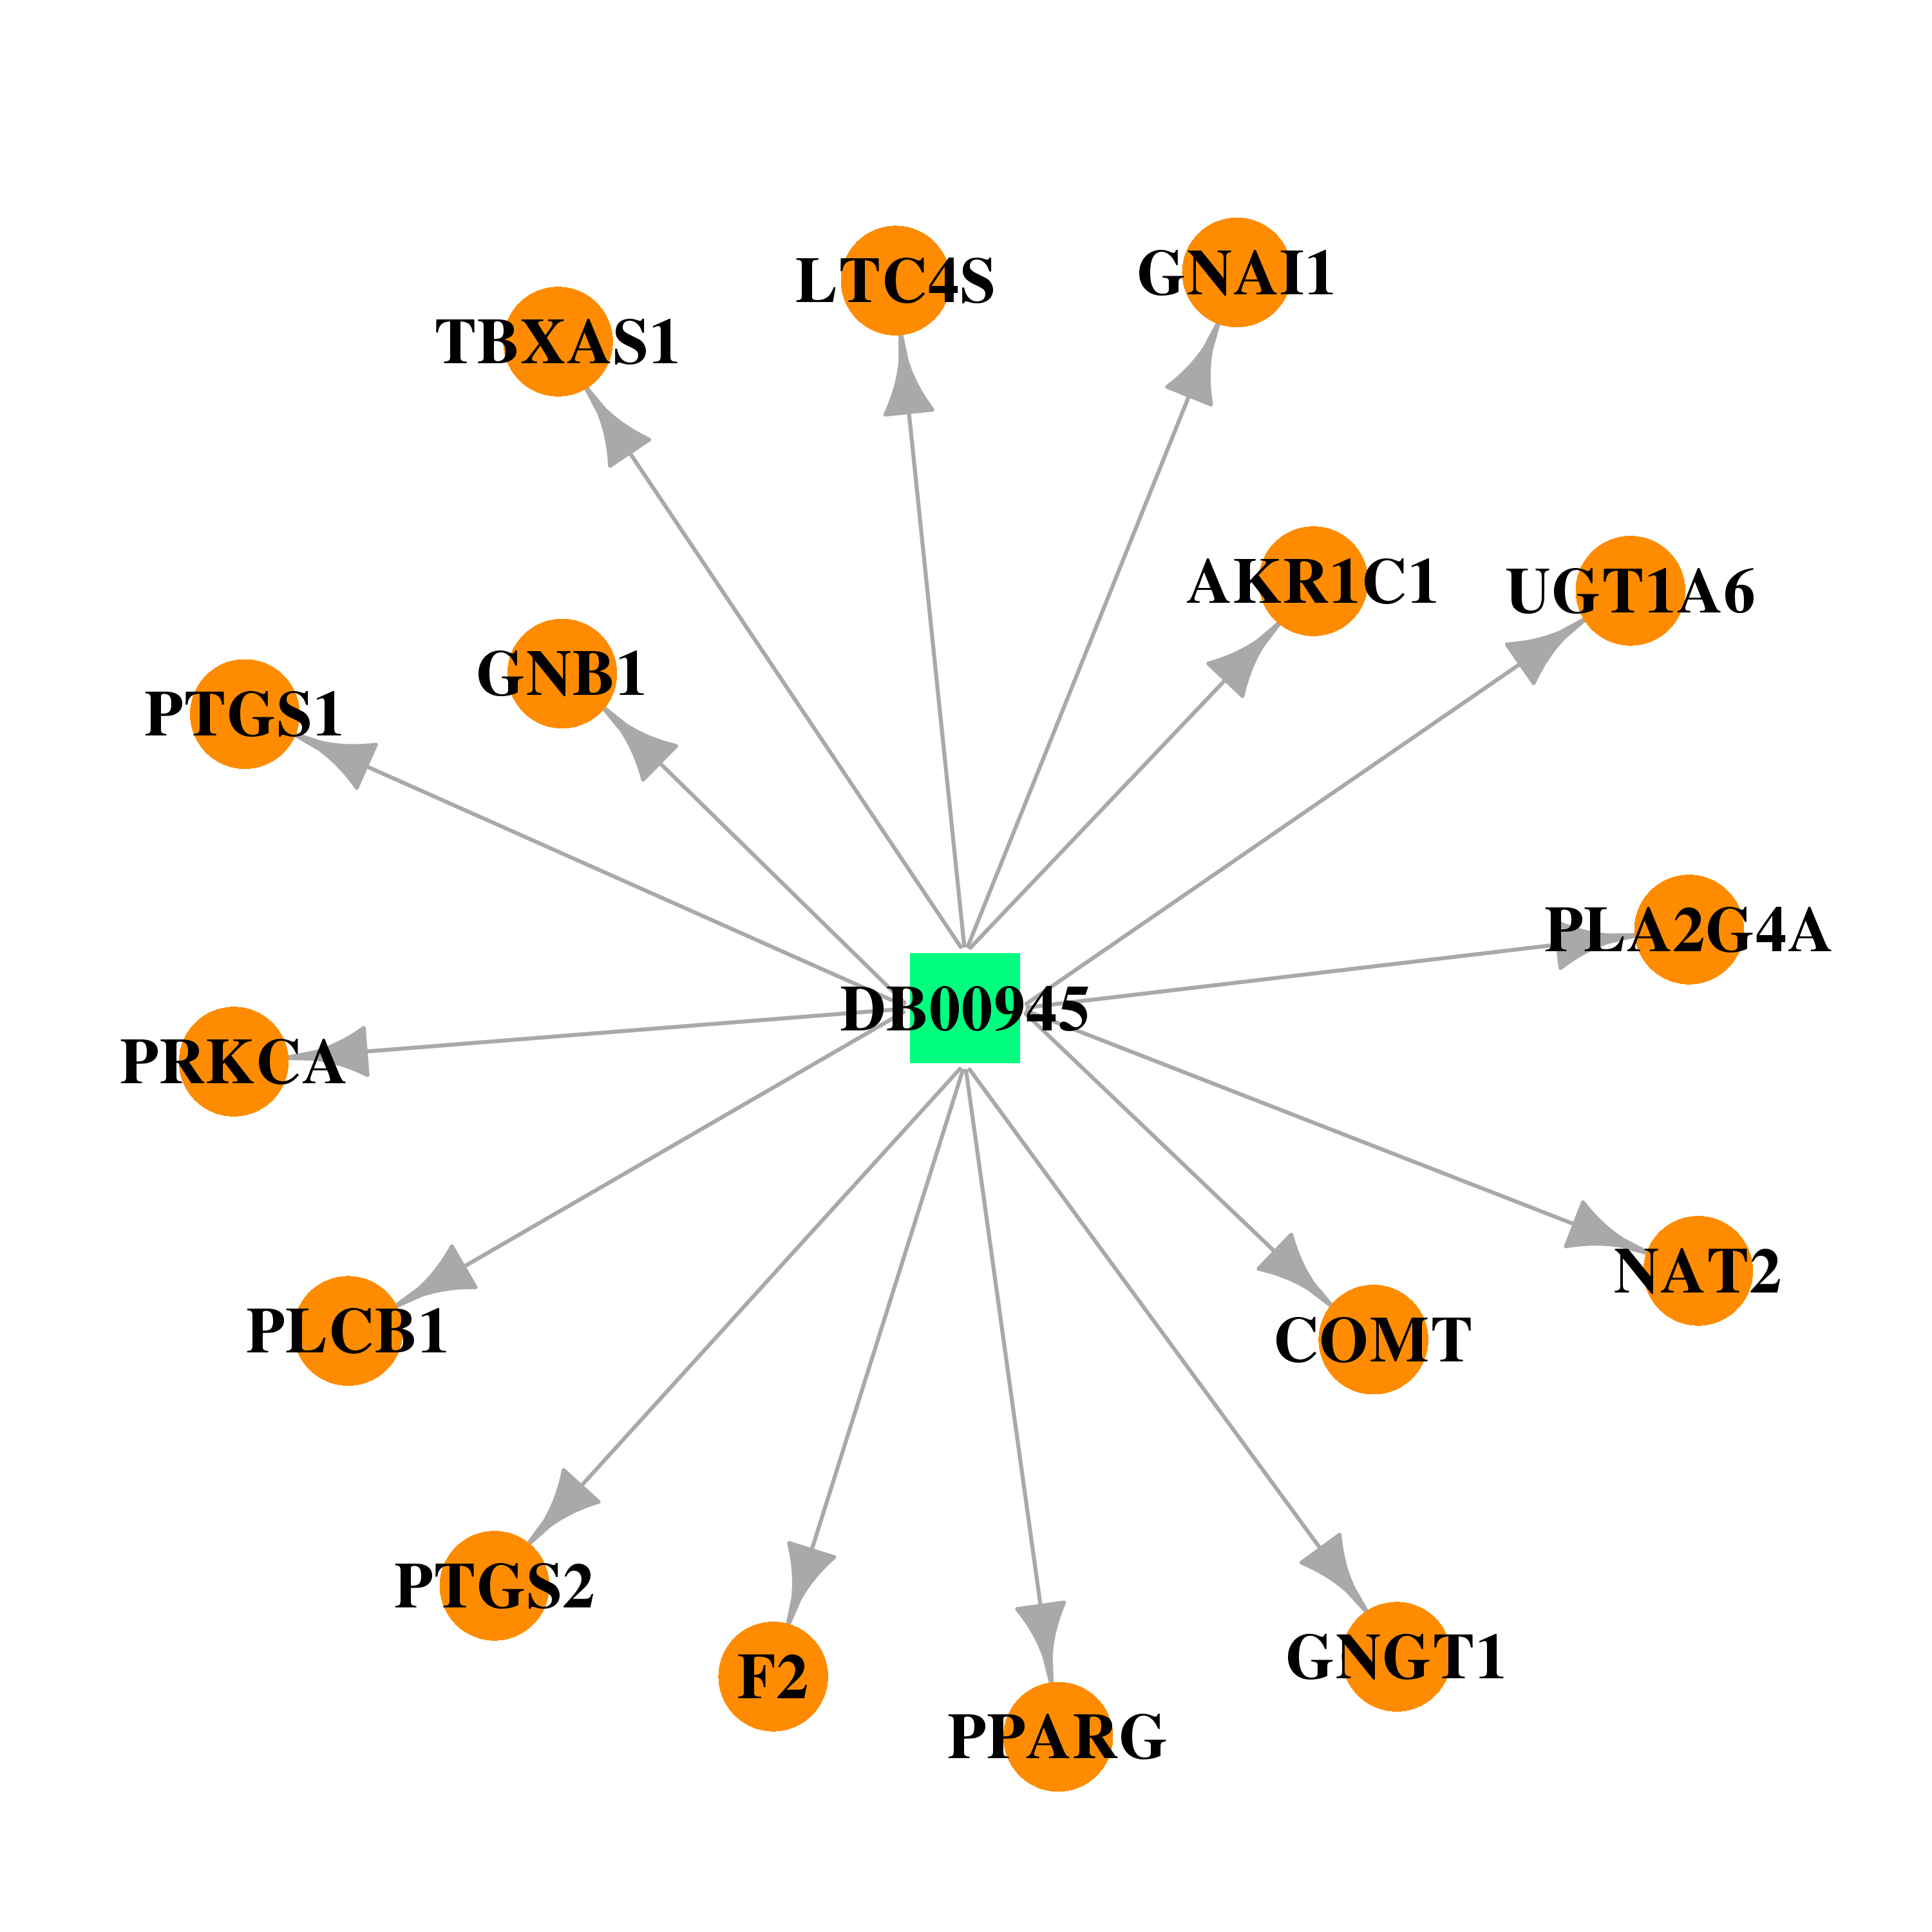 | 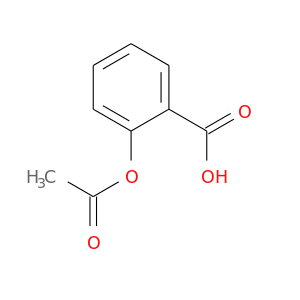 |
| DB00471 | leukotriene C4 synthase | approved | Montelukast | 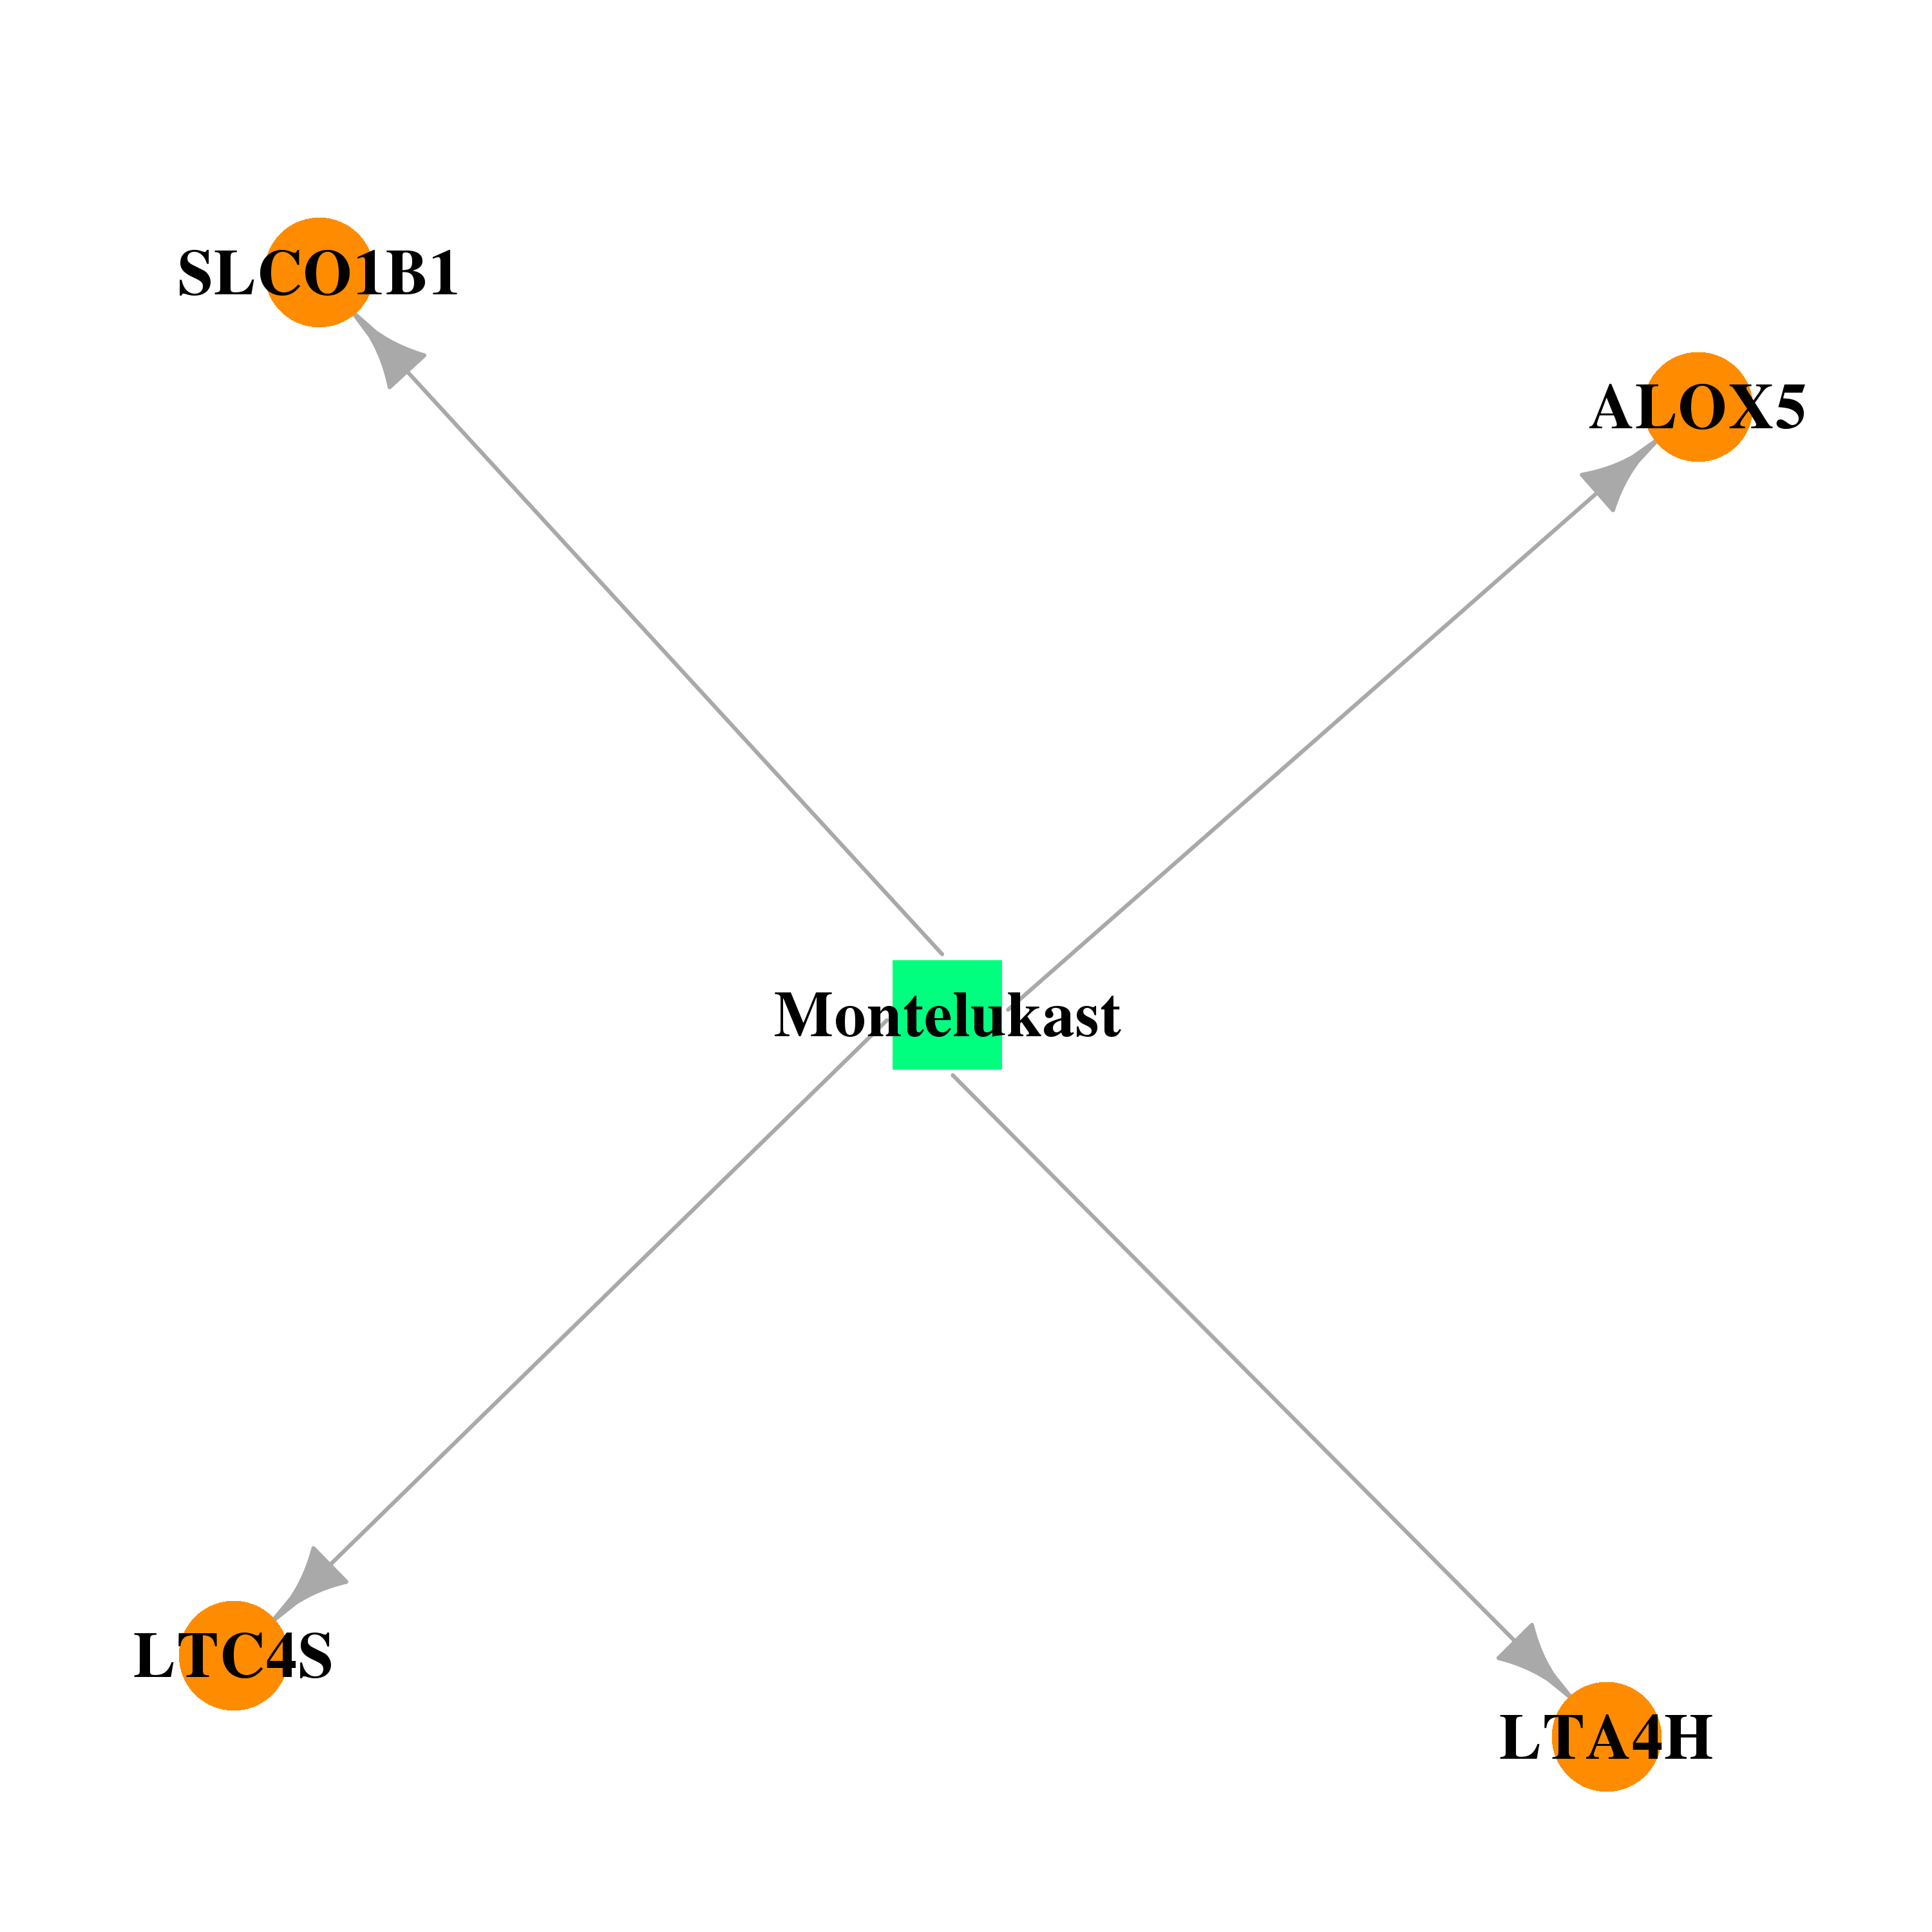 | 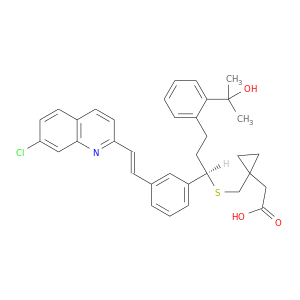 |
| Top |
| Cross referenced IDs for LTC4S |
| * We obtained these cross-references from Uniprot database. It covers 150 different DBs, 18 categories. http://www.uniprot.org/help/cross_references_section |
: Open all cross reference information
|
Copyright © 2016-Present - The Univsersity of Texas Health Science Center at Houston @ |