|
||||||||||||||||||||
| |
| Phenotypic Information (metabolism pathway, cancer, disease, phenome) |
| |
| |
| Gene-Gene Network Information: Co-Expression Network, Interacting Genes & KEGG |
| |
|


| Gene Summary for ARSA |
| Basic gene info. | Gene symbol | ARSA |
| Gene name | arylsulfatase A | |
| Synonyms | MLD | |
| Cytomap | UCSC genome browser: 22q13.33 | |
| Genomic location | chr22 :51061181-51066601 | |
| Type of gene | protein-coding | |
| RefGenes | NM_000487.5, NM_001085425.2,NM_001085426.2,NM_001085427.2,NM_001085428.2, | |
| Ensembl id | ENSG00000100299 | |
| Description | ASAcerebroside-sulfatase | |
| Modification date | 20141219 | |
| dbXrefs | MIM : 607574 | |
| HGNC : HGNC | ||
| Ensembl : ENSG00000100299 | ||
| HPRD : 09617 | ||
| Vega : OTTHUMG00000150180 | ||
| Protein | UniProt: go to UniProt's Cross Reference DB Table | |
| Expression | CleanEX: HS_ARSA | |
| BioGPS: 410 | ||
| Gene Expression Atlas: ENSG00000100299 | ||
| The Human Protein Atlas: ENSG00000100299 | ||
| Pathway | NCI Pathway Interaction Database: ARSA | |
| KEGG: ARSA | ||
| REACTOME: ARSA | ||
| ConsensusPathDB | ||
| Pathway Commons: ARSA | ||
| Metabolism | MetaCyc: ARSA | |
| HUMANCyc: ARSA | ||
| Regulation | Ensembl's Regulation: ENSG00000100299 | |
| miRBase: chr22 :51,061,181-51,066,601 | ||
| TargetScan: NM_000487 | ||
| cisRED: ENSG00000100299 | ||
| Context | iHOP: ARSA | |
| cancer metabolism search in PubMed: ARSA | ||
| UCL Cancer Institute: ARSA | ||
| Assigned class in ccmGDB | C | |
| Top |
| Phenotypic Information for ARSA(metabolism pathway, cancer, disease, phenome) |
| Cancer | CGAP: ARSA |
| Familial Cancer Database: ARSA | |
| * This gene is included in those cancer gene databases. |
|
|
|
|
|
| . | ||||||||||||||
Oncogene 1 | Significant driver gene in | |||||||||||||||||||
| cf) number; DB name 1 Oncogene; http://nar.oxfordjournals.org/content/35/suppl_1/D721.long, 2 Tumor Suppressor gene; https://bioinfo.uth.edu/TSGene/, 3 Cancer Gene Census; http://www.nature.com/nrc/journal/v4/n3/abs/nrc1299.html, 4 CancerGenes; http://nar.oxfordjournals.org/content/35/suppl_1/D721.long, 5 Network of Cancer Gene; http://ncg.kcl.ac.uk/index.php, 1Therapeutic Vulnerabilities in Cancer; http://cbio.mskcc.org/cancergenomics/statius/ |
| KEGG_SPHINGOLIPID_METABOLISM REACTOME_GLYCOSPHINGOLIPID_METABOLISM REACTOME_PHOSPHOLIPID_METABOLISM REACTOME_METABOLISM_OF_PROTEINS REACTOME_SPHINGOLIPID_METABOLISM REACTOME_METABOLISM_OF_LIPIDS_AND_LIPOPROTEINS | |
| OMIM | |
| Orphanet | |
| Disease | KEGG Disease: ARSA |
| MedGen: ARSA (Human Medical Genetics with Condition) | |
| ClinVar: ARSA | |
| Phenotype | MGI: ARSA (International Mouse Phenotyping Consortium) |
| PhenomicDB: ARSA | |
| Mutations for ARSA |
| * Under tables are showing count per each tissue to give us broad intuition about tissue specific mutation patterns.You can go to the detailed page for each mutation database's web site. |
| There's no structural variation information in COSMIC data for this gene. |
| * From mRNA Sanger sequences, Chitars2.0 arranged chimeric transcripts. This table shows ARSA related fusion information. |
| ID | Head Gene | Tail Gene | Accession | Gene_a | qStart_a | qEnd_a | Chromosome_a | tStart_a | tEnd_a | Gene_a | qStart_a | qEnd_a | Chromosome_a | tStart_a | tEnd_a |
| BF932162 | ARSA | 1 | 256 | 22 | 51065065 | 51065319 | ARSA | 253 | 336 | 22 | 51064666 | 51065061 | |
| BF898639 | ARSA | 5 | 201 | 22 | 51065838 | 51066034 | ANKLE2 | 198 | 408 | 12 | 133313420 | 133313630 | |
| Top |
| There's no copy number variation information in COSMIC data for this gene. |
| Top |
|
 |
| Top |
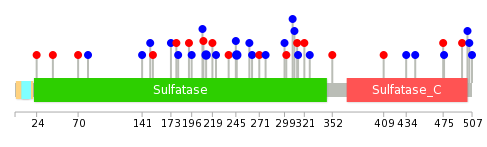
| Stat. for Non-Synonymous SNVs (# total SNVs=15) | (# total SNVs=11) |
 |  |
(# total SNVs=0) | (# total SNVs=0) |
| Top |
| * When you move the cursor on each content, you can see more deailed mutation information on the Tooltip. Those are primary_site,primary_histology,mutation(aa),pubmedID. |
| GRCh37 position | Mutation(aa) | Unique sampleID count |
| chr22:51065135-51065135 | p.R246R | 2 |
| chr22:51065310-51065310 | p.A212A | 2 |
| chr22:51063878-51063878 | p.D409N | 1 |
| chr22:51065999-51065999 | p.L70R | 1 |
| chr22:51065062-51065062 | p.G271R | 1 |
| chr22:51065322-51065322 | p.H208H | 1 |
| chr22:51064416-51064416 | p.N352S | 1 |
| chr22:51066084-51066084 | p.G42R | 1 |
| chr22:51065086-51065086 | p.L263L | 1 |
| chr22:51065360-51065360 | p.L196L | 1 |
| Top |
|
 |
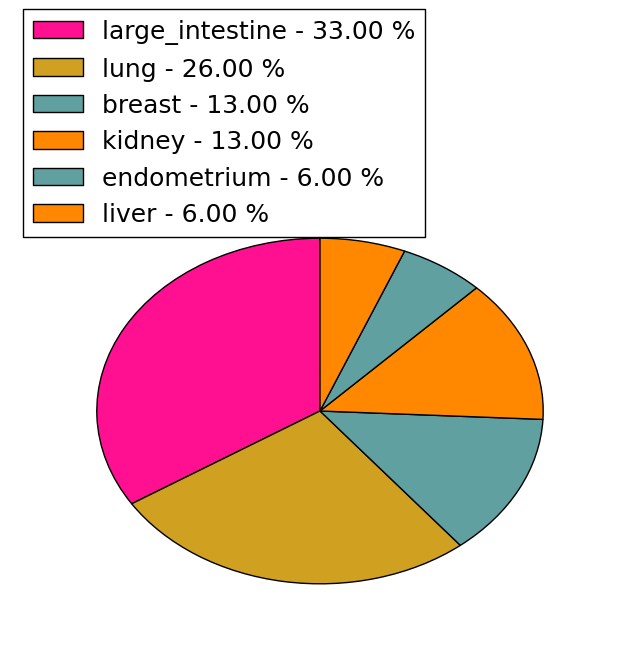
| Point Mutation/ Tissue ID | 1 | 2 | 3 | 4 | 5 | 6 | 7 | 8 | 9 | 10 | 11 | 12 | 13 | 14 | 15 | 16 | 17 | 18 | 19 | 20 |
| # sample | 1 | 1 | 5 | 1 | 1 | 1 | 2 | 2 | 9 | 2 | 2 | |||||||||
| # mutation | 1 | 1 | 5 | 1 | 1 | 1 | 2 | 2 | 11 | 2 | 2 | |||||||||
| nonsynonymous SNV | 1 | 1 | 3 | 1 | 1 | 2 | 1 | |||||||||||||
| synonymous SNV | 2 | 1 | 1 | 1 | 11 | 2 | 1 |
| cf) Tissue ID; Tissue type (1; BLCA[Bladder Urothelial Carcinoma], 2; BRCA[Breast invasive carcinoma], 3; CESC[Cervical squamous cell carcinoma and endocervical adenocarcinoma], 4; COAD[Colon adenocarcinoma], 5; GBM[Glioblastoma multiforme], 6; Glioma Low Grade, 7; HNSC[Head and Neck squamous cell carcinoma], 8; KICH[Kidney Chromophobe], 9; KIRC[Kidney renal clear cell carcinoma], 10; KIRP[Kidney renal papillary cell carcinoma], 11; LAML[Acute Myeloid Leukemia], 12; LUAD[Lung adenocarcinoma], 13; LUSC[Lung squamous cell carcinoma], 14; OV[Ovarian serous cystadenocarcinoma ], 15; PAAD[Pancreatic adenocarcinoma], 16; PRAD[Prostate adenocarcinoma], 17; SKCM[Skin Cutaneous Melanoma], 18:STAD[Stomach adenocarcinoma], 19:THCA[Thyroid carcinoma], 20:UCEC[Uterine Corpus Endometrial Carcinoma]) |
| Top |
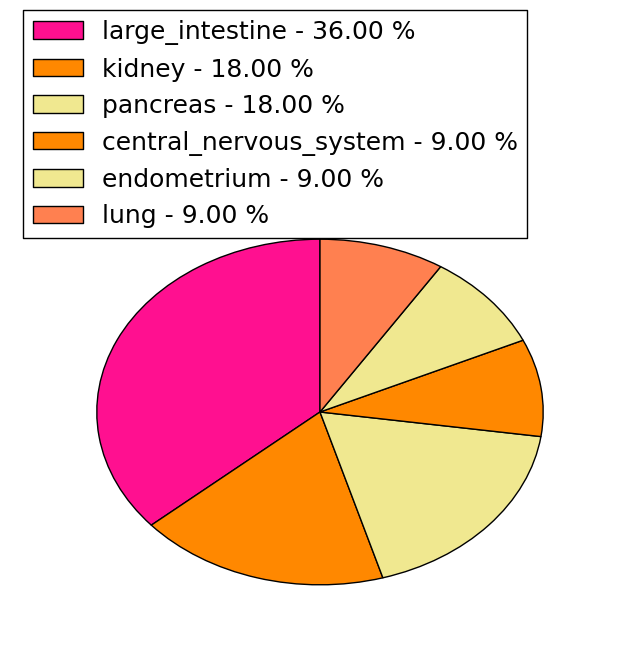
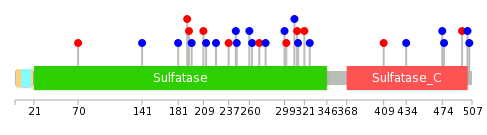
| * We represented just top 10 SNVs. When you move the cursor on each content, you can see more deailed mutation information on the Tooltip. Those are primary_site, primary_histology, mutation(aa), pubmedID. |
| Genomic Position | Mutation(aa) | Unique sampleID count |
| chr22:51064600 | p.R301Q,ARSA | 1 |
| chr22:51065138 | p.Q141Q,ARSA | 1 |
| chr22:51064619 | p.L299L,ARSA | 1 |
| chr22:51065164 | p.L70R,ARSA | 1 |
| chr22:51064623 | p.V278V,ARSA | 1 |
| chr22:51065277 | p.G271R,ARSA | 1 |
| chr22:51063591 | p.C504C,ARSA | 1 |
| chr22:51064631 | p.L263L,ARSA | 1 |
| chr22:51065310 | p.C502C,ARSA | 1 |
| chr22:51063597 | p.V260V,ARSA | 1 |
| * Copy number data were extracted from TCGA using R package TCGA-Assembler. The URLs of all public data files on TCGA DCC data server were gathered on Jan-05-2015. Function ProcessCNAData in TCGA-Assembler package was used to obtain gene-level copy number value which is calculated as the average copy number of the genomic region of a gene. |
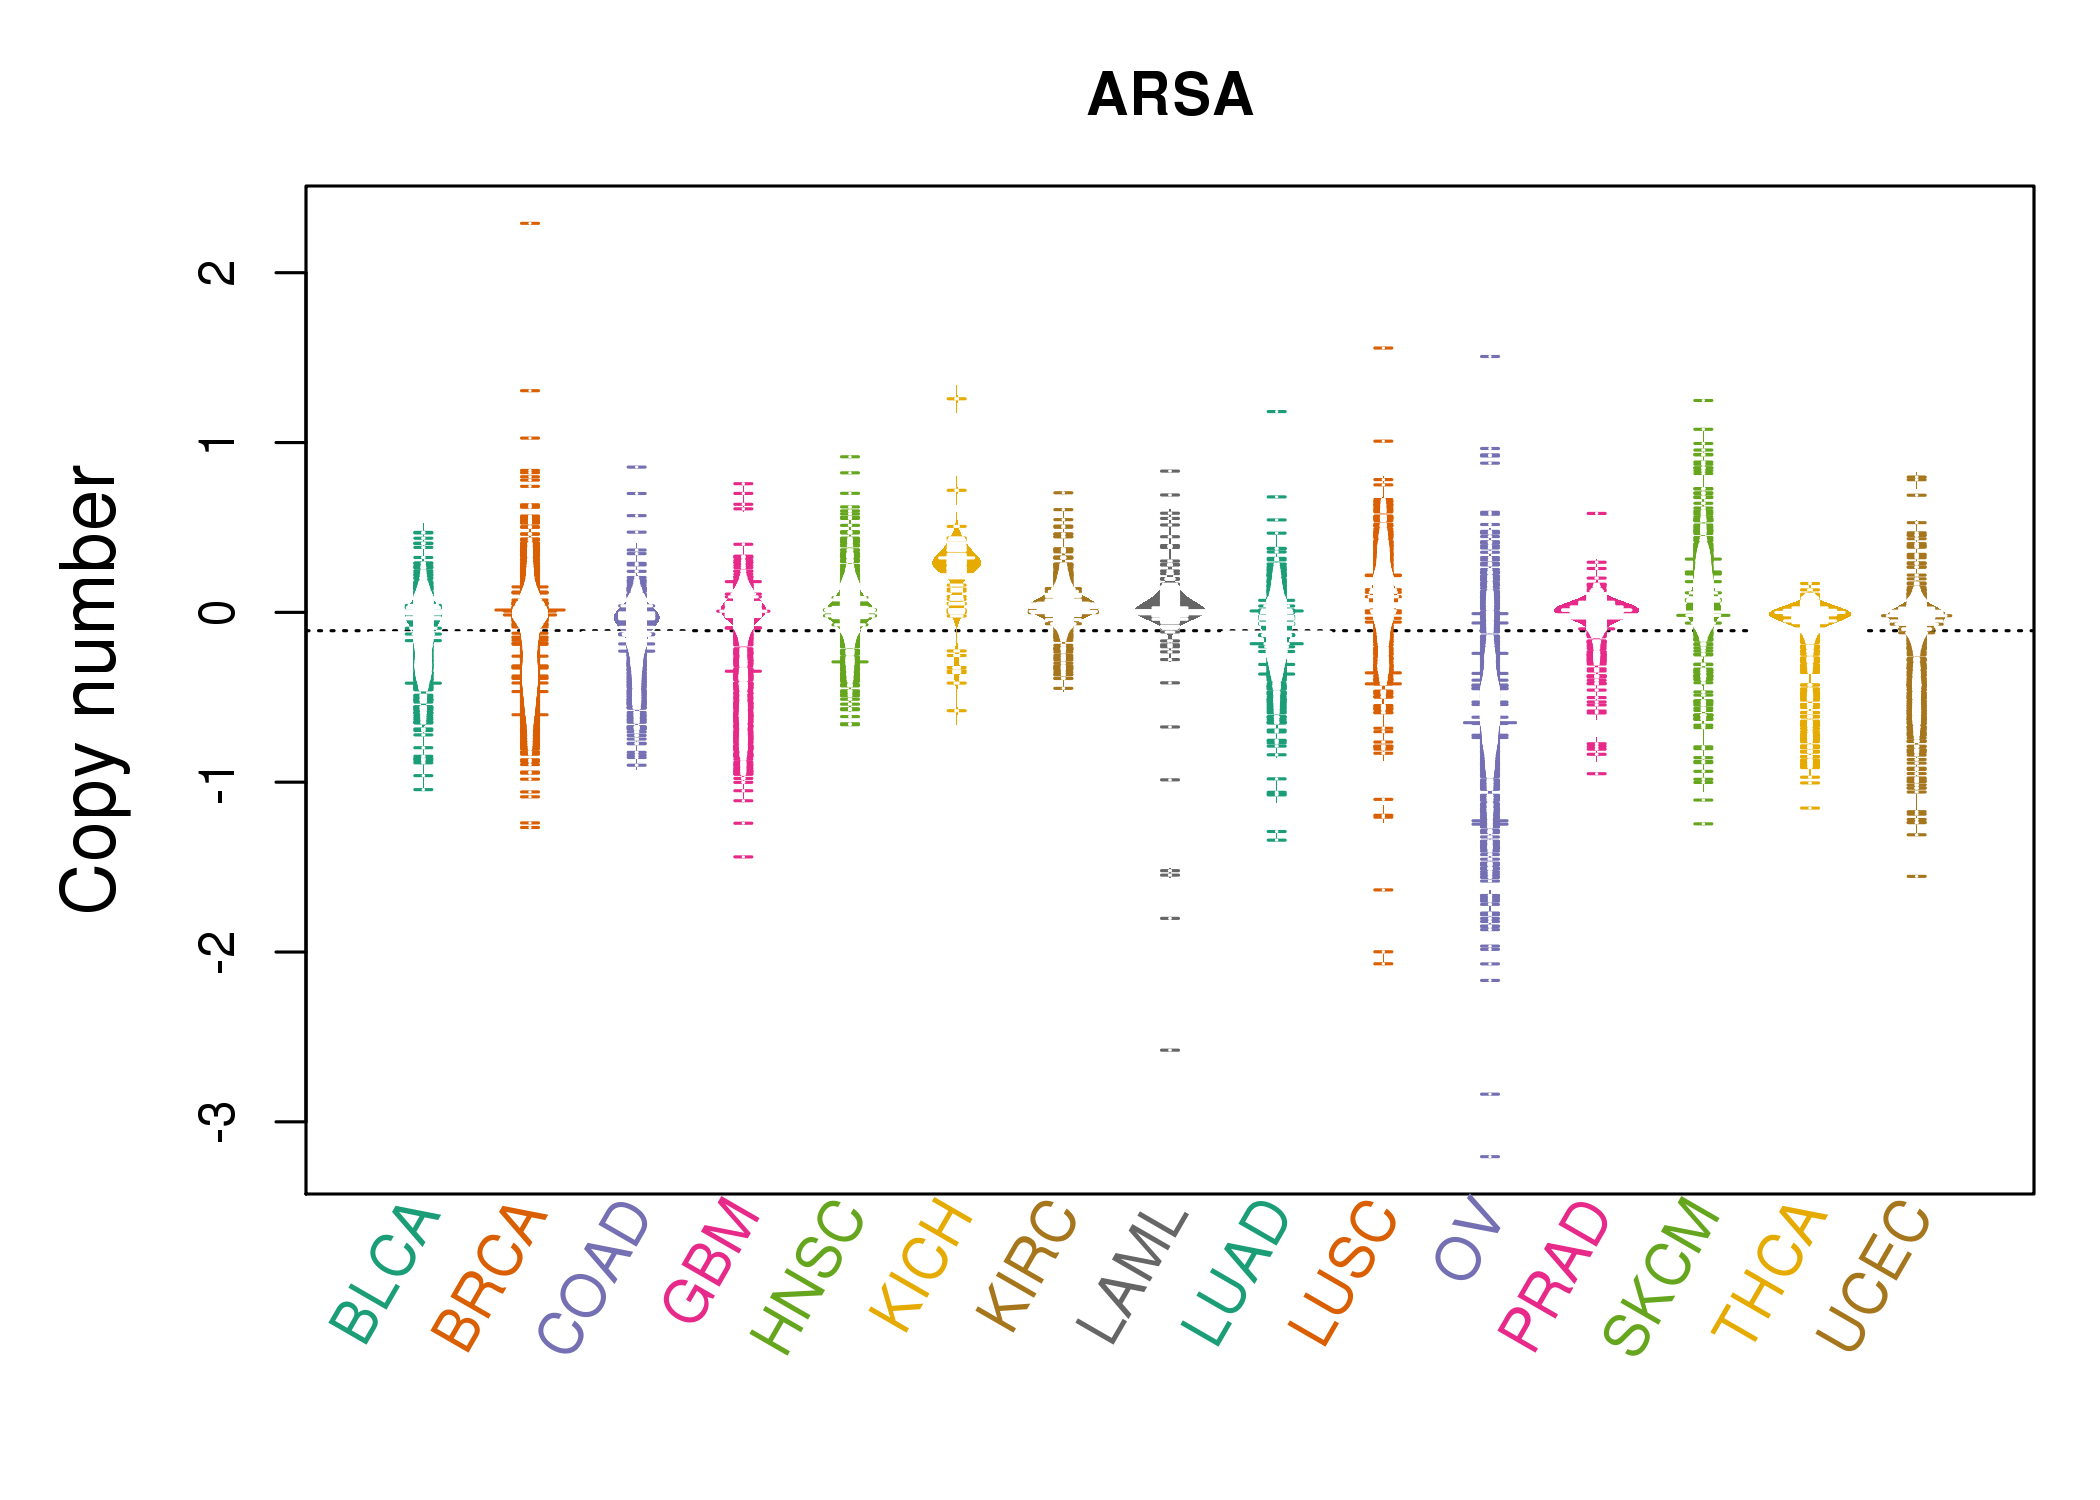 |
| cf) Tissue ID[Tissue type]: BLCA[Bladder Urothelial Carcinoma], BRCA[Breast invasive carcinoma], CESC[Cervical squamous cell carcinoma and endocervical adenocarcinoma], COAD[Colon adenocarcinoma], GBM[Glioblastoma multiforme], Glioma Low Grade, HNSC[Head and Neck squamous cell carcinoma], KICH[Kidney Chromophobe], KIRC[Kidney renal clear cell carcinoma], KIRP[Kidney renal papillary cell carcinoma], LAML[Acute Myeloid Leukemia], LUAD[Lung adenocarcinoma], LUSC[Lung squamous cell carcinoma], OV[Ovarian serous cystadenocarcinoma ], PAAD[Pancreatic adenocarcinoma], PRAD[Prostate adenocarcinoma], SKCM[Skin Cutaneous Melanoma], STAD[Stomach adenocarcinoma], THCA[Thyroid carcinoma], UCEC[Uterine Corpus Endometrial Carcinoma] |
| Top |
| Gene Expression for ARSA |
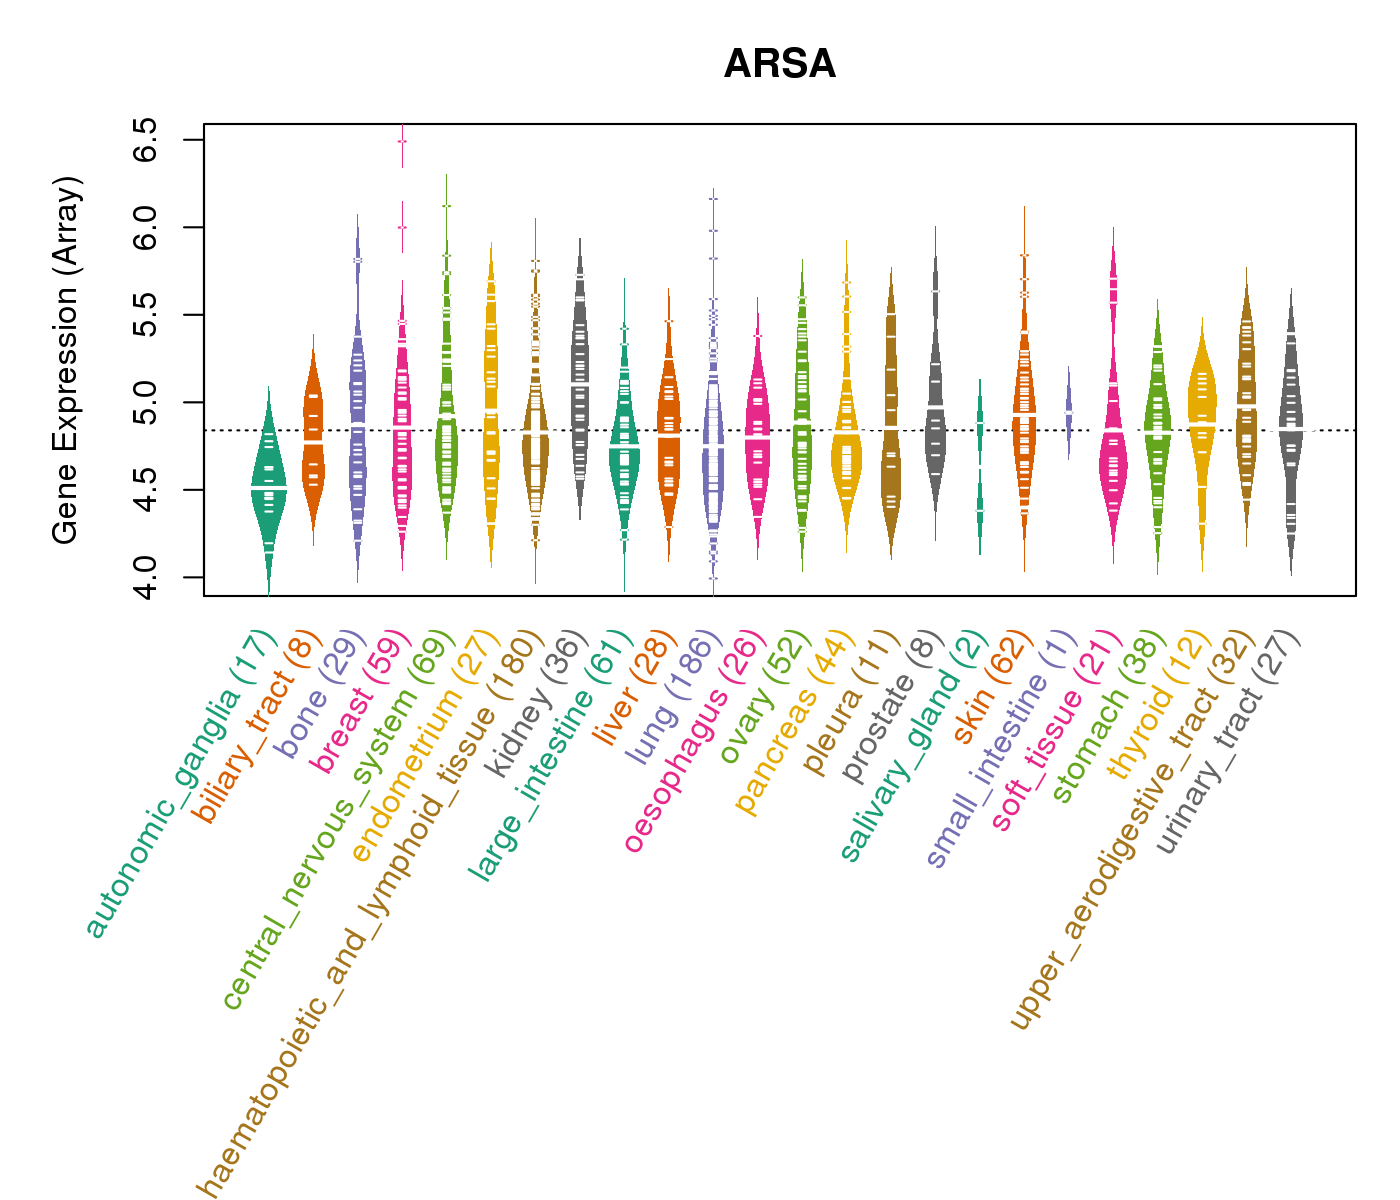
| * CCLE gene expression data were extracted from CCLE_Expression_Entrez_2012-10-18.res: Gene-centric RMA-normalized mRNA expression data. |
 |
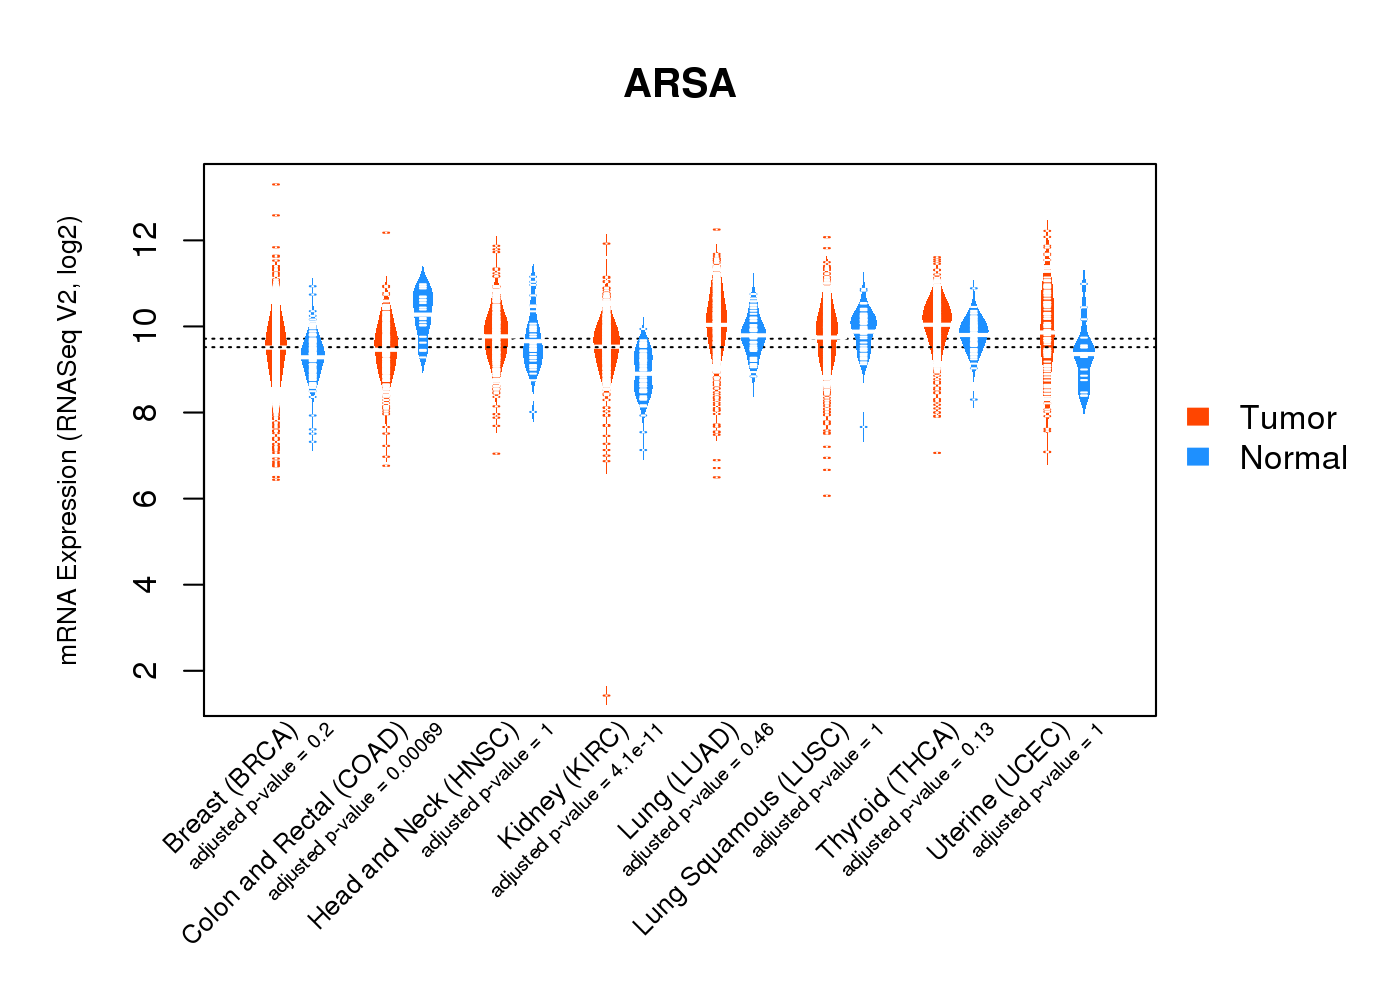
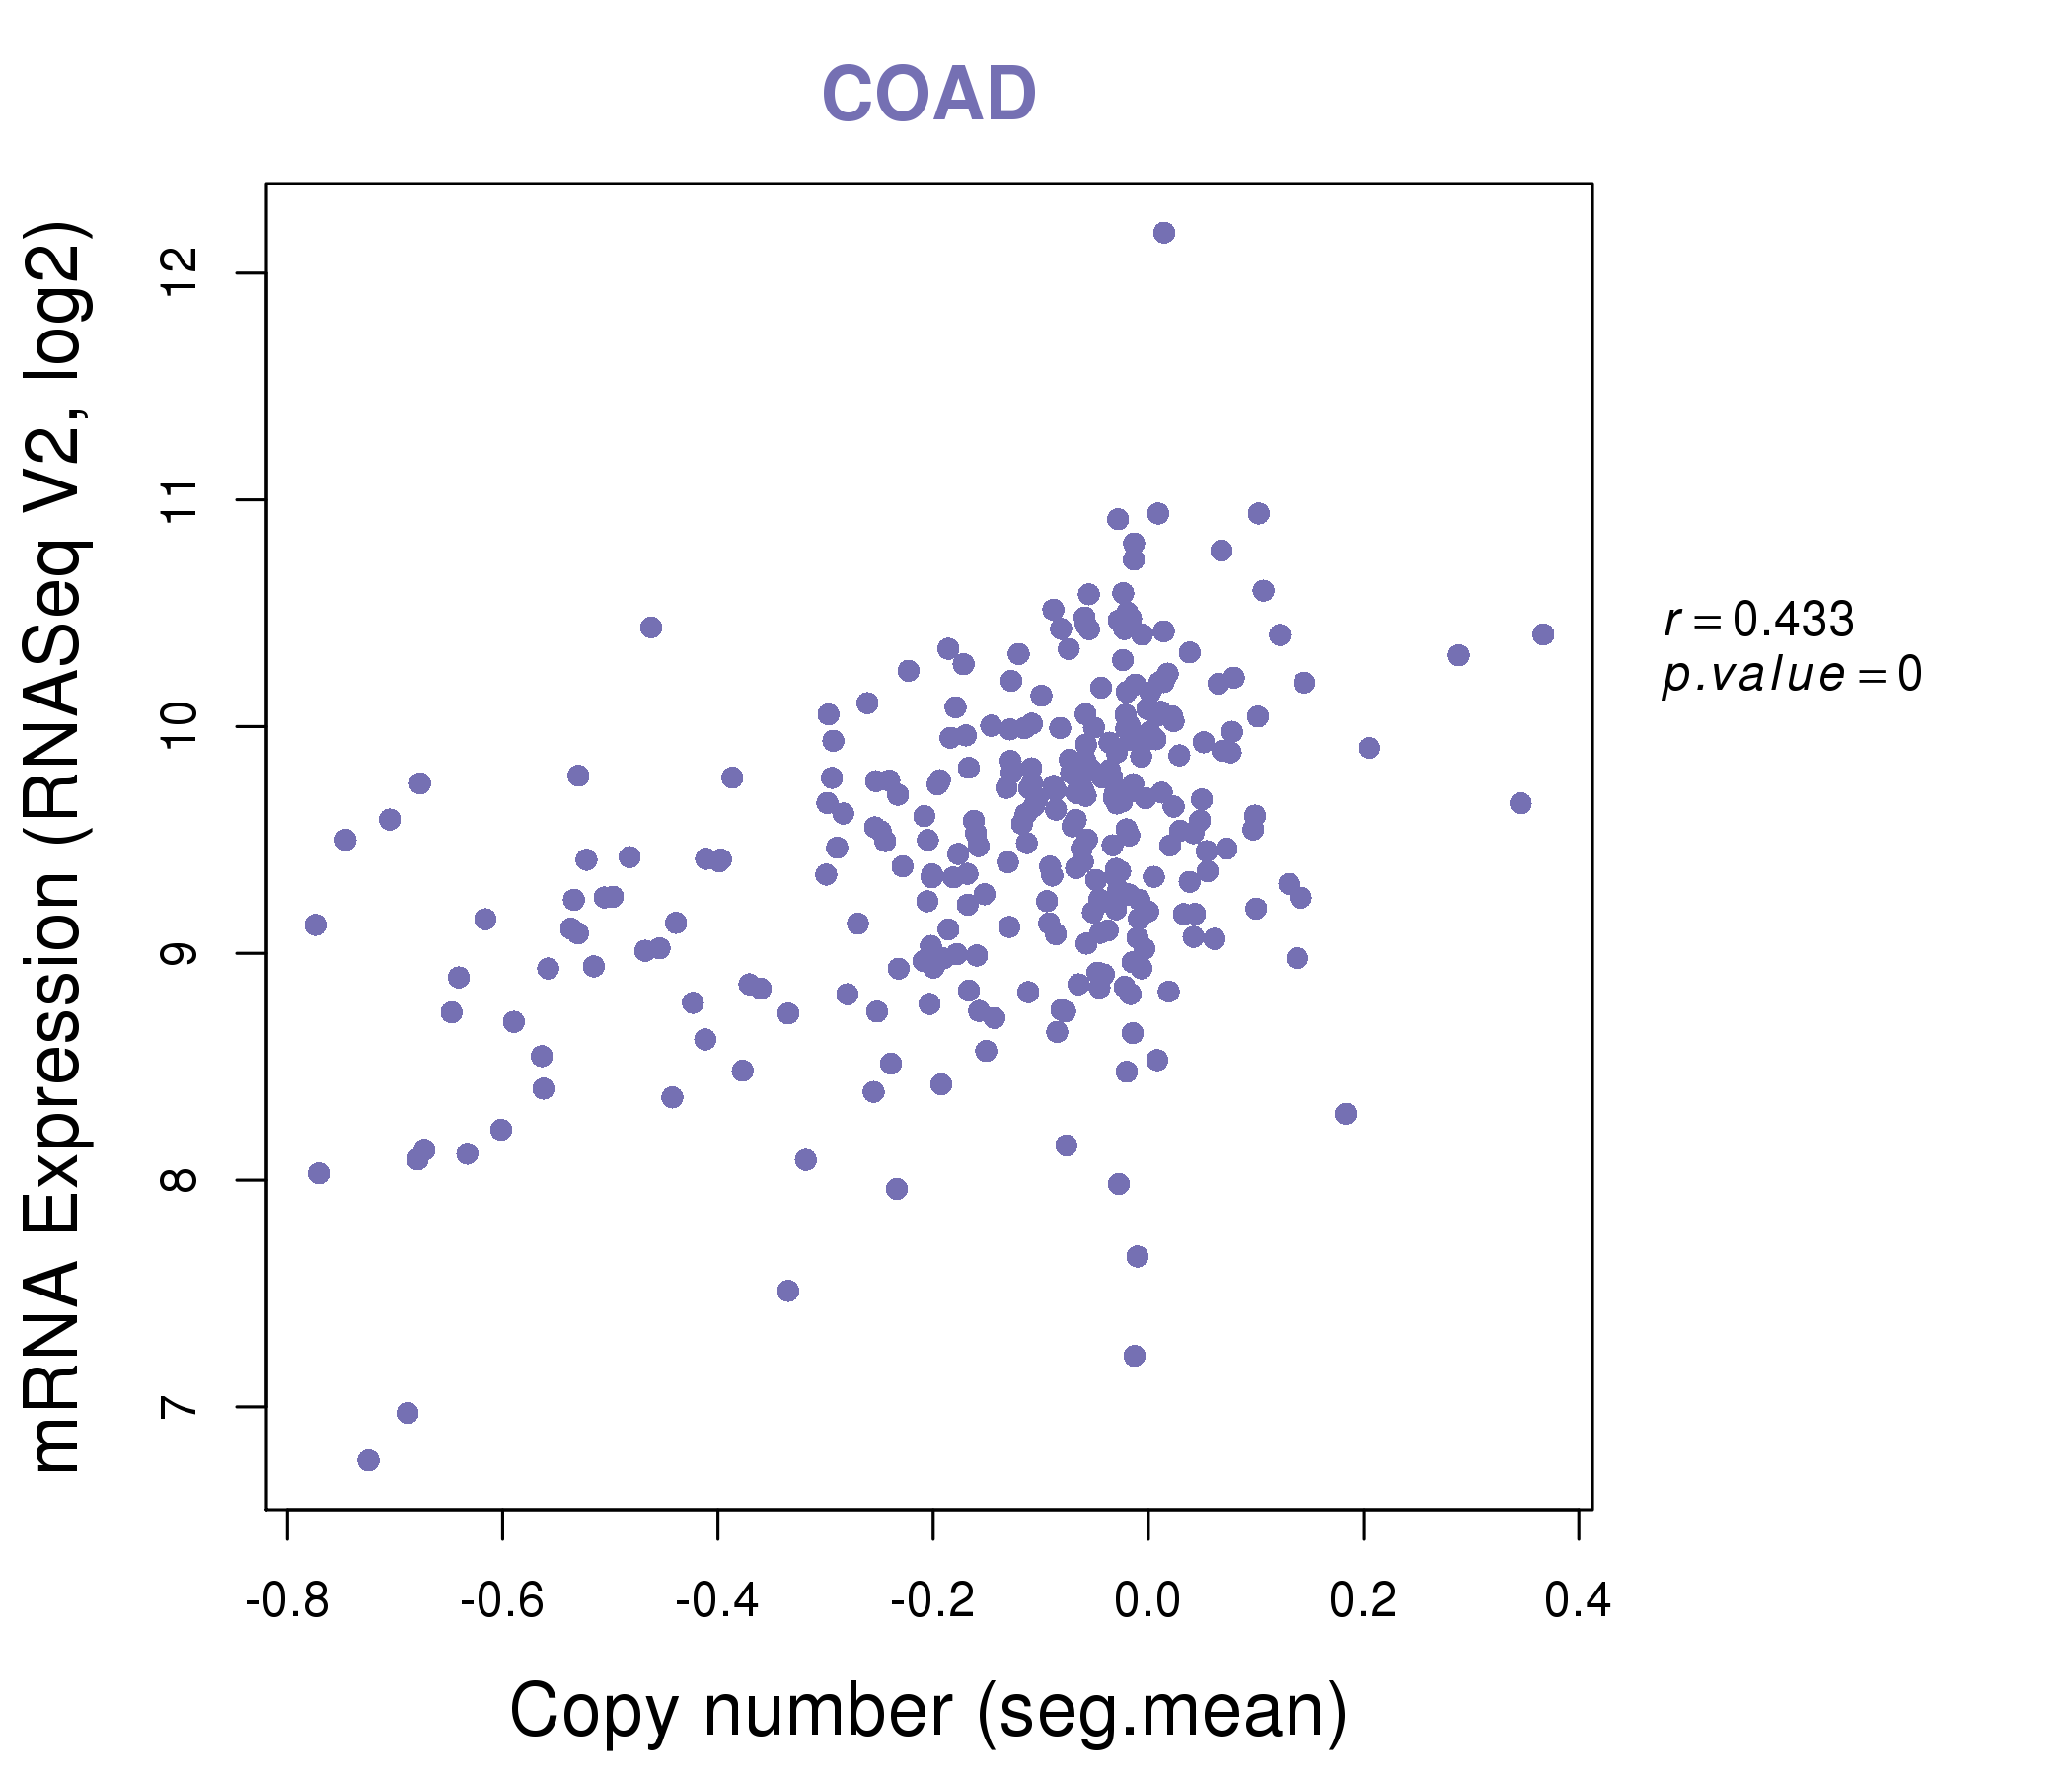
| * Normalized gene expression data of RNASeqV2 was extracted from TCGA using R package TCGA-Assembler. The URLs of all public data files on TCGA DCC data server were gathered at Jan-05-2015. Only eight cancer types have enough normal control samples for differential expression analysis. (t test, adjusted p<0.05 (using Benjamini-Hochberg FDR)) |
 |
| Top |
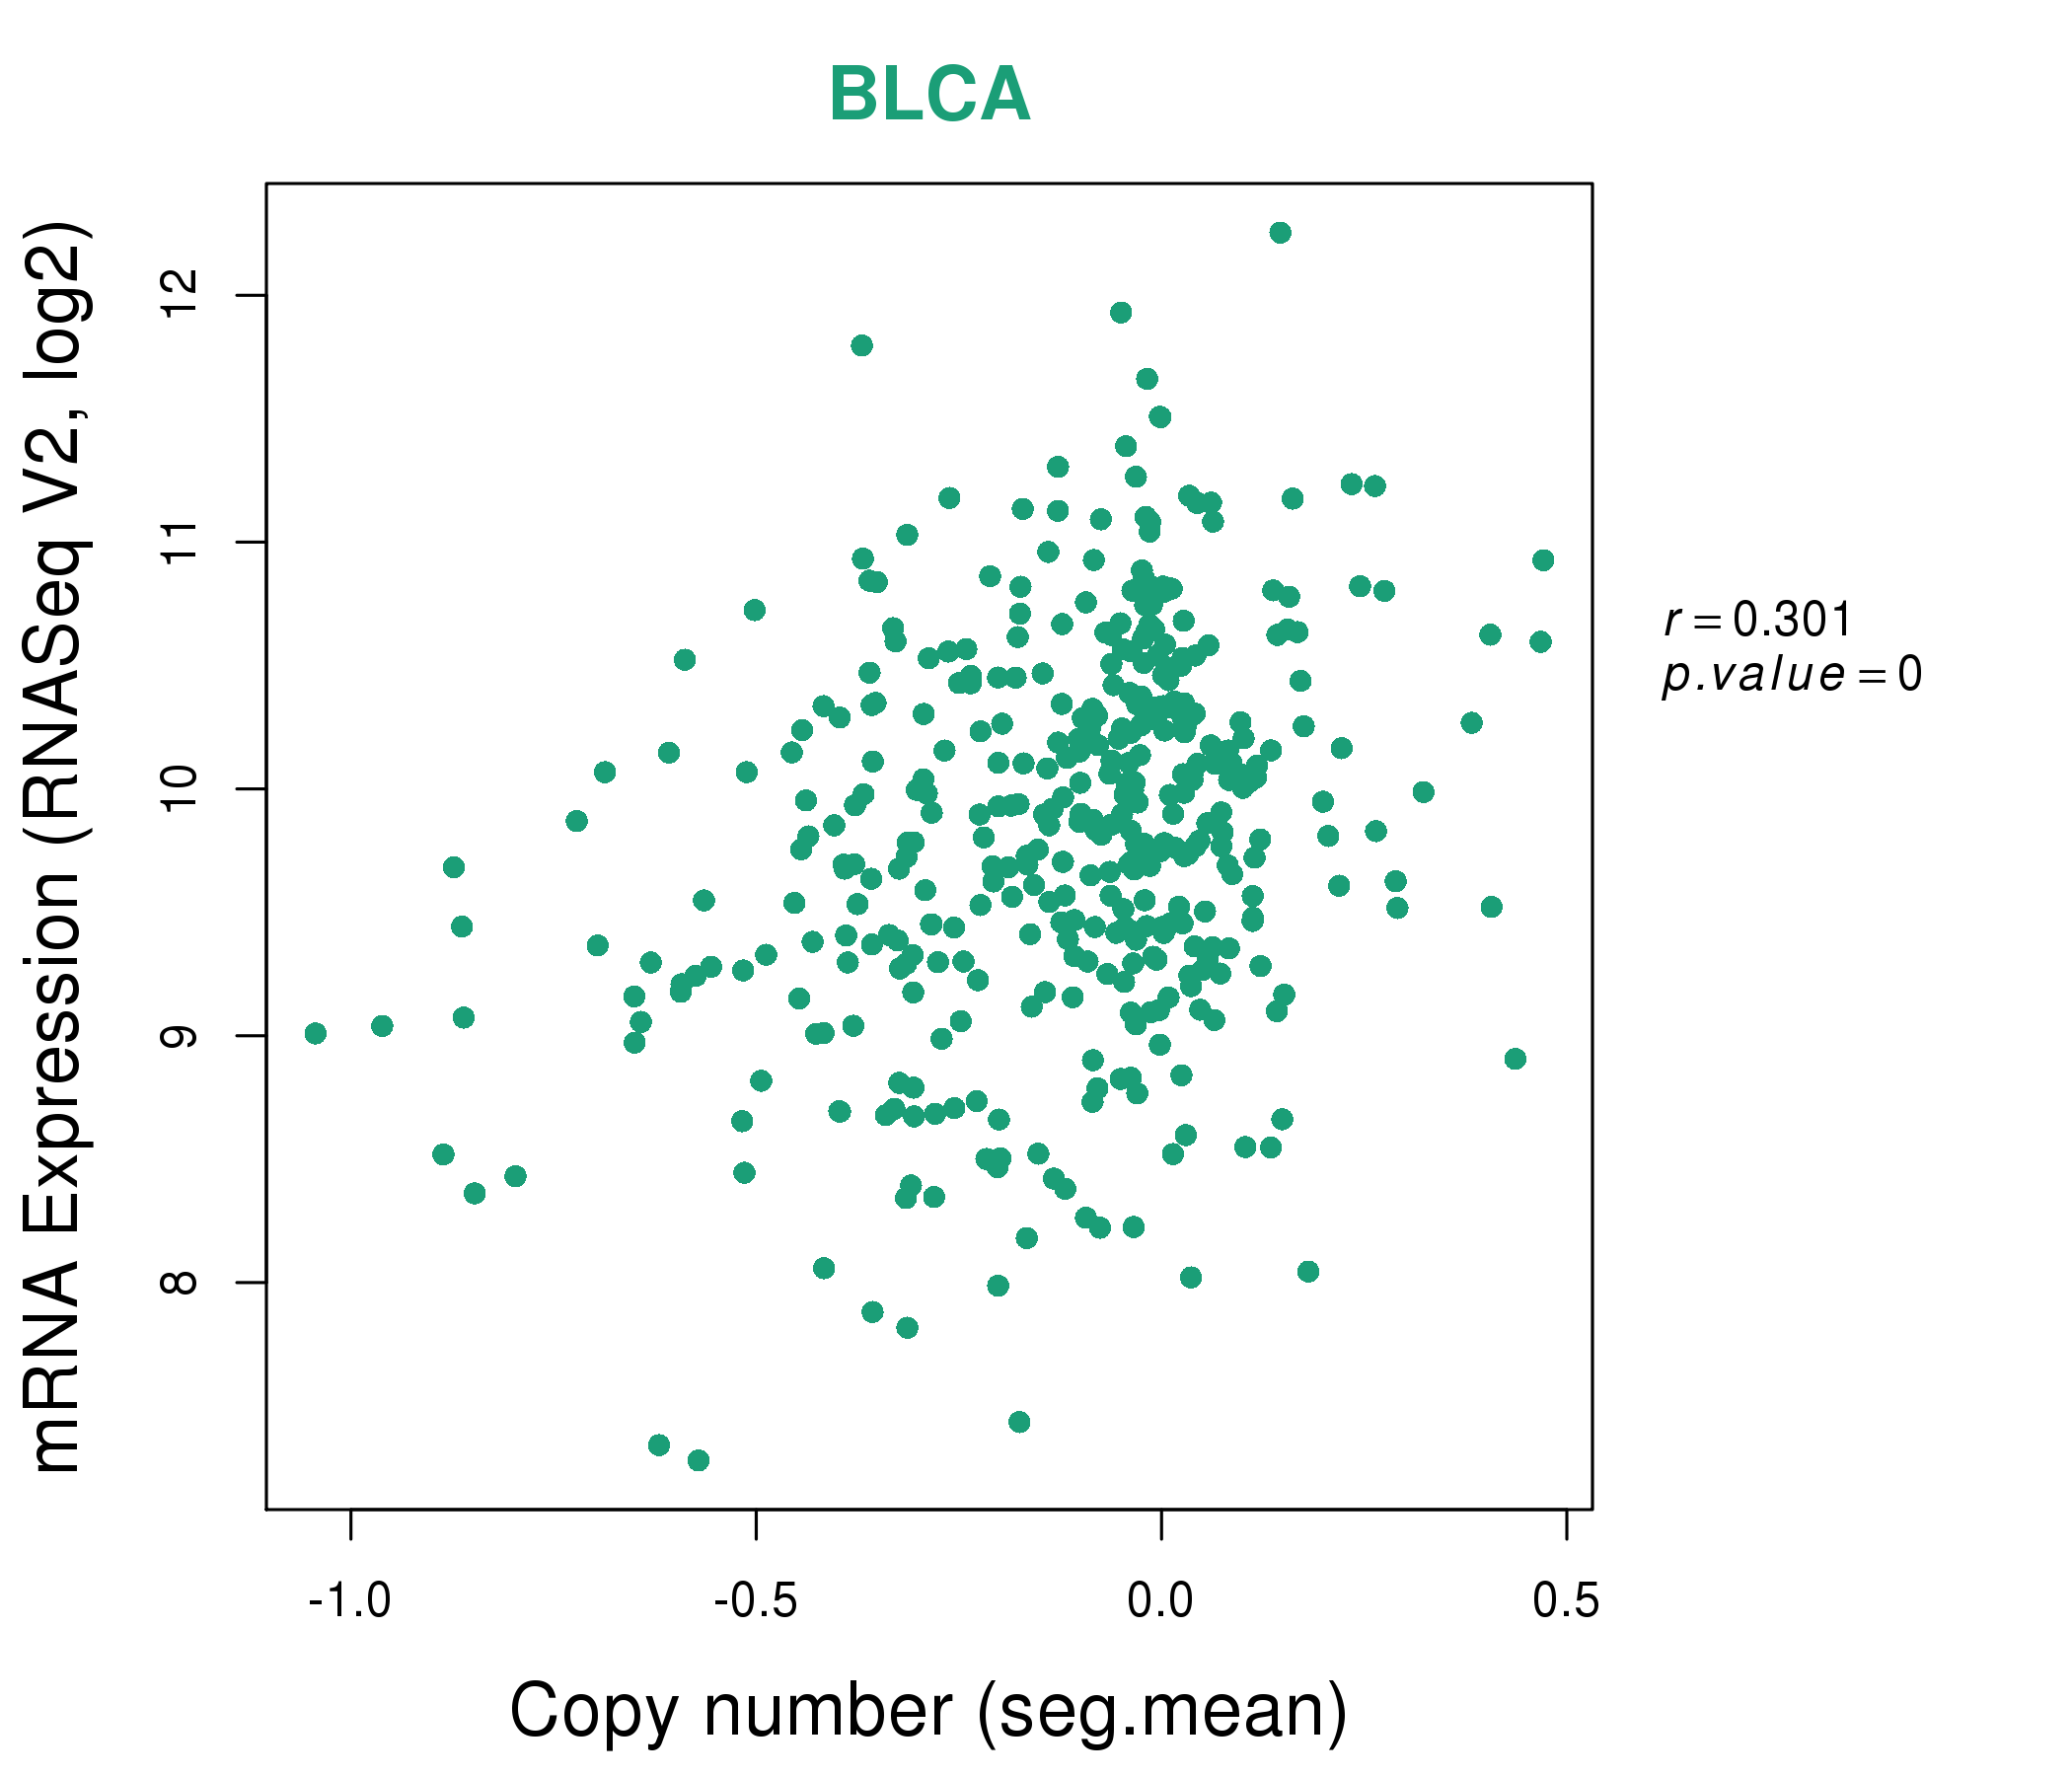
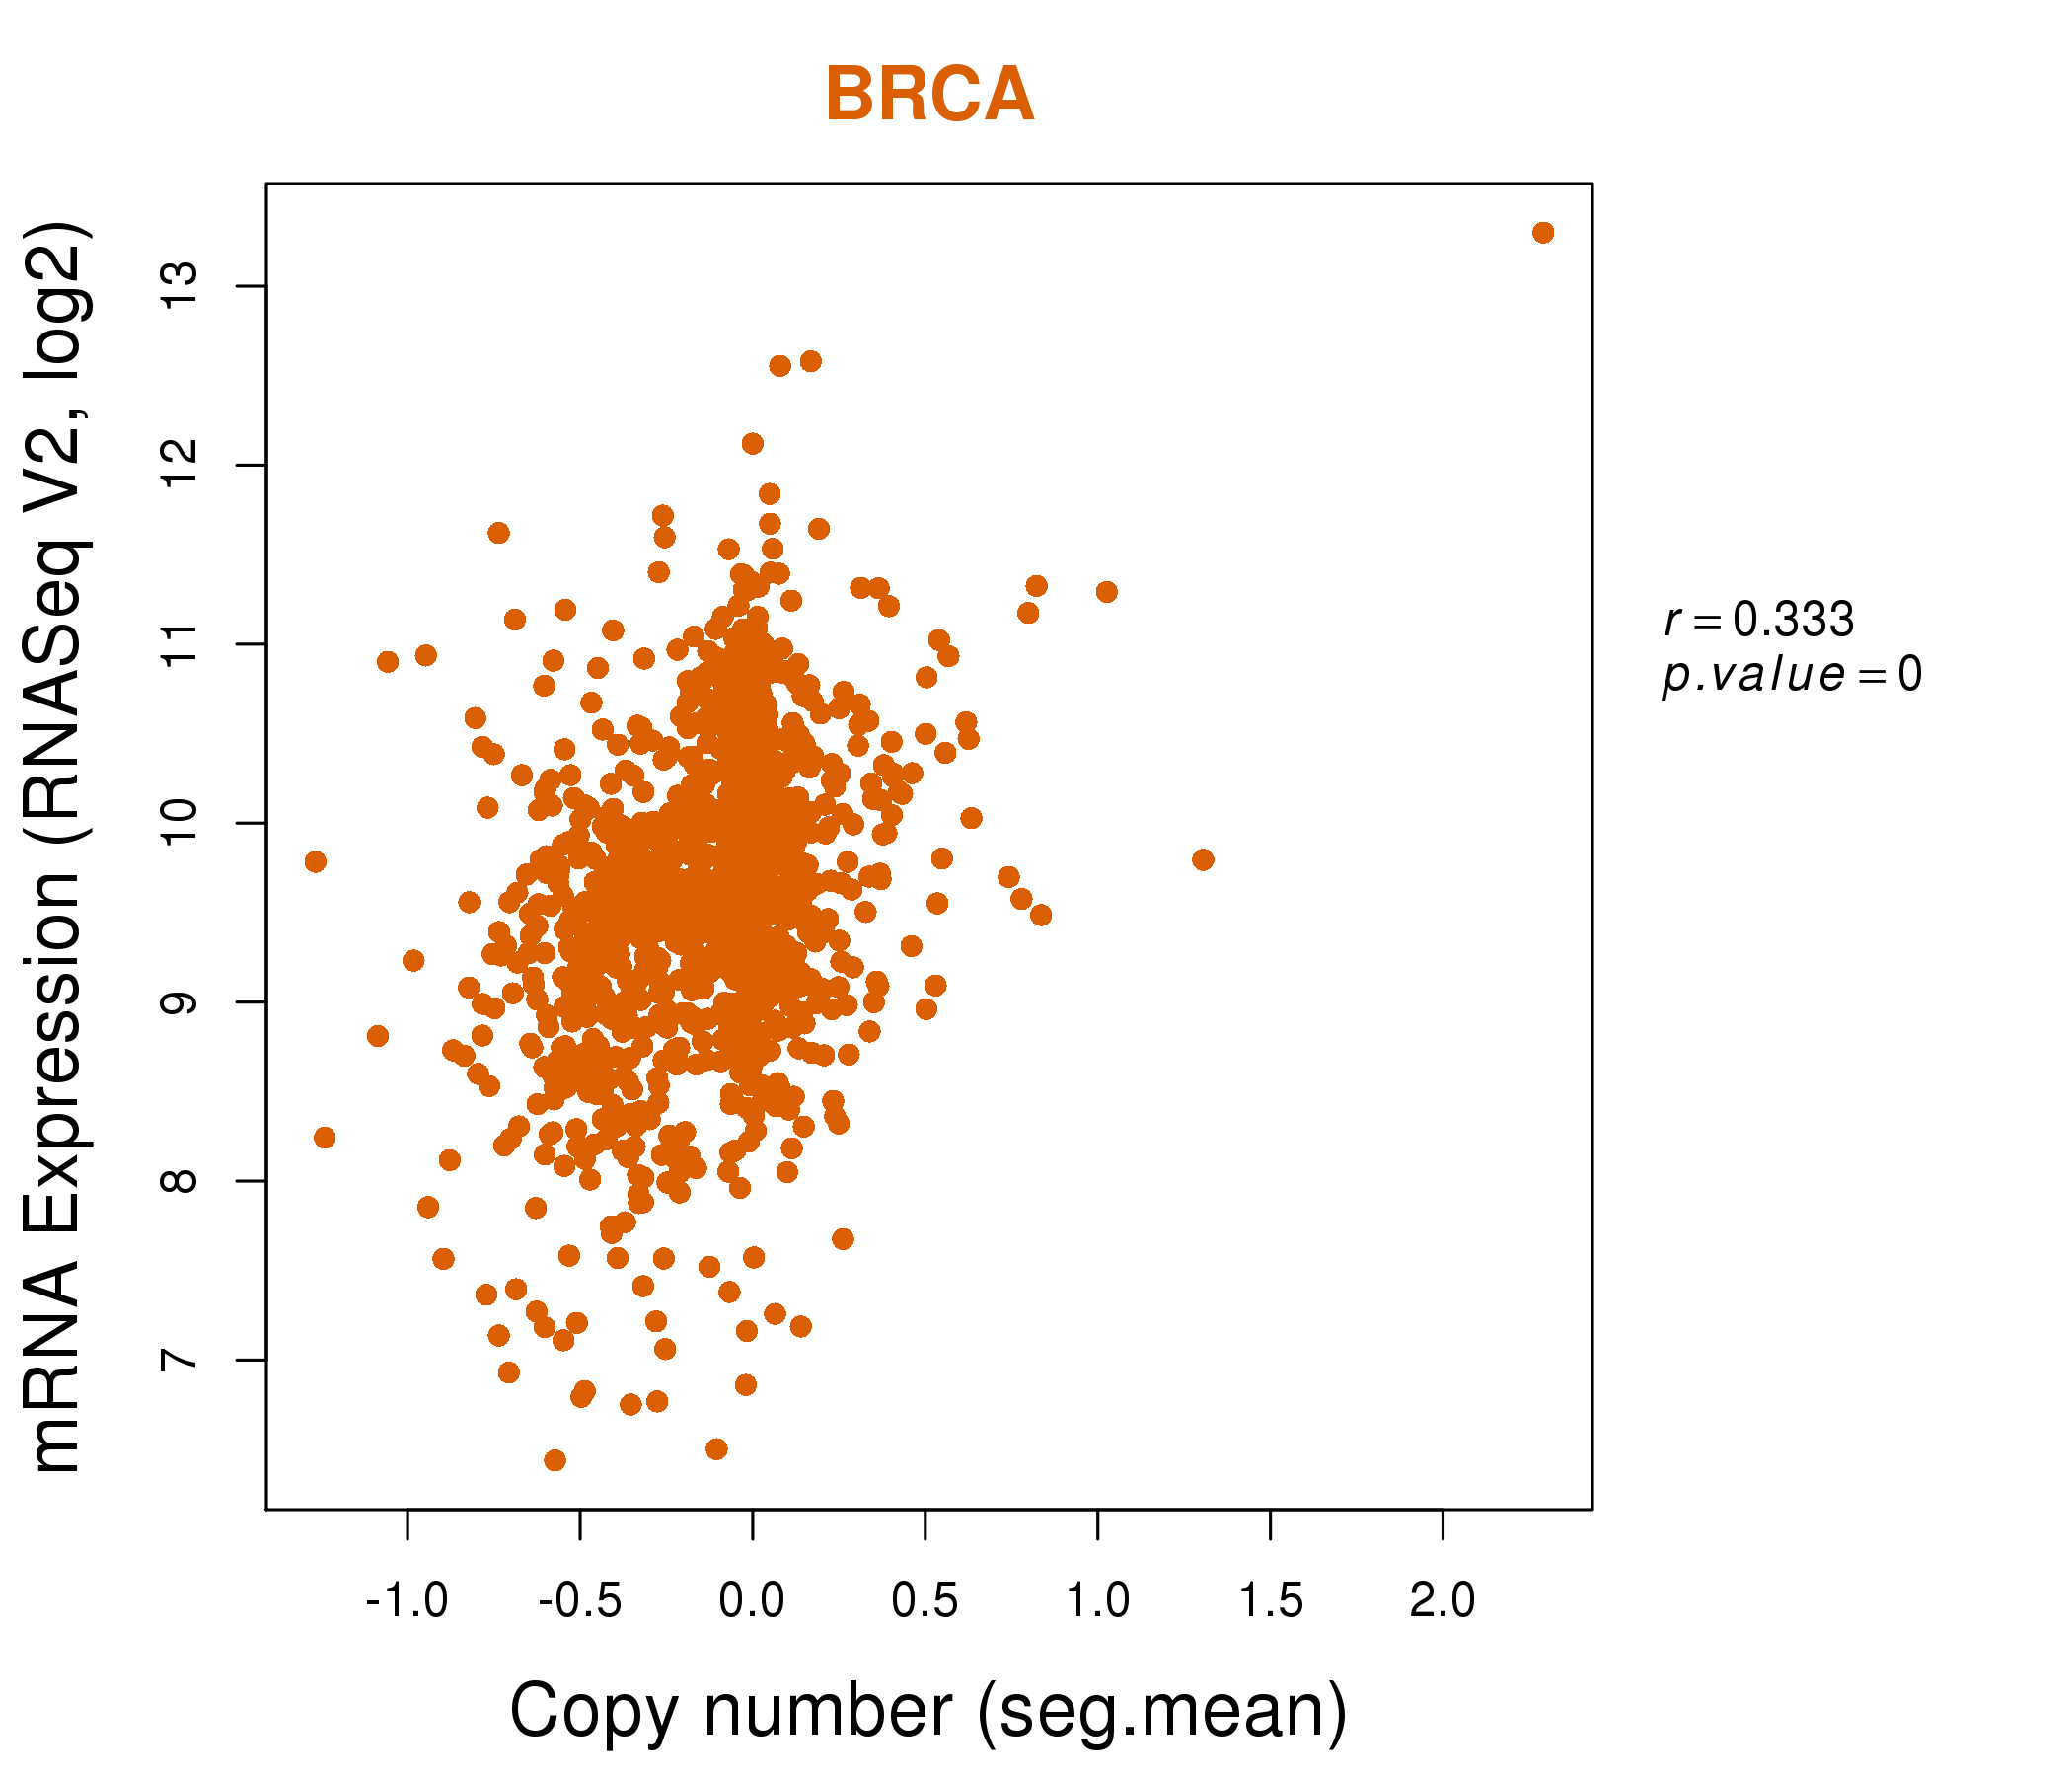
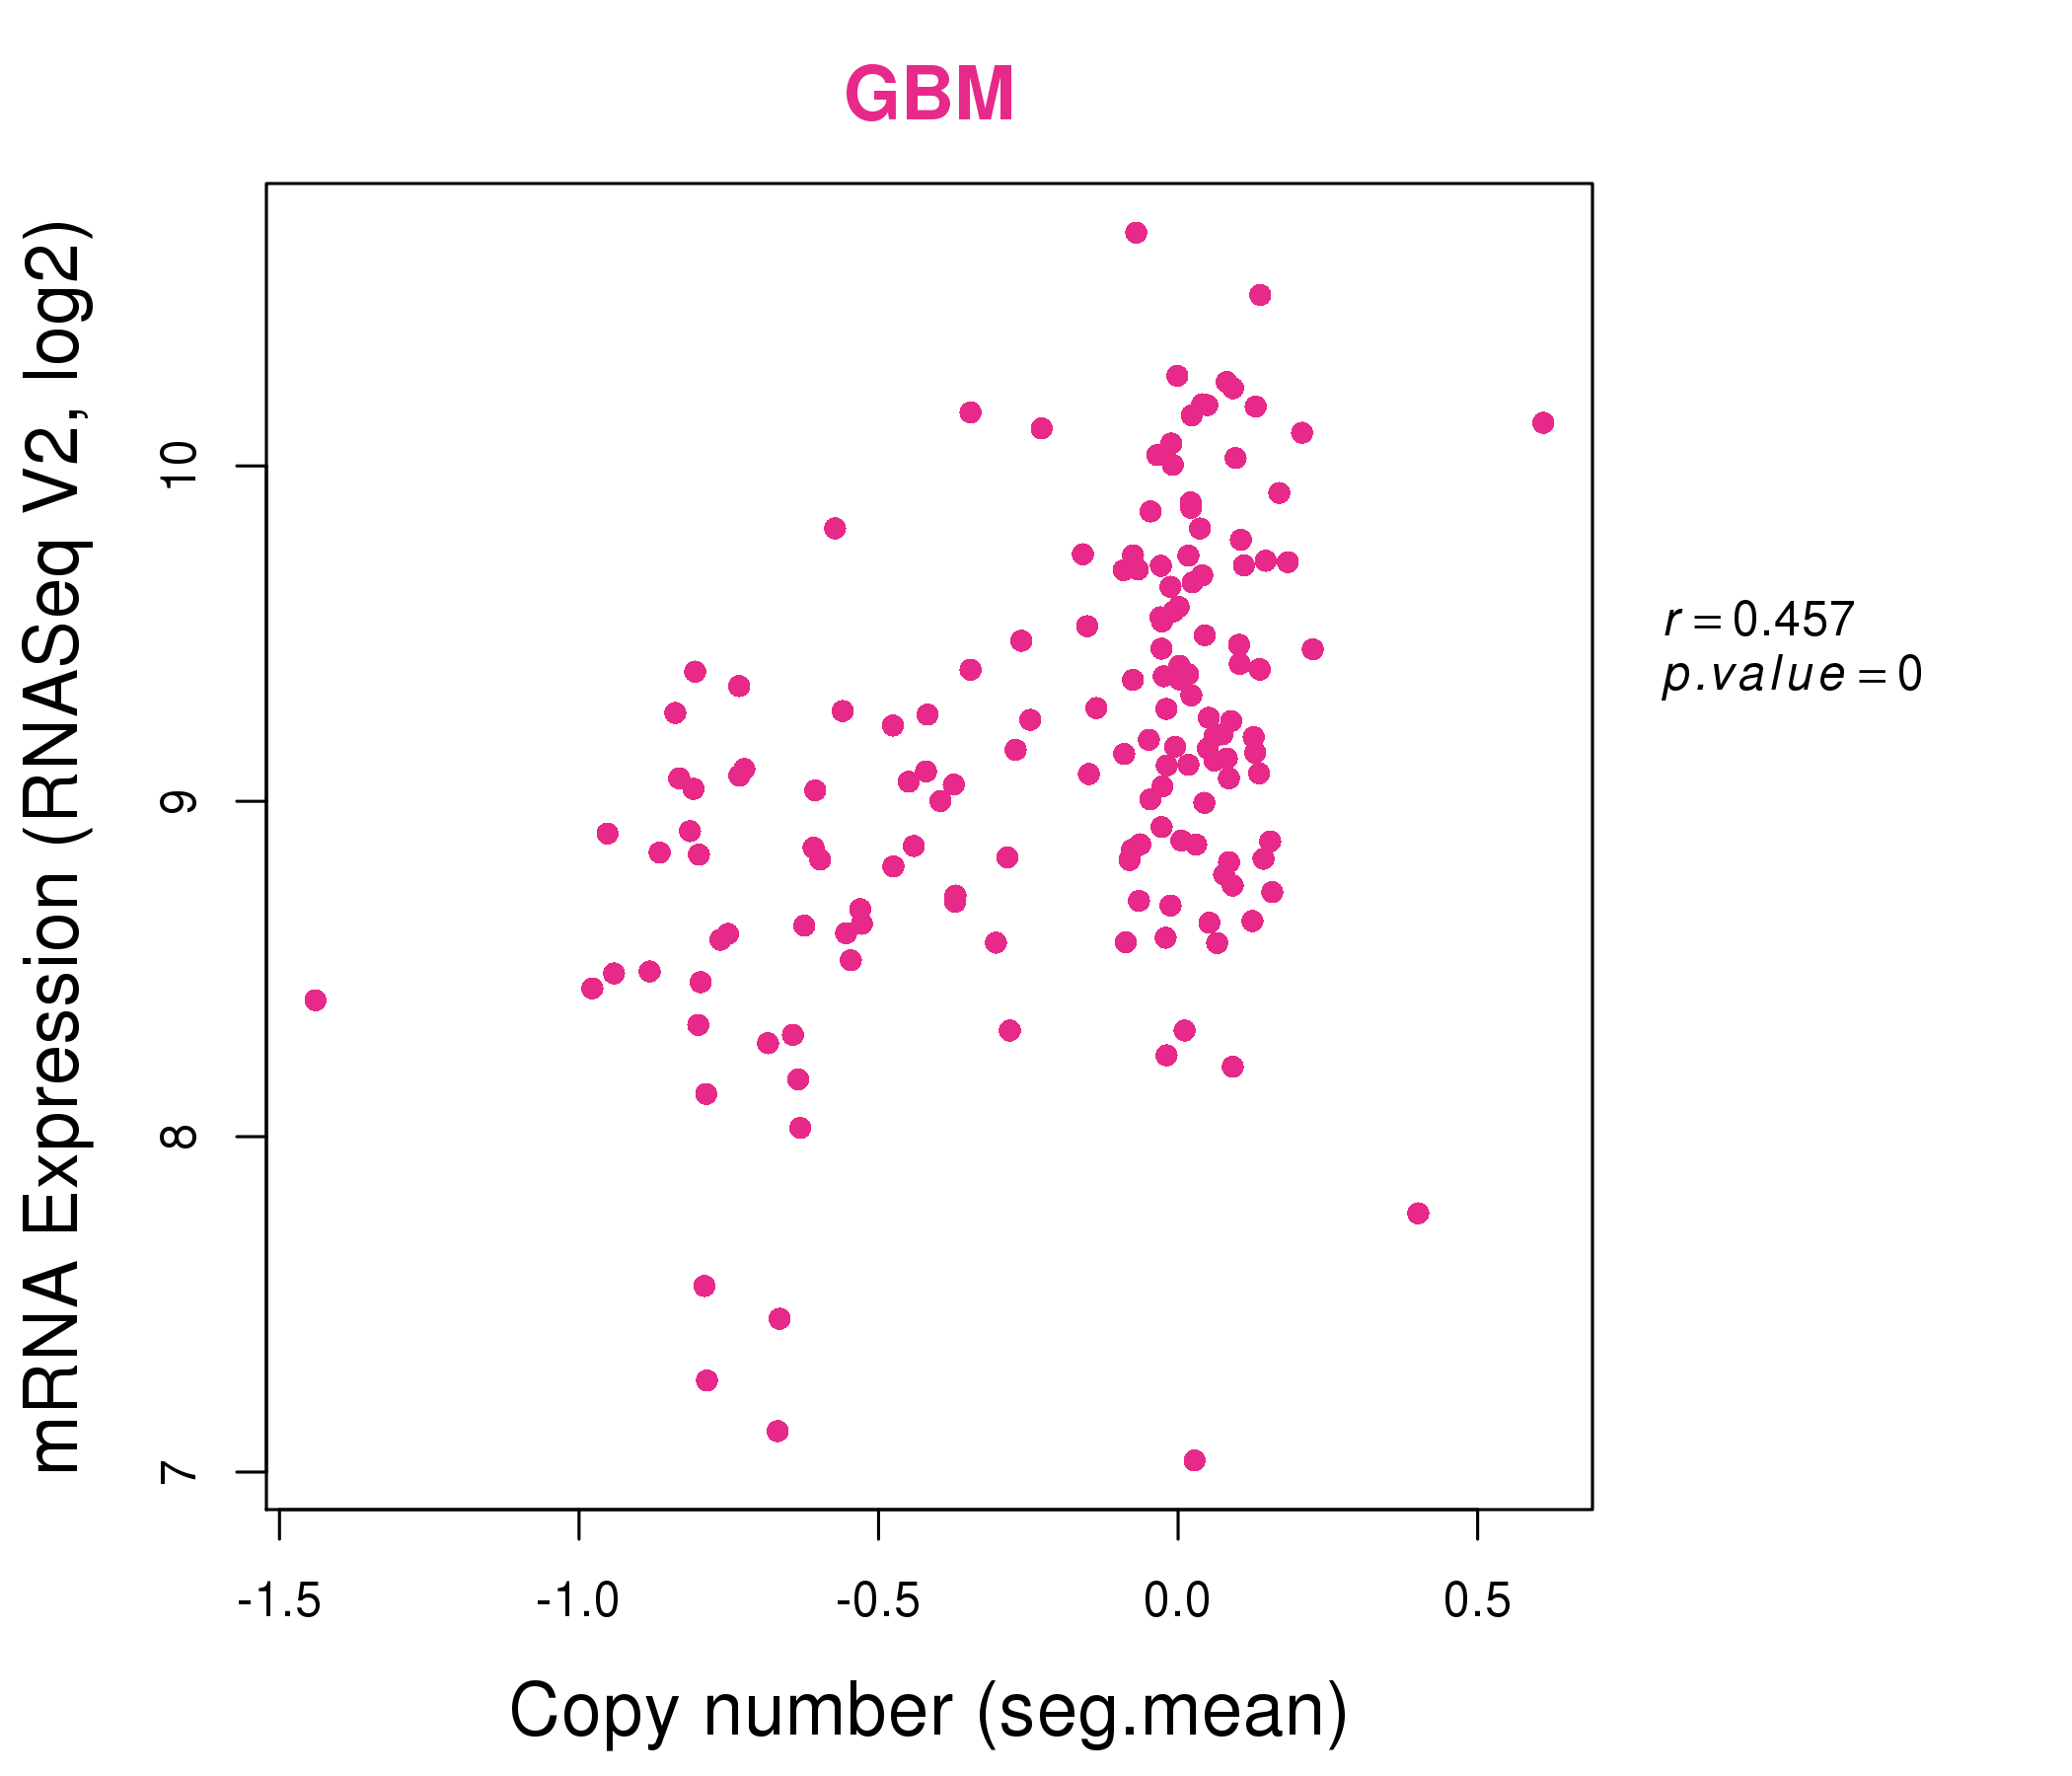
| * This plots show the correlation between CNV and gene expression. |
: Open all plots for all cancer types
 |
|
 |
|
| Top |
| Gene-Gene Network Information |
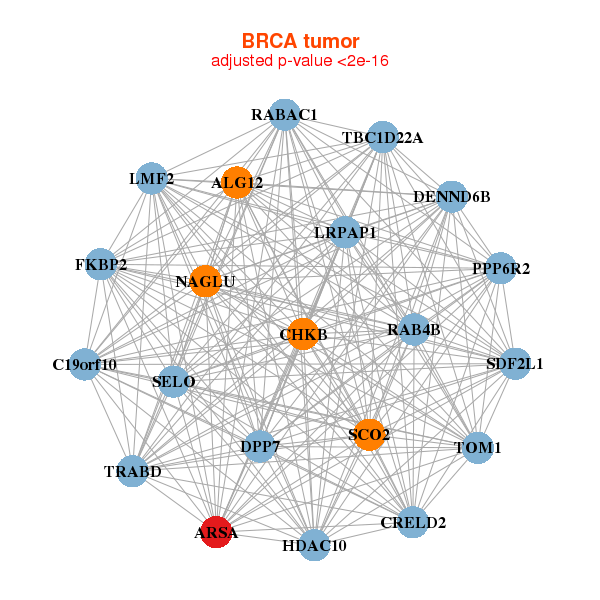
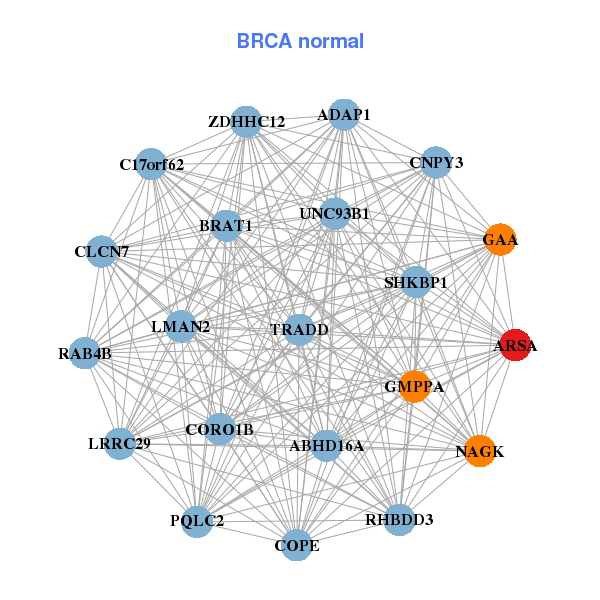
| * Co-Expression network figures were drawn using R package igraph. Only the top 20 genes with the highest correlations were shown. Red circle: input gene, orange circle: cell metabolism gene, sky circle: other gene |
: Open all plots for all cancer types
 |
| ||||
| ALG12,ARSA,C19orf10,CHKB,CRELD2,DPP7,DENND6B, FKBP2,HDAC10,LMF2,LRPAP1,NAGLU,RAB4B,RABAC1, PPP6R2,SCO2,SDF2L1,SELO,TBC1D22A,TOM1,TRABD | ADAP1,ARSA,ABHD16A,C17orf62,BRAT1,CLCN7,CNPY3, COPE,CORO1B,GAA,GMPPA,LMAN2,LRRC29,NAGK, PQLC2,RAB4B,RHBDD3,SHKBP1,TRADD,UNC93B1,ZDHHC12 | ||||
 |
| ||||
| ARFGAP3,ARSA,C11orf86,C1orf94,CAPN11,CLDN23,DHRS9, GDPD2,ISG20,FAM214B,LMF2,MMP28,MYPN,PLAC8, POLD4,SDCBP2,SMPD1,TRANK1,TSPAN1,UGT1A4,VSIG1 | ACP2,ARSA,CTDP1,DENND1C,DKFZp761E198,GMIP,IL17RE, INF2,LGALS3BP,MAST2,MAST3,MBOAT7,PRKCD,RAB40C, RNPEP,RNPEPL1,SIPA1L3,CAPN15,SPINT1,TMC4,VILL |
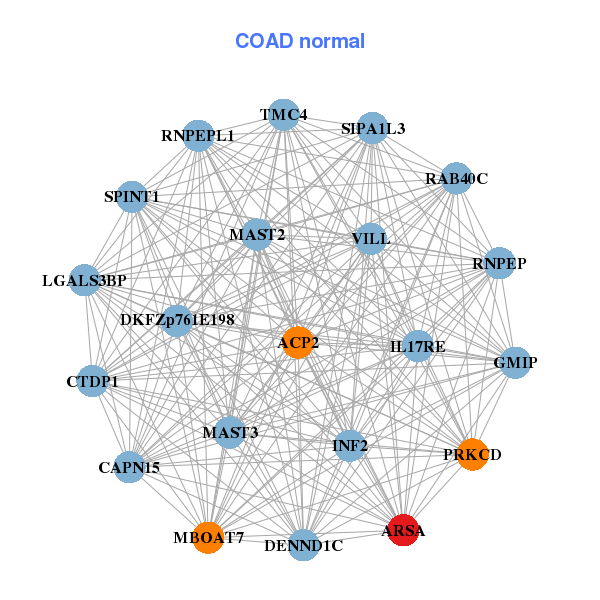
| * Co-Expression network figures were drawn using R package igraph. Only the top 20 genes with the highest correlations were shown. Red circle: input gene, orange circle: cell metabolism gene, sky circle: other gene |
: Open all plots for all cancer types
| Top |
: Open all interacting genes' information including KEGG pathway for all interacting genes from DAVID
| Top |
| Pharmacological Information for ARSA |
| DB Category | DB Name | DB's ID and Url link |
| * Gene Centered Interaction Network. |
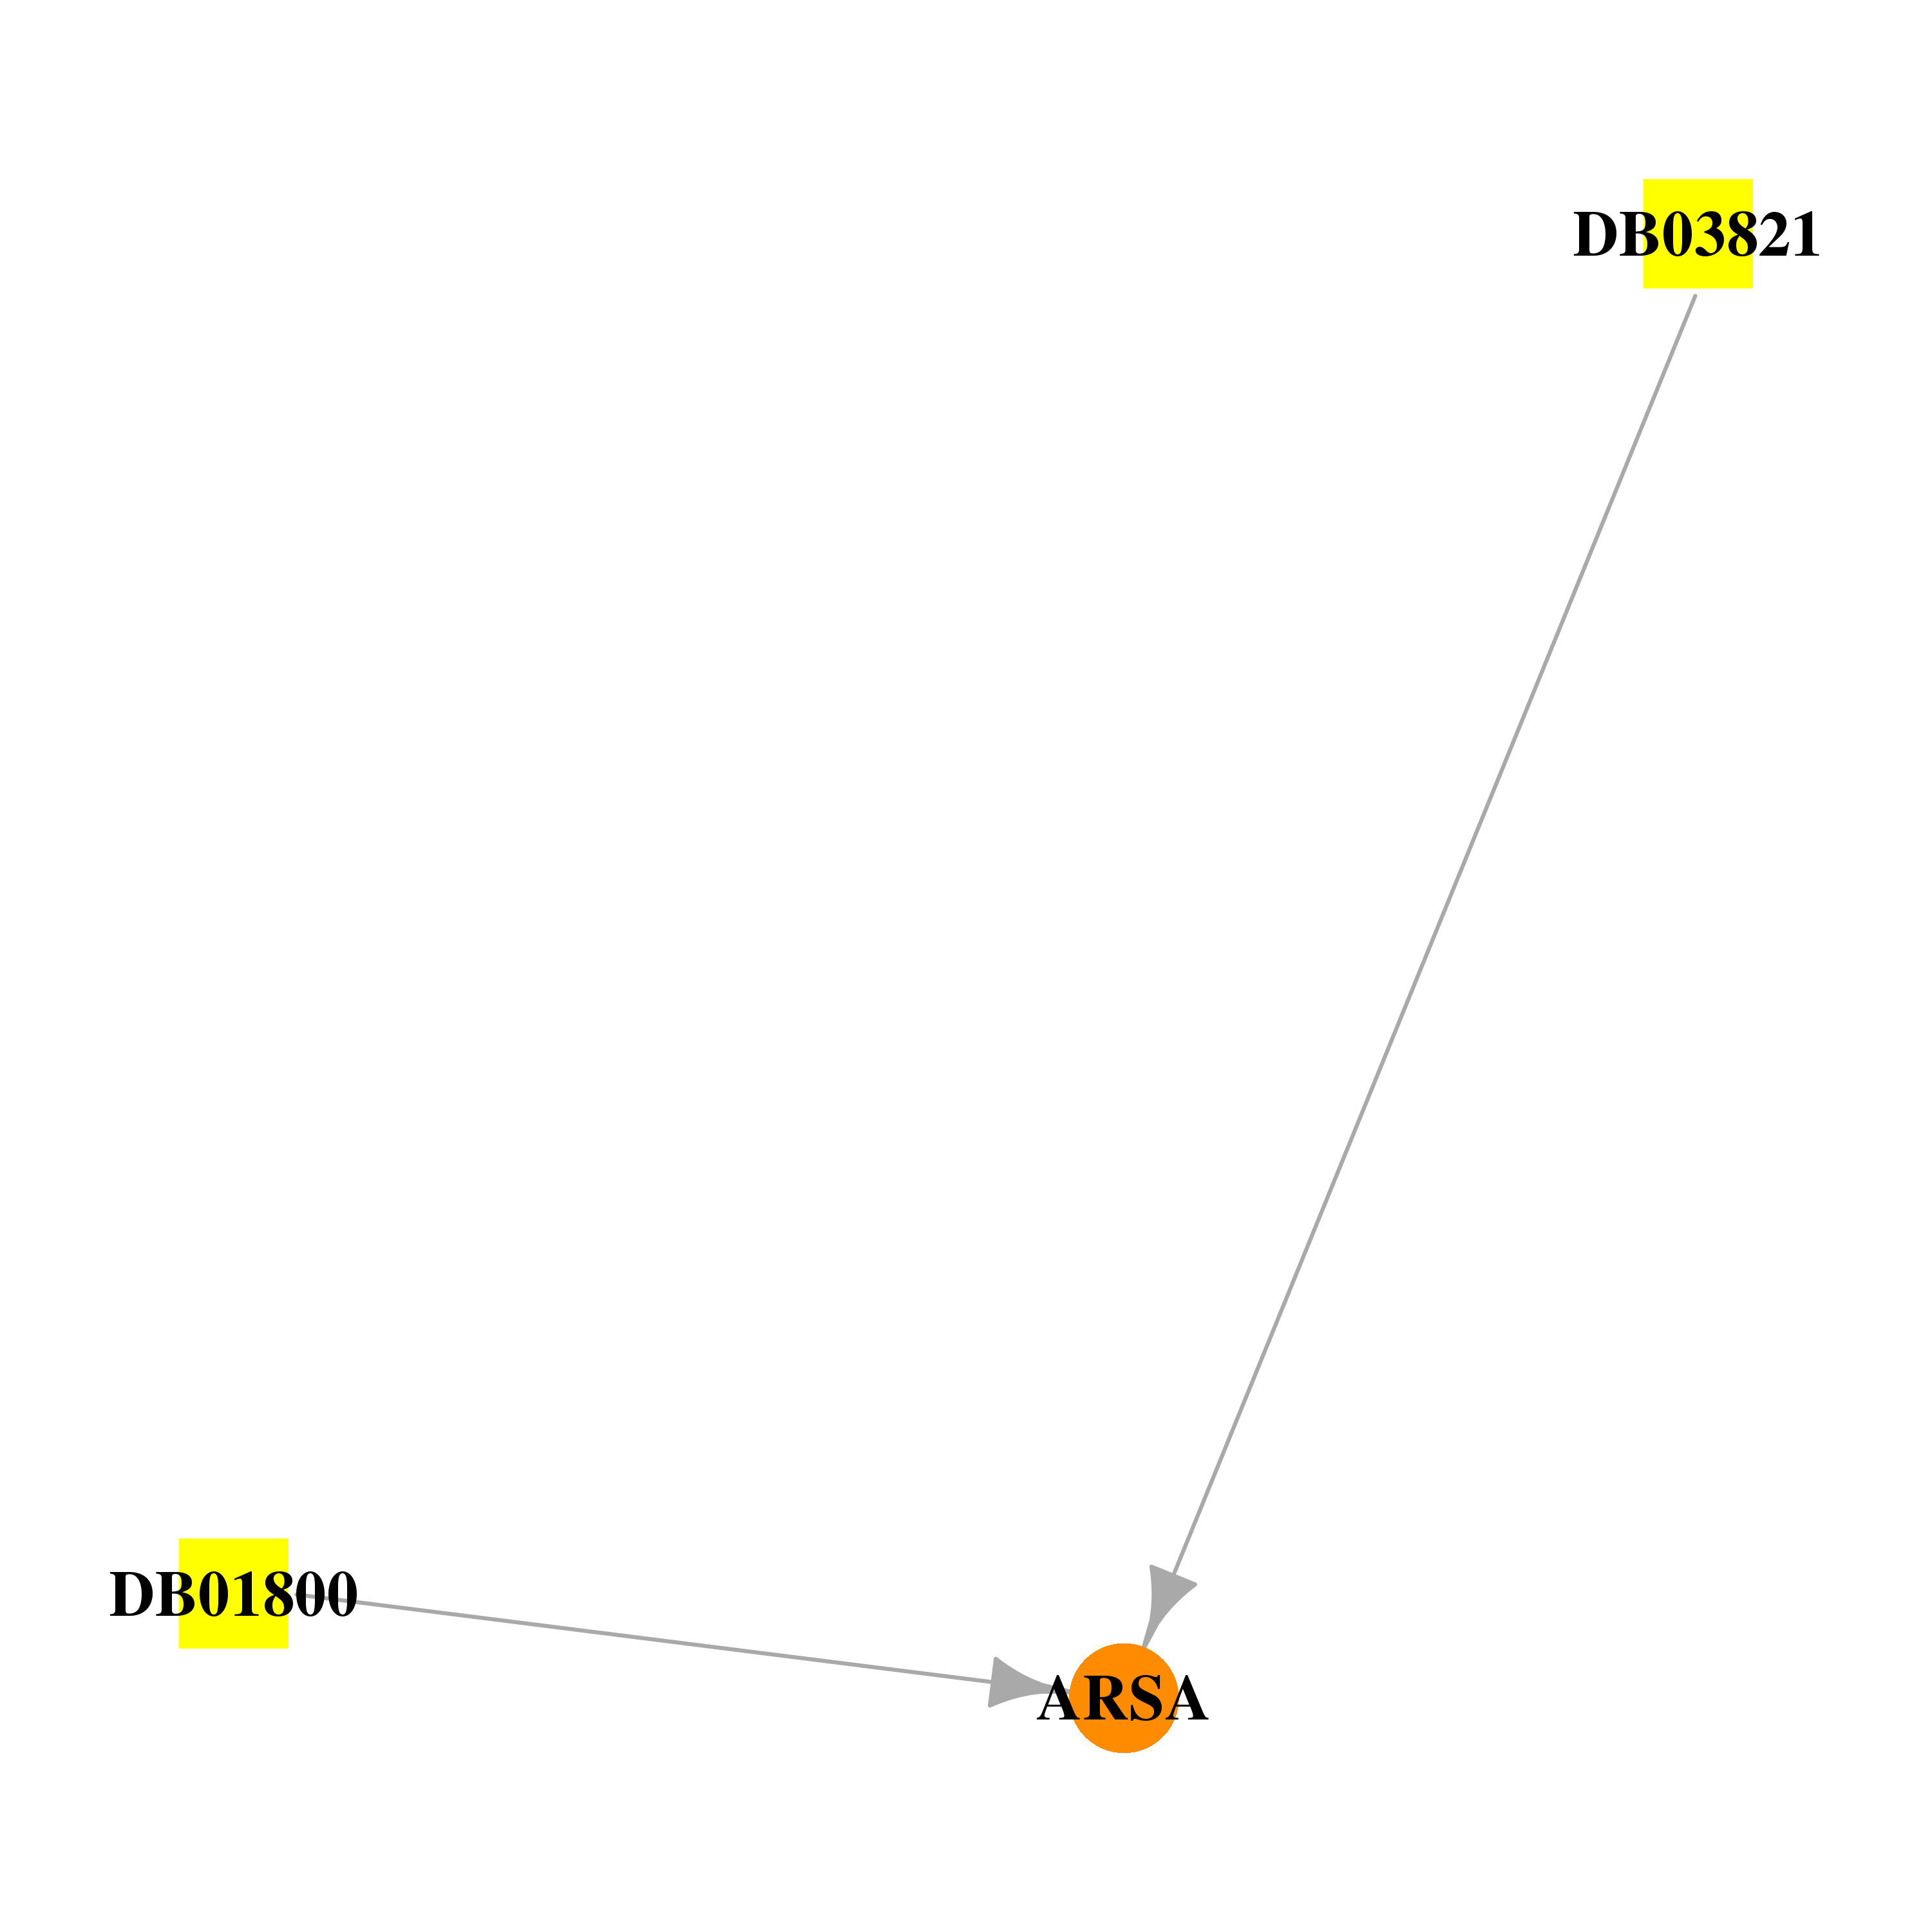 |
| * Drug Centered Interaction Network. |
| DrugBank ID | Target Name | Drug Groups | Generic Name | Drug Centered Network | Drug Structure |
| DB01800 | arylsulfatase A | experimental | N,4-Dihydroxy-N-Oxo-3-(Sulfooxy)Benzenaminium | 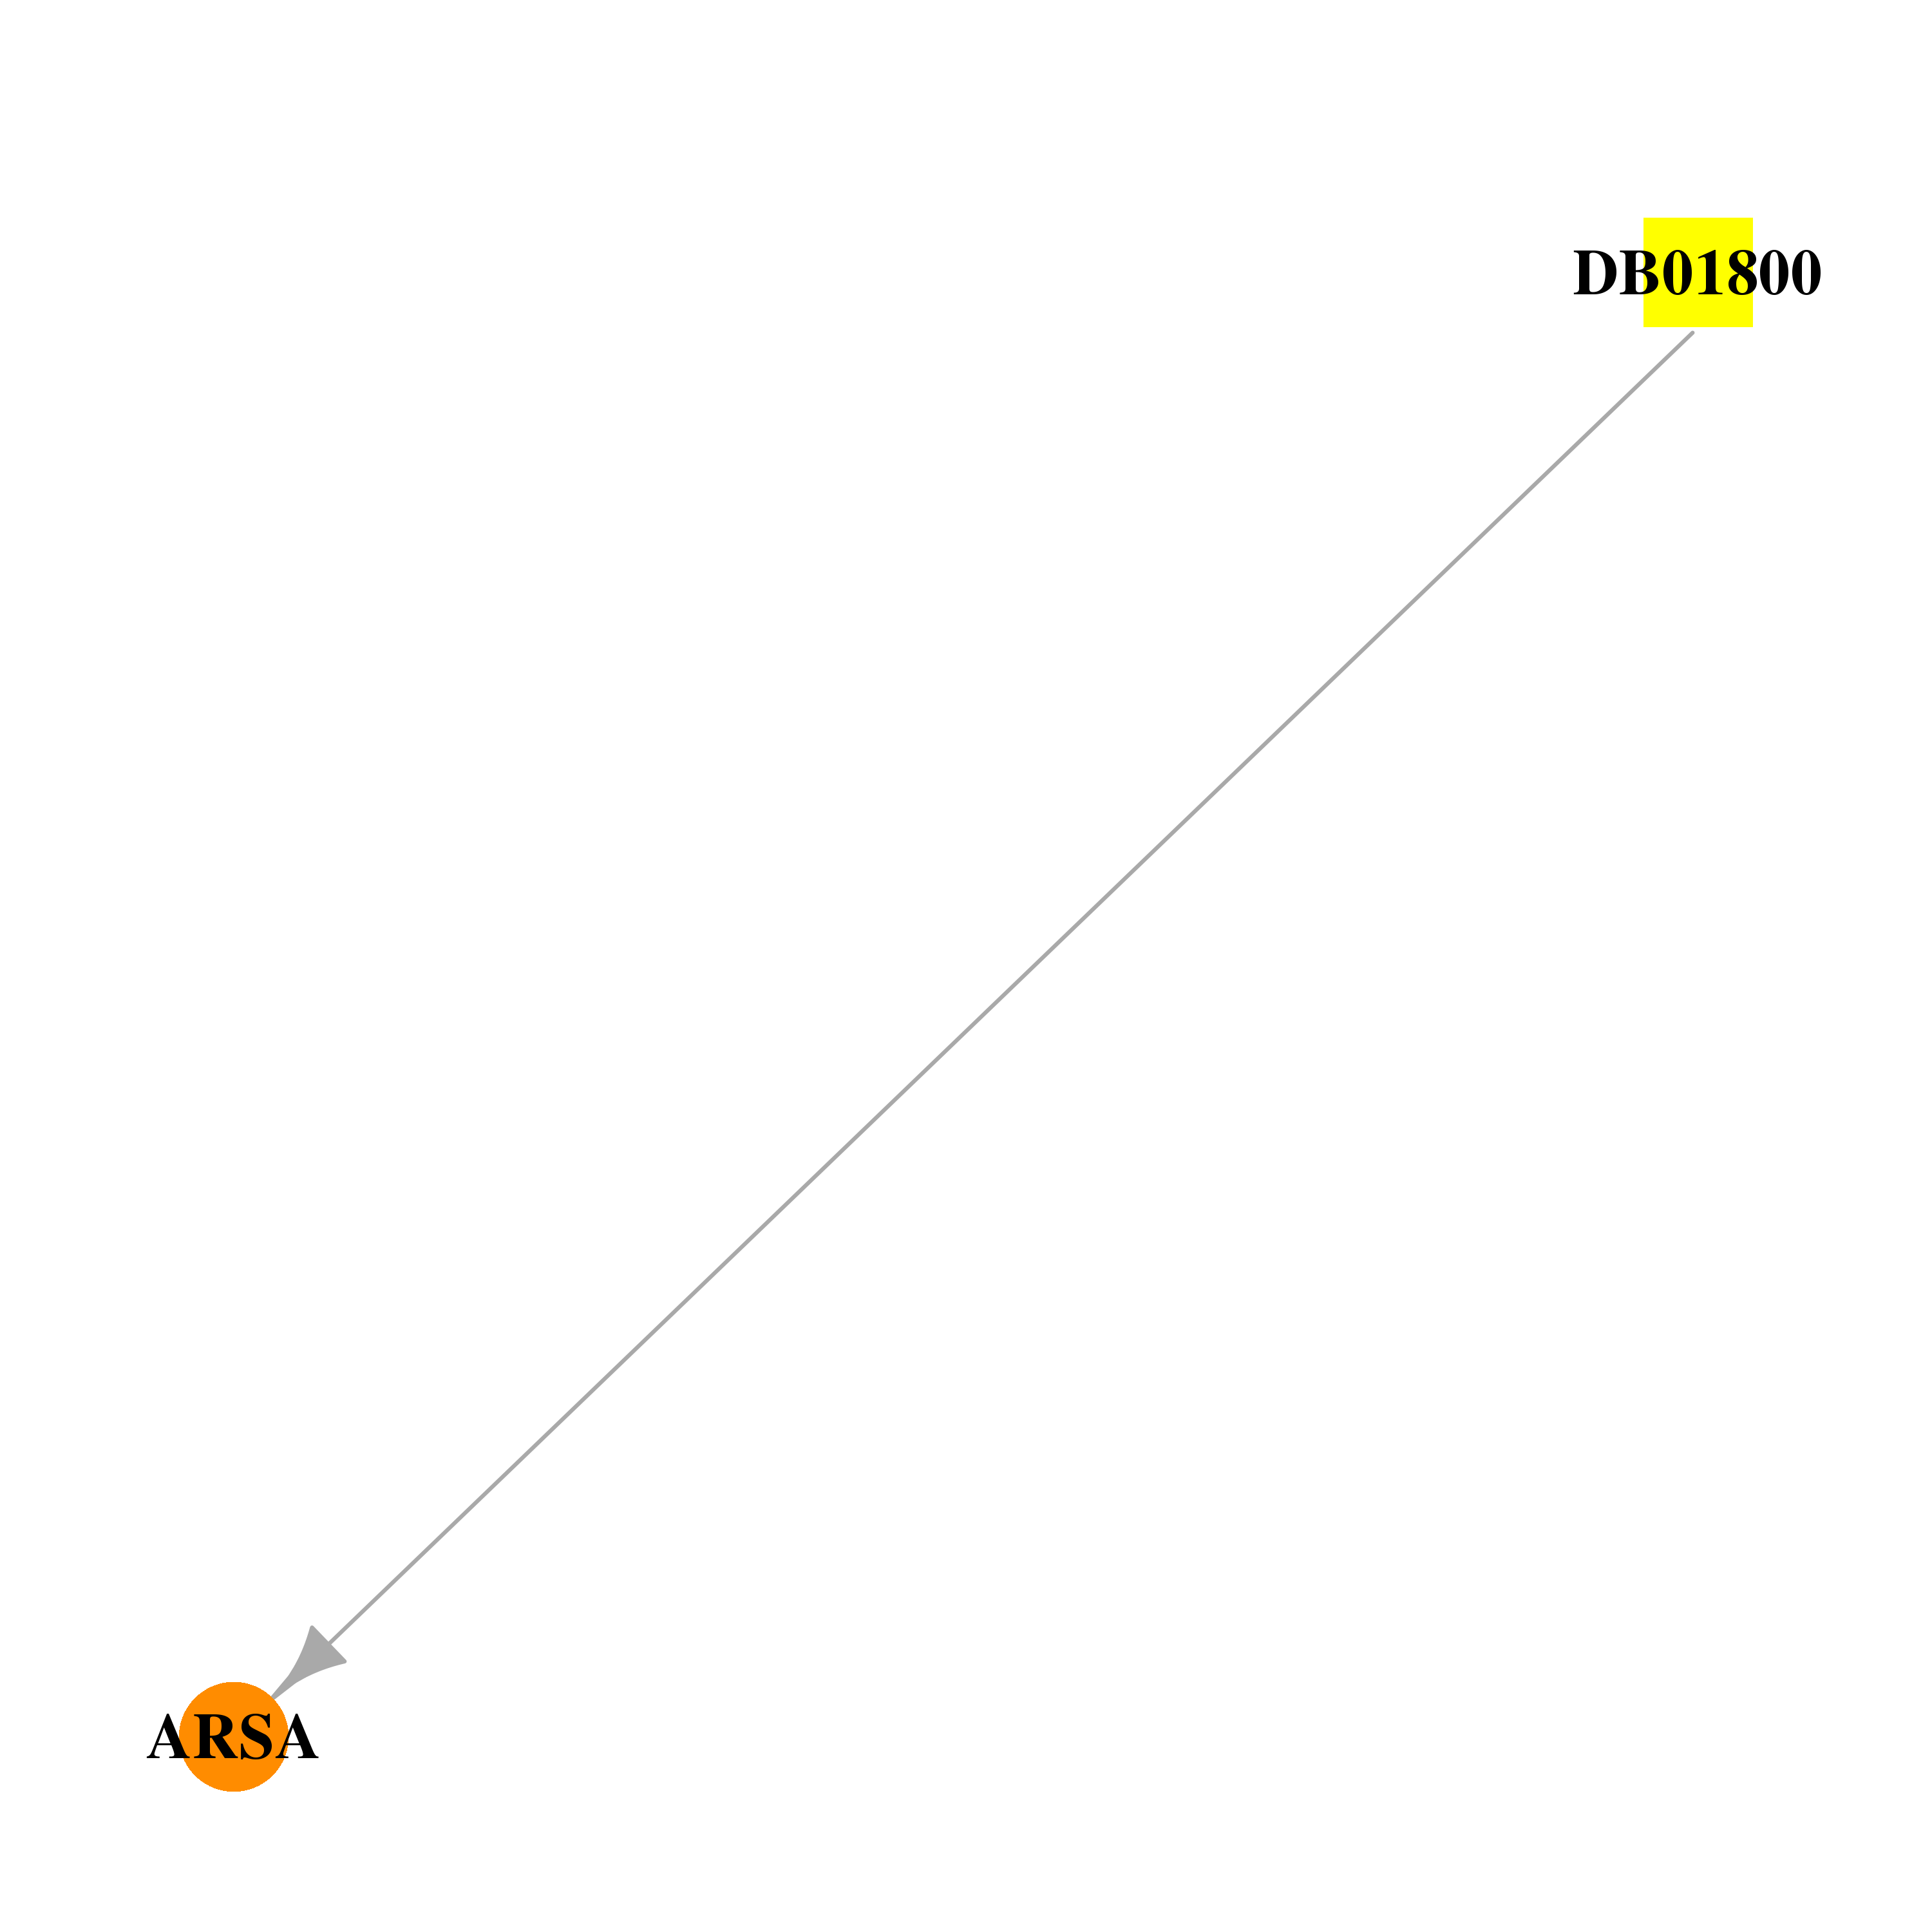 |  |
| DB03821 | arylsulfatase A | experimental | 2-Amino-3-Hydroxy-3-Phosphonooxy-Propionic Acid |  |  |
| Top |
| Cross referenced IDs for ARSA |
| * We obtained these cross-references from Uniprot database. It covers 150 different DBs, 18 categories. http://www.uniprot.org/help/cross_references_section |
: Open all cross reference information
|
Copyright © 2016-Present - The Univsersity of Texas Health Science Center at Houston @ |