|
||||||||||||||||||||
| |
| Phenotypic Information (metabolism pathway, cancer, disease, phenome) |
| |
| |
| Gene-Gene Network Information: Co-Expression Network, Interacting Genes & KEGG |
| |
|


| Gene Summary for MAGOH |
| Basic gene info. | Gene symbol | MAGOH |
| Gene name | mago-nashi homolog, proliferation-associated (Drosophila) | |
| Synonyms | MAGOH1|MAGOHA | |
| Cytomap | UCSC genome browser: 1p32.3 | |
| Genomic location | chr1 :53692563-53704282 | |
| Type of gene | protein-coding | |
| RefGenes | NM_002370.3, | |
| Ensembl id | ENSG00000162385 | |
| Description | protein mago nashi homolog | |
| Modification date | 20141211 | |
| dbXrefs | MIM : 602603 | |
| HGNC : HGNC | ||
| Ensembl : ENSG00000162385 | ||
| HPRD : 04005 | ||
| Vega : OTTHUMG00000008932 | ||
| Protein | UniProt: go to UniProt's Cross Reference DB Table | |
| Expression | CleanEX: HS_MAGOH | |
| BioGPS: 4116 | ||
| Gene Expression Atlas: ENSG00000162385 | ||
| The Human Protein Atlas: ENSG00000162385 | ||
| Pathway | NCI Pathway Interaction Database: MAGOH | |
| KEGG: MAGOH | ||
| REACTOME: MAGOH | ||
| ConsensusPathDB | ||
| Pathway Commons: MAGOH | ||
| Metabolism | MetaCyc: MAGOH | |
| HUMANCyc: MAGOH | ||
| Regulation | Ensembl's Regulation: ENSG00000162385 | |
| miRBase: chr1 :53,692,563-53,704,282 | ||
| TargetScan: NM_002370 | ||
| cisRED: ENSG00000162385 | ||
| Context | iHOP: MAGOH | |
| cancer metabolism search in PubMed: MAGOH | ||
| UCL Cancer Institute: MAGOH | ||
| Assigned class in ccmGDB | C | |
| Top |
| Phenotypic Information for MAGOH(metabolism pathway, cancer, disease, phenome) |
| Cancer | CGAP: MAGOH |
| Familial Cancer Database: MAGOH | |
| * This gene is included in those cancer gene databases. |
|
|
|
|
|
| . | ||||||||||||||
Oncogene 1 | Significant driver gene in | |||||||||||||||||||
| cf) number; DB name 1 Oncogene; http://nar.oxfordjournals.org/content/35/suppl_1/D721.long, 2 Tumor Suppressor gene; https://bioinfo.uth.edu/TSGene/, 3 Cancer Gene Census; http://www.nature.com/nrc/journal/v4/n3/abs/nrc1299.html, 4 CancerGenes; http://nar.oxfordjournals.org/content/35/suppl_1/D721.long, 5 Network of Cancer Gene; http://ncg.kcl.ac.uk/index.php, 1Therapeutic Vulnerabilities in Cancer; http://cbio.mskcc.org/cancergenomics/statius/ |
| REACTOME_METABOLISM_OF_MRNA REACTOME_METABOLISM_OF_RNA | |
| OMIM | |
| Orphanet | |
| Disease | KEGG Disease: MAGOH |
| MedGen: MAGOH (Human Medical Genetics with Condition) | |
| ClinVar: MAGOH | |
| Phenotype | MGI: MAGOH (International Mouse Phenotyping Consortium) |
| PhenomicDB: MAGOH | |
| Mutations for MAGOH |
| * Under tables are showing count per each tissue to give us broad intuition about tissue specific mutation patterns.You can go to the detailed page for each mutation database's web site. |
| There's no structural variation information in COSMIC data for this gene. |
| * From mRNA Sanger sequences, Chitars2.0 arranged chimeric transcripts. This table shows MAGOH related fusion information. |
| ID | Head Gene | Tail Gene | Accession | Gene_a | qStart_a | qEnd_a | Chromosome_a | tStart_a | tEnd_a | Gene_a | qStart_a | qEnd_a | Chromosome_a | tStart_a | tEnd_a |
| BX109950 | MRPL48 | 82 | 466 | 11 | 73568878 | 73569262 | MAGOH | 457 | 583 | 1 | 53695914 | 53696039 | |
| AK130943 | MAGOH | 1 | 1291 | 1 | 53700865 | 53702155 | SH3GL1 | 1286 | 2746 | 19 | 4383396 | 4384856 | |
| Top |
| There's no copy number variation information in COSMIC data for this gene. |
| Top |
|
 |
| Top |
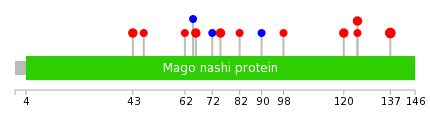
| Stat. for Non-Synonymous SNVs (# total SNVs=10) | (# total SNVs=3) |
 |  |
(# total SNVs=0) | (# total SNVs=0) |
| Top |
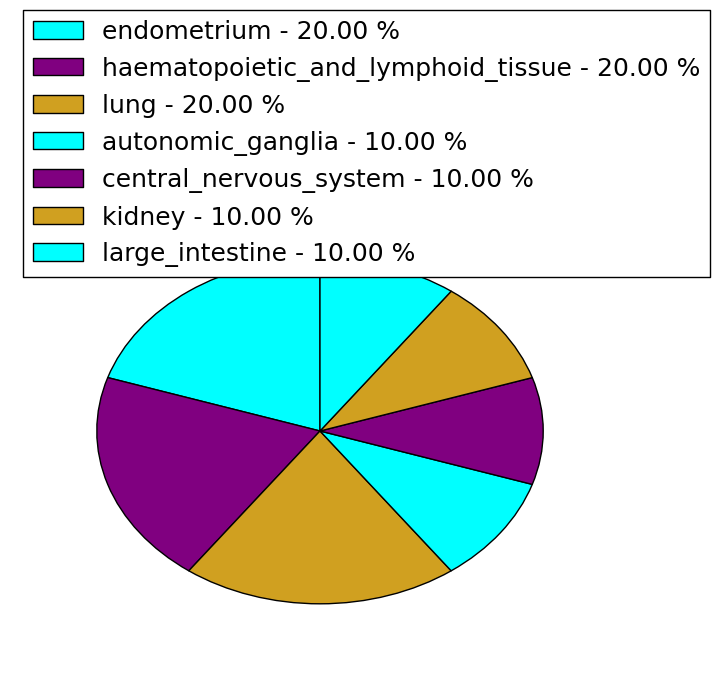
| * When you move the cursor on each content, you can see more deailed mutation information on the Tooltip. Those are primary_site,primary_histology,mutation(aa),pubmedID. |
| GRCh37 position | Mutation(aa) | Unique sampleID count |
| chr1:53692748-53692748 | p.I137T | 4 |
| chr1:53692785-53692785 | p.L125F | 3 |
| chr1:53699276-53699276 | p.D66N | 2 |
| chr1:53692799-53692799 | p.R120Q | 2 |
| chr1:53701267-53701267 | p.D43E | 2 |
| chr1:53699249-53699249 | p.A75T | 2 |
| chr1:53699256-53699256 | p.E72E | 1 |
| chr1:53699277-53699277 | p.D65D | 1 |
| chr1:53692717-53692717 | p.*147* | 1 |
| chr1:53699287-53699287 | p.R62T | 1 |
| Top |
|
 |
| Point Mutation/ Tissue ID | 1 | 2 | 3 | 4 | 5 | 6 | 7 | 8 | 9 | 10 | 11 | 12 | 13 | 14 | 15 | 16 | 17 | 18 | 19 | 20 |
| # sample | 2 | 1 | 1 | 1 | 2 | 1 | 1 | 3 | ||||||||||||
| # mutation | 2 | 1 | 1 | 1 | 2 | 1 | 1 | 3 | ||||||||||||
| nonsynonymous SNV | 2 | 1 | 1 | 2 | 1 | 2 | ||||||||||||||
| synonymous SNV | 1 | 1 | 1 |
| cf) Tissue ID; Tissue type (1; BLCA[Bladder Urothelial Carcinoma], 2; BRCA[Breast invasive carcinoma], 3; CESC[Cervical squamous cell carcinoma and endocervical adenocarcinoma], 4; COAD[Colon adenocarcinoma], 5; GBM[Glioblastoma multiforme], 6; Glioma Low Grade, 7; HNSC[Head and Neck squamous cell carcinoma], 8; KICH[Kidney Chromophobe], 9; KIRC[Kidney renal clear cell carcinoma], 10; KIRP[Kidney renal papillary cell carcinoma], 11; LAML[Acute Myeloid Leukemia], 12; LUAD[Lung adenocarcinoma], 13; LUSC[Lung squamous cell carcinoma], 14; OV[Ovarian serous cystadenocarcinoma ], 15; PAAD[Pancreatic adenocarcinoma], 16; PRAD[Prostate adenocarcinoma], 17; SKCM[Skin Cutaneous Melanoma], 18:STAD[Stomach adenocarcinoma], 19:THCA[Thyroid carcinoma], 20:UCEC[Uterine Corpus Endometrial Carcinoma]) |
| Top |
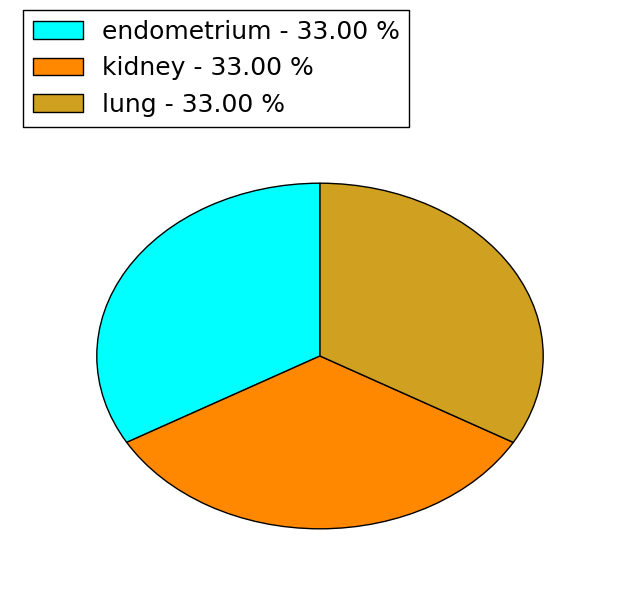
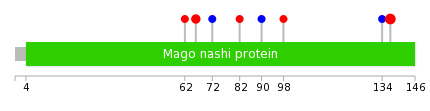
| * We represented just top 10 SNVs. When you move the cursor on each content, you can see more deailed mutation information on the Tooltip. Those are primary_site, primary_histology, mutation(aa), pubmedID. |
| Genomic Position | Mutation(aa) | Unique sampleID count |
| chr1:53692748 | p.I137T | 4 |
| chr1:53699276 | p.D66N | 2 |
| chr1:53692756 | p.F134F | 1 |
| chr1:53694592 | p.S98Y | 1 |
| chr1:53694615 | p.I90I | 1 |
| chr1:53699227 | p.R82Q | 1 |
| chr1:53699256 | p.E72E | 1 |
| chr1:53699287 | p.R62T | 1 |
| * Copy number data were extracted from TCGA using R package TCGA-Assembler. The URLs of all public data files on TCGA DCC data server were gathered on Jan-05-2015. Function ProcessCNAData in TCGA-Assembler package was used to obtain gene-level copy number value which is calculated as the average copy number of the genomic region of a gene. |
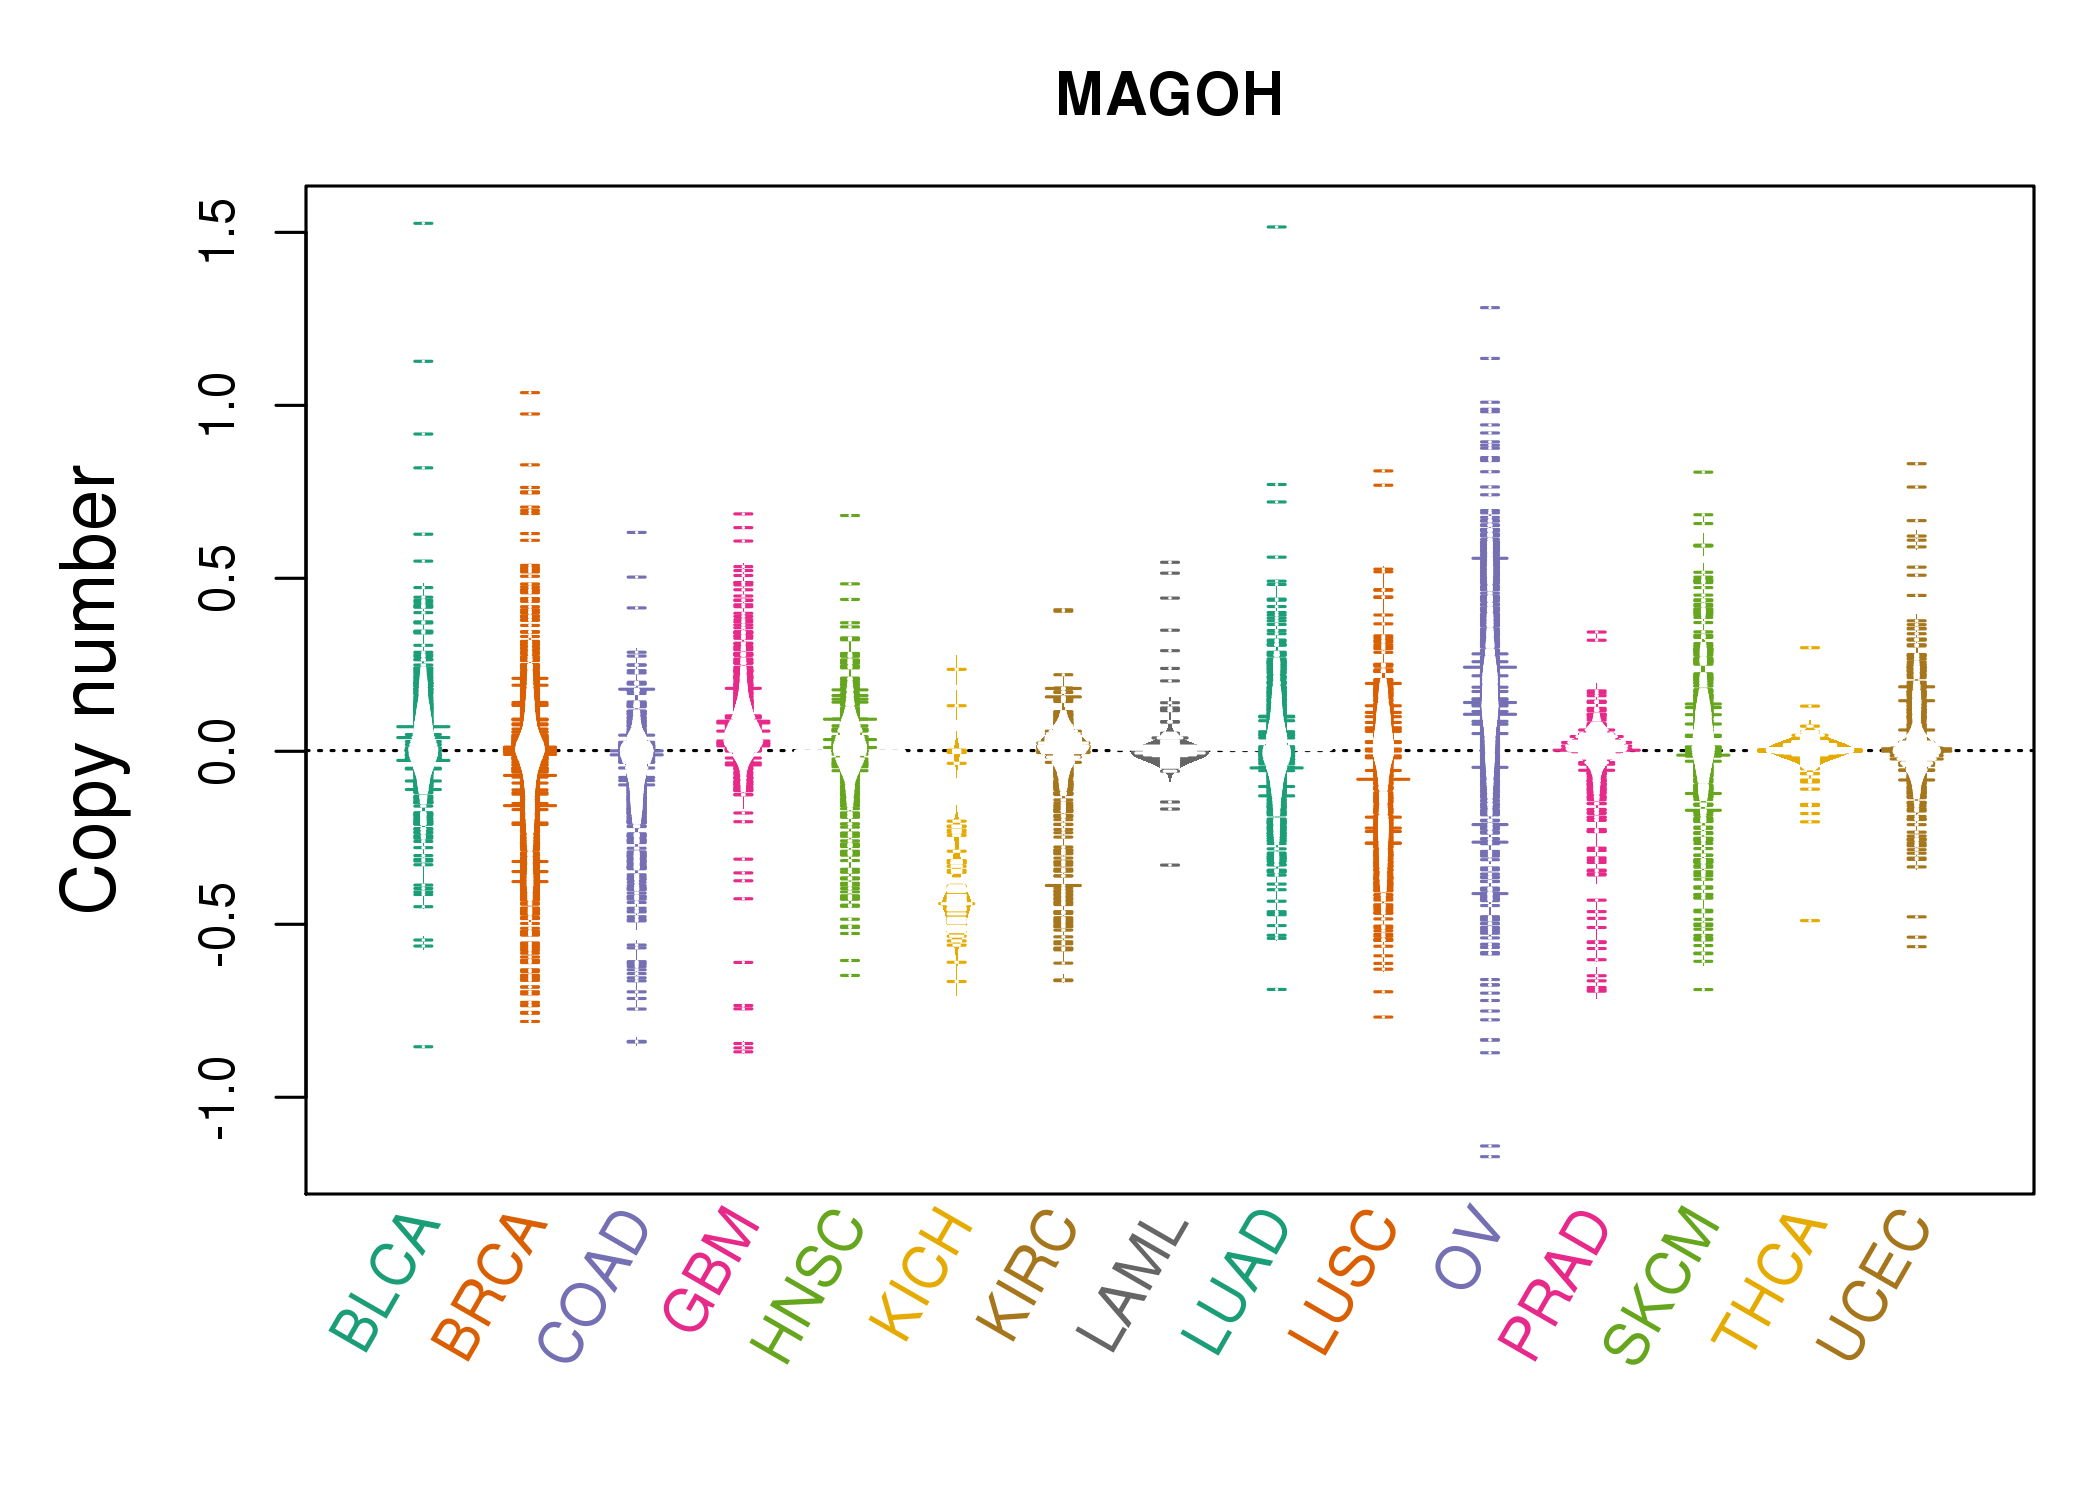 |
| cf) Tissue ID[Tissue type]: BLCA[Bladder Urothelial Carcinoma], BRCA[Breast invasive carcinoma], CESC[Cervical squamous cell carcinoma and endocervical adenocarcinoma], COAD[Colon adenocarcinoma], GBM[Glioblastoma multiforme], Glioma Low Grade, HNSC[Head and Neck squamous cell carcinoma], KICH[Kidney Chromophobe], KIRC[Kidney renal clear cell carcinoma], KIRP[Kidney renal papillary cell carcinoma], LAML[Acute Myeloid Leukemia], LUAD[Lung adenocarcinoma], LUSC[Lung squamous cell carcinoma], OV[Ovarian serous cystadenocarcinoma ], PAAD[Pancreatic adenocarcinoma], PRAD[Prostate adenocarcinoma], SKCM[Skin Cutaneous Melanoma], STAD[Stomach adenocarcinoma], THCA[Thyroid carcinoma], UCEC[Uterine Corpus Endometrial Carcinoma] |
| Top |
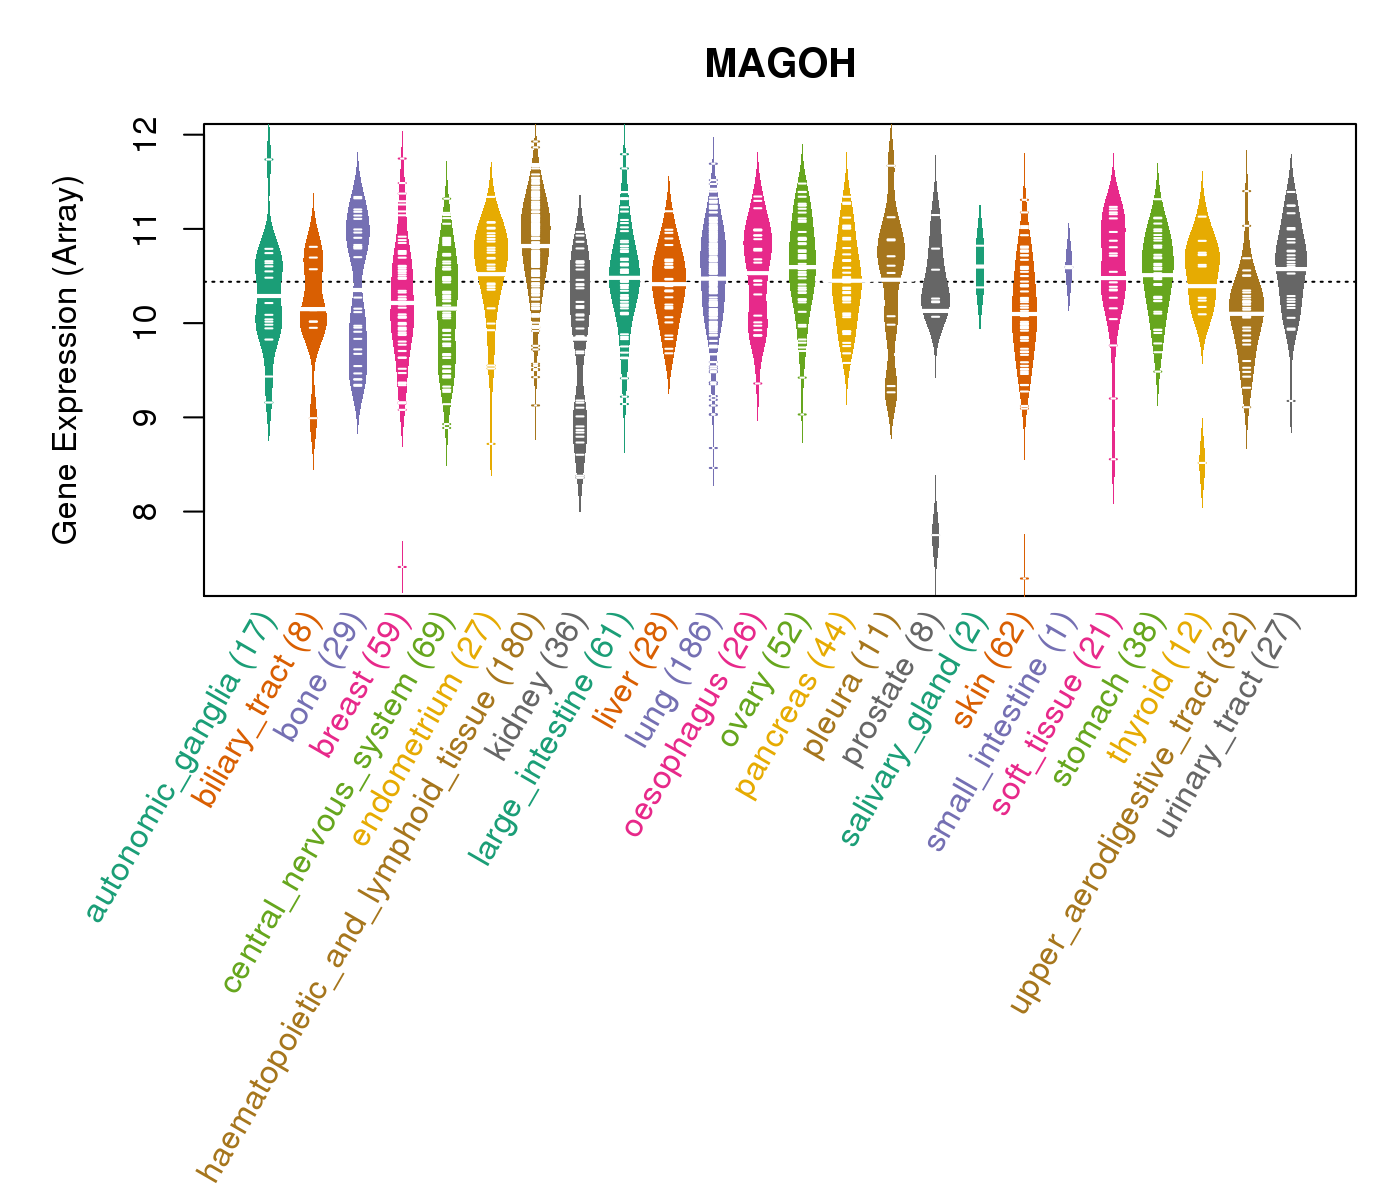
| Gene Expression for MAGOH |
| * CCLE gene expression data were extracted from CCLE_Expression_Entrez_2012-10-18.res: Gene-centric RMA-normalized mRNA expression data. |
 |
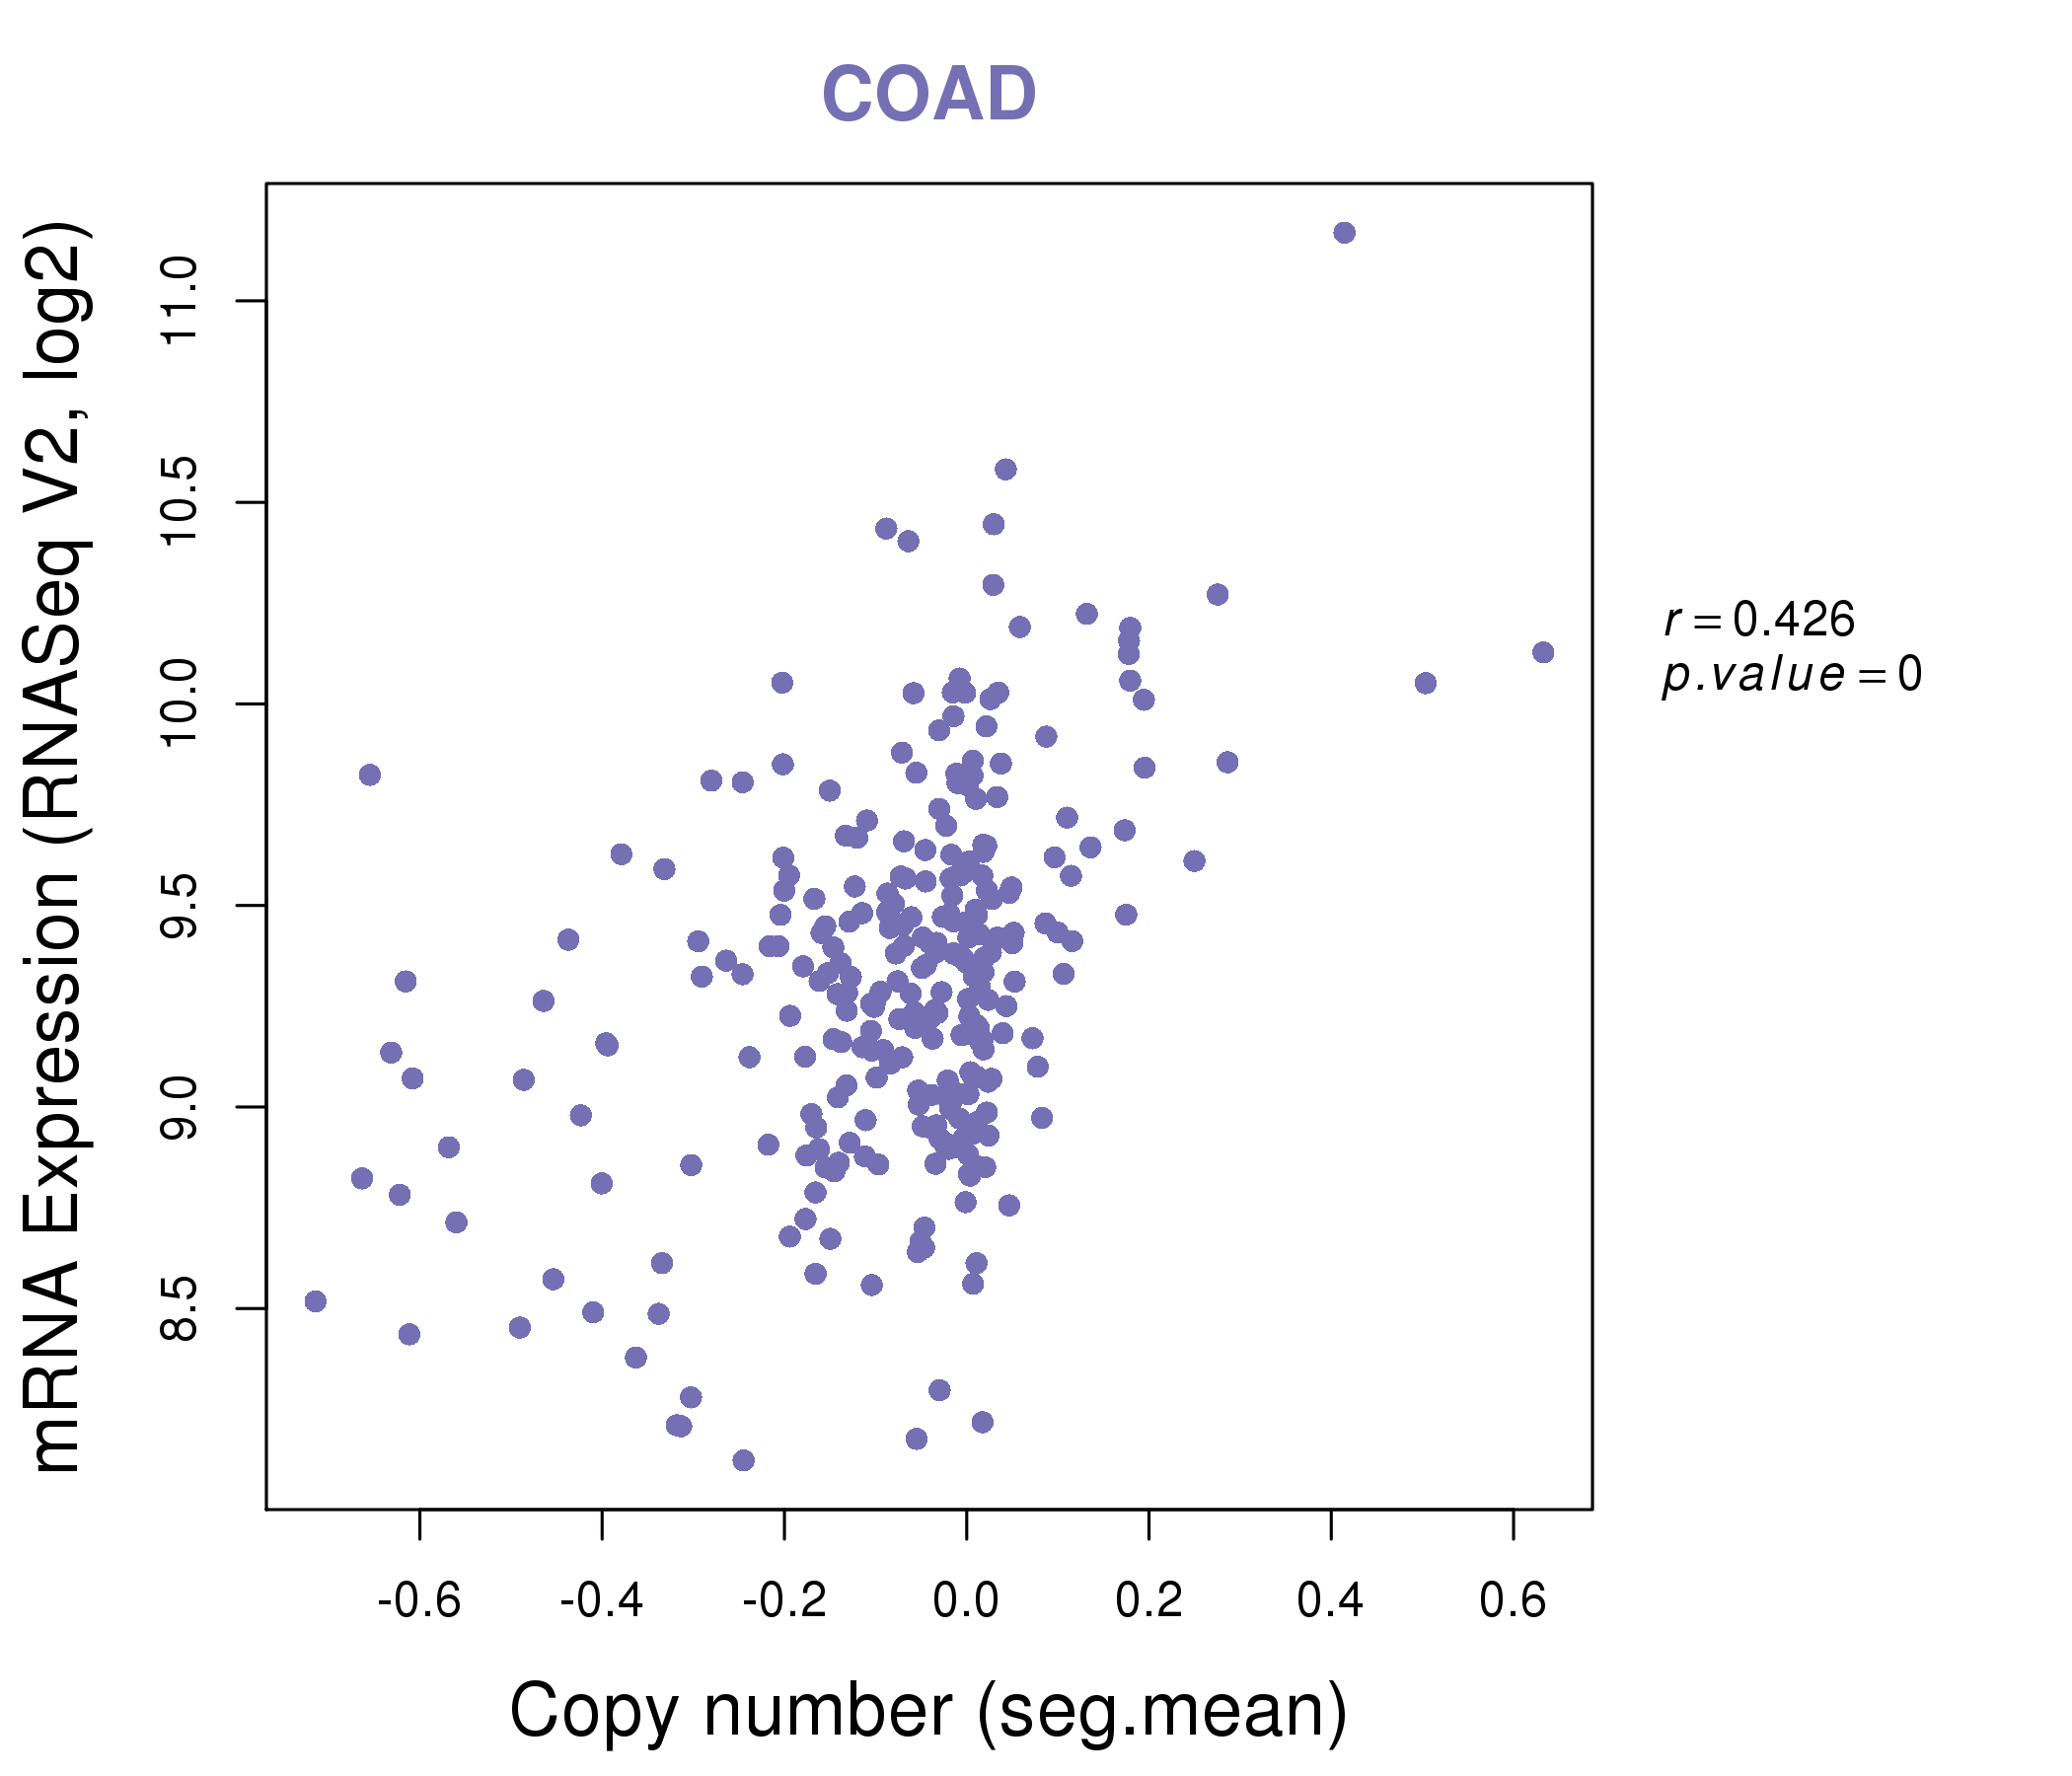
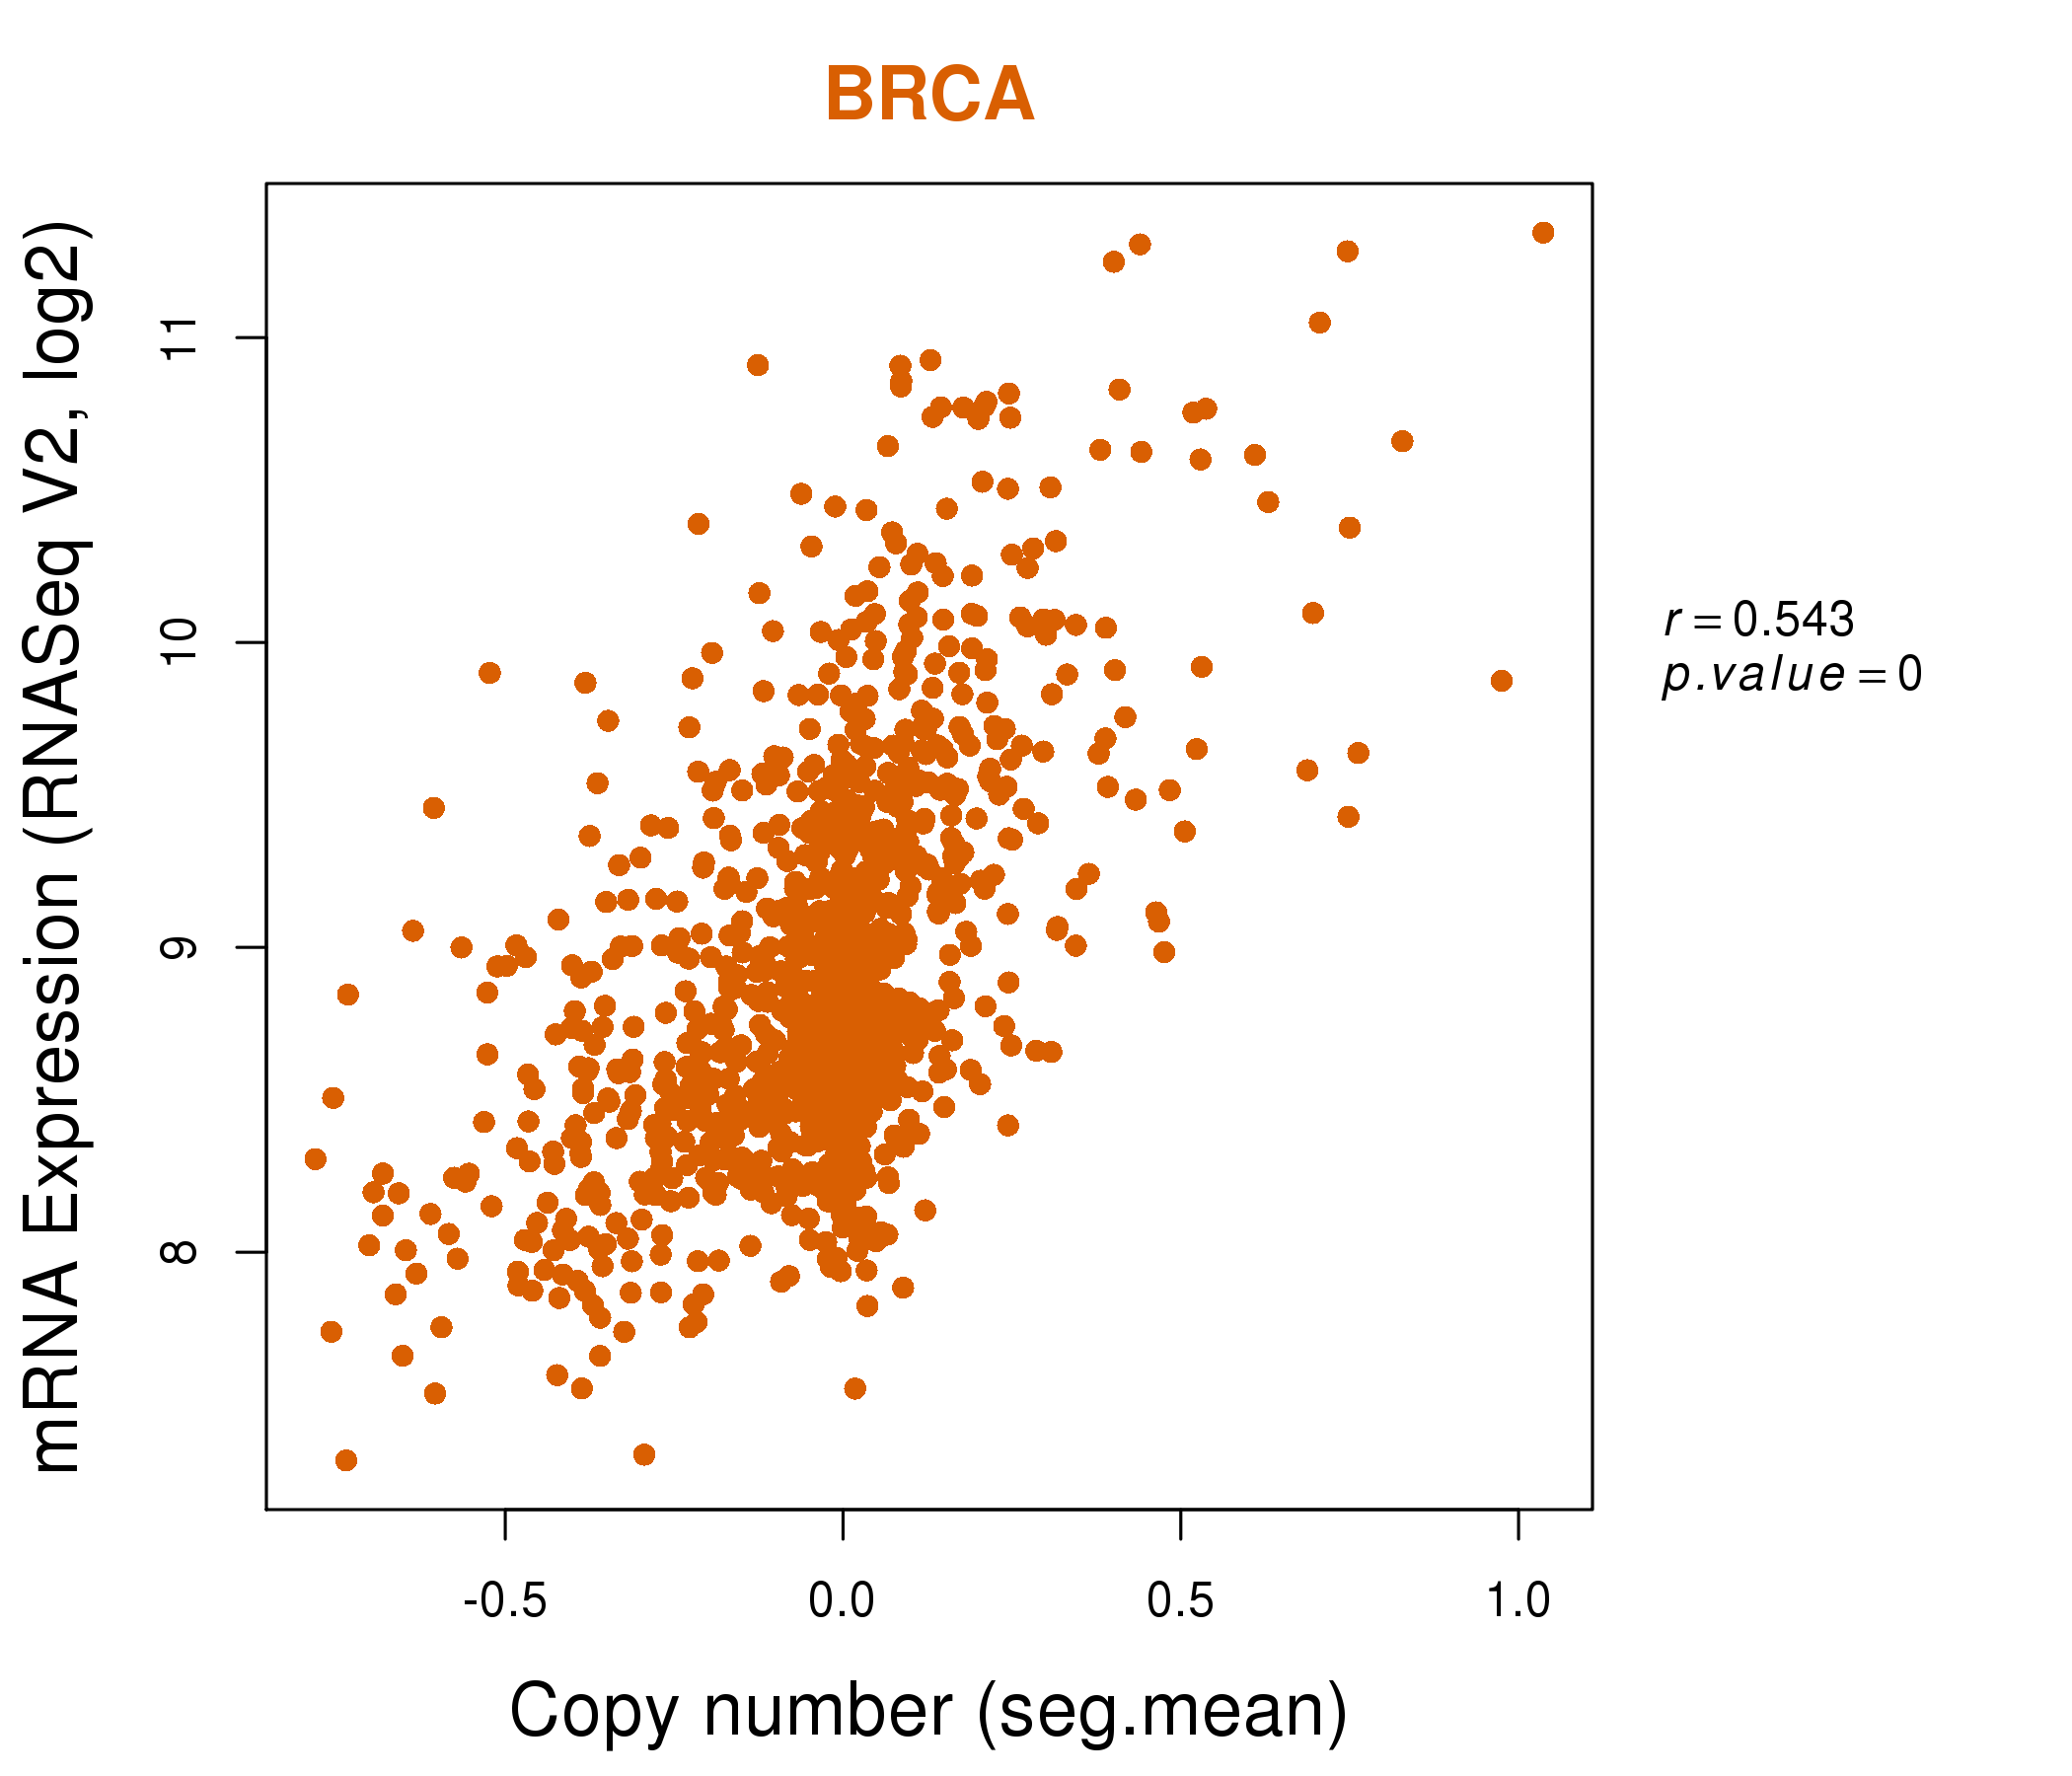
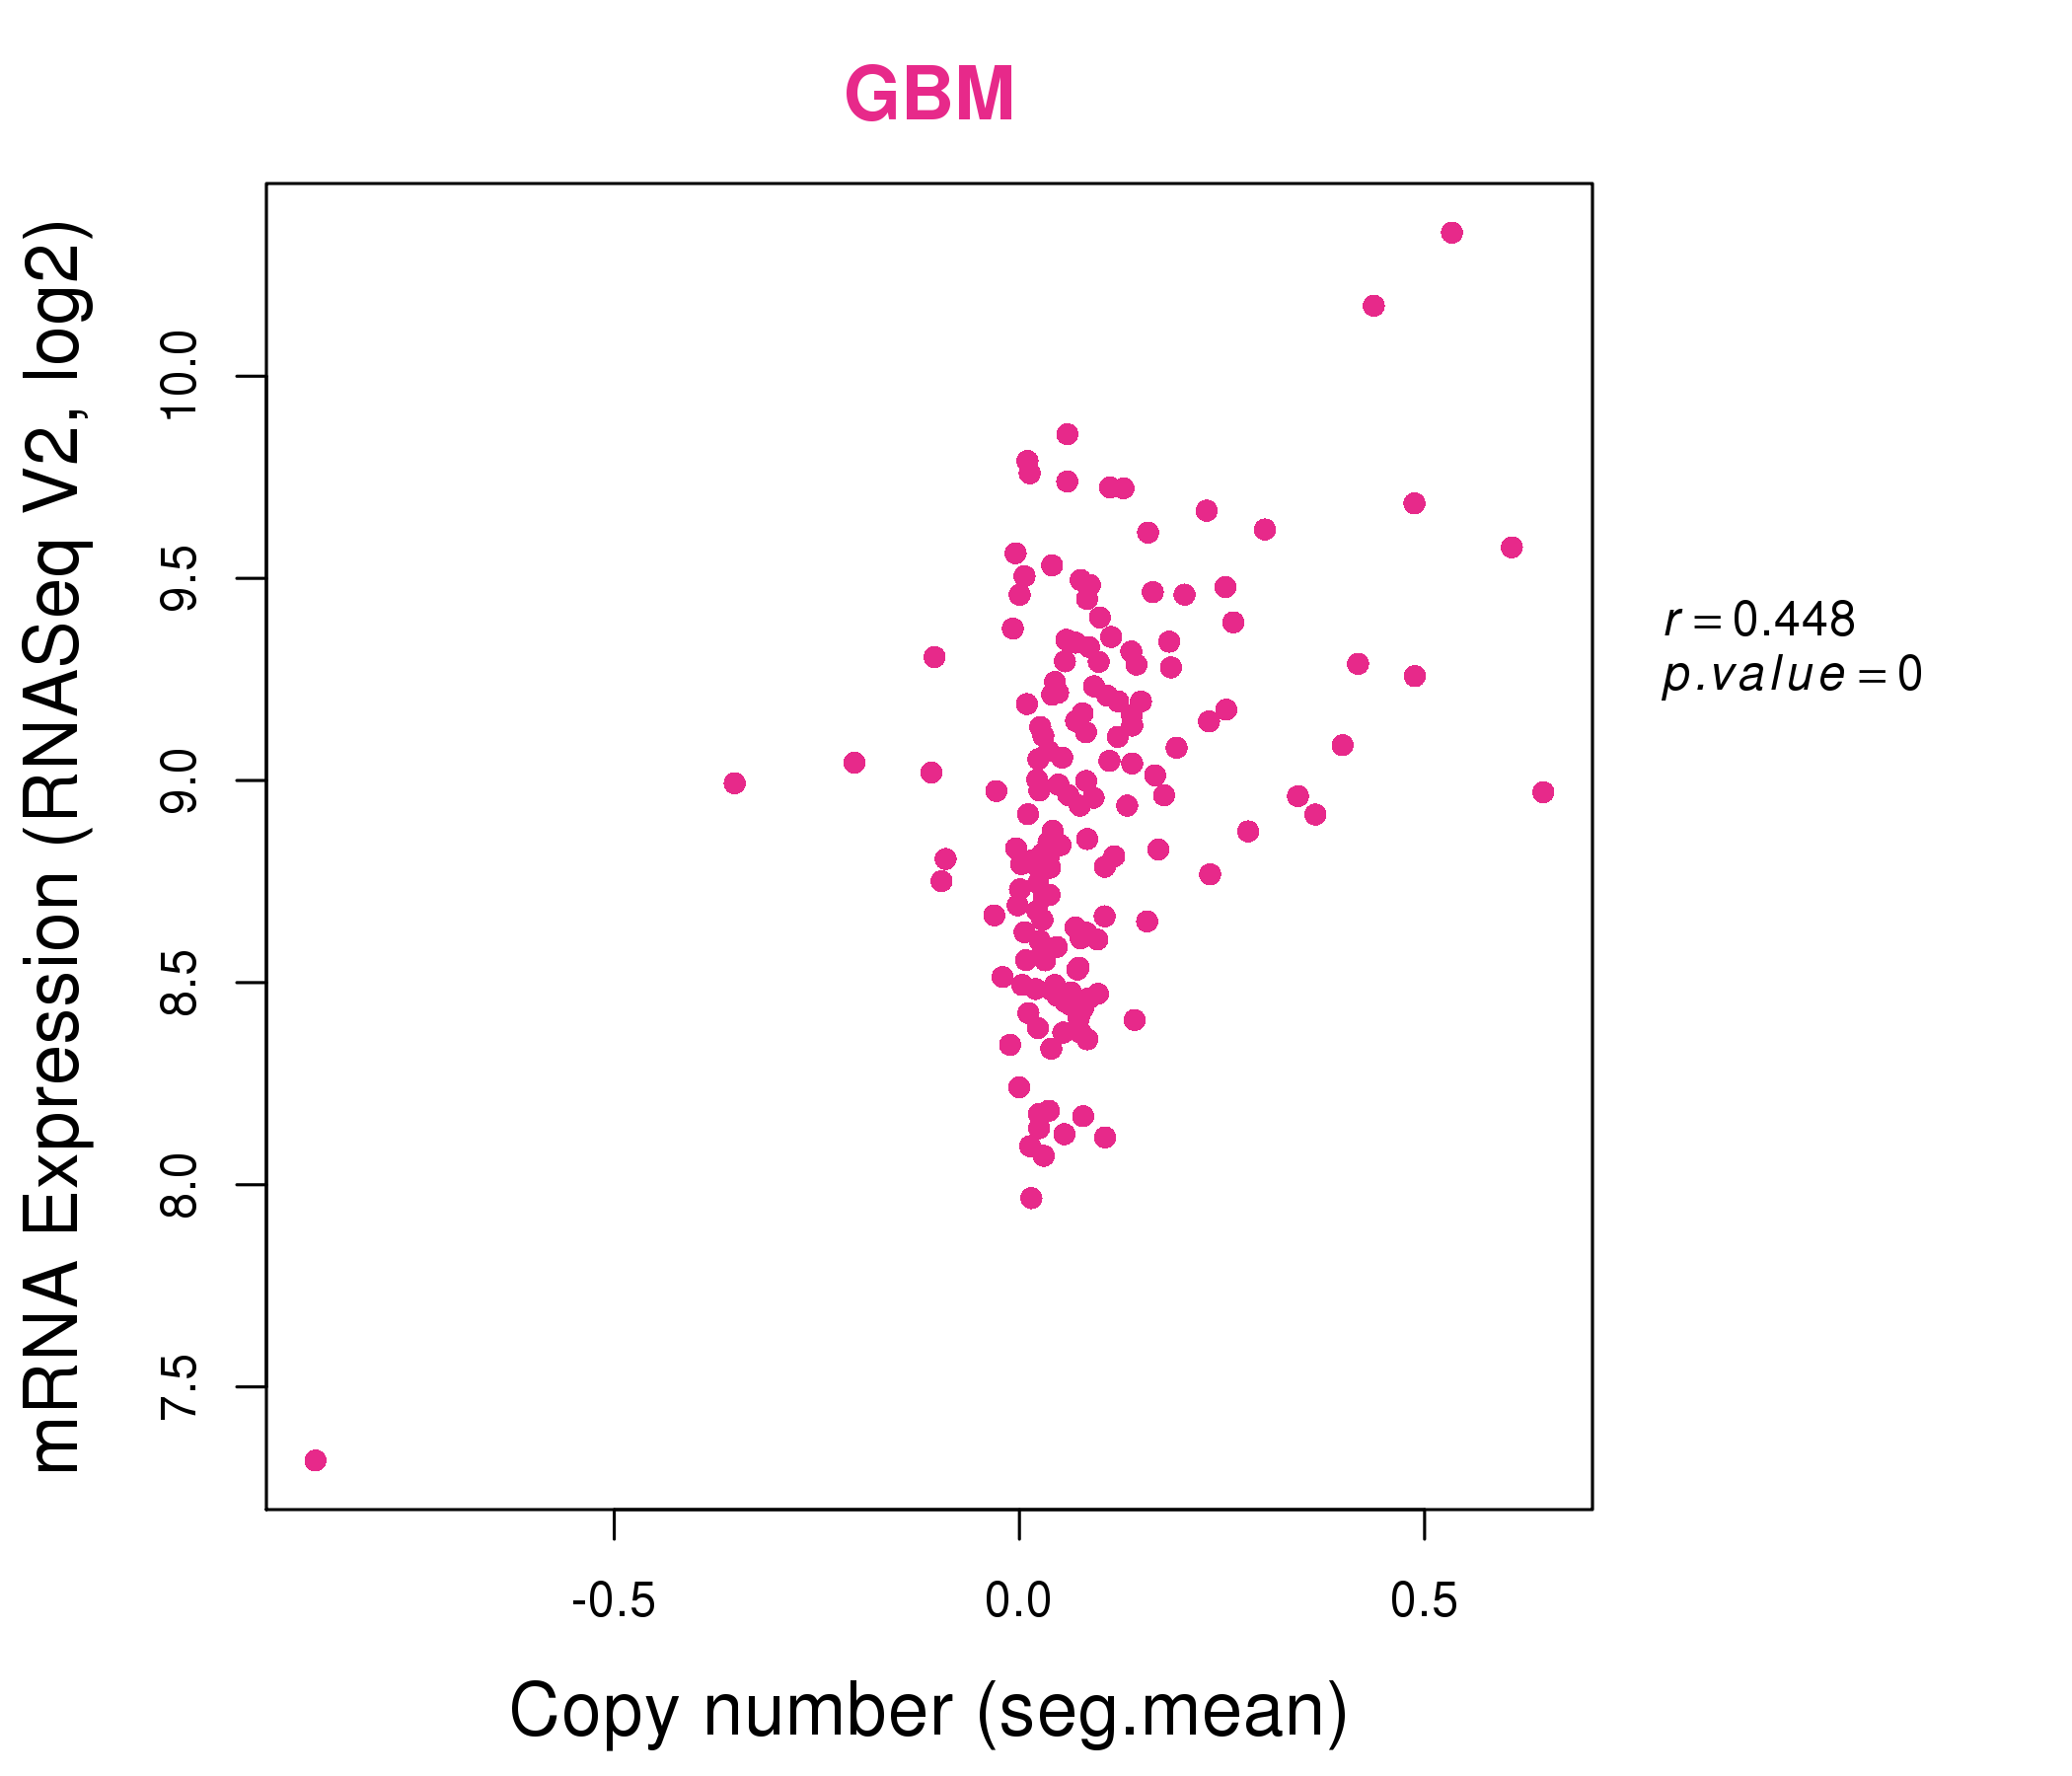
| * Normalized gene expression data of RNASeqV2 was extracted from TCGA using R package TCGA-Assembler. The URLs of all public data files on TCGA DCC data server were gathered at Jan-05-2015. Only eight cancer types have enough normal control samples for differential expression analysis. (t test, adjusted p<0.05 (using Benjamini-Hochberg FDR)) |
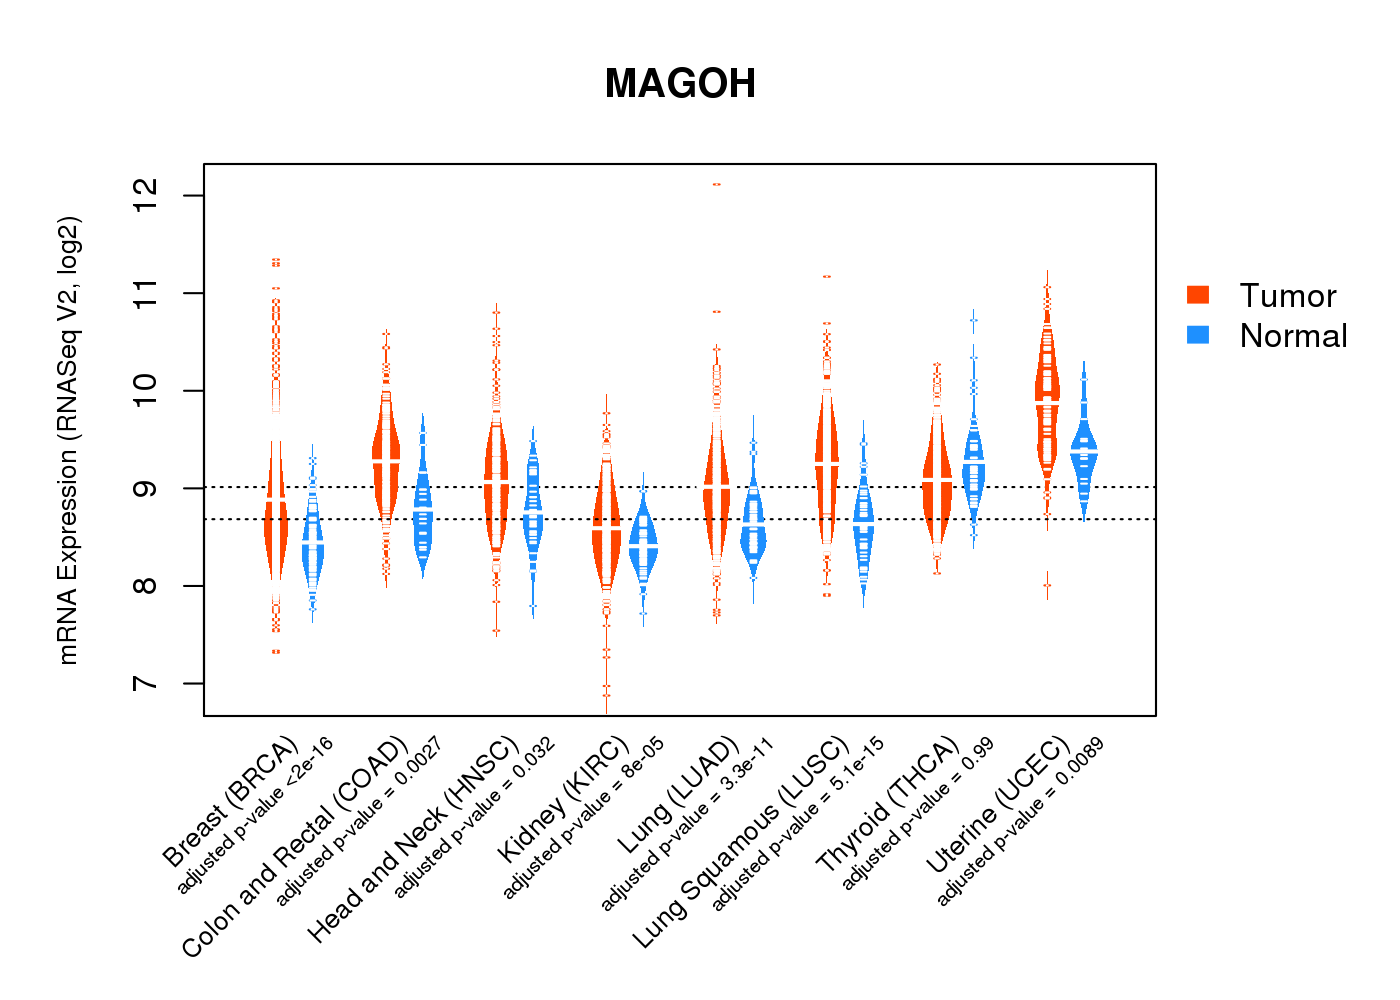 |
| Top |
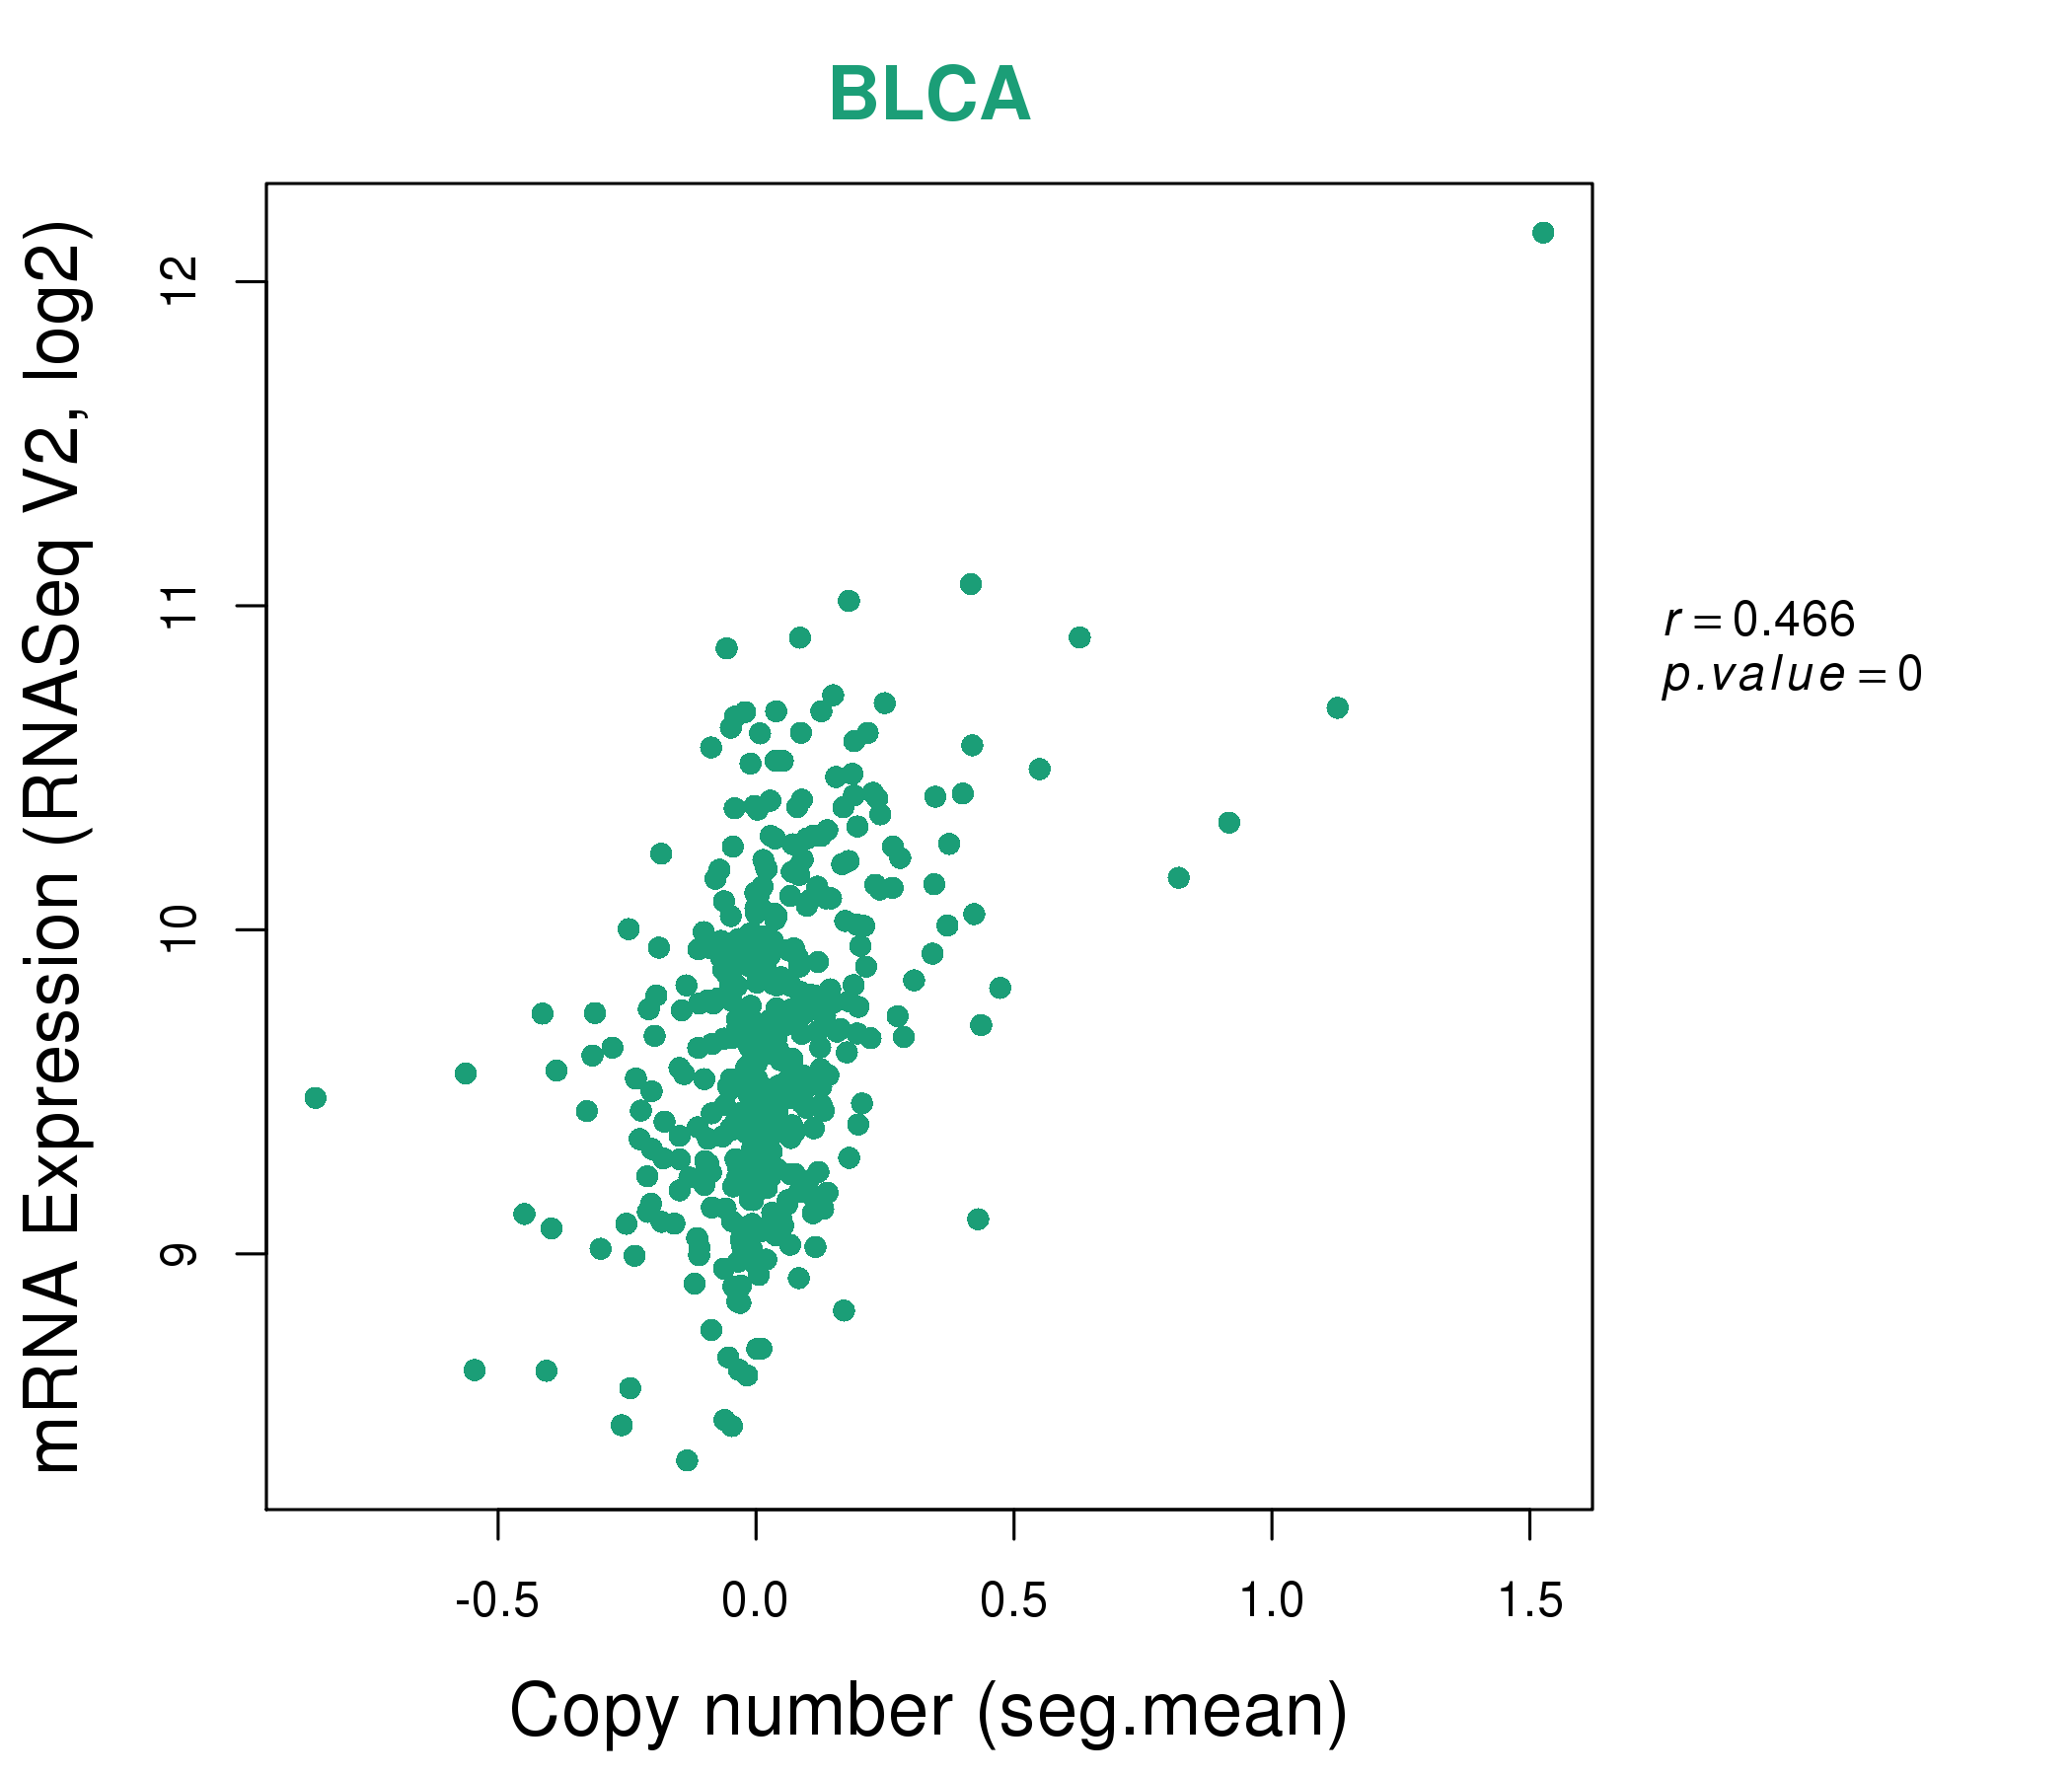
| * This plots show the correlation between CNV and gene expression. |
: Open all plots for all cancer types
 |
|
 |
|
| Top |
| Gene-Gene Network Information |
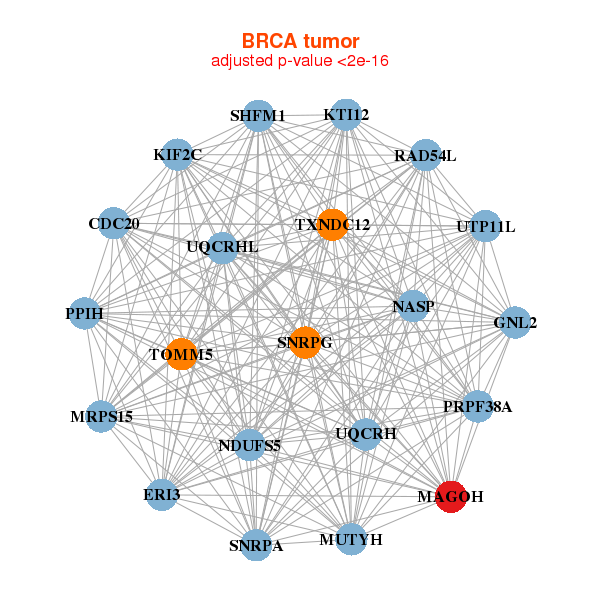
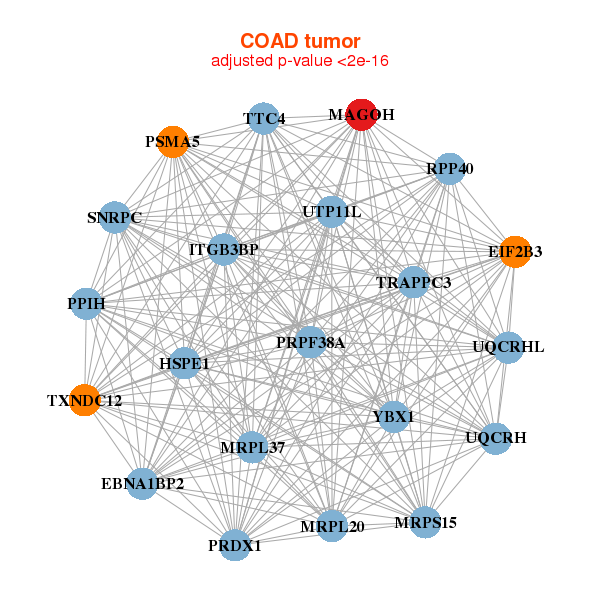
| * Co-Expression network figures were drawn using R package igraph. Only the top 20 genes with the highest correlations were shown. Red circle: input gene, orange circle: cell metabolism gene, sky circle: other gene |
: Open all plots for all cancer types
 |
|
| CDC20,ERI3,GNL2,KIF2C,KTI12,MAGOH,MRPS15, MUTYH,NASP,NDUFS5,PPIH,PRPF38A,RAD54L,SHFM1, SNRPA,SNRPG,TOMM5,TXNDC12,UQCRH,UQCRHL,UTP11L | C11orf31,C12orf57,DIABLO,DNTTIP1,KIF9,MAGOH,MED19, MED27,NXT1,PHF5A,PPIH,RPL24,RPL35,SNRPD1, SNRPD2,SNRPF,SSBP1,TRMT112,U2AF1,UBE2I,ZNRD1 |
 |
|
| EBNA1BP2,EIF2B3,HSPE1,ITGB3BP,MAGOH,MRPL20,MRPL37, MRPS15,PPIH,PRDX1,PRPF38A,PSMA5,RPP40,SNRPC, TRAPPC3,TTC4,TXNDC12,UQCRH,UQCRHL,UTP11L,YBX1 | ATG3,TMEM258,HYPK,TMA7,CKS1B,EXOSC8,FAM49B, LSM6,MAGOH,MRPL51,MRPL52,PFDN6,PPIA,PSMA1, PSMA2,PSMA5,RAN,RPL26L1,SEC11C,SEC61B,SNRPG |
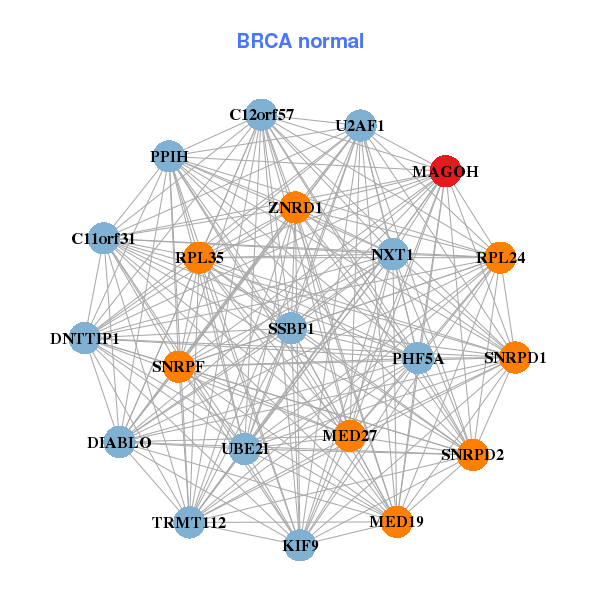

| * Co-Expression network figures were drawn using R package igraph. Only the top 20 genes with the highest correlations were shown. Red circle: input gene, orange circle: cell metabolism gene, sky circle: other gene |
: Open all plots for all cancer types
| Top |
: Open all interacting genes' information including KEGG pathway for all interacting genes from DAVID
| Top |
| Pharmacological Information for MAGOH |
| There's no related Drug. |
| Top |
| Cross referenced IDs for MAGOH |
| * We obtained these cross-references from Uniprot database. It covers 150 different DBs, 18 categories. http://www.uniprot.org/help/cross_references_section |
: Open all cross reference information
|
Copyright © 2016-Present - The Univsersity of Texas Health Science Center at Houston @ |