|
||||||||||||||||||||
| |
| Phenotypic Information (metabolism pathway, cancer, disease, phenome) |
| |
| |
| Gene-Gene Network Information: Co-Expression Network, Interacting Genes & KEGG |
| |
|


| Gene Summary for STS |
| Top |
| Phenotypic Information for STS(metabolism pathway, cancer, disease, phenome) |
| Cancer | CGAP: STS |
| Familial Cancer Database: STS | |
| * This gene is included in those cancer gene databases. |
|
|
|
|
|
| . | ||||||||||||||
Oncogene 1 | Significant driver gene in | |||||||||||||||||||
| cf) number; DB name 1 Oncogene; http://nar.oxfordjournals.org/content/35/suppl_1/D721.long, 2 Tumor Suppressor gene; https://bioinfo.uth.edu/TSGene/, 3 Cancer Gene Census; http://www.nature.com/nrc/journal/v4/n3/abs/nrc1299.html, 4 CancerGenes; http://nar.oxfordjournals.org/content/35/suppl_1/D721.long, 5 Network of Cancer Gene; http://ncg.kcl.ac.uk/index.php, 1Therapeutic Vulnerabilities in Cancer; http://cbio.mskcc.org/cancergenomics/statius/ |
| REACTOME_GLYCOSPHINGOLIPID_METABOLISM REACTOME_PHOSPHOLIPID_METABOLISM REACTOME_METABOLISM_OF_PROTEINS REACTOME_SPHINGOLIPID_METABOLISM REACTOME_METABOLISM_OF_LIPIDS_AND_LIPOPROTEINS | |
| OMIM | |
| Orphanet | |
| Disease | KEGG Disease: STS |
| MedGen: STS (Human Medical Genetics with Condition) | |
| ClinVar: STS | |
| Phenotype | MGI: STS (International Mouse Phenotyping Consortium) |
| PhenomicDB: STS | |
| Mutations for STS |
| * Under tables are showing count per each tissue to give us broad intuition about tissue specific mutation patterns.You can go to the detailed page for each mutation database's web site. |
| There's no structural variation information in COSMIC data for this gene. |
| * From mRNA Sanger sequences, Chitars2.0 arranged chimeric transcripts. This table shows STS related fusion information. |
| ID | Head Gene | Tail Gene | Accession | Gene_a | qStart_a | qEnd_a | Chromosome_a | tStart_a | tEnd_a | Gene_a | qStart_a | qEnd_a | Chromosome_a | tStart_a | tEnd_a |
| BF956604 | STS | 218 | 241 | X | 7176190 | 7176214 | SEPW1 | 238 | 377 | 19 | 48284136 | 48284572 | |
| Top |
| There's no copy number variation information in COSMIC data for this gene. |
| Top |
|
 |
| Top |
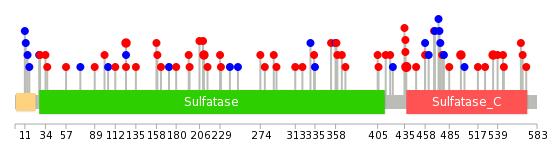
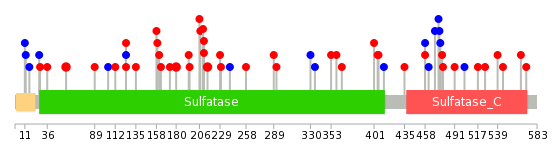
| Stat. for Non-Synonymous SNVs (# total SNVs=45) | (# total SNVs=15) |
 |  |
(# total SNVs=2) | (# total SNVs=0) |
 |
| Top |
| * When you move the cursor on each content, you can see more deailed mutation information on the Tooltip. Those are primary_site,primary_histology,mutation(aa),pubmedID. |
| GRCh37 position | Mutation(aa) | Unique sampleID count |
| chr23:7252080-7252080 | p.S437F | 3 |
| chr23:7175602-7175602 | p.D124N | 3 |
| chr23:7177623-7177623 | p.V211M | 2 |
| chr23:7268042-7268042 | p.D498N | 2 |
| chr23:7268151-7268151 | p.A534V | 2 |
| chr23:7171326-7171326 | p.A34V | 1 |
| chr23:7194044-7194044 | p.A292T | 1 |
| chr23:7267975-7267975 | p.P475P | 1 |
| chr23:7268186-7268186 | p.D546N | 1 |
| chr23:7175604-7175604 | p.D124D | 1 |
| Top |
|
 |
| Point Mutation/ Tissue ID | 1 | 2 | 3 | 4 | 5 | 6 | 7 | 8 | 9 | 10 | 11 | 12 | 13 | 14 | 15 | 16 | 17 | 18 | 19 | 20 |
| # sample | 3 | 1 | 12 | 2 | 1 | 1 | 11 | 5 | 1 | 1 | 10 | 2 | 1 | 9 | ||||||
| # mutation | 3 | 1 | 11 | 2 | 1 | 1 | 10 | 5 | 1 | 1 | 11 | 2 | 1 | 10 | ||||||
| nonsynonymous SNV | 2 | 7 | 2 | 1 | 1 | 8 | 4 | 1 | 1 | 6 | 2 | 1 | 7 | |||||||
| synonymous SNV | 1 | 1 | 4 | 2 | 1 | 5 | 3 |
| cf) Tissue ID; Tissue type (1; BLCA[Bladder Urothelial Carcinoma], 2; BRCA[Breast invasive carcinoma], 3; CESC[Cervical squamous cell carcinoma and endocervical adenocarcinoma], 4; COAD[Colon adenocarcinoma], 5; GBM[Glioblastoma multiforme], 6; Glioma Low Grade, 7; HNSC[Head and Neck squamous cell carcinoma], 8; KICH[Kidney Chromophobe], 9; KIRC[Kidney renal clear cell carcinoma], 10; KIRP[Kidney renal papillary cell carcinoma], 11; LAML[Acute Myeloid Leukemia], 12; LUAD[Lung adenocarcinoma], 13; LUSC[Lung squamous cell carcinoma], 14; OV[Ovarian serous cystadenocarcinoma ], 15; PAAD[Pancreatic adenocarcinoma], 16; PRAD[Prostate adenocarcinoma], 17; SKCM[Skin Cutaneous Melanoma], 18:STAD[Stomach adenocarcinoma], 19:THCA[Thyroid carcinoma], 20:UCEC[Uterine Corpus Endometrial Carcinoma]) |
| Top |
| * We represented just top 10 SNVs. When you move the cursor on each content, you can see more deailed mutation information on the Tooltip. Those are primary_site, primary_histology, mutation(aa), pubmedID. |
| Genomic Position | Mutation(aa) | Unique sampleID count |
| chrX:7177623 | p.T180M | 2 |
| chrX:7177635 | p.R57W | 2 |
| chrX:7175299 | p.V211L | 2 |
| chrX:7177531 | p.V215I | 2 |
| chrX:7175602 | p.D124N | 2 |
| chrX:7171273 | p.W135L | 1 |
| chrX:7223186 | p.L240L | 1 |
| chrX:7177465 | p.S462S | 1 |
| chrX:7267957 | p.Y158C | 1 |
| chrX:7268184 | p.D258N | 1 |
| * Copy number data were extracted from TCGA using R package TCGA-Assembler. The URLs of all public data files on TCGA DCC data server were gathered on Jan-05-2015. Function ProcessCNAData in TCGA-Assembler package was used to obtain gene-level copy number value which is calculated as the average copy number of the genomic region of a gene. |
 |
| cf) Tissue ID[Tissue type]: BLCA[Bladder Urothelial Carcinoma], BRCA[Breast invasive carcinoma], CESC[Cervical squamous cell carcinoma and endocervical adenocarcinoma], COAD[Colon adenocarcinoma], GBM[Glioblastoma multiforme], Glioma Low Grade, HNSC[Head and Neck squamous cell carcinoma], KICH[Kidney Chromophobe], KIRC[Kidney renal clear cell carcinoma], KIRP[Kidney renal papillary cell carcinoma], LAML[Acute Myeloid Leukemia], LUAD[Lung adenocarcinoma], LUSC[Lung squamous cell carcinoma], OV[Ovarian serous cystadenocarcinoma ], PAAD[Pancreatic adenocarcinoma], PRAD[Prostate adenocarcinoma], SKCM[Skin Cutaneous Melanoma], STAD[Stomach adenocarcinoma], THCA[Thyroid carcinoma], UCEC[Uterine Corpus Endometrial Carcinoma] |
| Top |
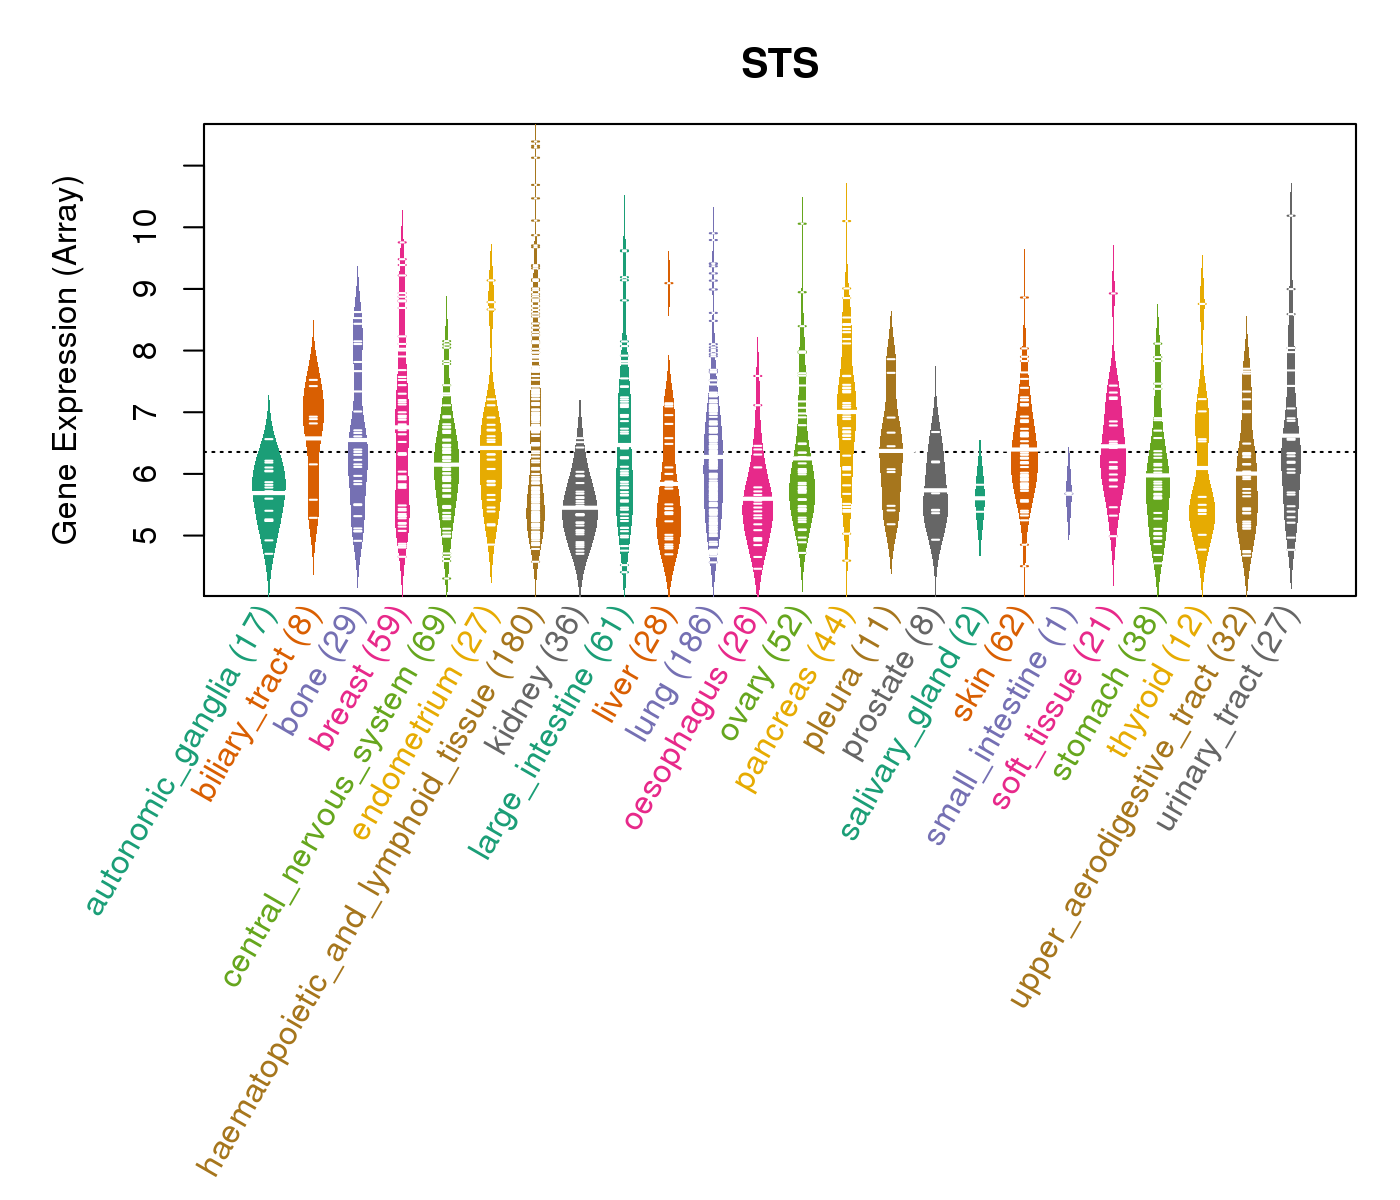
| Gene Expression for STS |
| * CCLE gene expression data were extracted from CCLE_Expression_Entrez_2012-10-18.res: Gene-centric RMA-normalized mRNA expression data. |
 |
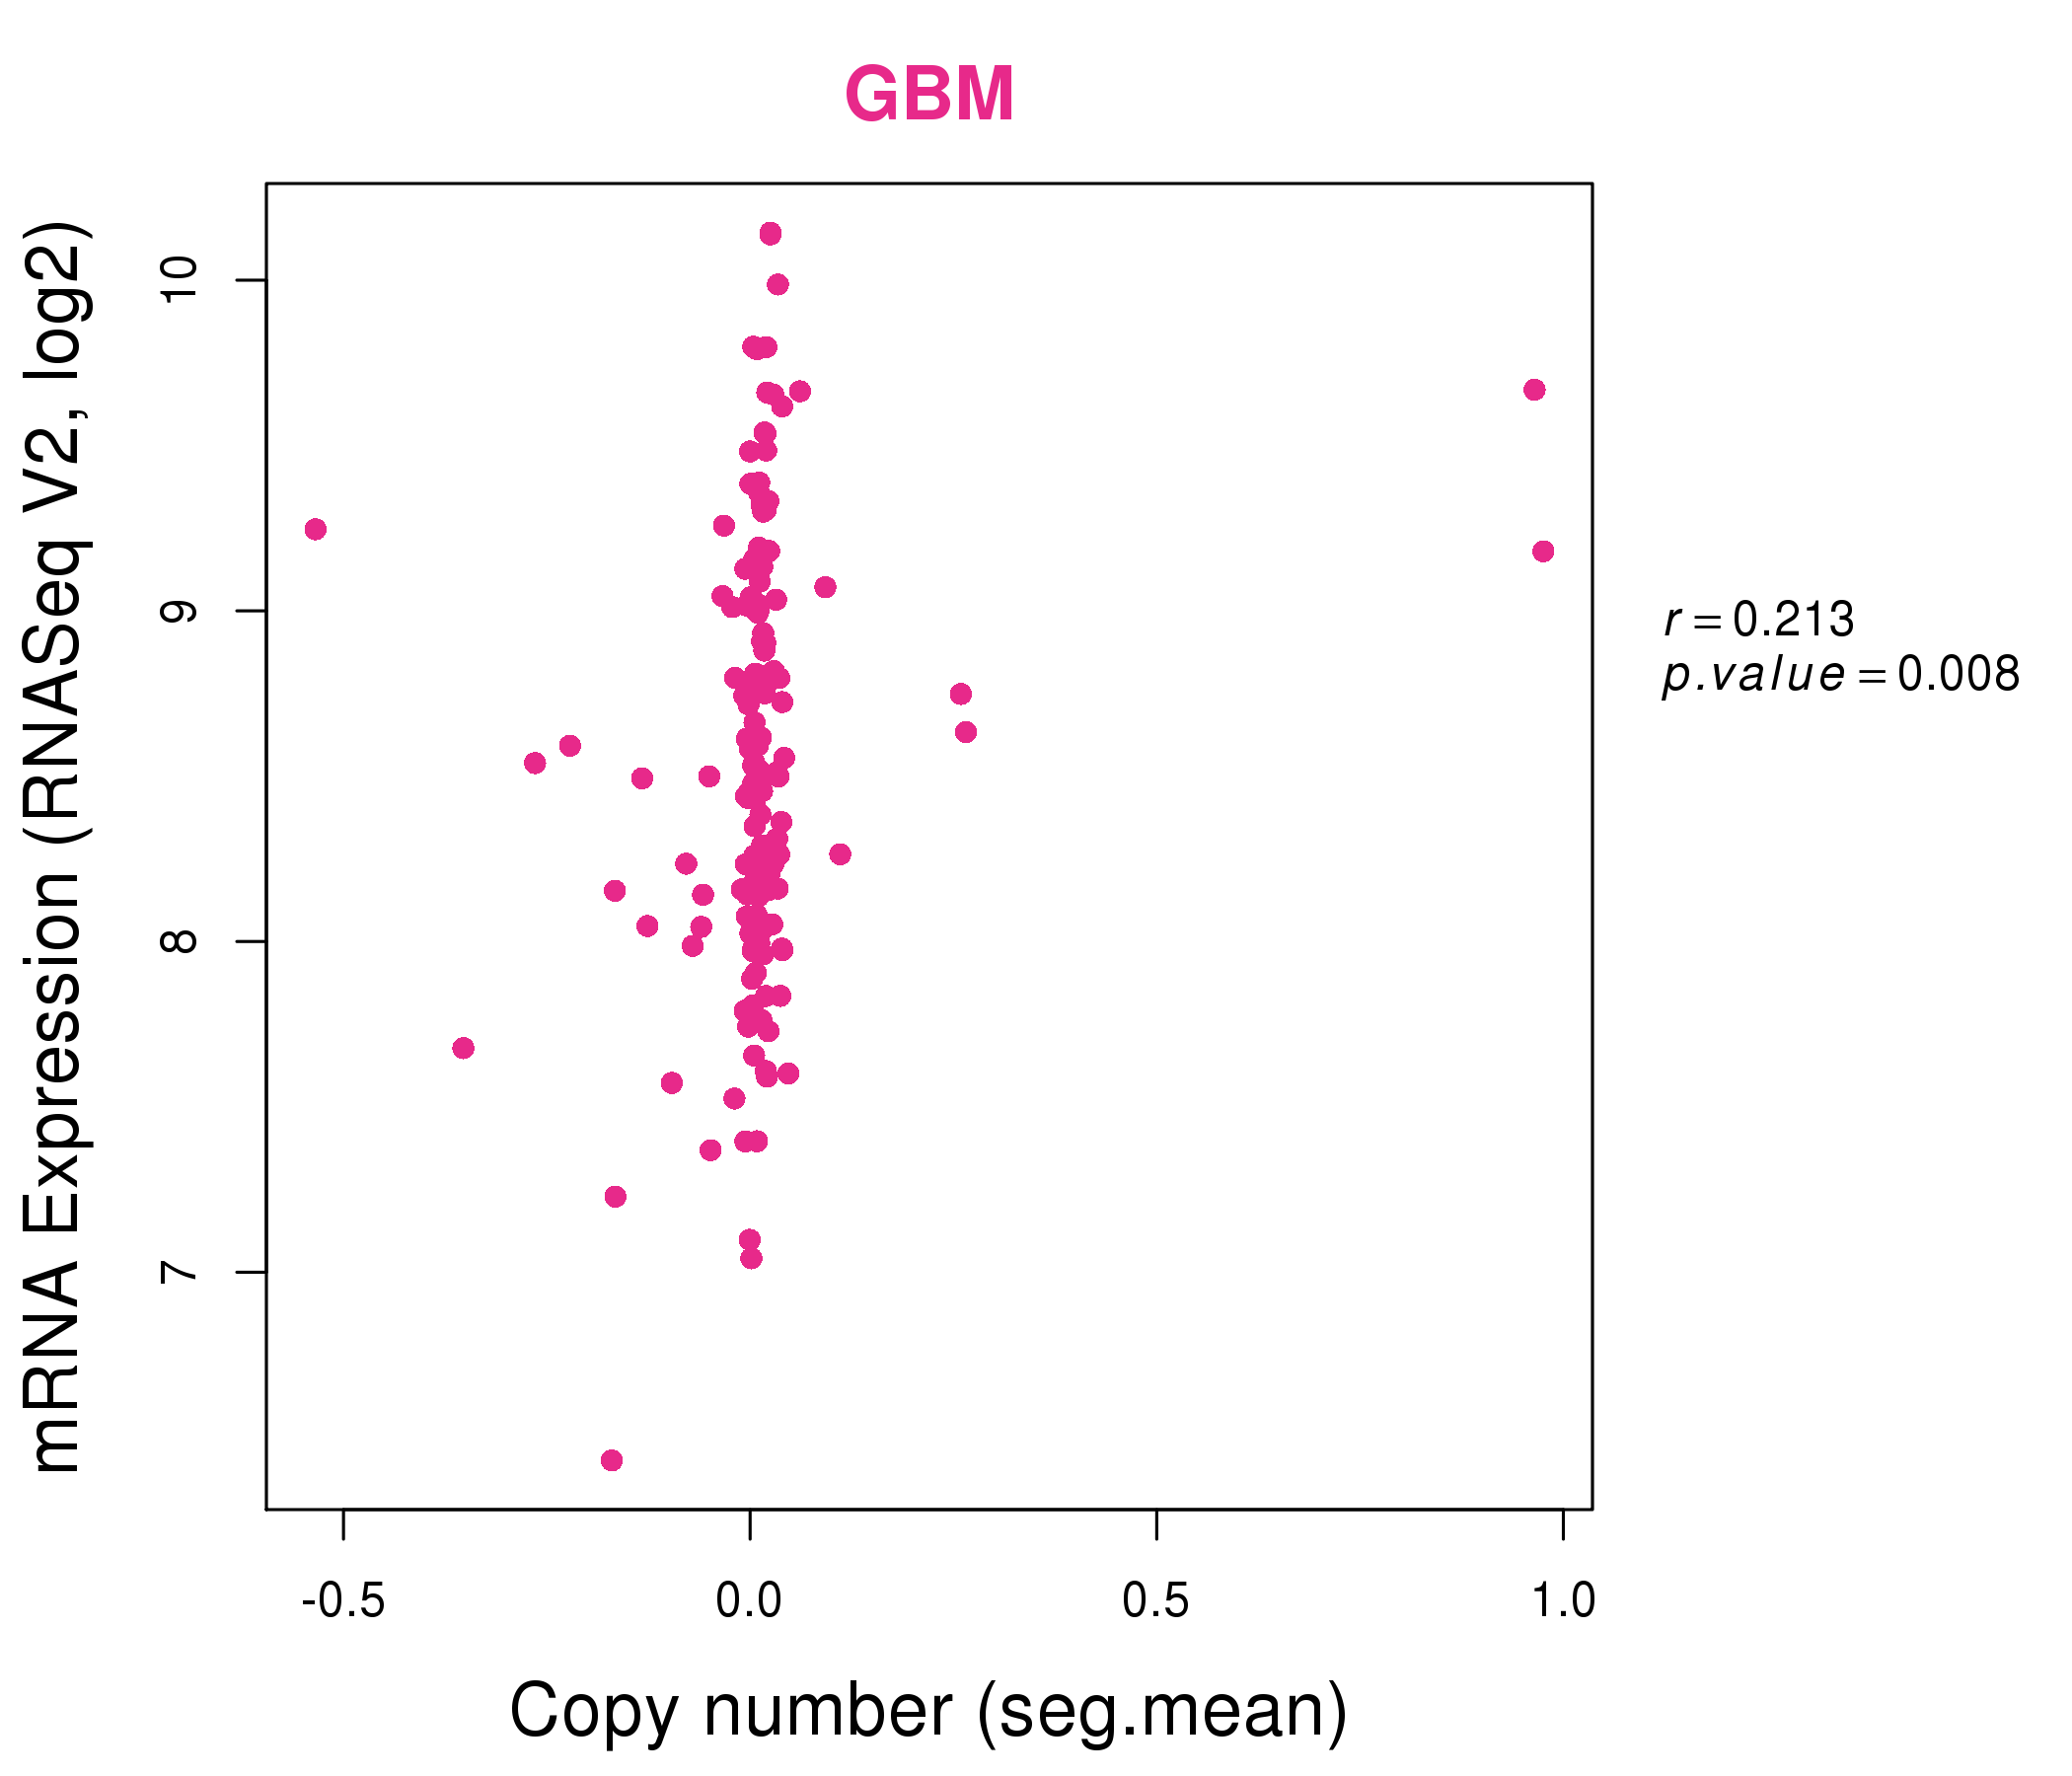
| * Normalized gene expression data of RNASeqV2 was extracted from TCGA using R package TCGA-Assembler. The URLs of all public data files on TCGA DCC data server were gathered at Jan-05-2015. Only eight cancer types have enough normal control samples for differential expression analysis. (t test, adjusted p<0.05 (using Benjamini-Hochberg FDR)) |
 |
| Top |
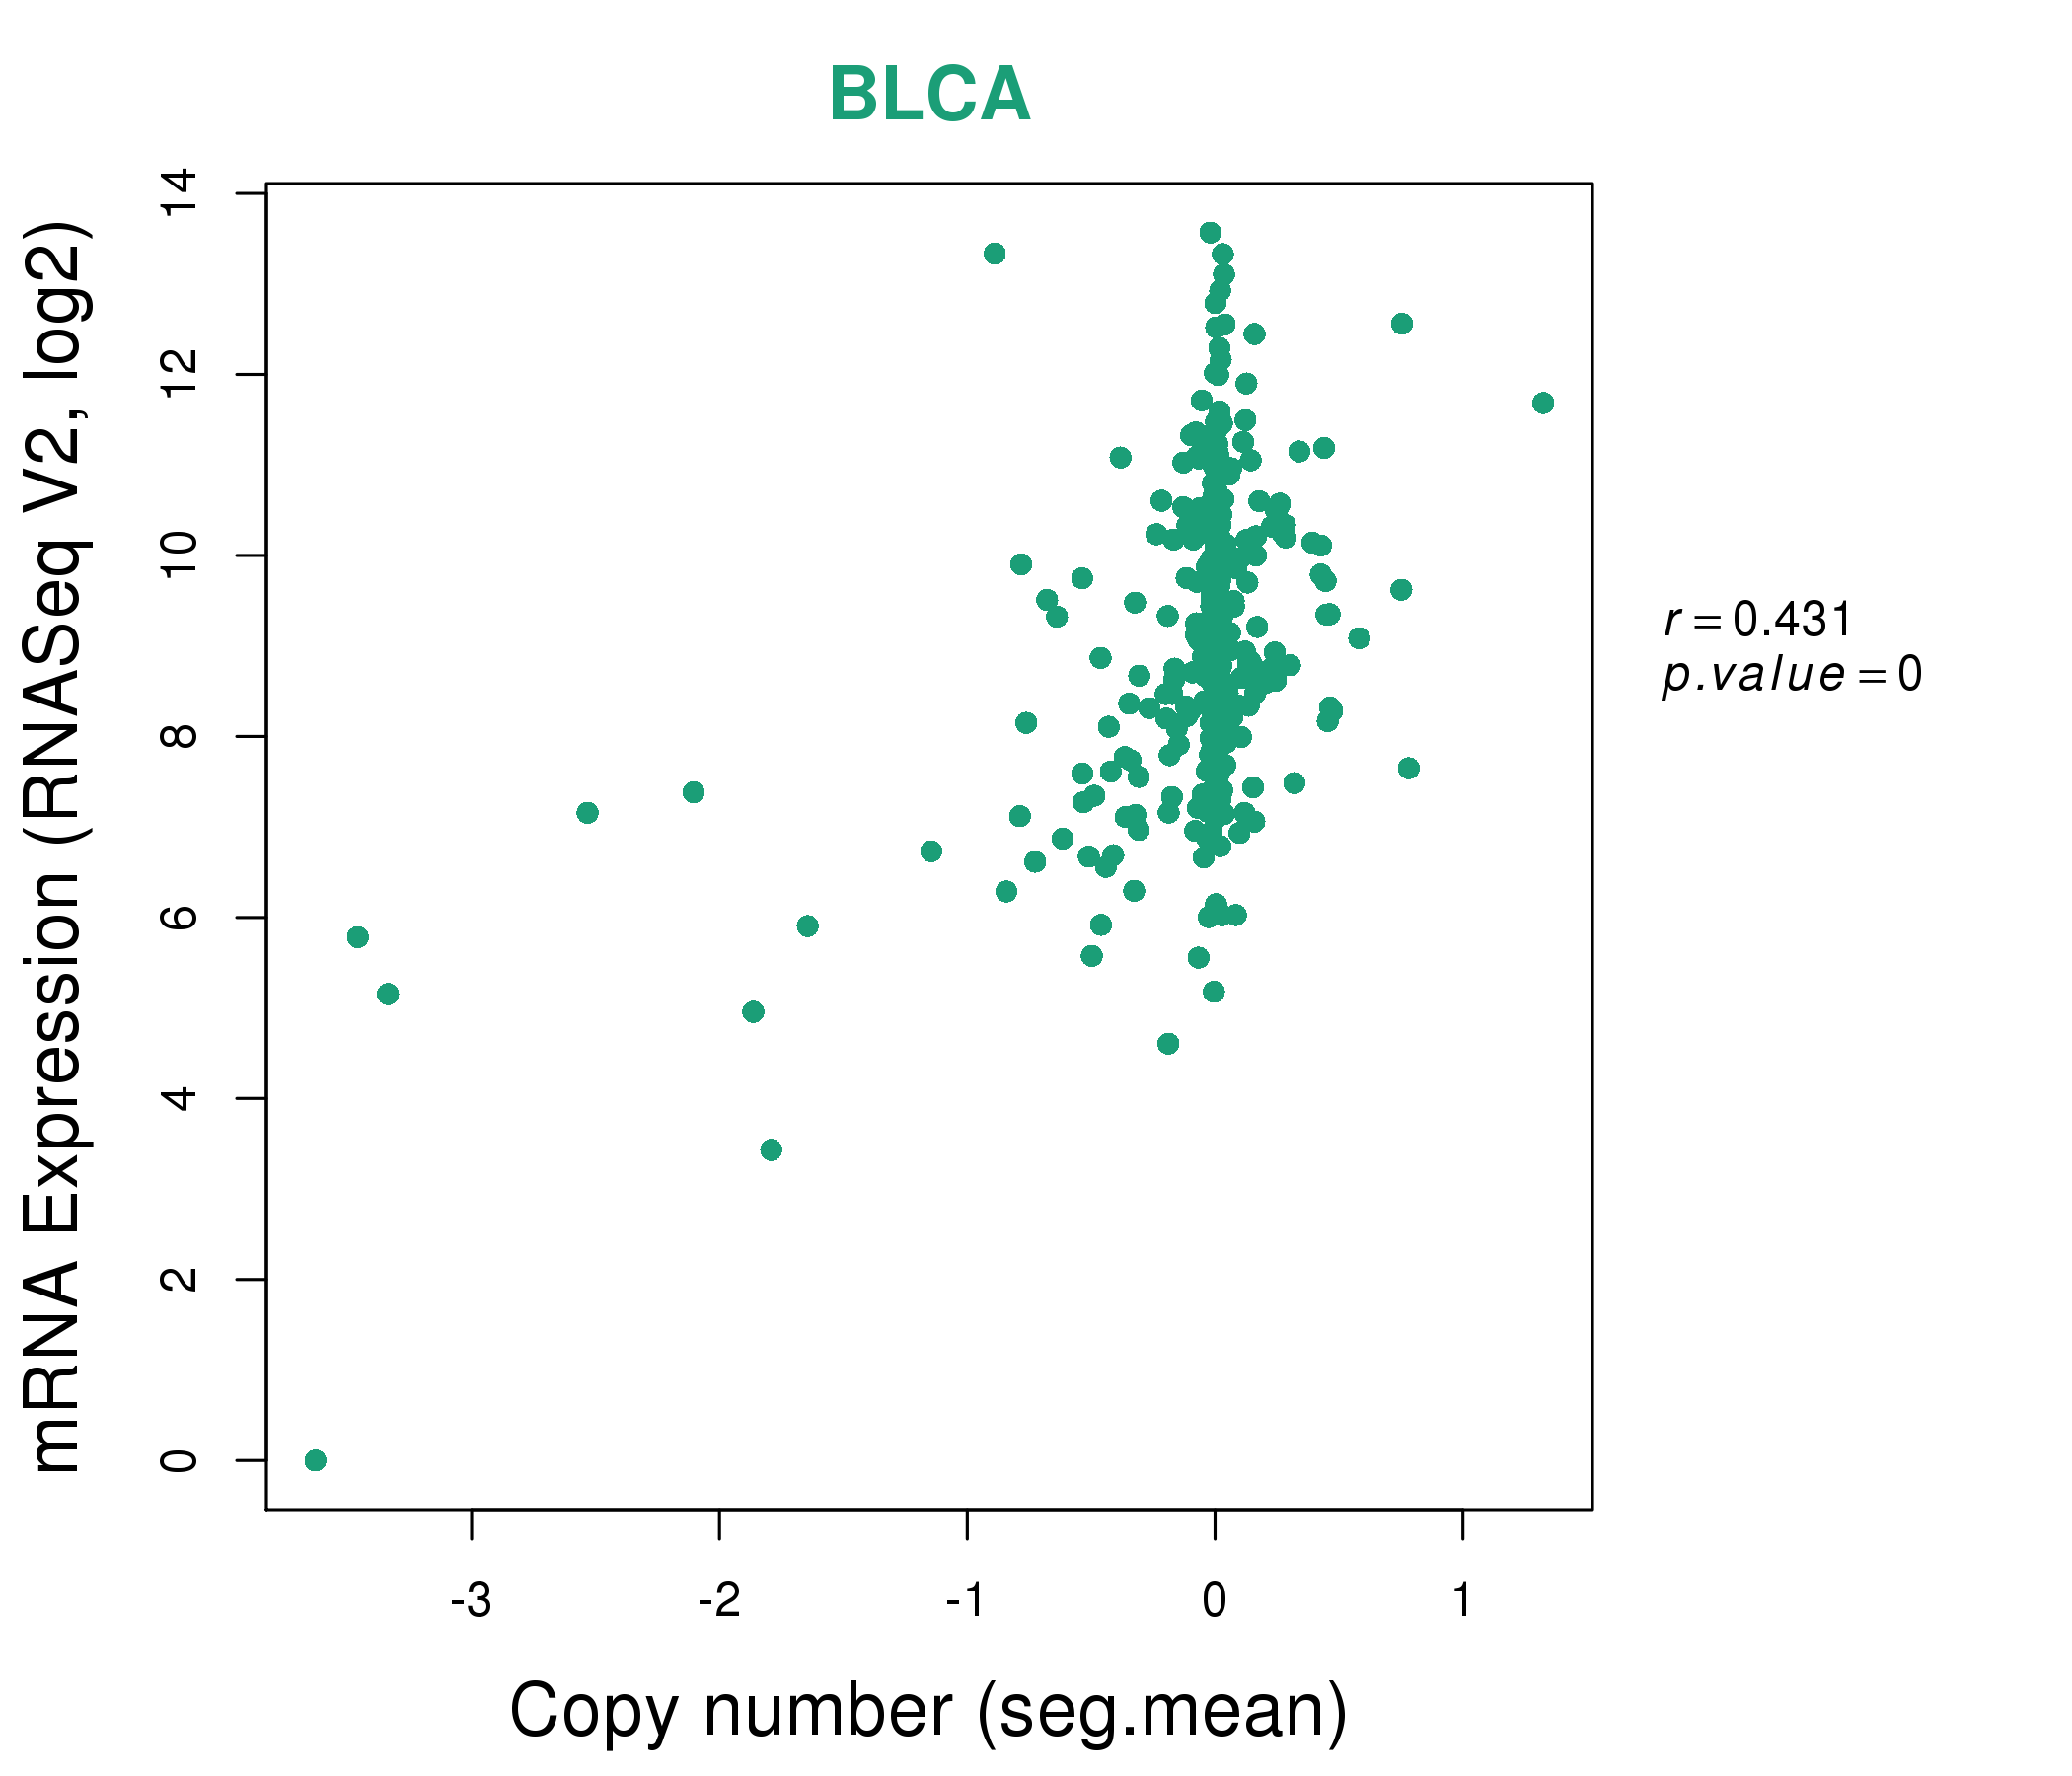
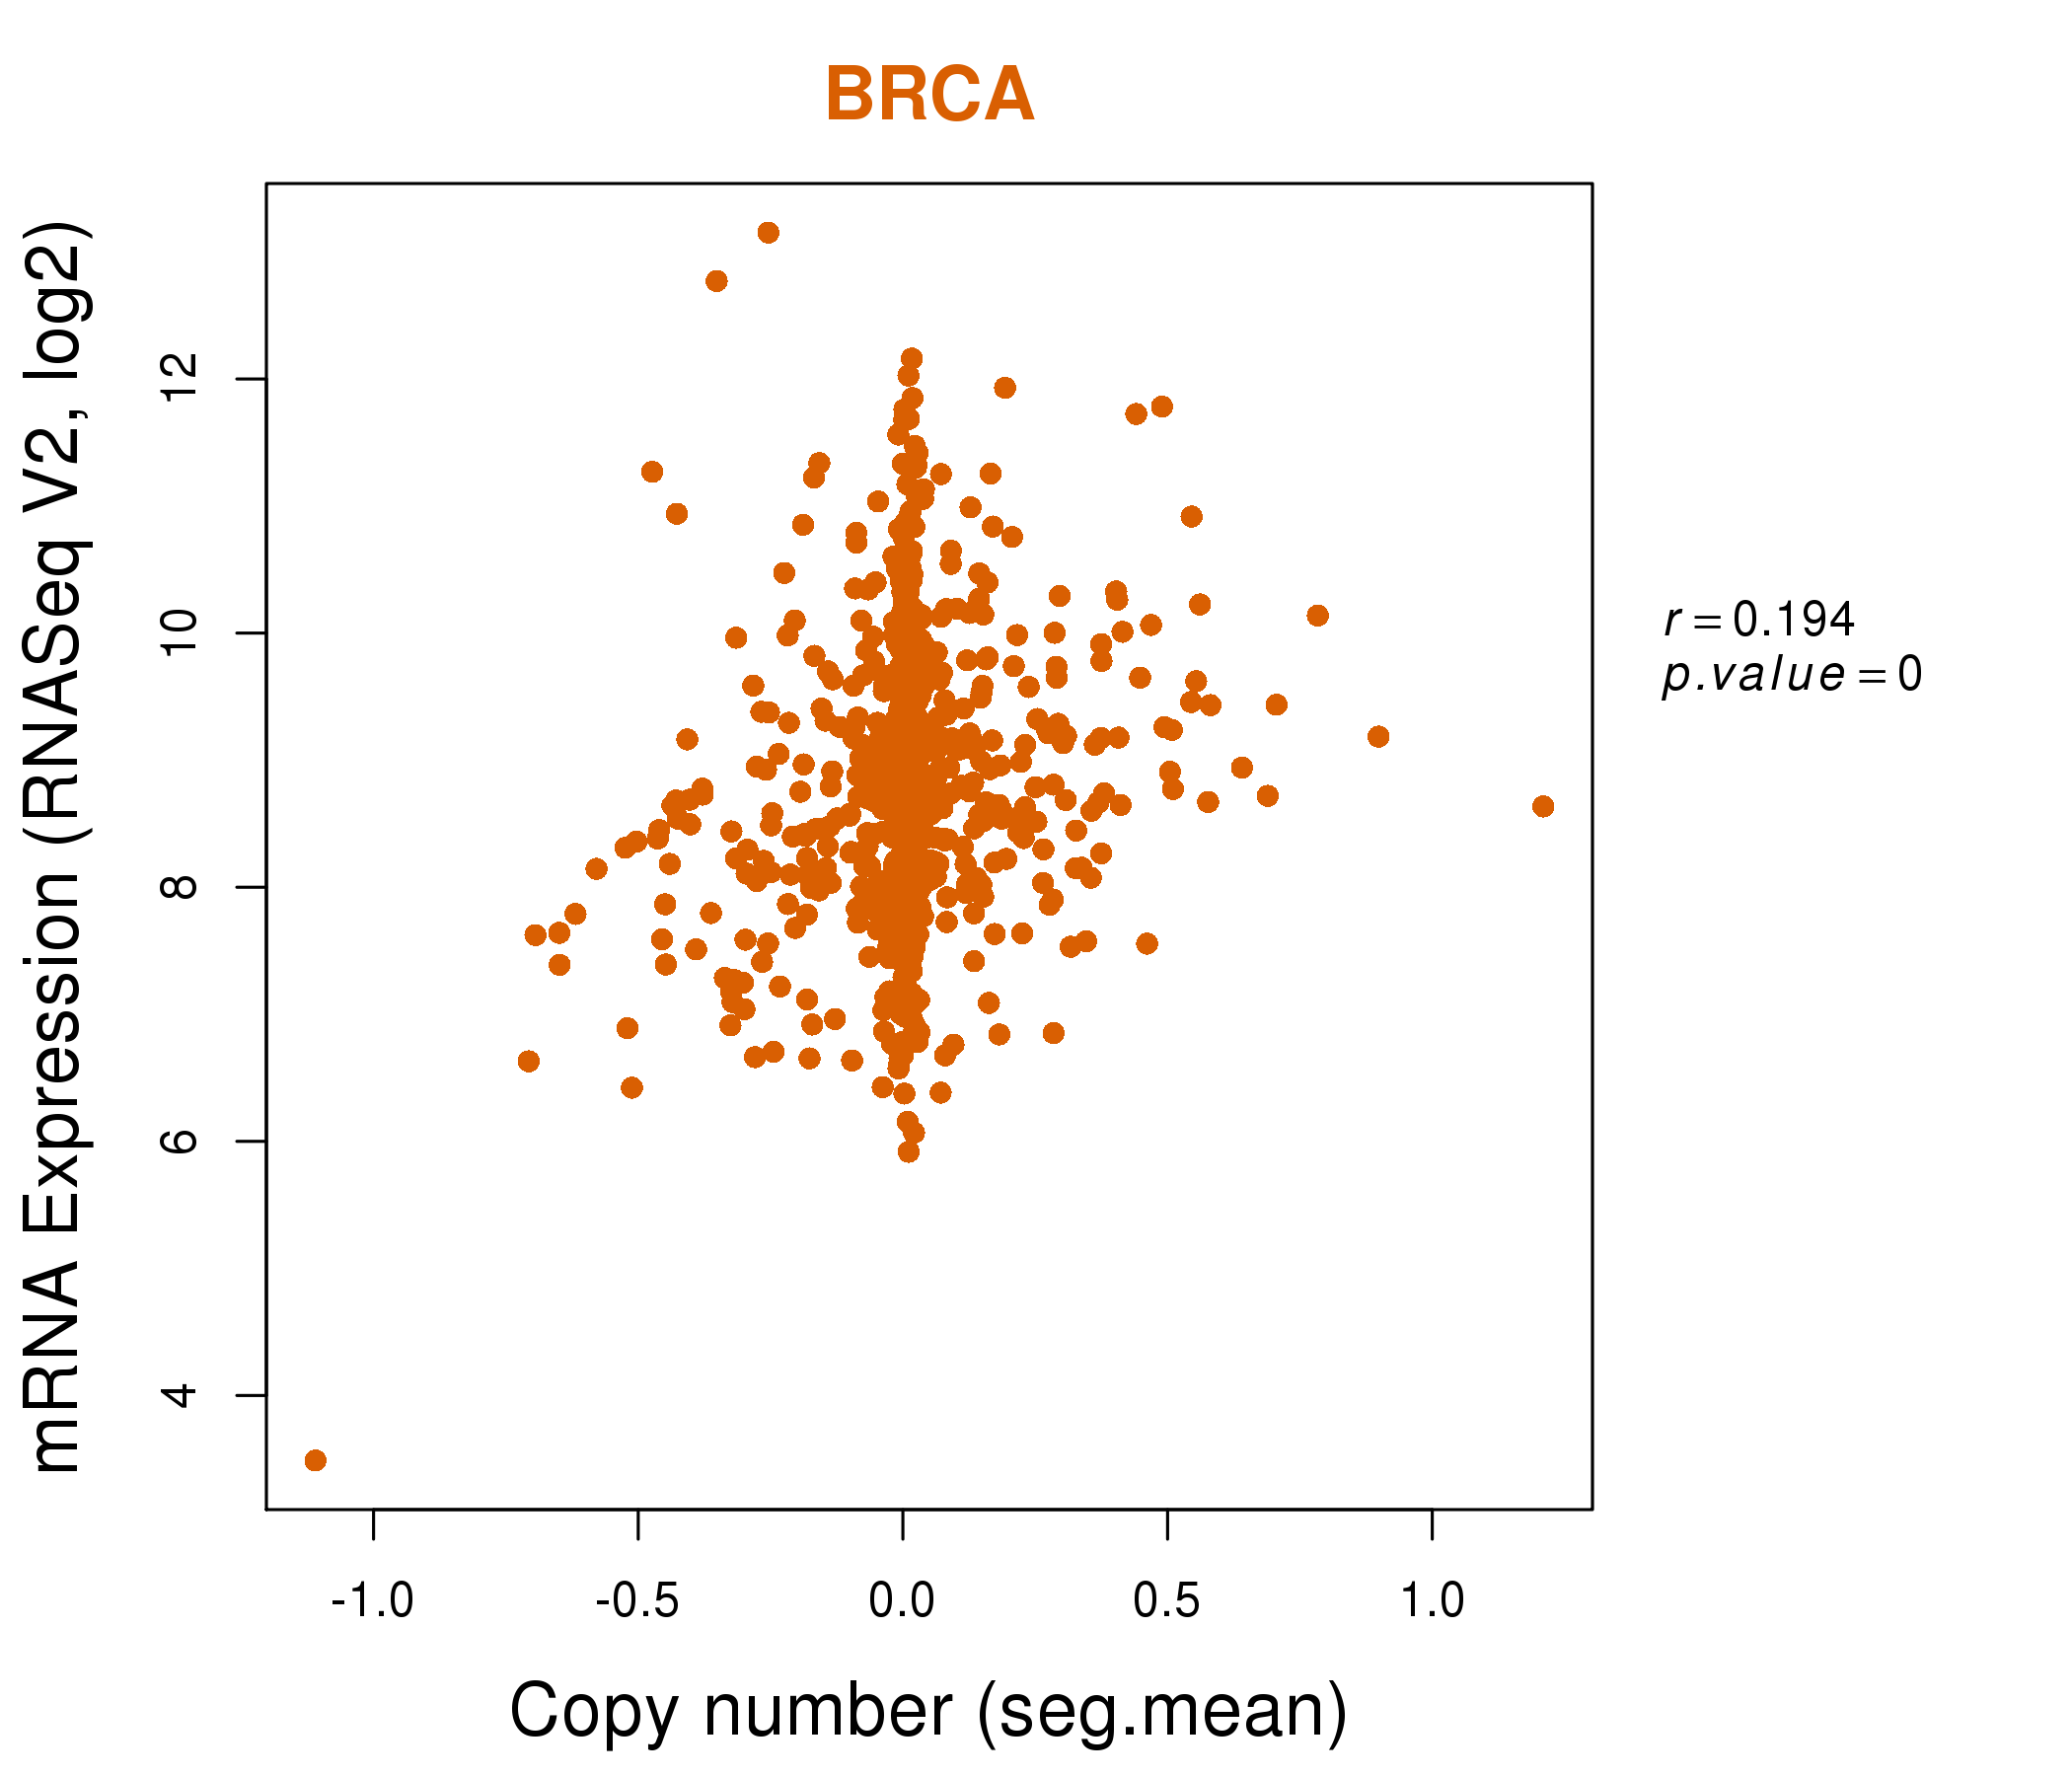
| * This plots show the correlation between CNV and gene expression. |
: Open all plots for all cancer types
 |
|
 |
|
| Top |
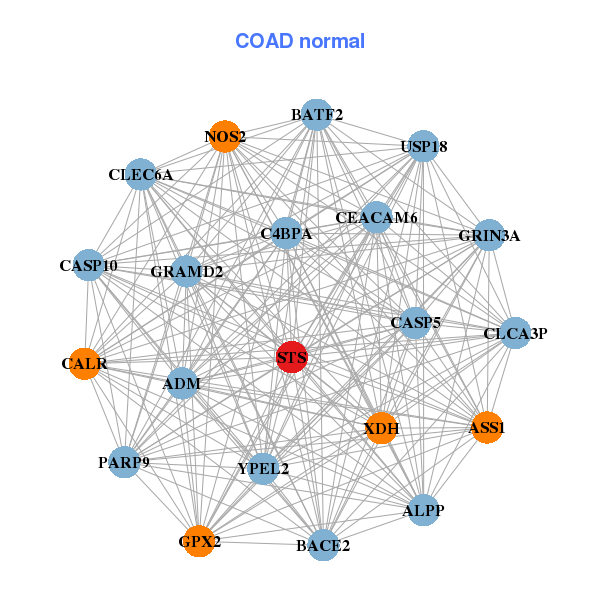
| Gene-Gene Network Information |
| * Co-Expression network figures were drawn using R package igraph. Only the top 20 genes with the highest correlations were shown. Red circle: input gene, orange circle: cell metabolism gene, sky circle: other gene |
: Open all plots for all cancer types
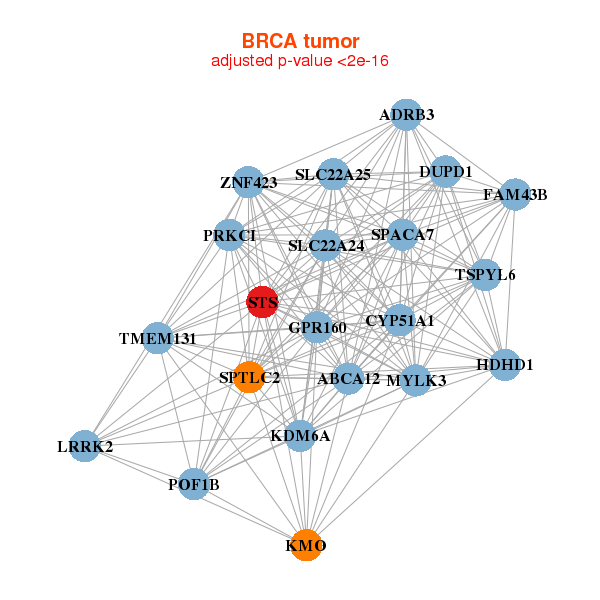 |
| ||||
| ABCA12,ADRB3,SPACA7,CYP51A1,DUPD1,FAM43B,GPR160, HDHD1,KDM6A,KMO,LRRK2,MYLK3,POF1B,PRKCI, SLC22A24,SLC22A25,SPTLC2,STS,TMEM131,TSPYL6,ZNF423 | ANGPT1,ARHGAP21,ASPH,BHMT2,CHRDL1,COBLL1,ECM2, EPB41L2,GCOM1,GNG2,GNS,ITGB1,ITSN1,KLHL5, PALM2-AKAP2,PCDH9,RHOQ,SAR1A,SEPT11,SORBS1,STS | ||||
 |
| ||||
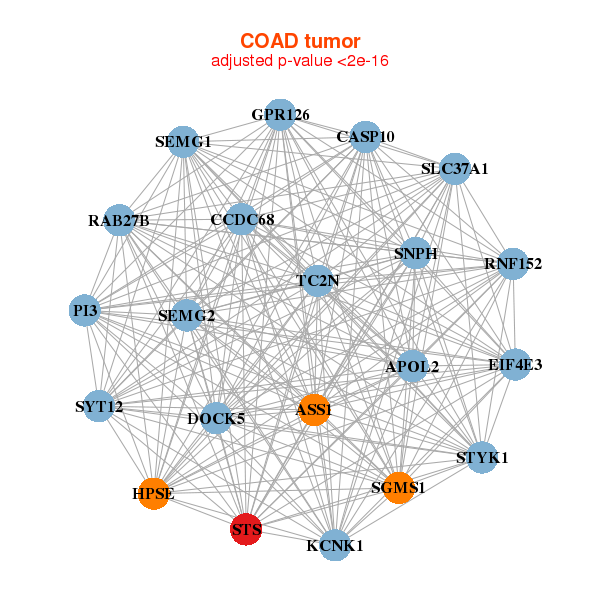
| APOL2,ASS1,CASP10,CCDC68,DOCK5,EIF4E3,GPR126, HPSE,KCNK1,PI3,RAB27B,RNF152,SEMG1,SEMG2, SGMS1,SLC37A1,SNPH,STS,STYK1,SYT12,TC2N | ADM,ALPP,ASS1,BACE2,BATF2,C4BPA,CALR, CASP10,CASP5,CEACAM6,CLCA3P,CLEC6A,GPX2,GRAMD2, GRIN3A,NOS2,PARP9,STS,USP18,XDH,YPEL2 |
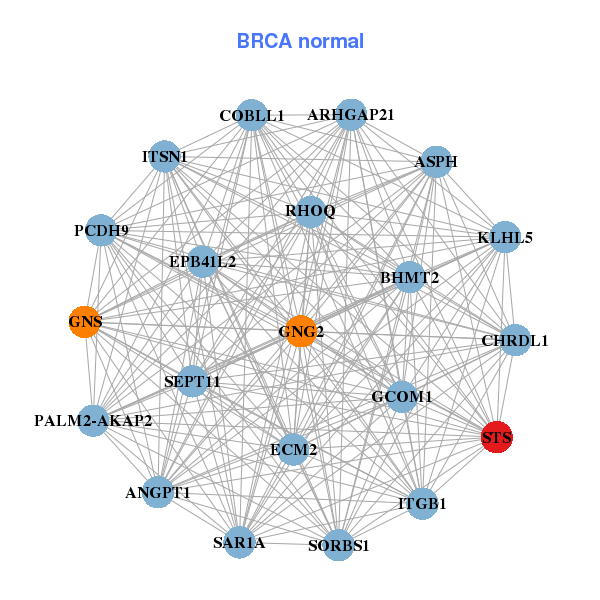
| * Co-Expression network figures were drawn using R package igraph. Only the top 20 genes with the highest correlations were shown. Red circle: input gene, orange circle: cell metabolism gene, sky circle: other gene |
: Open all plots for all cancer types
| Top |
: Open all interacting genes' information including KEGG pathway for all interacting genes from DAVID
| Top |
| Pharmacological Information for STS |
| DB Category | DB Name | DB's ID and Url link |
| * Gene Centered Interaction Network. |
 |
| * Drug Centered Interaction Network. |
| DrugBank ID | Target Name | Drug Groups | Generic Name | Drug Centered Network | Drug Structure |
| DB01808 | steroid sulfatase (microsomal), isozyme S | experimental | Thiarsahydroxy-Cysteine |  |  |
| DB03352 | steroid sulfatase (microsomal), isozyme S | experimental | S-Arsonocysteine | 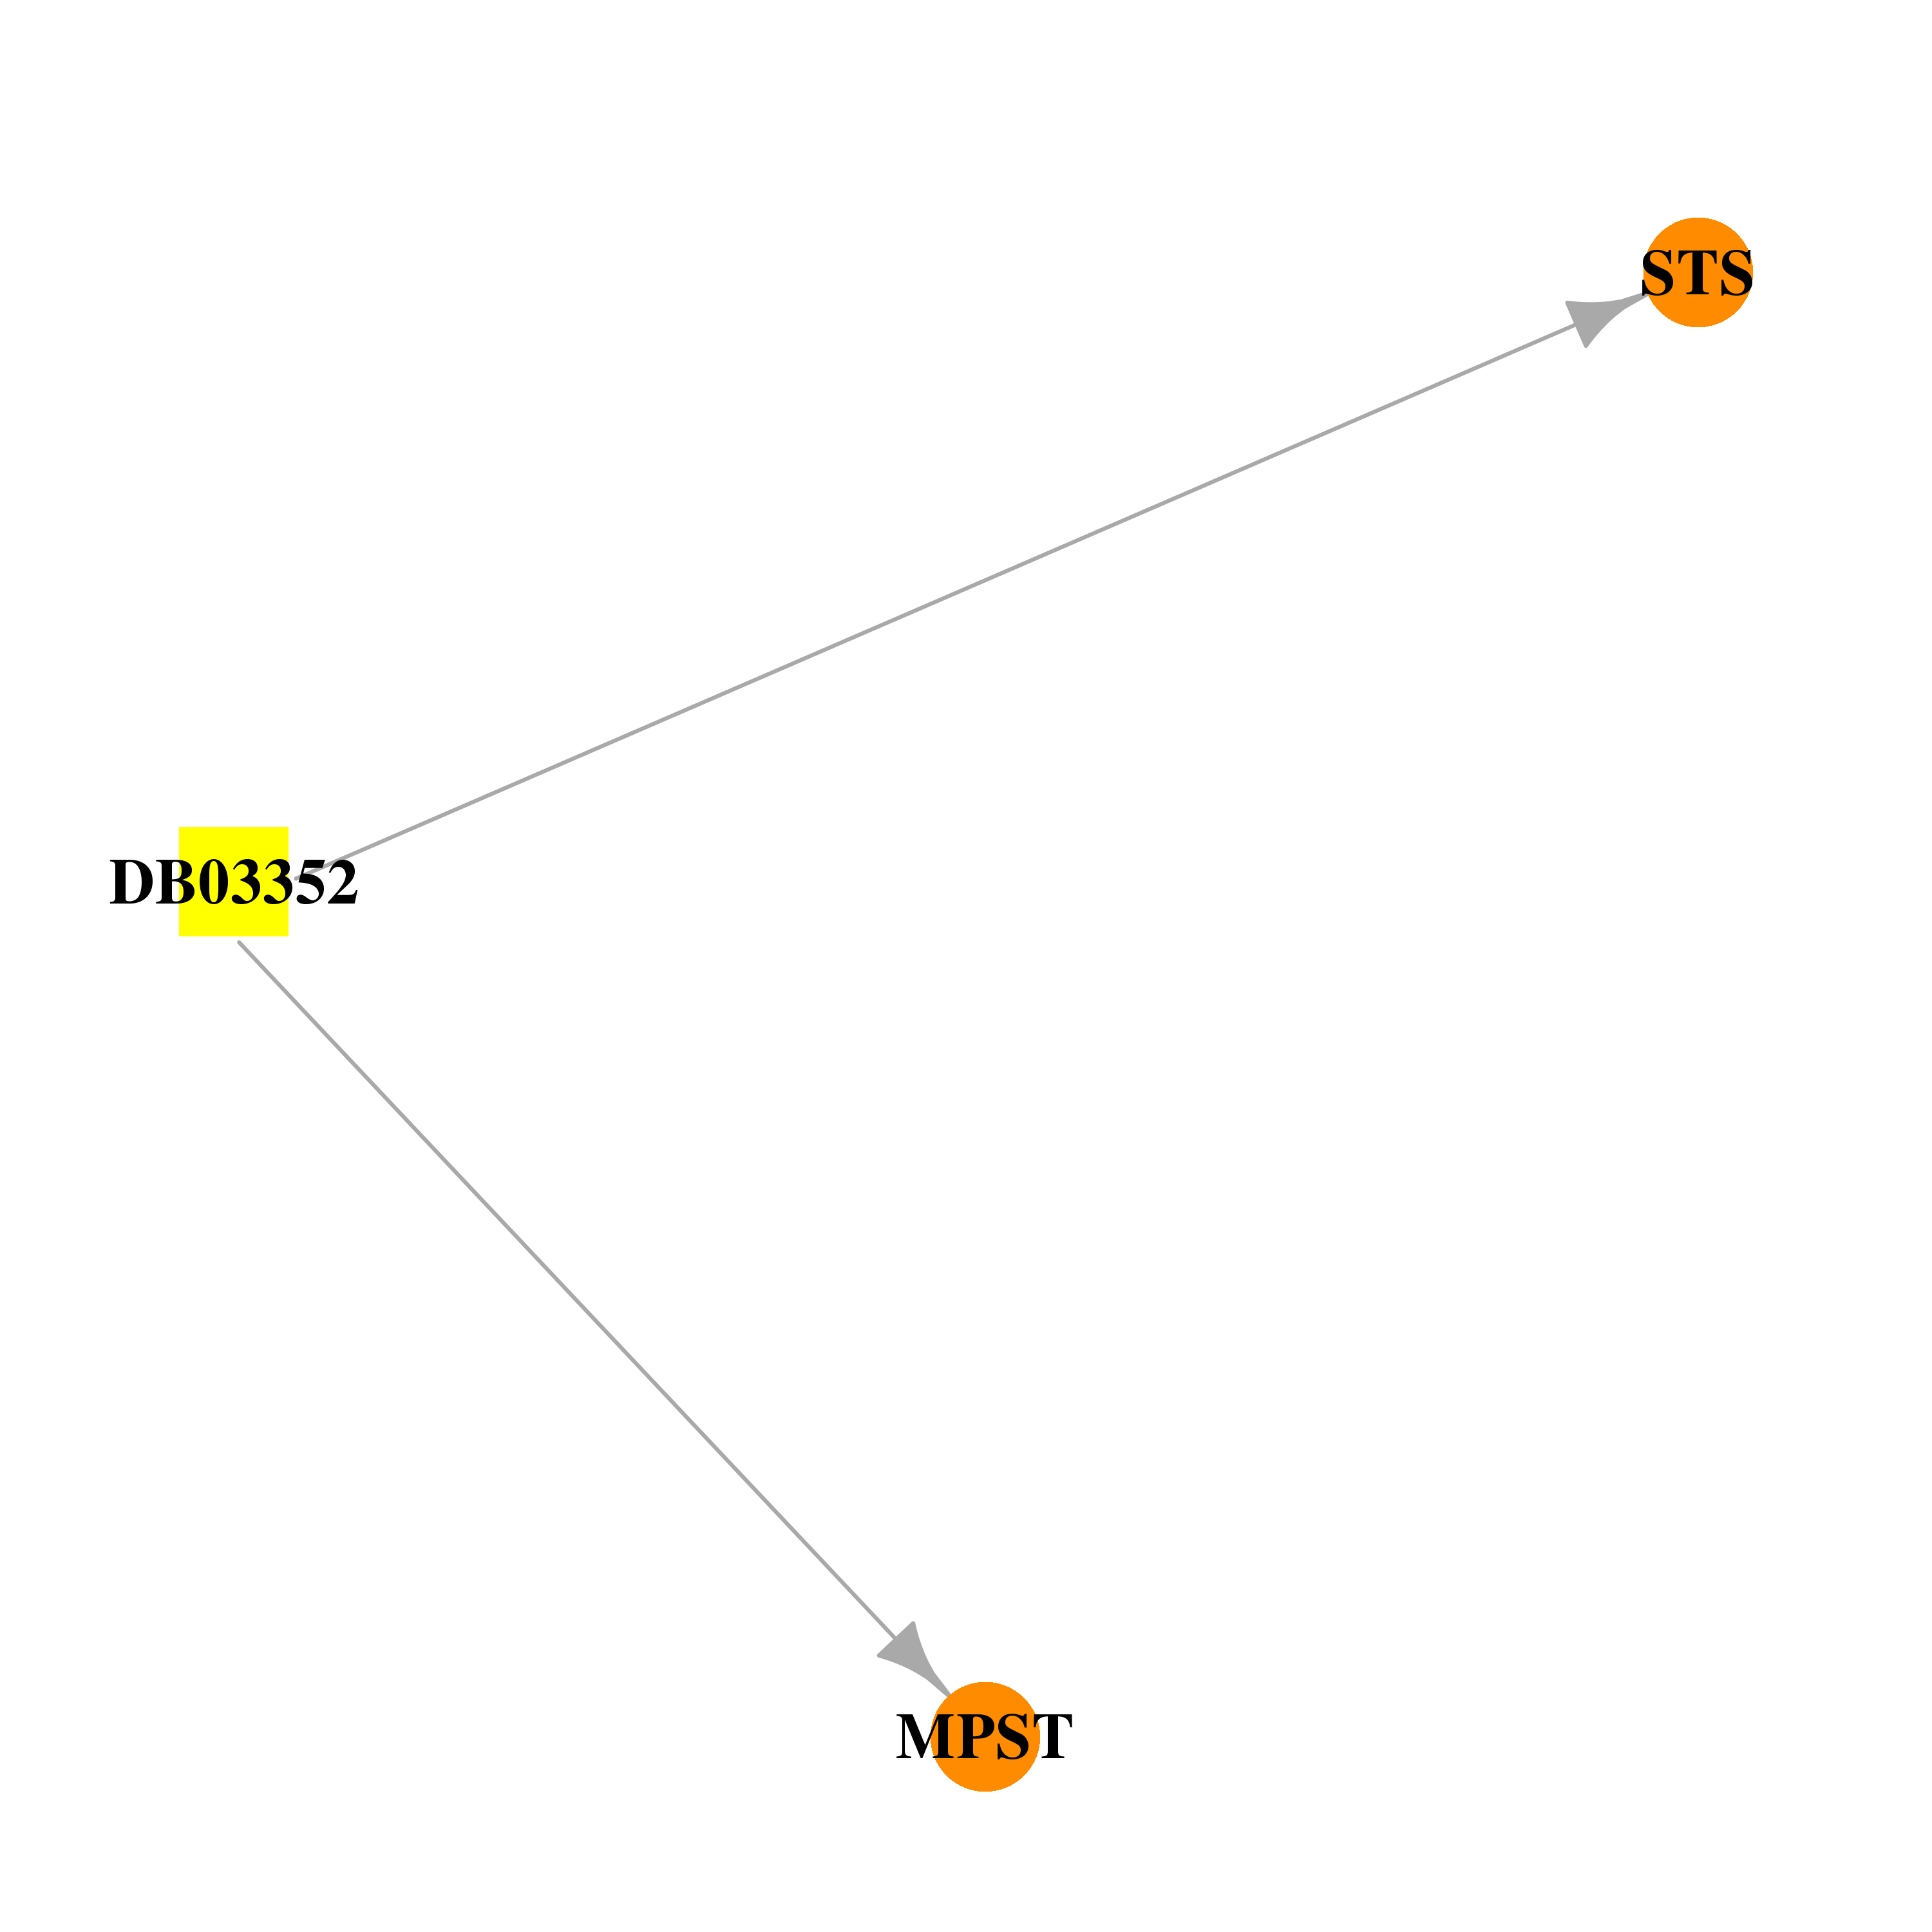 |  |
| DB04456 | steroid sulfatase (microsomal), isozyme S | experimental | Trihydroxyarsenite(Iii) | 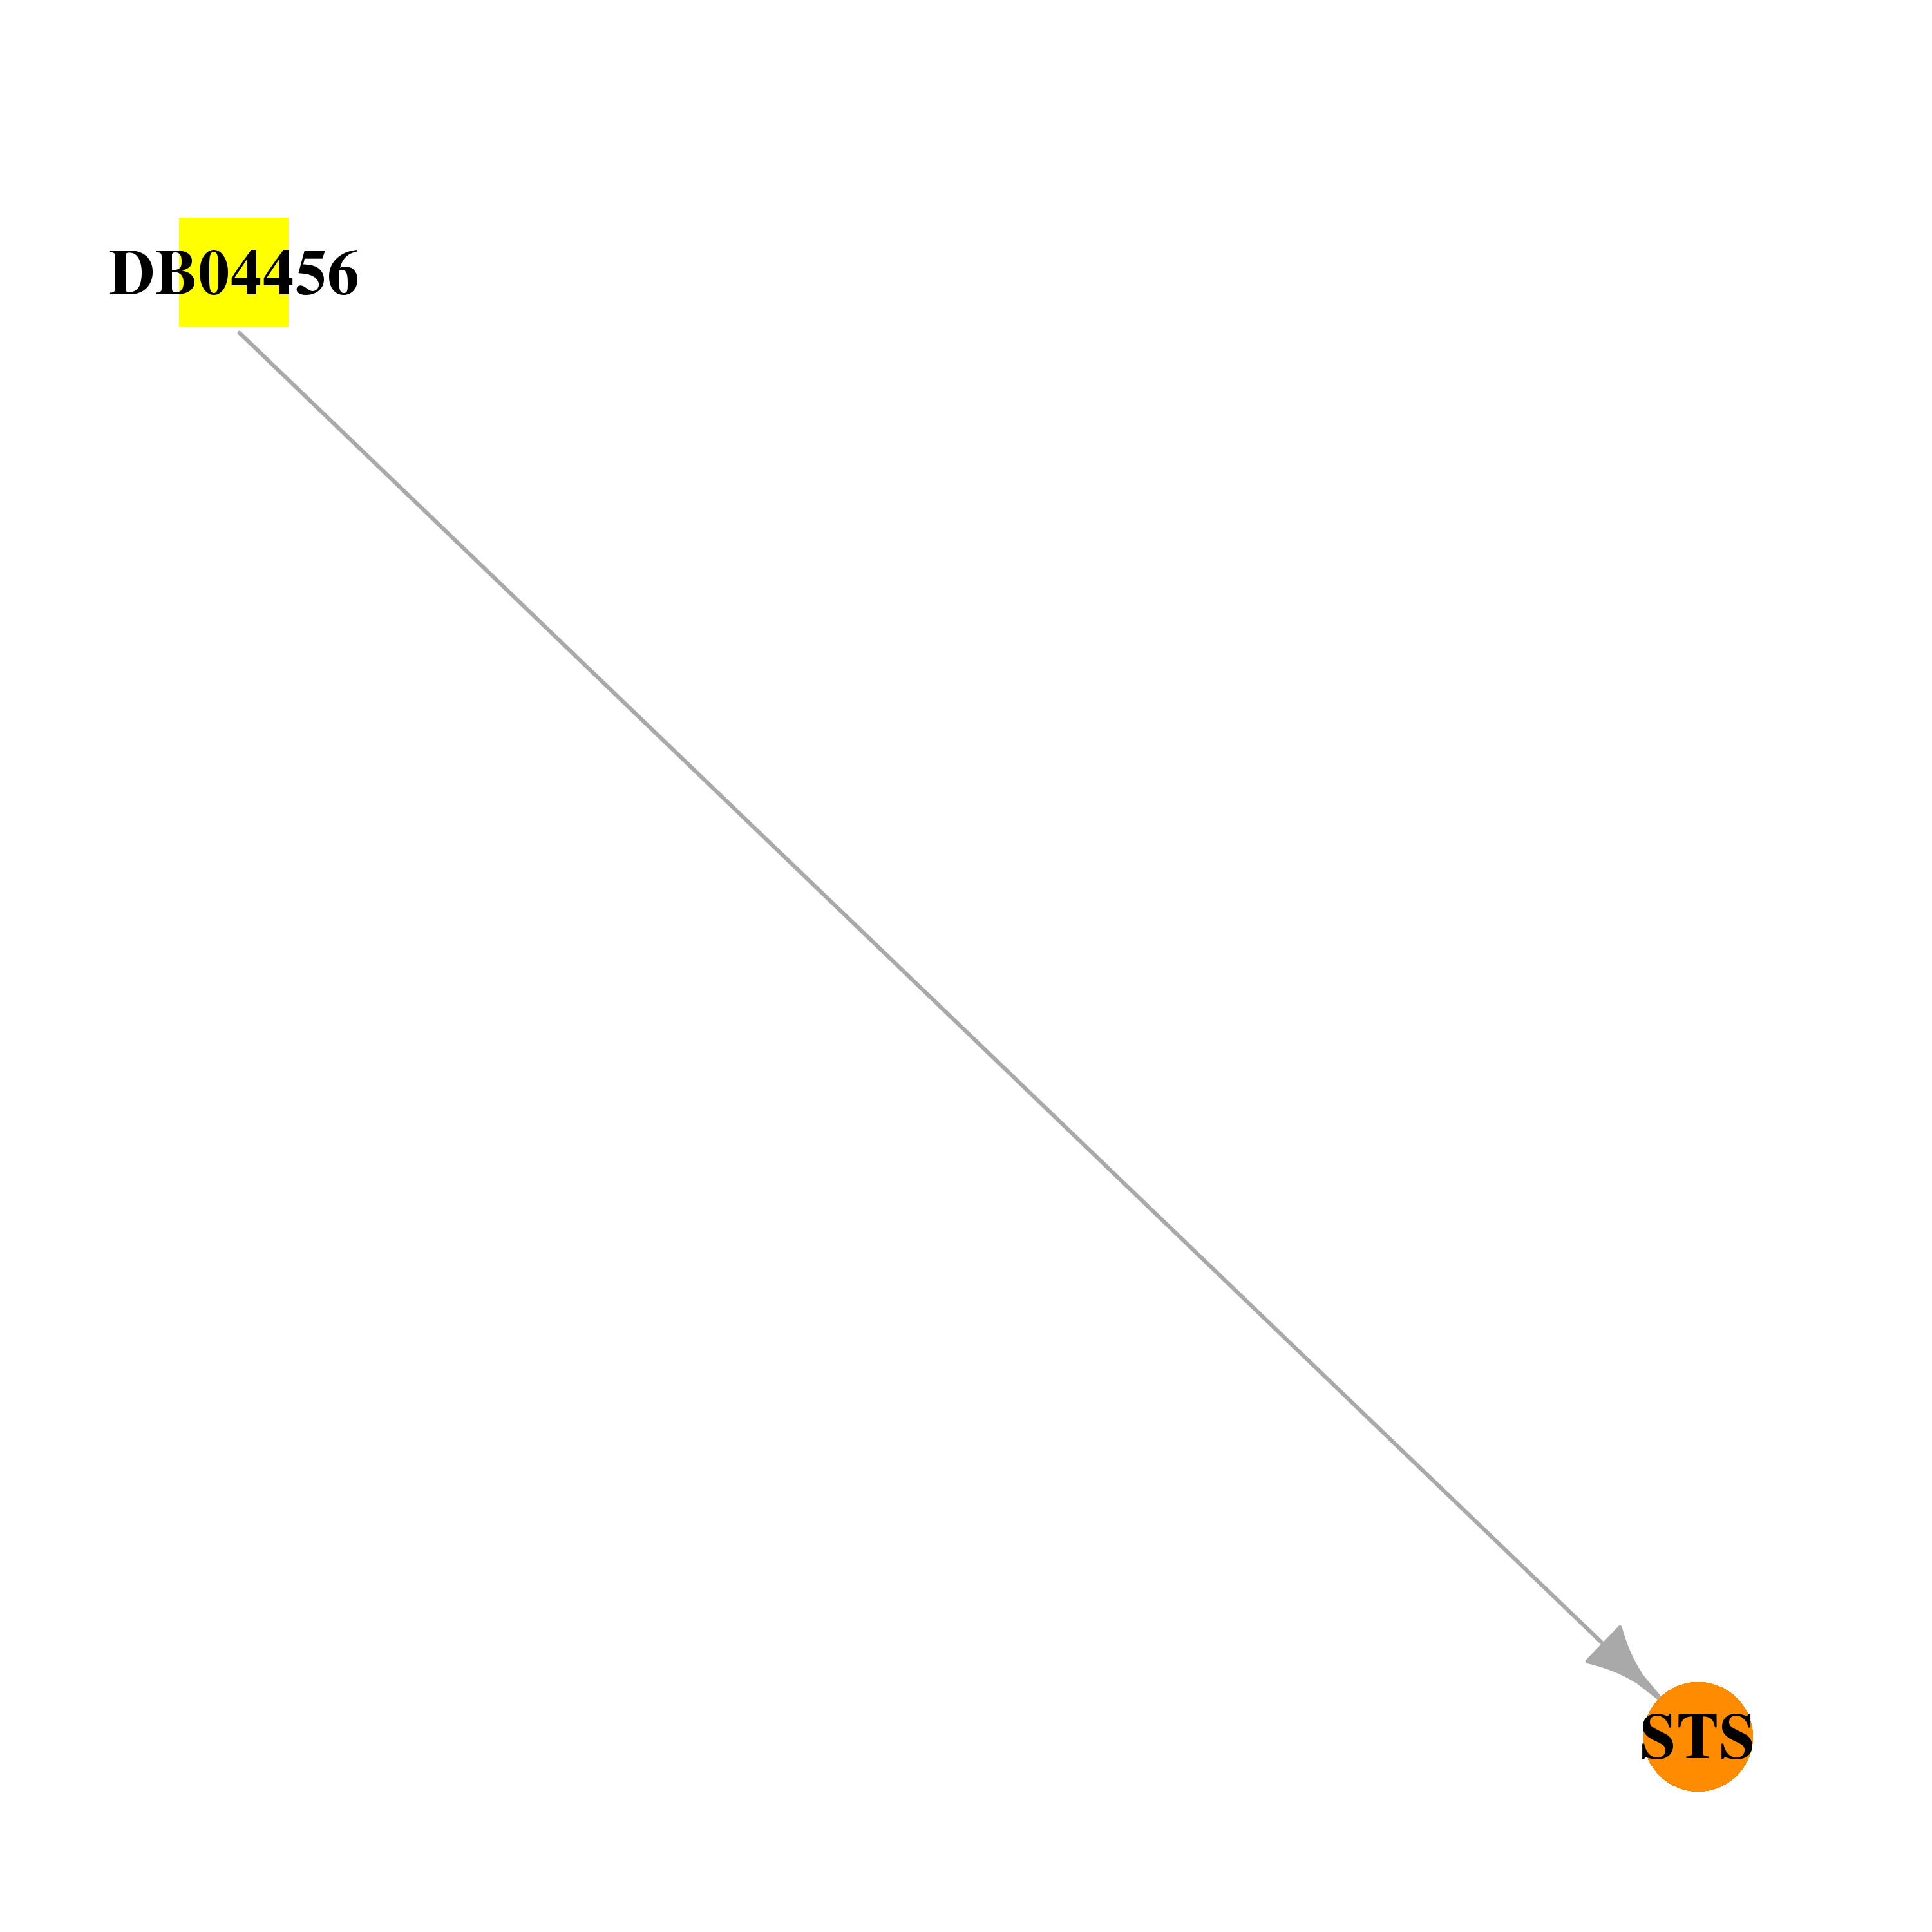 | 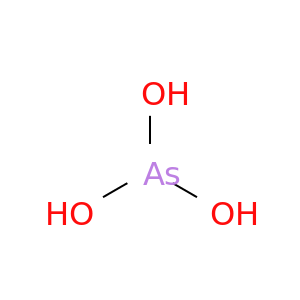 |
| DB02763 | steroid sulfatase (microsomal), isozyme S | experimental | 5-Mercapto-2-Nitro-Benzoic Acid | 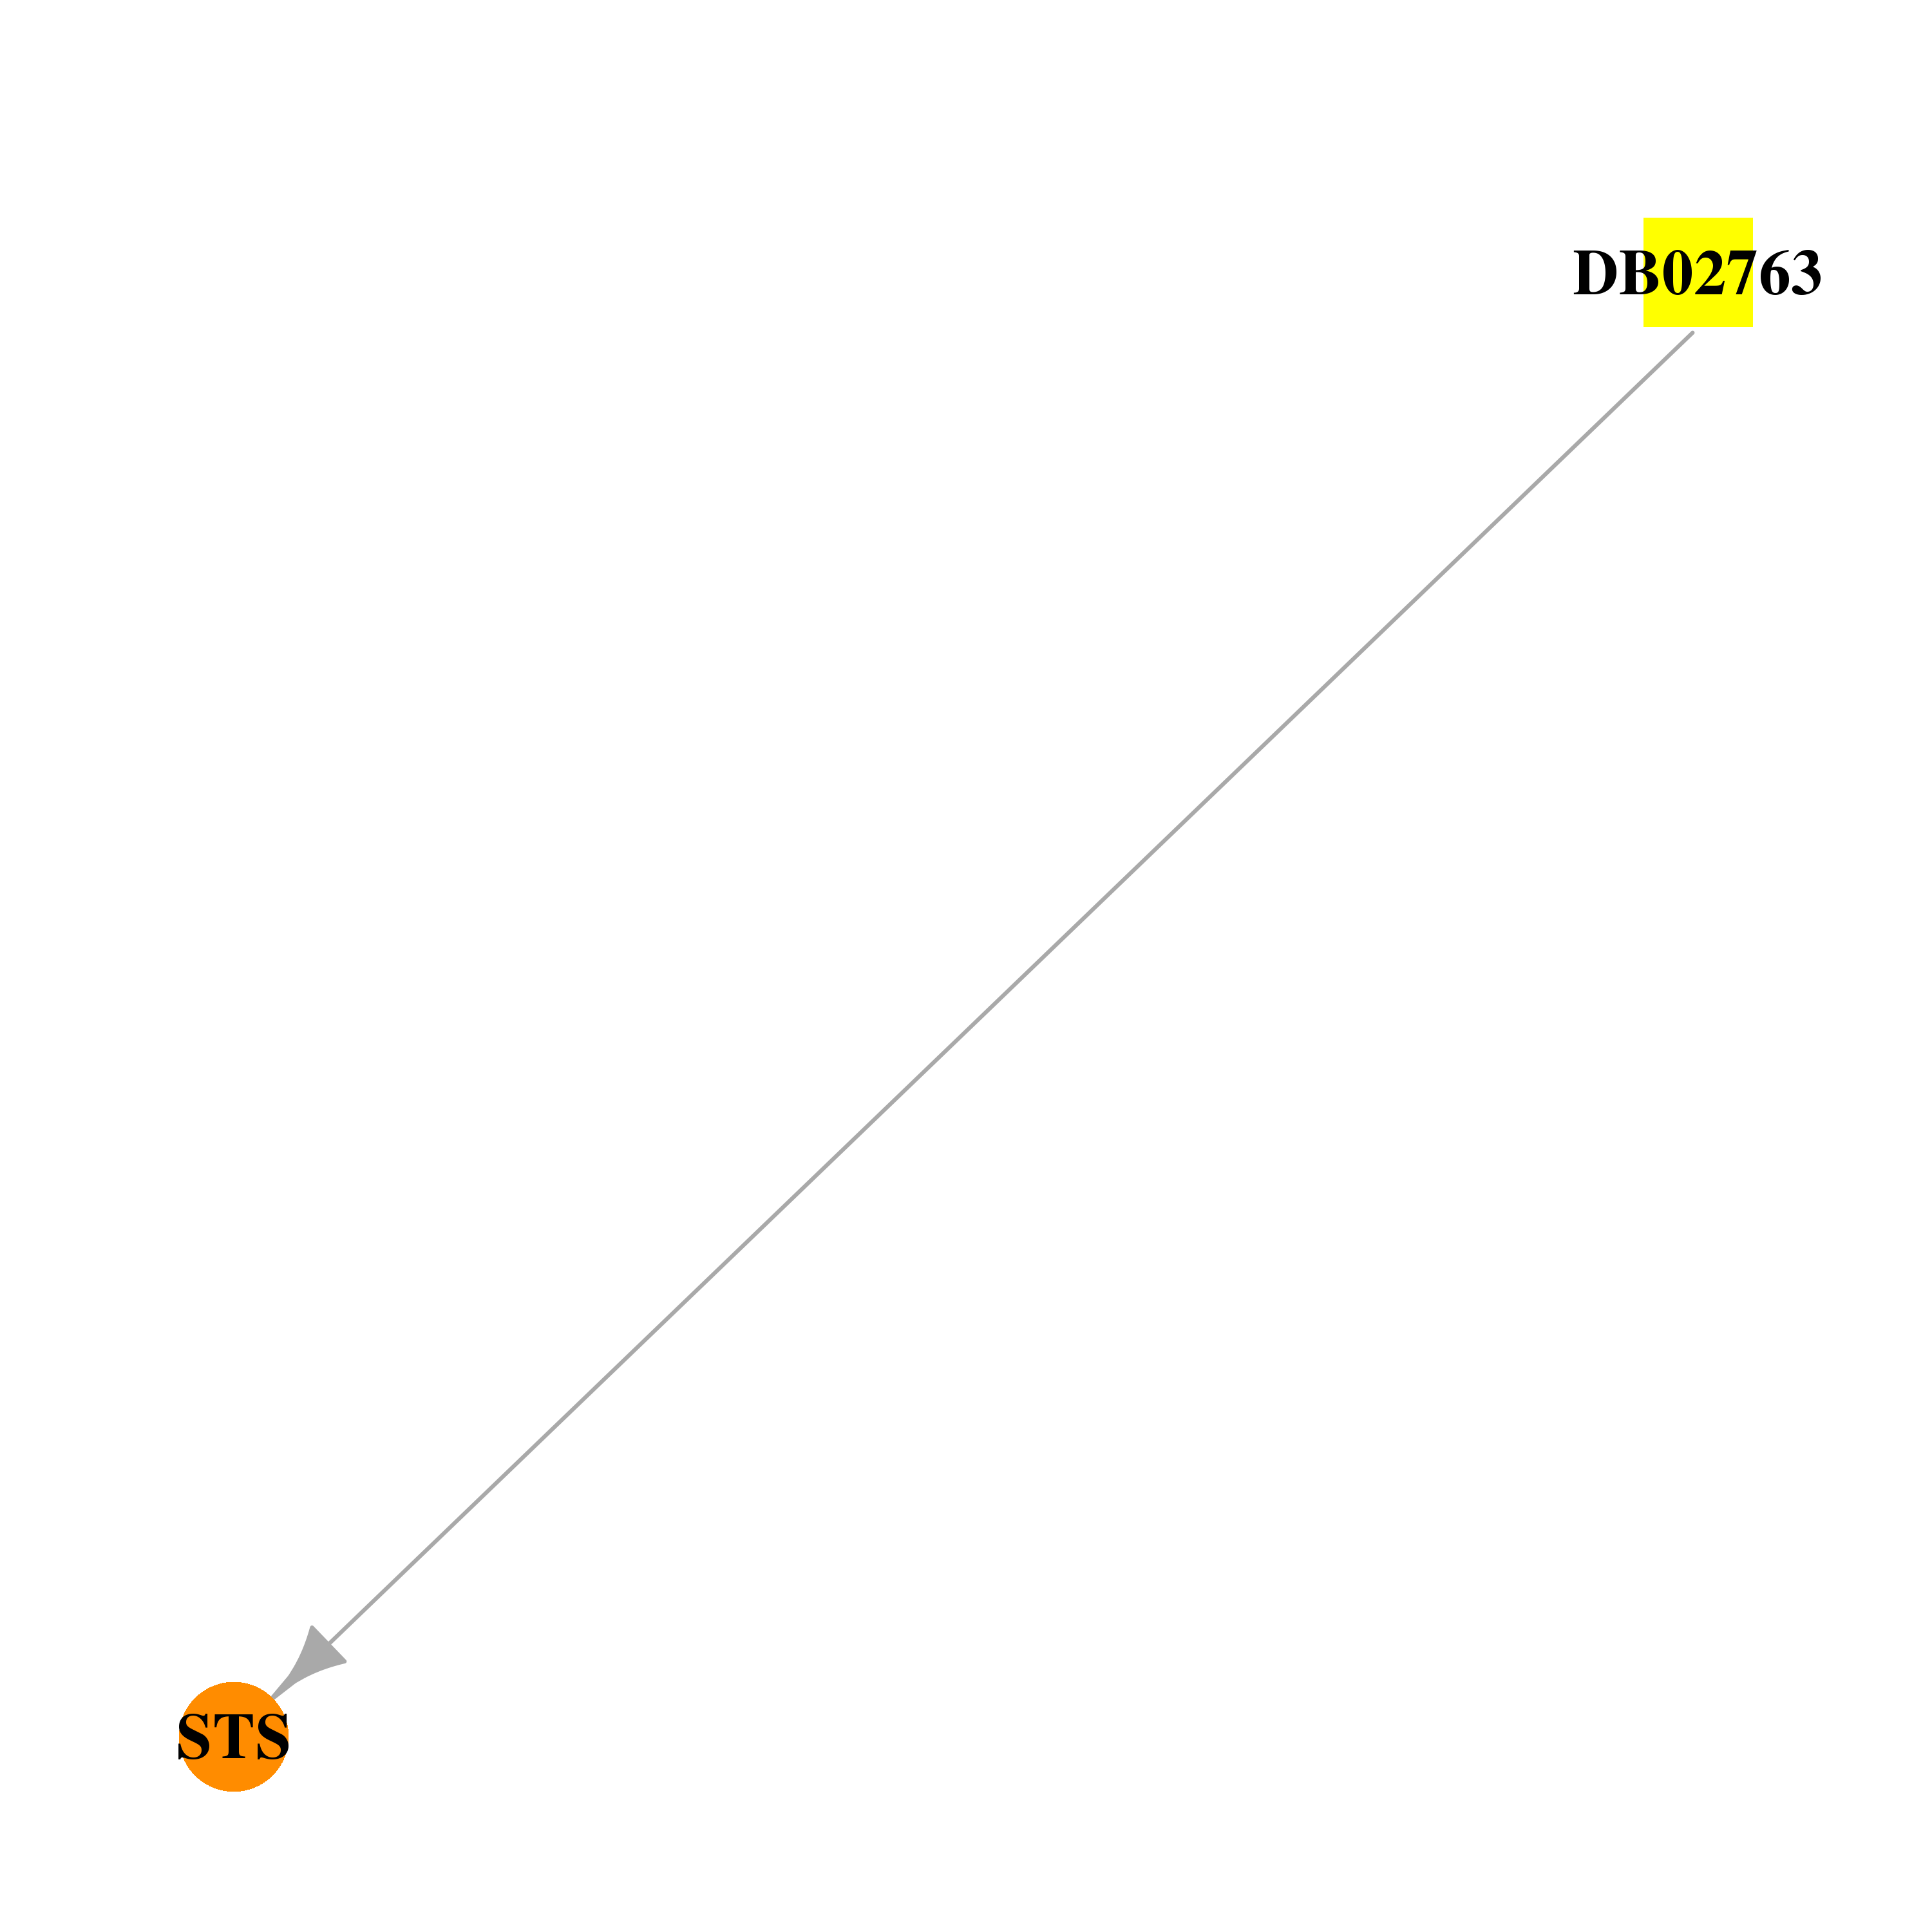 | 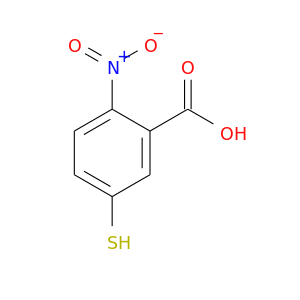 |
| DB03138 | steroid sulfatase (microsomal), isozyme S | experimental | Perchlorate Ion | 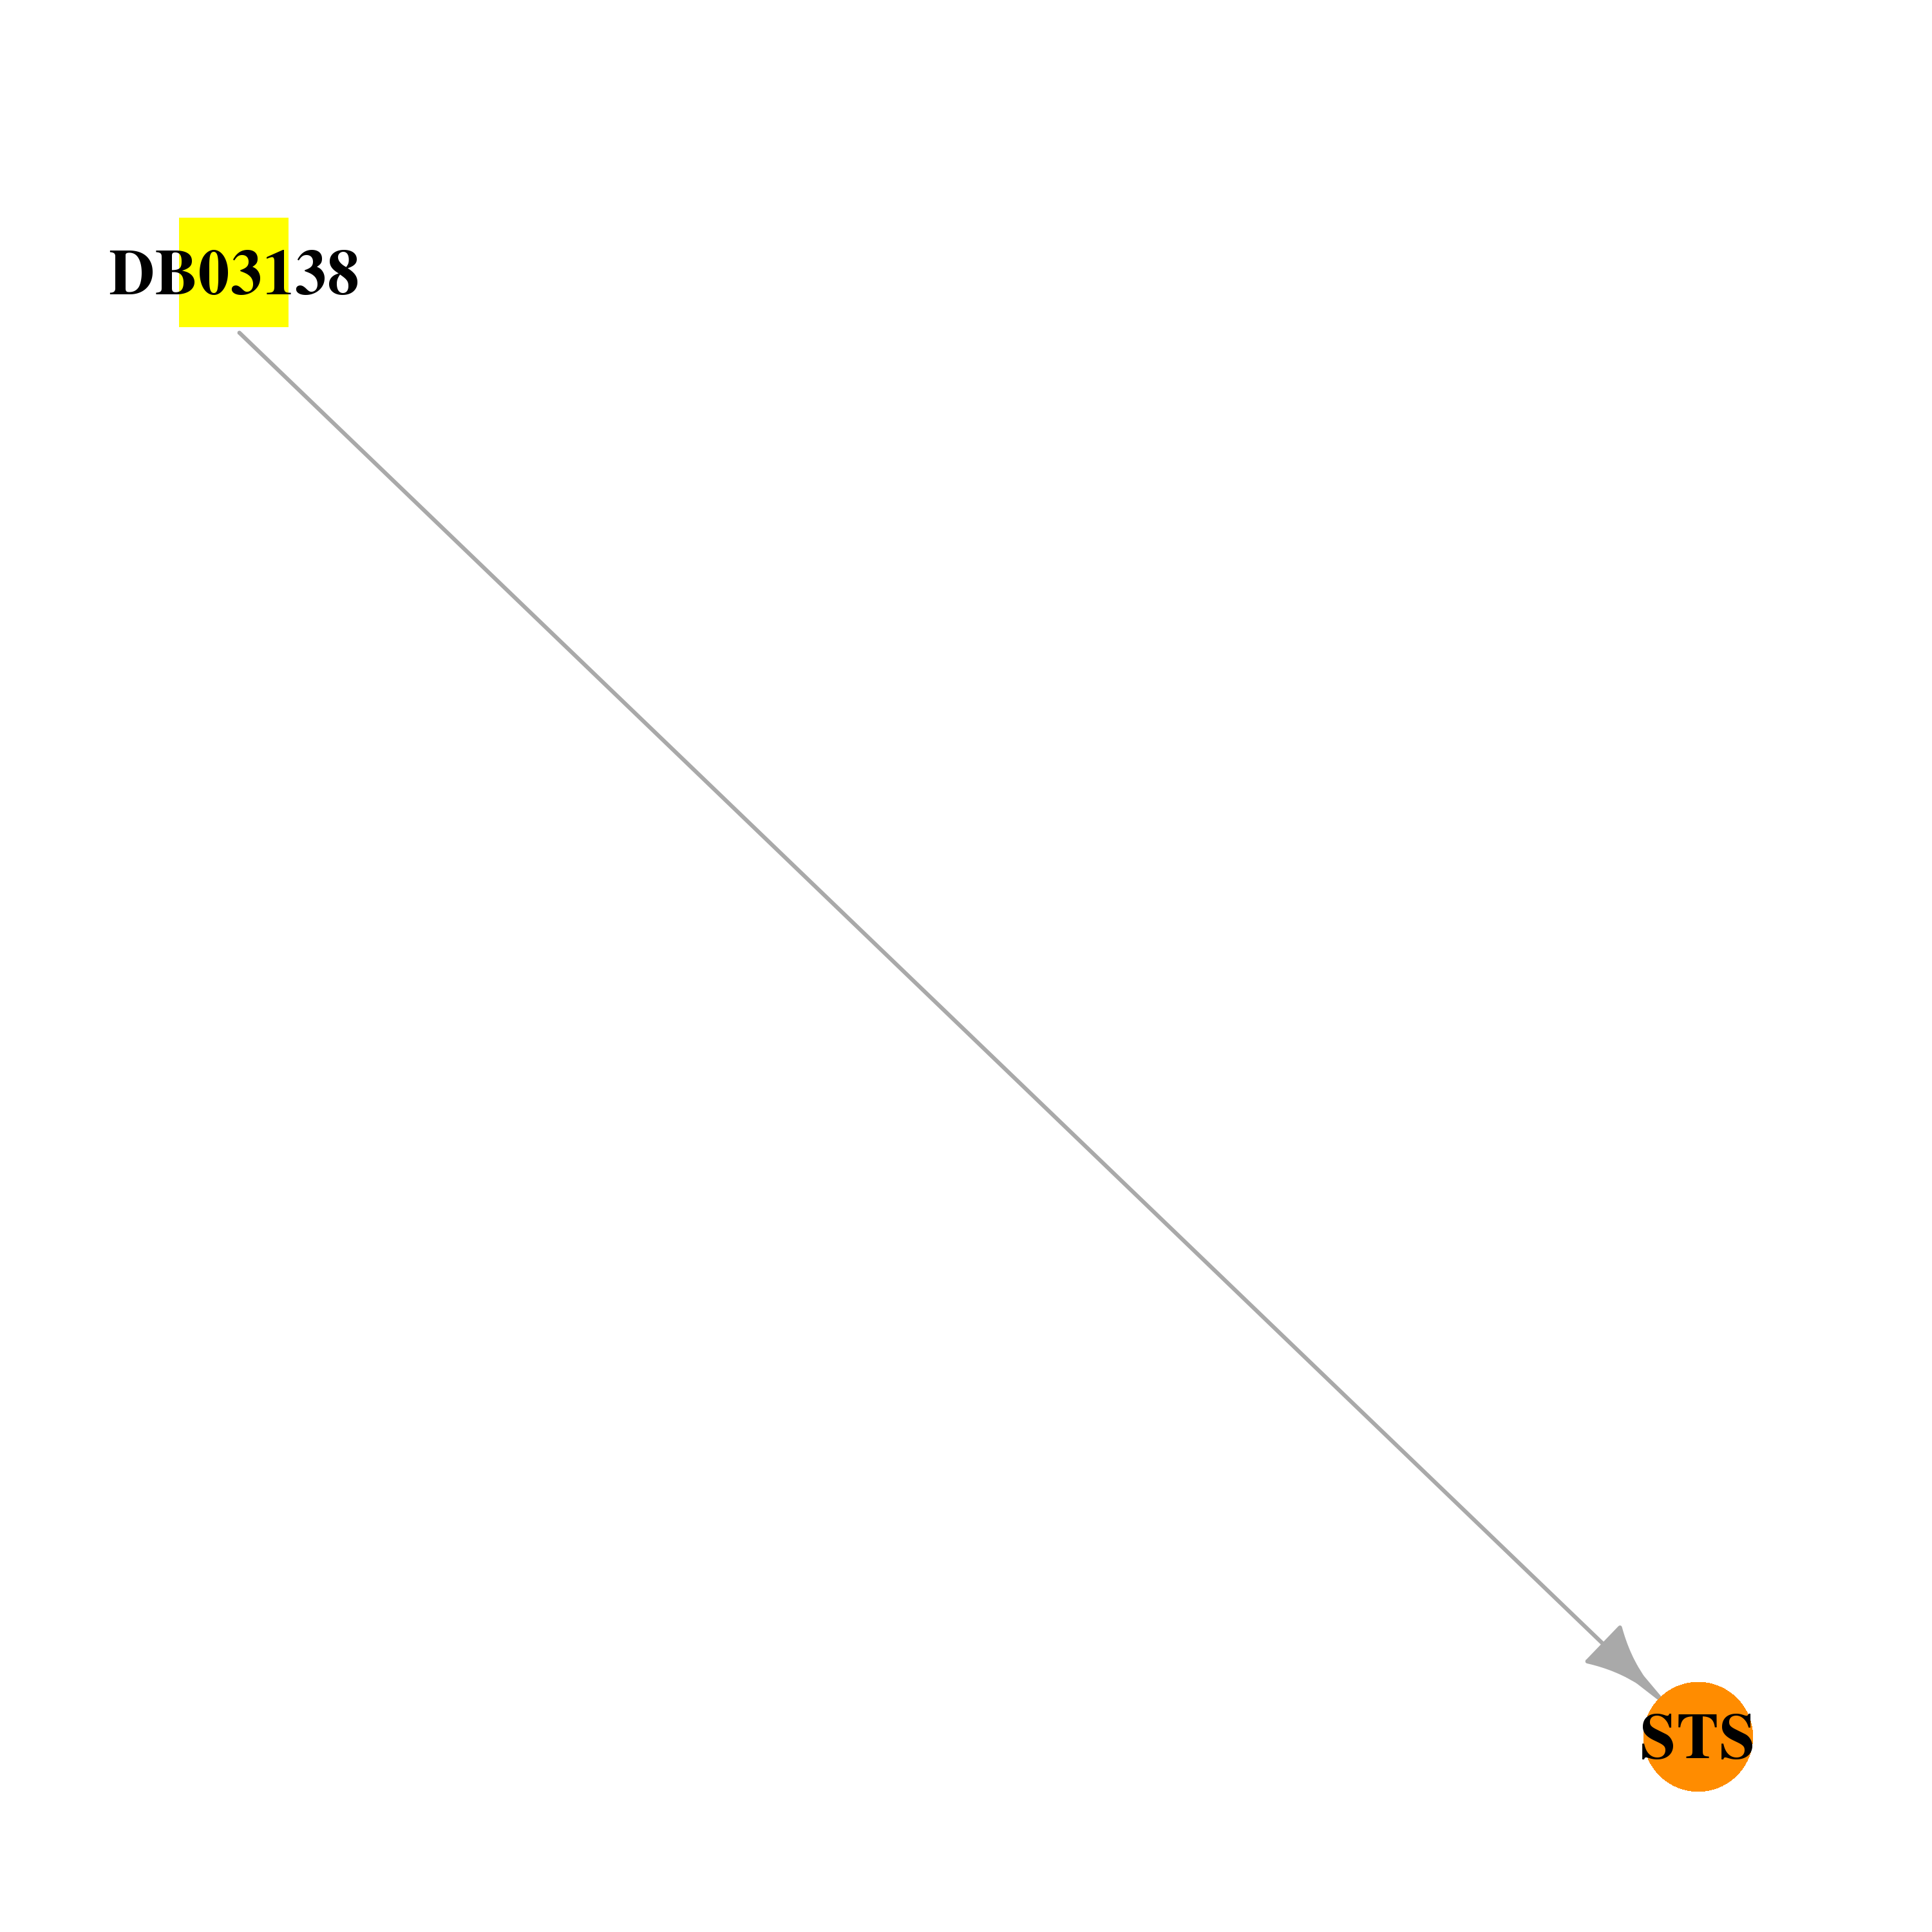 | 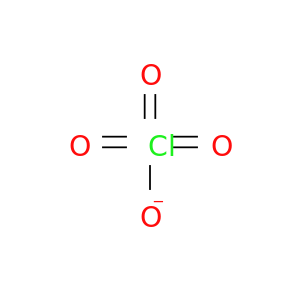 |
| Top |
| Cross referenced IDs for STS |
| * We obtained these cross-references from Uniprot database. It covers 150 different DBs, 18 categories. http://www.uniprot.org/help/cross_references_section |
: Open all cross reference information
|
Copyright © 2016-Present - The Univsersity of Texas Health Science Center at Houston @ |