|
||||||||||||||||||||||||||||||||||||||||||||||||||||||||||||||||||||||||||||||||||||||||||||||||||||||||||||||||||||||||||||||||||||||||||||||||||||||||||||||||||||||||||||||||||||||||||||||||||||||||||||||||||||||||||||||||||||||||||||||||||||||||||||||||||||||||||||||||||||||||||||||||||||||||||||||||||||||||||
| |
| Phenotypic Information (metabolism pathway, cancer, disease, phenome) |
| |
| |
| Gene-Gene Network Information: Co-Expression Network, Interacting Genes & KEGG |
| |
|


| Gene Summary for MAN1A1 |
| Basic gene info. | Gene symbol | MAN1A1 |
| Gene name | mannosidase, alpha, class 1A, member 1 | |
| Synonyms | HUMM3|HUMM9|MAN9 | |
| Cytomap | UCSC genome browser: 6q22 | |
| Genomic location | chr6 :119499266-119670926 | |
| Type of gene | protein-coding | |
| RefGenes | NM_005907.3, | |
| Ensembl id | ENSG00000111885 | |
| Description | Man9-mannosidasealpha-1,2-mannosidase IAman(9)-alpha-mannosidasemannosyl-oligosaccharide 1,2-alpha-mannosidase IAprocessing alpha-1,2-mannosidase IA | |
| Modification date | 20141207 | |
| dbXrefs | MIM : 604344 | |
| HGNC : HGNC | ||
| Ensembl : ENSG00000111885 | ||
| HPRD : 05066 | ||
| Vega : OTTHUMG00000015472 | ||
| Protein | UniProt: go to UniProt's Cross Reference DB Table | |
| Expression | CleanEX: HS_MAN1A1 | |
| BioGPS: 4121 | ||
| Gene Expression Atlas: ENSG00000111885 | ||
| The Human Protein Atlas: ENSG00000111885 | ||
| Pathway | NCI Pathway Interaction Database: MAN1A1 | |
| KEGG: MAN1A1 | ||
| REACTOME: MAN1A1 | ||
| ConsensusPathDB | ||
| Pathway Commons: MAN1A1 | ||
| Metabolism | MetaCyc: MAN1A1 | |
| HUMANCyc: MAN1A1 | ||
| Regulation | Ensembl's Regulation: ENSG00000111885 | |
| miRBase: chr6 :119,499,266-119,670,926 | ||
| TargetScan: NM_005907 | ||
| cisRED: ENSG00000111885 | ||
| Context | iHOP: MAN1A1 | |
| cancer metabolism search in PubMed: MAN1A1 | ||
| UCL Cancer Institute: MAN1A1 | ||
| Assigned class in ccmGDB | C | |
| Top |
| Phenotypic Information for MAN1A1(metabolism pathway, cancer, disease, phenome) |
| Cancer | CGAP: MAN1A1 |
| Familial Cancer Database: MAN1A1 | |
| * This gene is included in those cancer gene databases. |
|
|
|
|
|
|
| ||||||||||||||||||||||||||||||||||||||||||||||||||||||||||||||||||||||||||||||||||||||||||||||||||||||||||||||||||||||||||||||||||||||||||||||||||||||||||||||||||||||||||||||||||||||||||||||||||||||||||||||||||||||||||||||||||||||||||||||||||||||||||||||||||||||||||||||||||||||||||||||||||||||||||||||||||||
Oncogene 1 | Significant driver gene in | |||||||||||||||||||||||||||||||||||||||||||||||||||||||||||||||||||||||||||||||||||||||||||||||||||||||||||||||||||||||||||||||||||||||||||||||||||||||||||||||||||||||||||||||||||||||||||||||||||||||||||||||||||||||||||||||||||||||||||||||||||||||||||||||||||||||||||||||||||||||||||||||||||||||||||||||||||||||||
| cf) number; DB name 1 Oncogene; http://nar.oxfordjournals.org/content/35/suppl_1/D721.long, 2 Tumor Suppressor gene; https://bioinfo.uth.edu/TSGene/, 3 Cancer Gene Census; http://www.nature.com/nrc/journal/v4/n3/abs/nrc1299.html, 4 CancerGenes; http://nar.oxfordjournals.org/content/35/suppl_1/D721.long, 5 Network of Cancer Gene; http://ncg.kcl.ac.uk/index.php, 1Therapeutic Vulnerabilities in Cancer; http://cbio.mskcc.org/cancergenomics/statius/ |
| REACTOME_METABOLISM_OF_PROTEINS | |
| OMIM | |
| Orphanet | |
| Disease | KEGG Disease: MAN1A1 |
| MedGen: MAN1A1 (Human Medical Genetics with Condition) | |
| ClinVar: MAN1A1 | |
| Phenotype | MGI: MAN1A1 (International Mouse Phenotyping Consortium) |
| PhenomicDB: MAN1A1 | |
| Mutations for MAN1A1 |
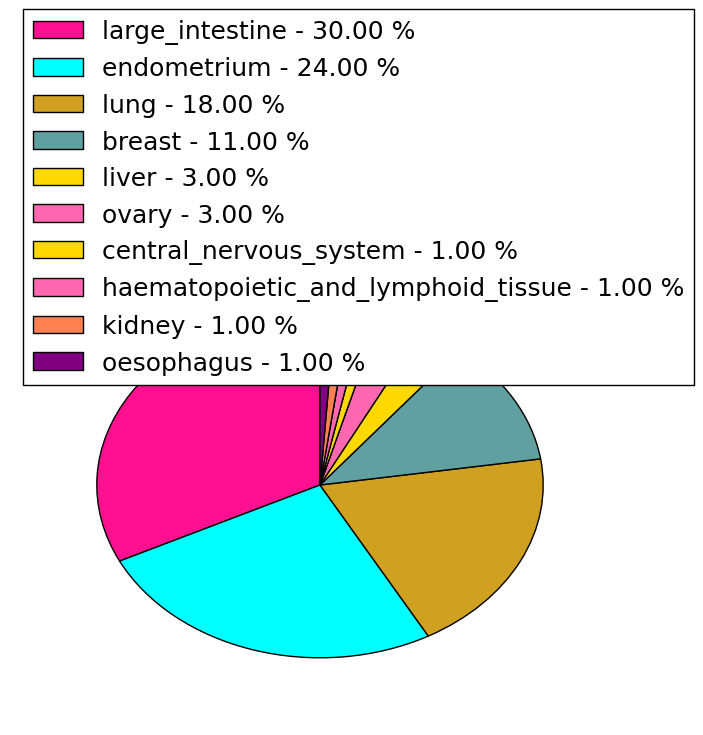
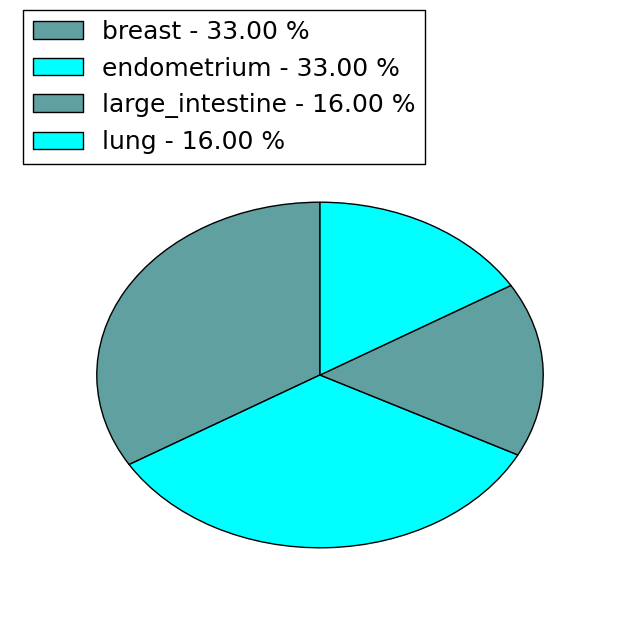
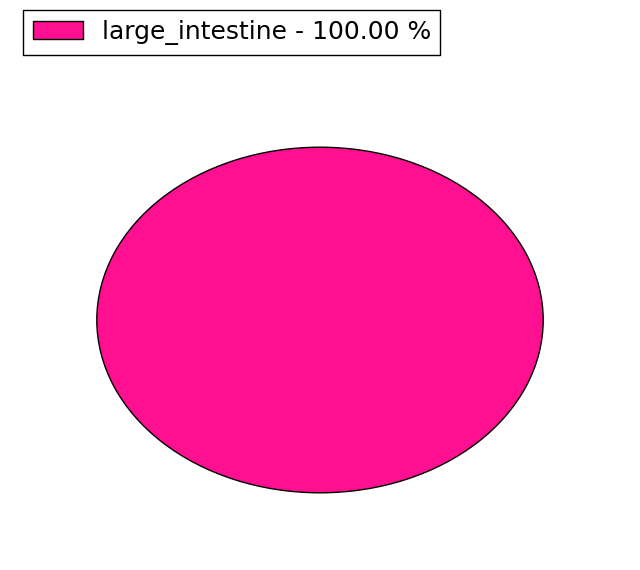
| * Under tables are showing count per each tissue to give us broad intuition about tissue specific mutation patterns.You can go to the detailed page for each mutation database's web site. |
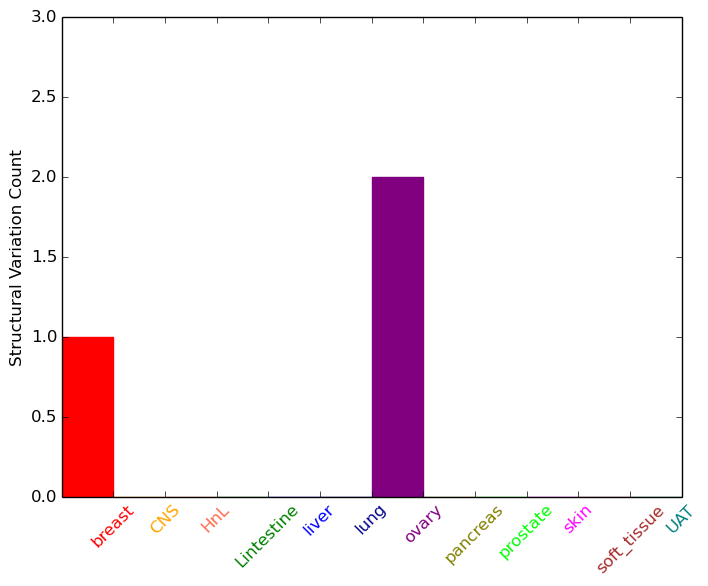
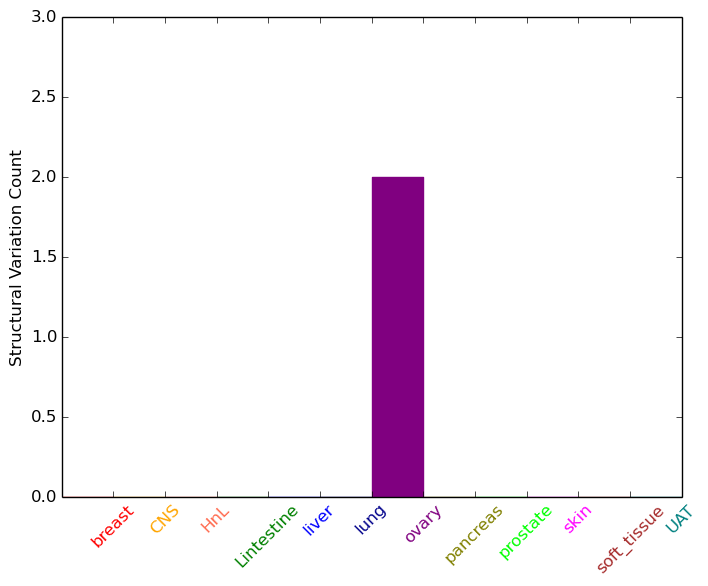
| - Statistics for Tissue and Mutation type | Top |
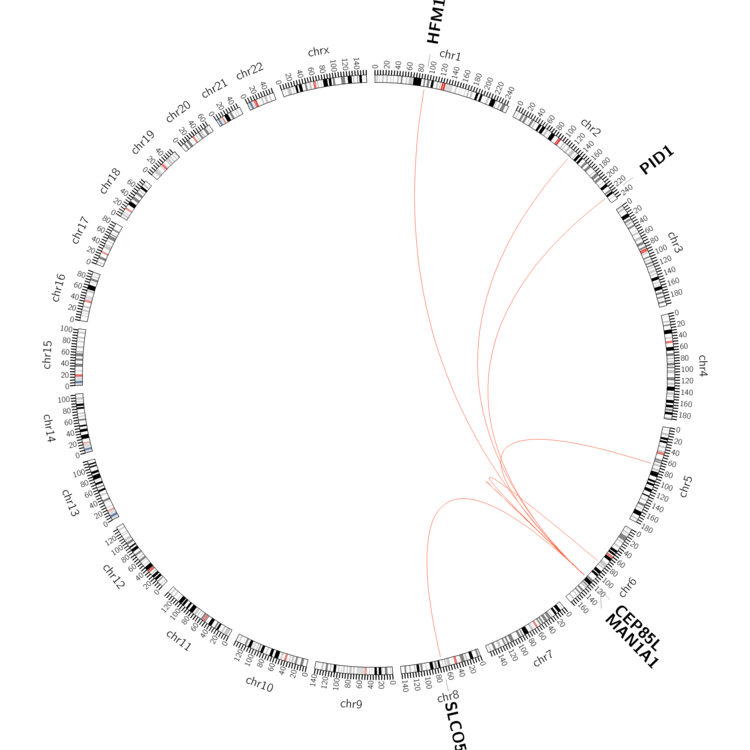 |
| - For Inter-chromosomal Variations |
| * Inter-chromosomal variantions includes 'interchromosomal amplicon to amplicon', 'interchromosomal amplicon to non-amplified dna', 'interchromosomal insertion', 'Interchromosomal unknown type'. |
 |
| - For Intra-chromosomal Variations |
| * Intra-chromosomal variantions includes 'intrachromosomal amplicon to amplicon', 'intrachromosomal amplicon to non-amplified dna', 'intrachromosomal deletion', 'intrachromosomal fold-back inversion', 'intrachromosomal inversion', 'intrachromosomal tandem duplication', 'Intrachromosomal unknown type', 'intrachromosomal with inverted orientation', 'intrachromosomal with non-inverted orientation'. |
 |
| Sample | Symbol_a | Chr_a | Start_a | End_a | Symbol_b | Chr_b | Start_b | End_b |
| breast | MAN1A1 | chr6 | 119558570 | 119558663 | chr6 | 82754655 | 82754768 | |
| NS | MAN1A1 | chr6 | 119558561 | 119558561 | PID1 | chr2 | 230045479 | 230045479 |
| NS | MAN1A1 | chr6 | 119558562 | 119558562 | HFM1 | chr1 | 91852808 | 91852808 |
| ovary | MAN1A1 | chr6 | 119505609 | 119505629 | chr2 | 127732135 | 127732155 | |
| ovary | MAN1A1 | chr6 | 119561062 | 119561082 | CEP85L | chr6 | 118851106 | 118851126 |
| ovary | MAN1A1 | chr6 | 119653779 | 119653799 | MAN1A1 | chr6 | 119654439 | 119654459 |
| cf) Tissue number; Tissue name (1;Breast, 2;Central_nervous_system, 3;Haematopoietic_and_lymphoid_tissue, 4;Large_intestine, 5;Liver, 6;Lung, 7;Ovary, 8;Pancreas, 9;Prostate, 10;Skin, 11;Soft_tissue, 12;Upper_aerodigestive_tract) |
| * From mRNA Sanger sequences, Chitars2.0 arranged chimeric transcripts. This table shows MAN1A1 related fusion information. |
| ID | Head Gene | Tail Gene | Accession | Gene_a | qStart_a | qEnd_a | Chromosome_a | tStart_a | tEnd_a | Gene_a | qStart_a | qEnd_a | Chromosome_a | tStart_a | tEnd_a |
| AA828041 | MAN1A1 | 4 | 376 | 6 | 119500279 | 119500651 | MAN1A1 | 369 | 428 | 6 | 119500228 | 119500287 | |
| X74837 | TEK | 1 | 750 | 9 | 27160653 | 27161403 | MAN1A1 | 747 | 3232 | 6 | 119500317 | 119670089 | |
| Top |
| Mutation type/ Tissue ID | brca | cns | cerv | endome | haematopo | kidn | Lintest | liver | lung | ns | ovary | pancre | prost | skin | stoma | thyro | urina | |||
| Total # sample | 2 | 1 | 2 | 2 | 2 | 1 | 1 | |||||||||||||
| GAIN (# sample) | 2 | 1 | 2 | 1 | ||||||||||||||||
| LOSS (# sample) | 2 | 1 | 1 | 1 |
| cf) Tissue ID; Tissue type (1; Breast, 2; Central_nervous_system, 3; Cervix, 4; Endometrium, 5; Haematopoietic_and_lymphoid_tissue, 6; Kidney, 7; Large_intestine, 8; Liver, 9; Lung, 10; NS, 11; Ovary, 12; Pancreas, 13; Prostate, 14; Skin, 15; Stomach, 16; Thyroid, 17; Urinary_tract) |
| Top |
|
 |
| Top |
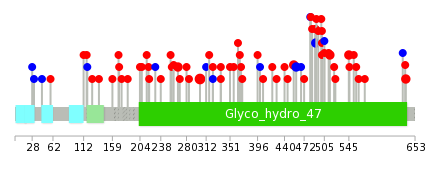
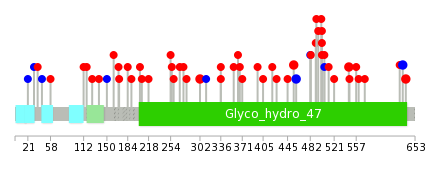
| Stat. for Non-Synonymous SNVs (# total SNVs=53) | (# total SNVs=6) |
 |  |
(# total SNVs=1) | (# total SNVs=0) |
 |
| Top |
| * When you move the cursor on each content, you can see more deailed mutation information on the Tooltip. Those are primary_site,primary_histology,mutation(aa),pubmedID. |
| GRCh37 position | Mutation(aa) | Unique sampleID count |
| chr6:119569512-119569512 | p.R302Q | 4 |
| chr6:119669822-119669822 | p.E137K | 2 |
| chr6:119510873-119510873 | p.G501E | 2 |
| chr6:119623172-119623172 | p.E266G | 2 |
| chr6:119509656-119509656 | p.R545W | 2 |
| chr6:119510998-119510998 | p.I459I | 2 |
| chr6:119511012-119511012 | p.G455R | 2 |
| chr6:119510902-119510902 | p.E491E | 2 |
| chr6:119501033-119501033 | p.L638P | 2 |
| chr6:119510834-119510834 | p.R514Q | 2 |
| Top |
|
 |
| Point Mutation/ Tissue ID | 1 | 2 | 3 | 4 | 5 | 6 | 7 | 8 | 9 | 10 | 11 | 12 | 13 | 14 | 15 | 16 | 17 | 18 | 19 | 20 |
| # sample | 2 | 2 | 13 | 2 | 1 | 1 | 3 | 4 | 2 | 3 | 12 | 2 | 11 | |||||||
| # mutation | 2 | 2 | 13 | 2 | 1 | 1 | 3 | 4 | 2 | 3 | 13 | 2 | 14 | |||||||
| nonsynonymous SNV | 2 | 1 | 12 | 1 | 1 | 1 | 4 | 2 | 2 | 12 | 1 | 12 | ||||||||
| synonymous SNV | 1 | 1 | 1 | 1 | 2 | 1 | 1 | 1 | 2 |
| cf) Tissue ID; Tissue type (1; BLCA[Bladder Urothelial Carcinoma], 2; BRCA[Breast invasive carcinoma], 3; CESC[Cervical squamous cell carcinoma and endocervical adenocarcinoma], 4; COAD[Colon adenocarcinoma], 5; GBM[Glioblastoma multiforme], 6; Glioma Low Grade, 7; HNSC[Head and Neck squamous cell carcinoma], 8; KICH[Kidney Chromophobe], 9; KIRC[Kidney renal clear cell carcinoma], 10; KIRP[Kidney renal papillary cell carcinoma], 11; LAML[Acute Myeloid Leukemia], 12; LUAD[Lung adenocarcinoma], 13; LUSC[Lung squamous cell carcinoma], 14; OV[Ovarian serous cystadenocarcinoma ], 15; PAAD[Pancreatic adenocarcinoma], 16; PRAD[Prostate adenocarcinoma], 17; SKCM[Skin Cutaneous Melanoma], 18:STAD[Stomach adenocarcinoma], 19:THCA[Thyroid carcinoma], 20:UCEC[Uterine Corpus Endometrial Carcinoma]) |
| Top |
| * We represented just top 10 SNVs. When you move the cursor on each content, you can see more deailed mutation information on the Tooltip. Those are primary_site, primary_histology, mutation(aa), pubmedID. |
| Genomic Position | Mutation(aa) | Unique sampleID count |
| chr6:119569512 | p.I459I | 2 |
| chr6:119509656 | p.G455R | 2 |
| chr6:119510998 | p.R545W | 2 |
| chr6:119511012 | p.G501E | 2 |
| chr6:119501033 | p.L638P | 2 |
| chr6:119501047 | p.S633S | 2 |
| chr6:119510873 | p.R302Q | 2 |
| chr6:119501064 | p.E275K | 1 |
| chr6:119669680 | p.L117P | 1 |
| chr6:119510874 | p.D561N | 1 |
| * Copy number data were extracted from TCGA using R package TCGA-Assembler. The URLs of all public data files on TCGA DCC data server were gathered on Jan-05-2015. Function ProcessCNAData in TCGA-Assembler package was used to obtain gene-level copy number value which is calculated as the average copy number of the genomic region of a gene. |
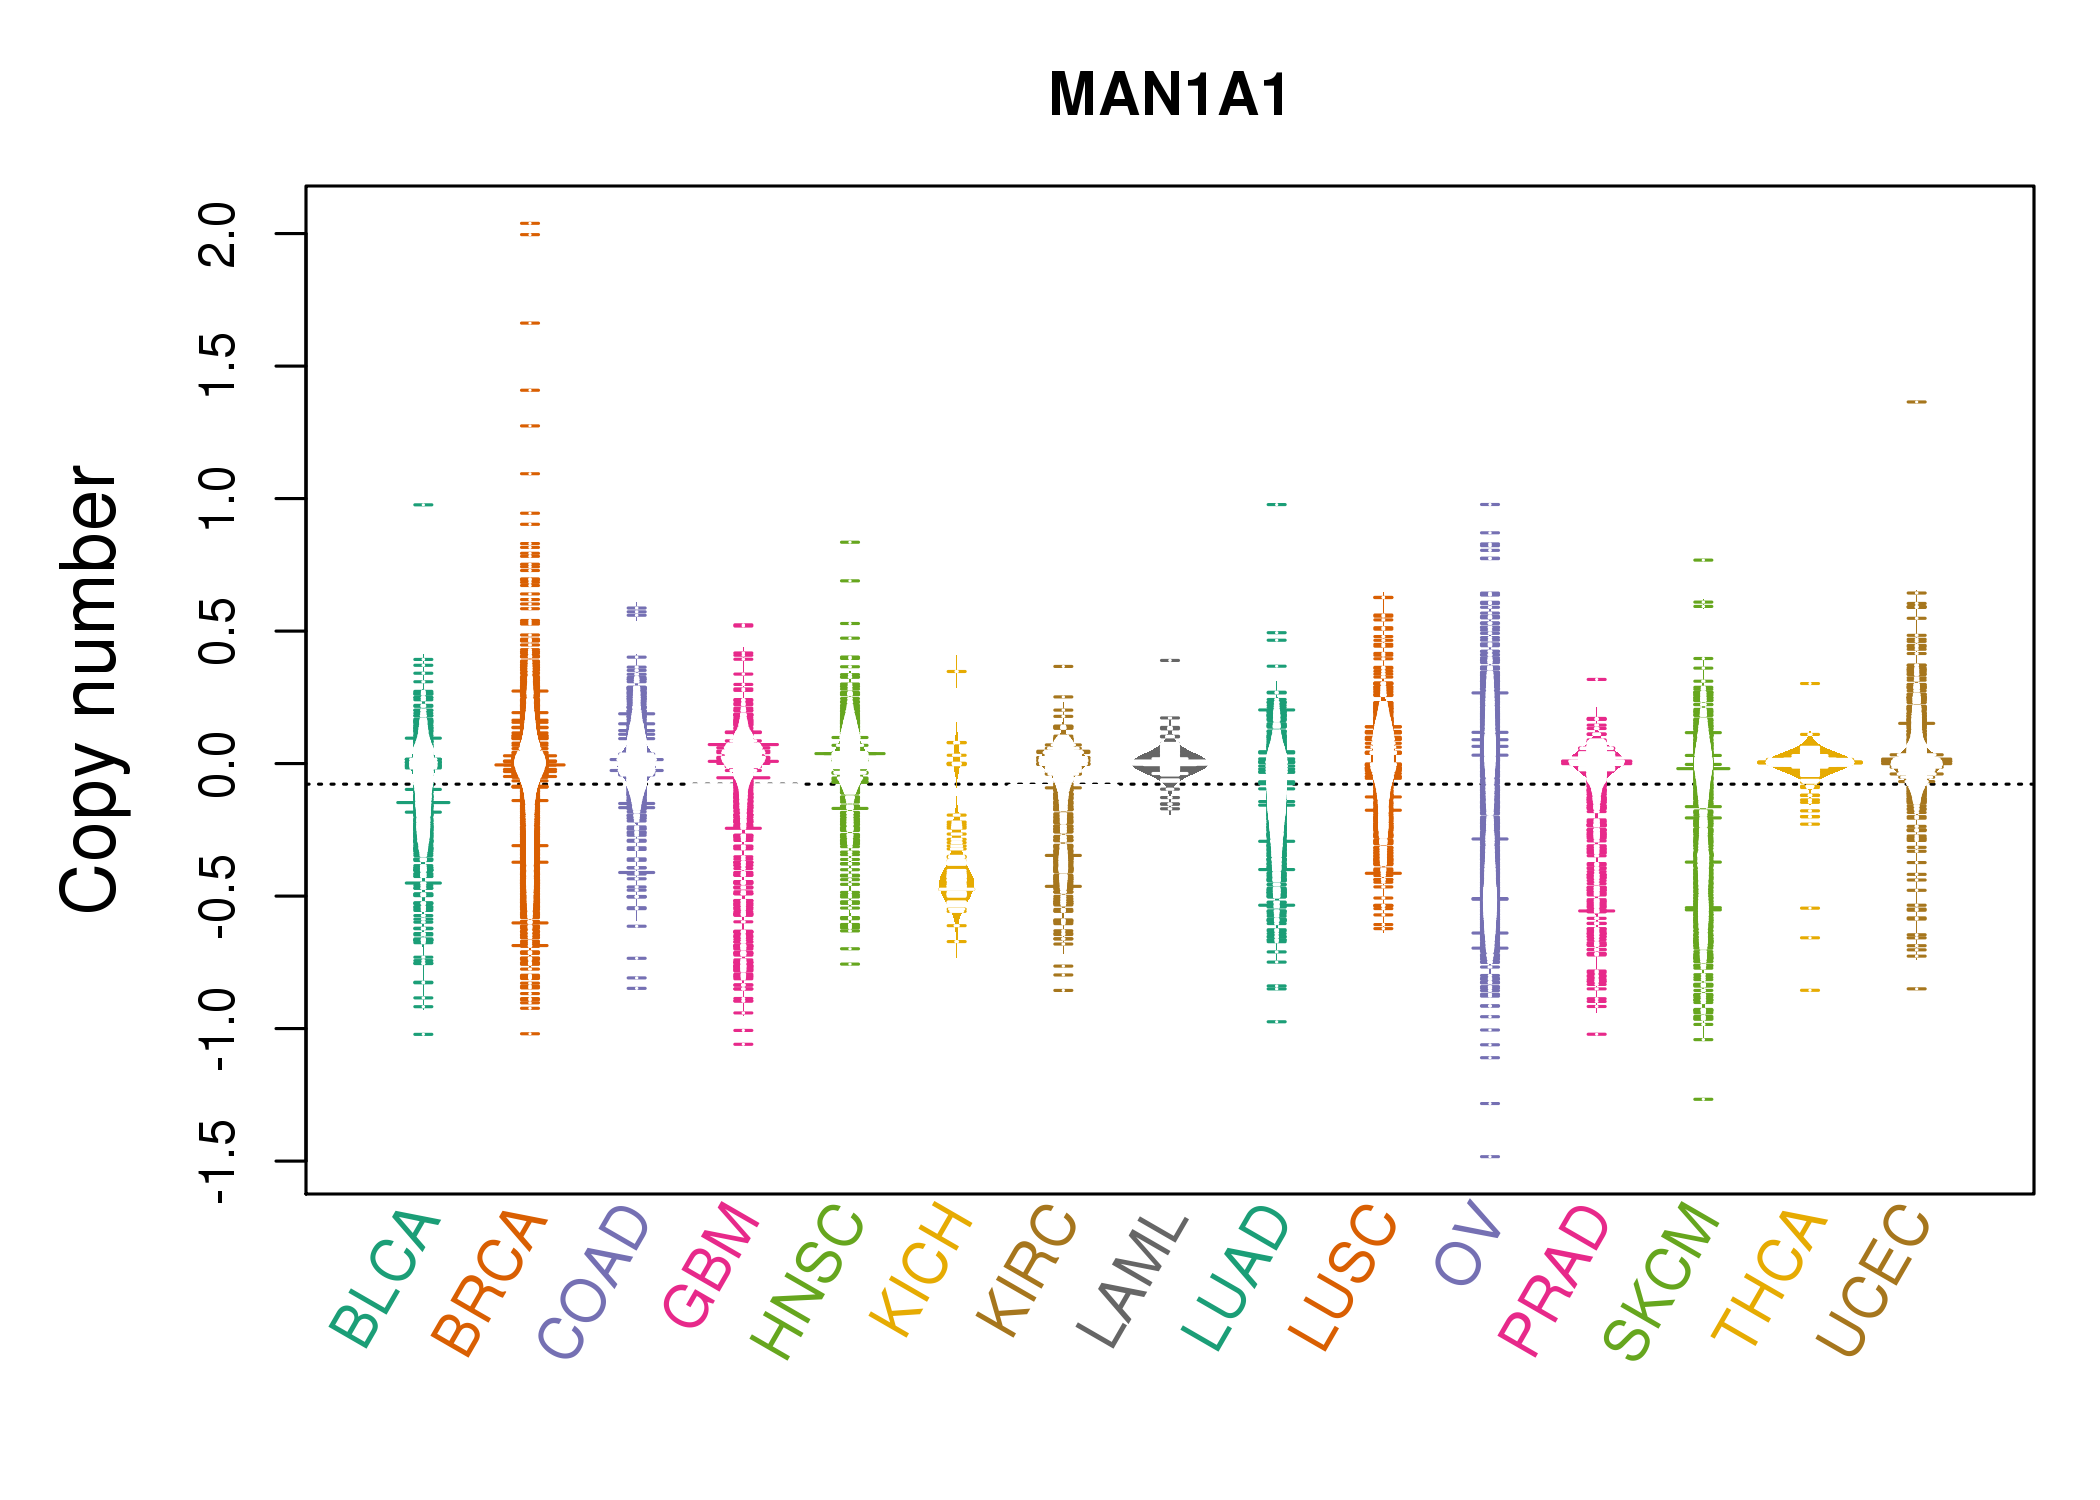 |
| cf) Tissue ID[Tissue type]: BLCA[Bladder Urothelial Carcinoma], BRCA[Breast invasive carcinoma], CESC[Cervical squamous cell carcinoma and endocervical adenocarcinoma], COAD[Colon adenocarcinoma], GBM[Glioblastoma multiforme], Glioma Low Grade, HNSC[Head and Neck squamous cell carcinoma], KICH[Kidney Chromophobe], KIRC[Kidney renal clear cell carcinoma], KIRP[Kidney renal papillary cell carcinoma], LAML[Acute Myeloid Leukemia], LUAD[Lung adenocarcinoma], LUSC[Lung squamous cell carcinoma], OV[Ovarian serous cystadenocarcinoma ], PAAD[Pancreatic adenocarcinoma], PRAD[Prostate adenocarcinoma], SKCM[Skin Cutaneous Melanoma], STAD[Stomach adenocarcinoma], THCA[Thyroid carcinoma], UCEC[Uterine Corpus Endometrial Carcinoma] |
| Top |
| Gene Expression for MAN1A1 |
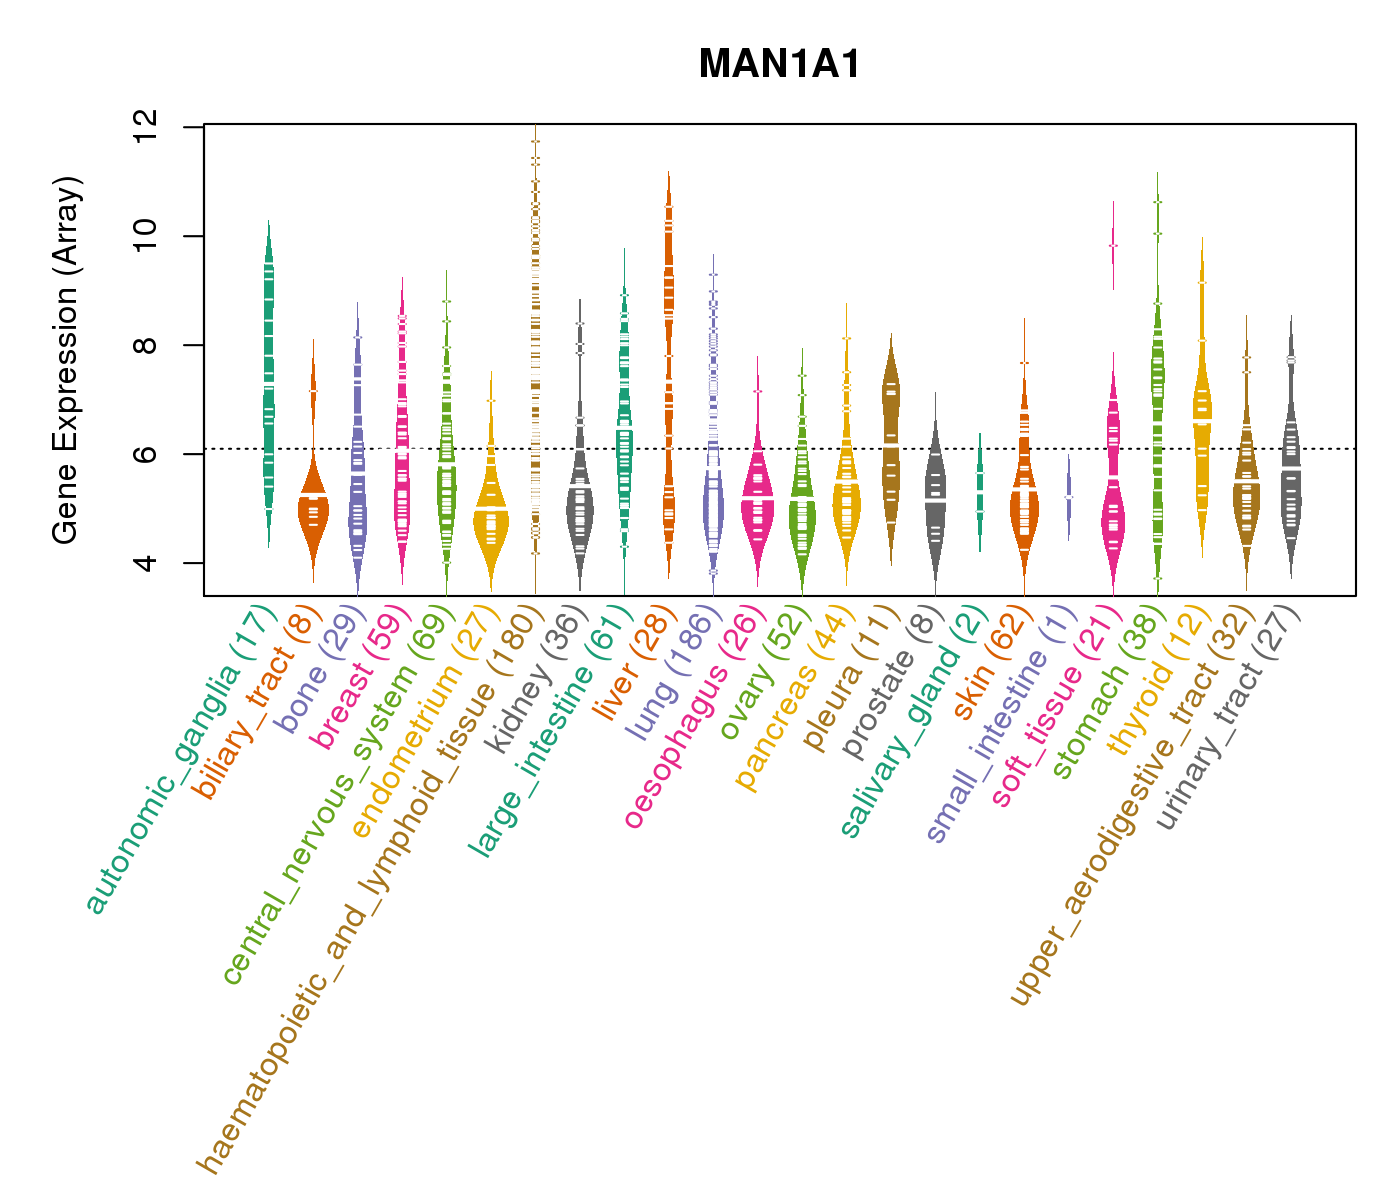
| * CCLE gene expression data were extracted from CCLE_Expression_Entrez_2012-10-18.res: Gene-centric RMA-normalized mRNA expression data. |
 |
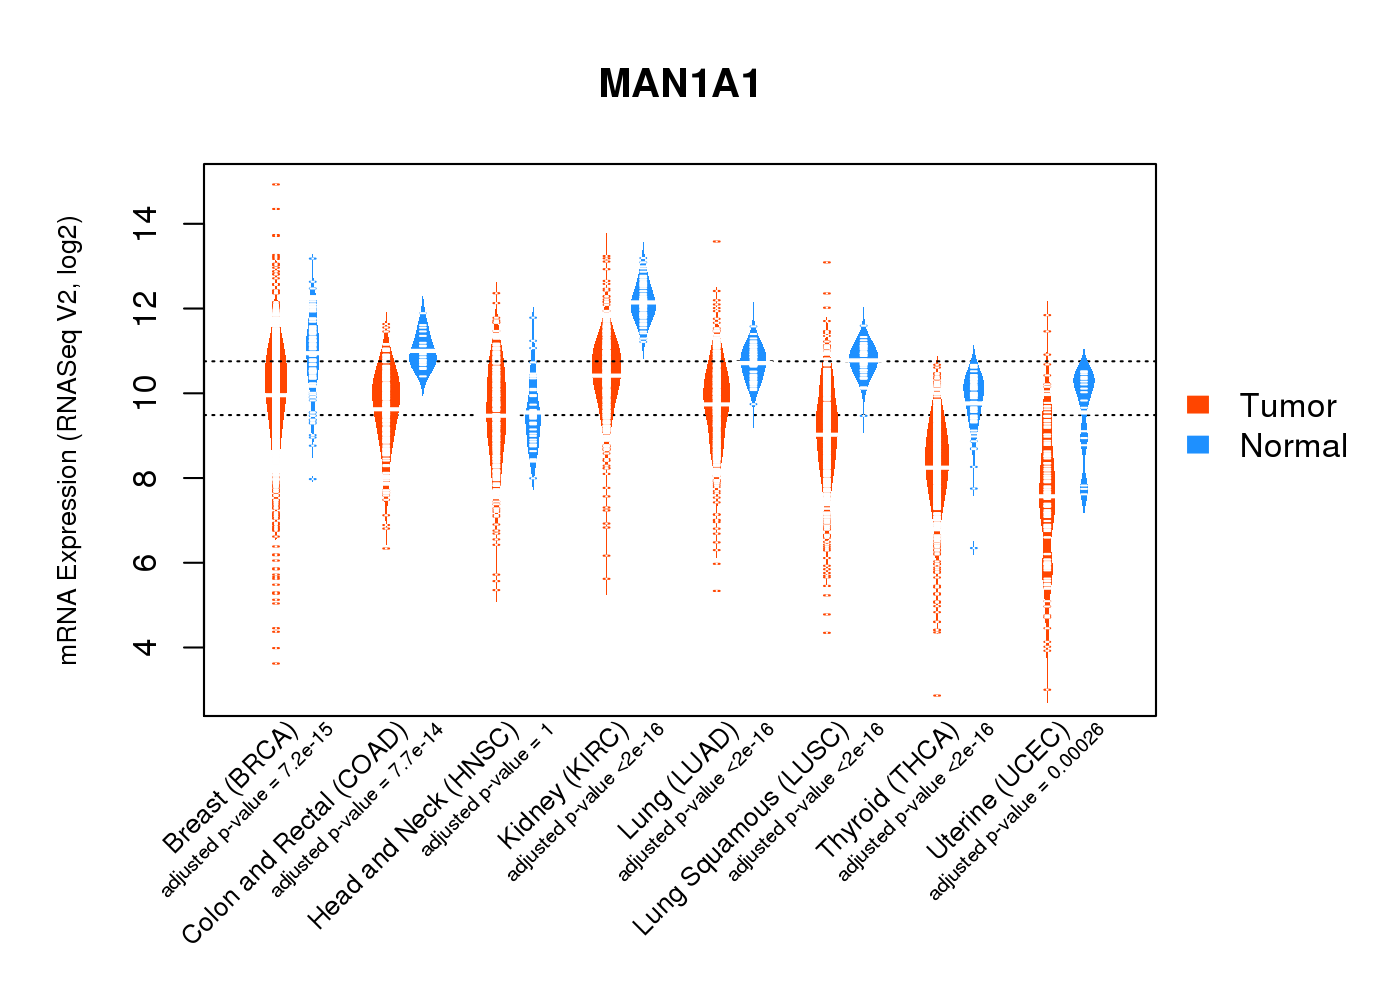
| * Normalized gene expression data of RNASeqV2 was extracted from TCGA using R package TCGA-Assembler. The URLs of all public data files on TCGA DCC data server were gathered at Jan-05-2015. Only eight cancer types have enough normal control samples for differential expression analysis. (t test, adjusted p<0.05 (using Benjamini-Hochberg FDR)) |
 |
| Top |
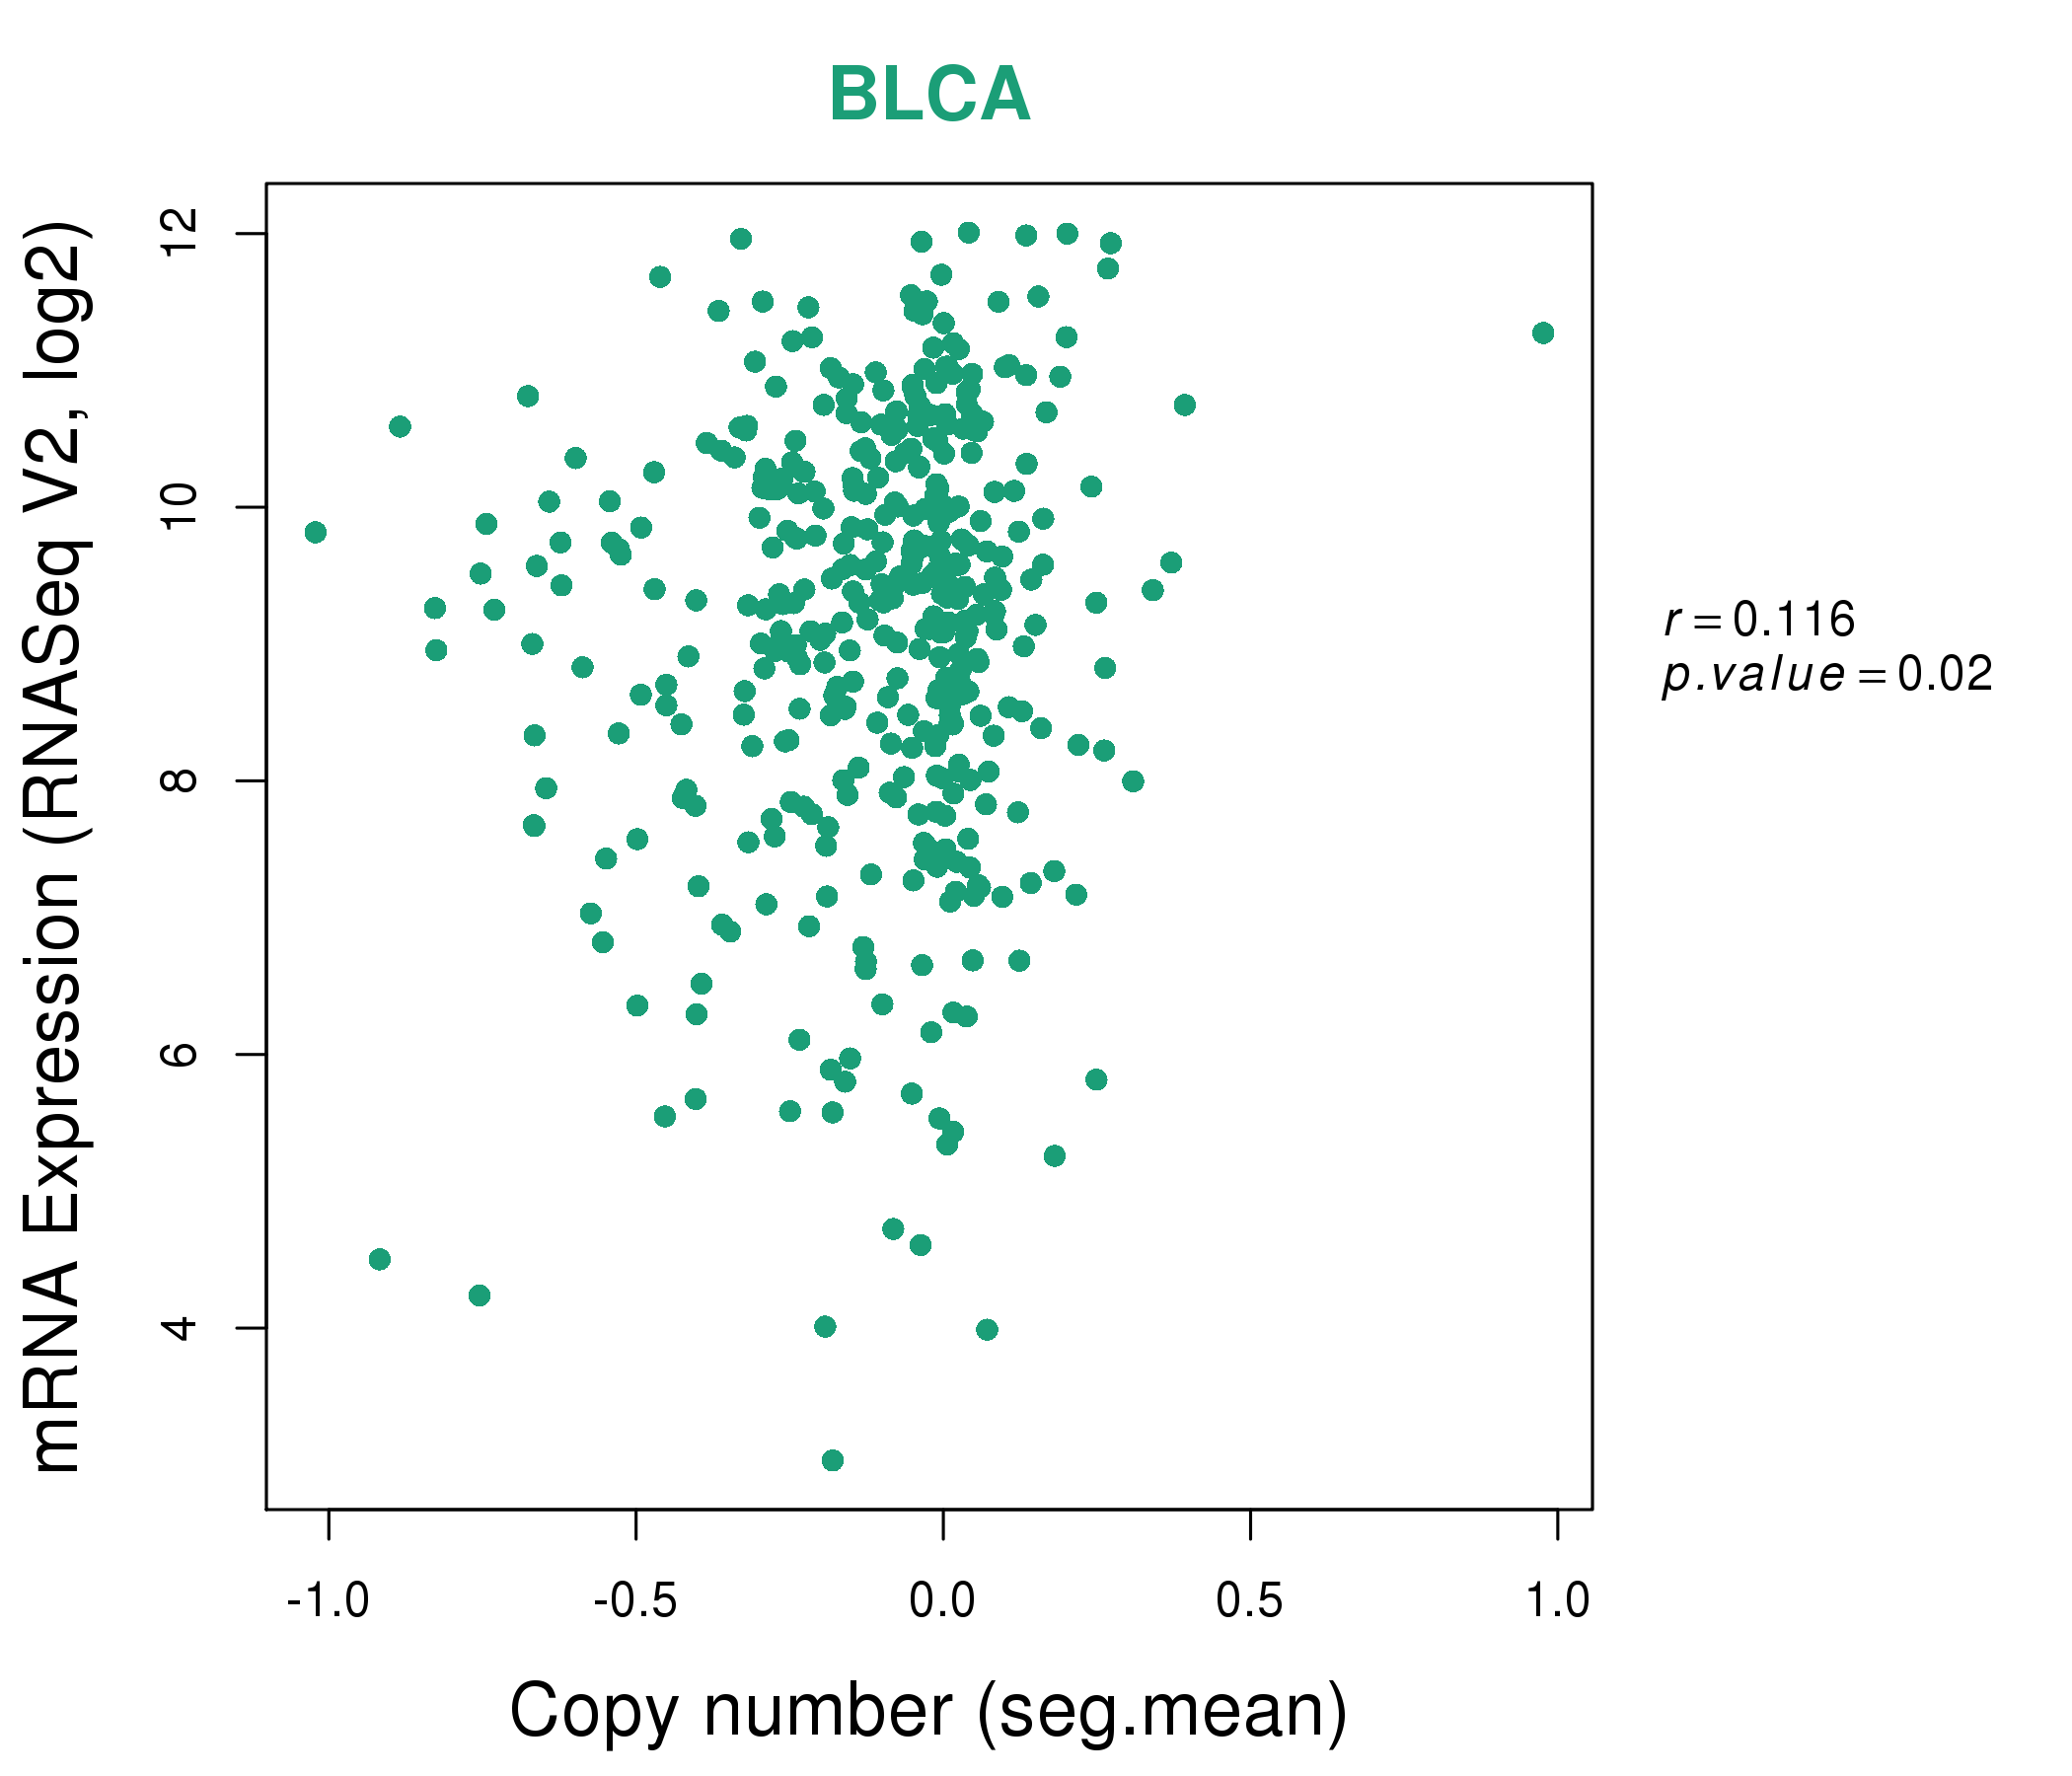
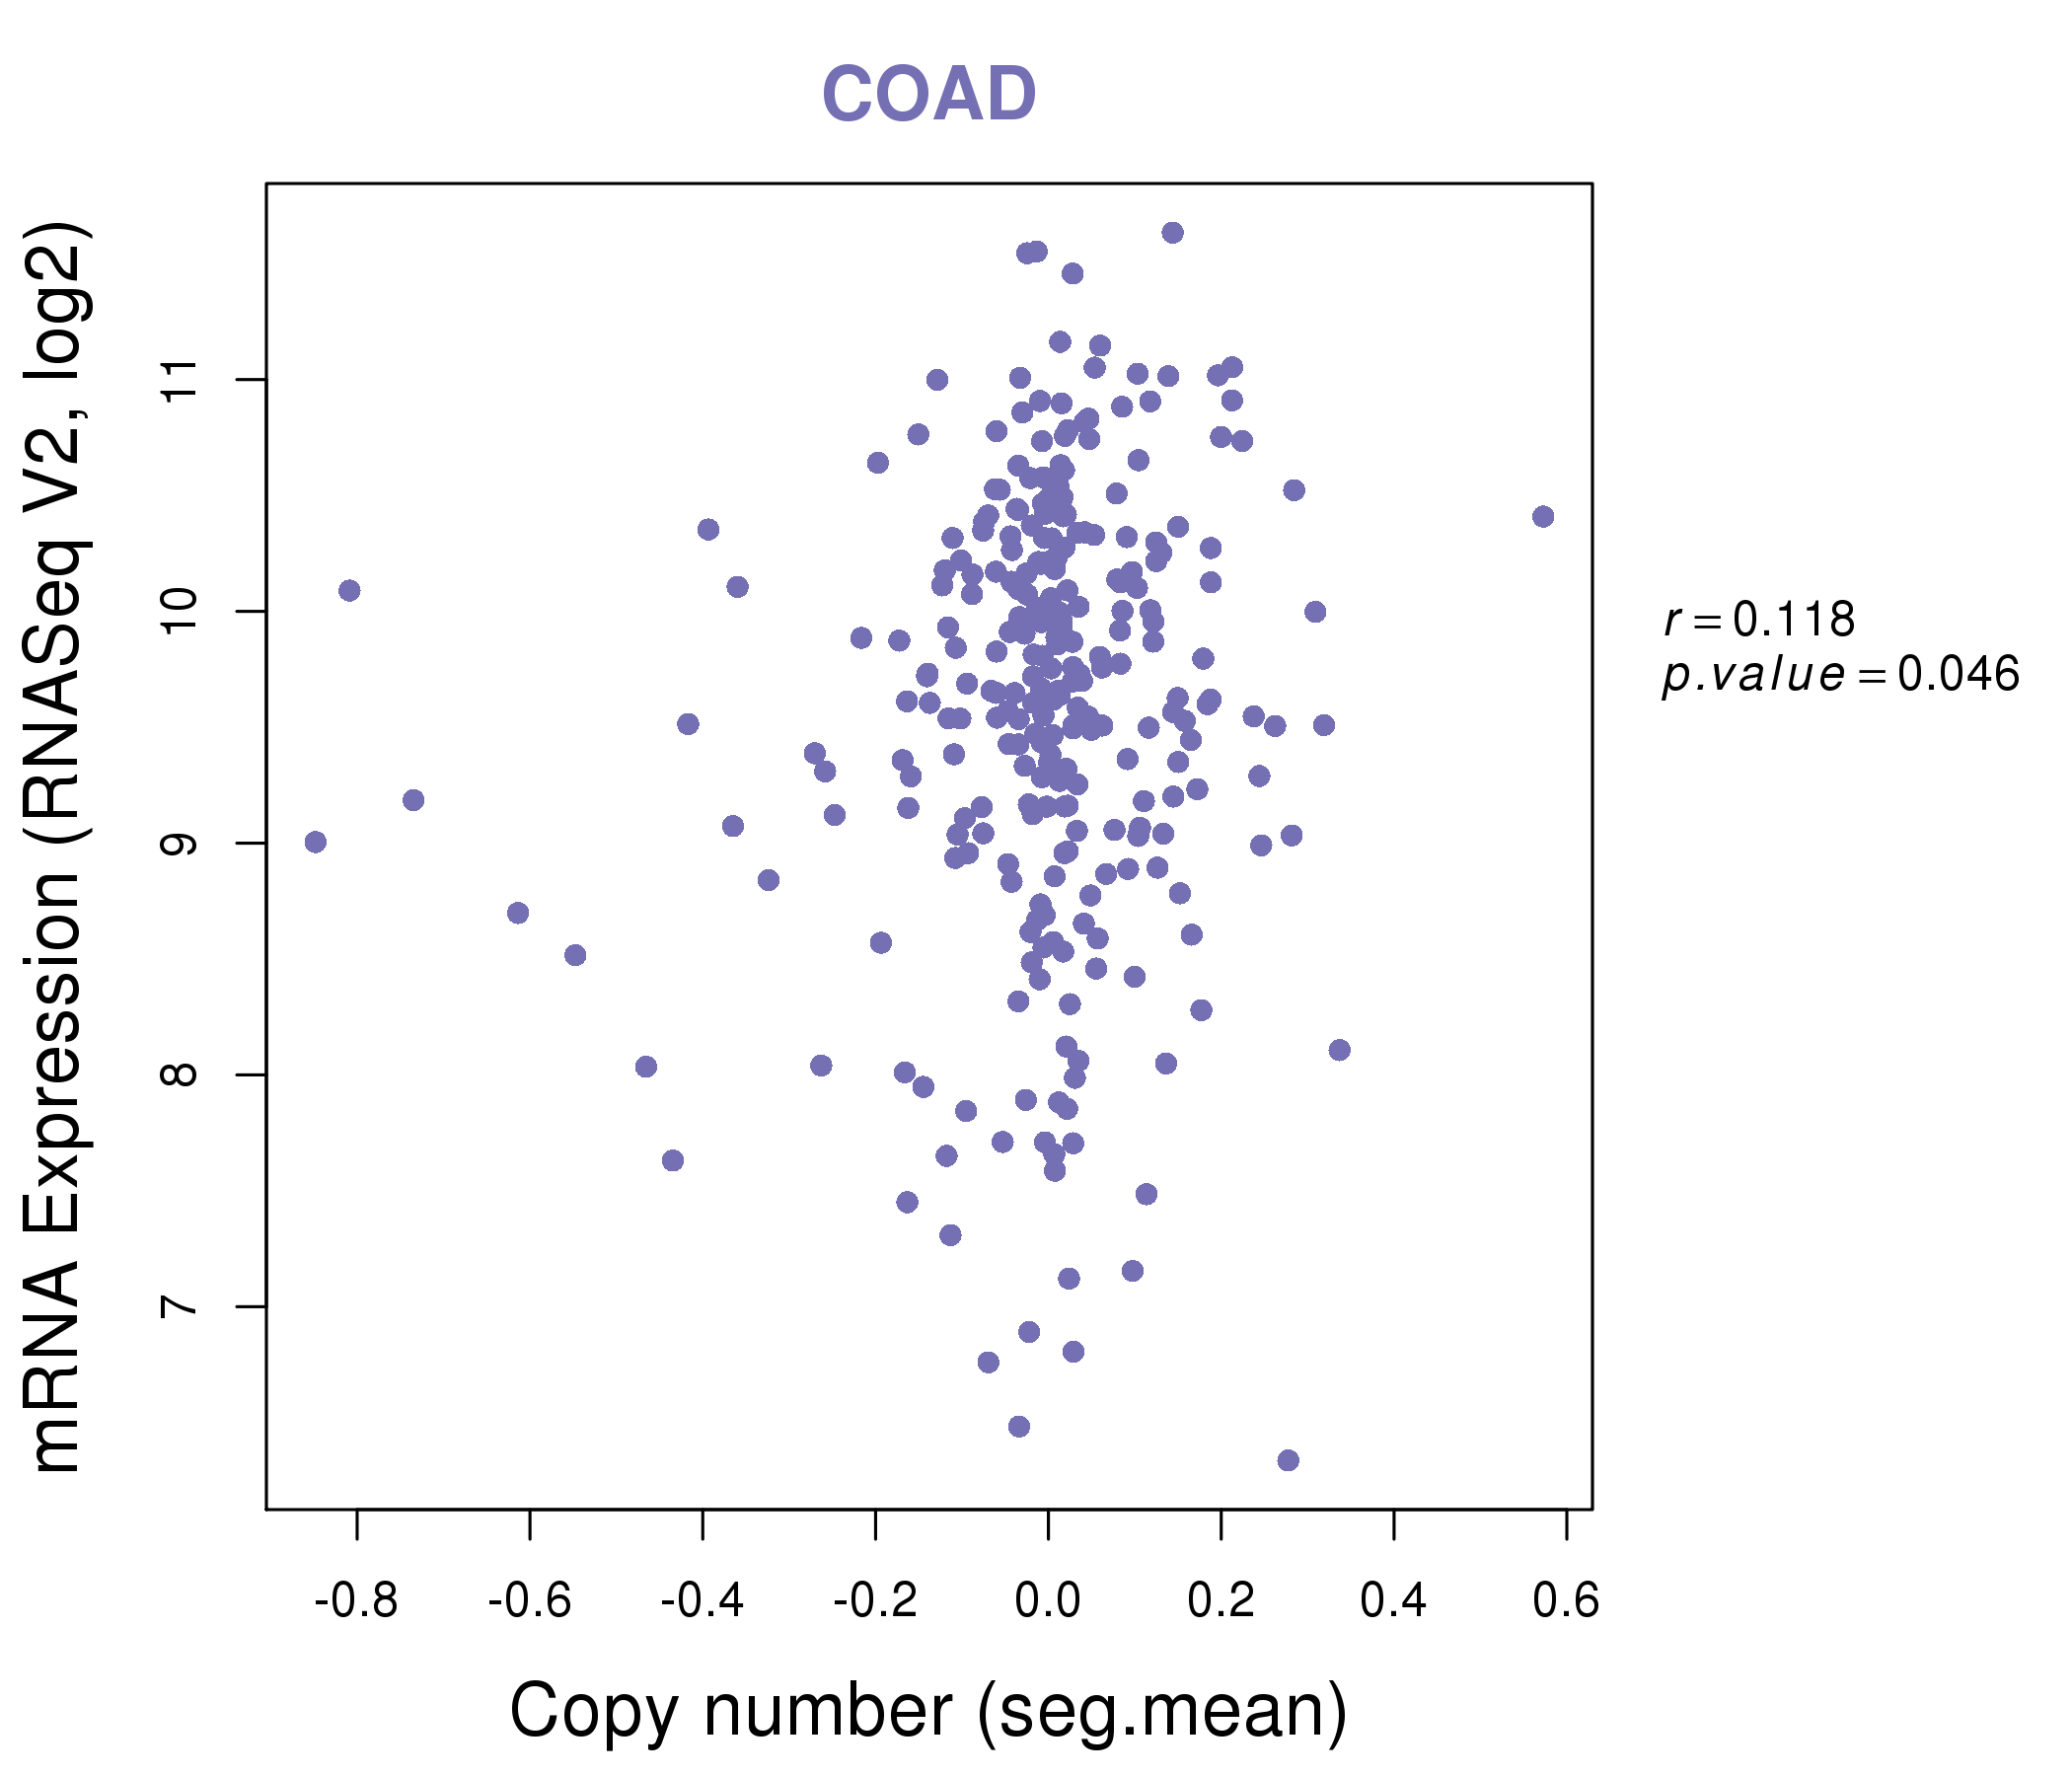
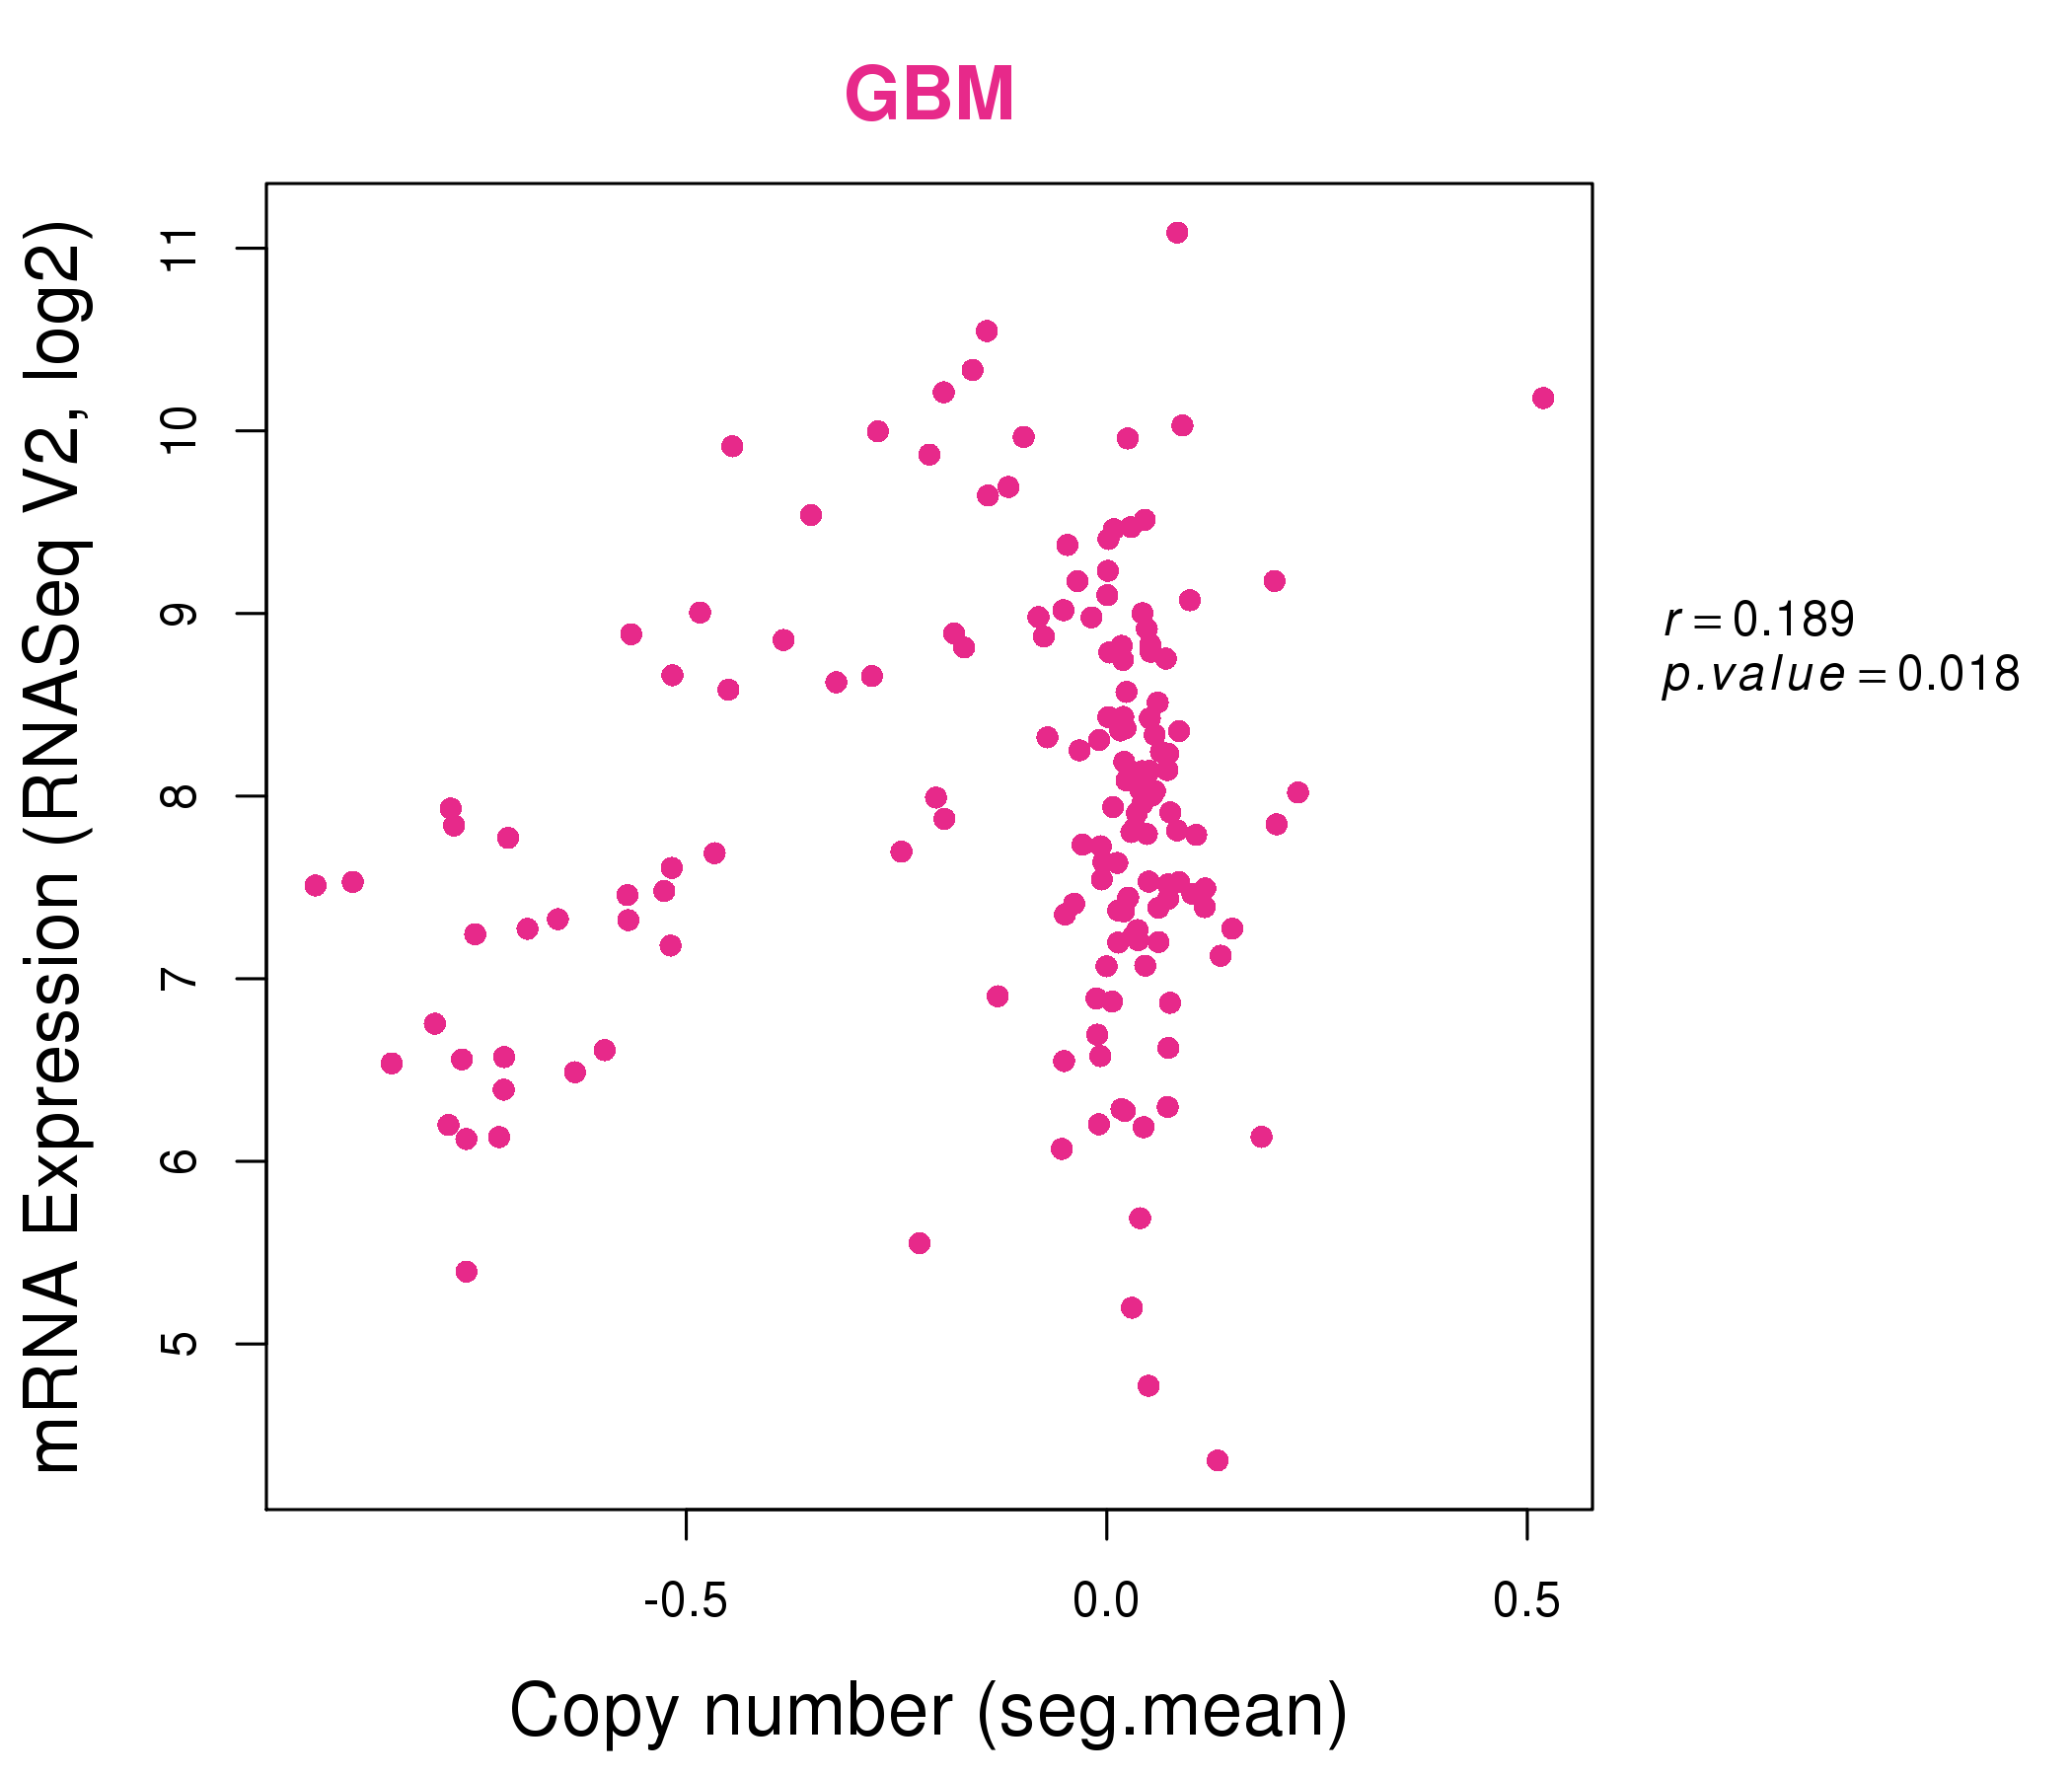
| * This plots show the correlation between CNV and gene expression. |
: Open all plots for all cancer types
 |
|
 |
|

| Top |
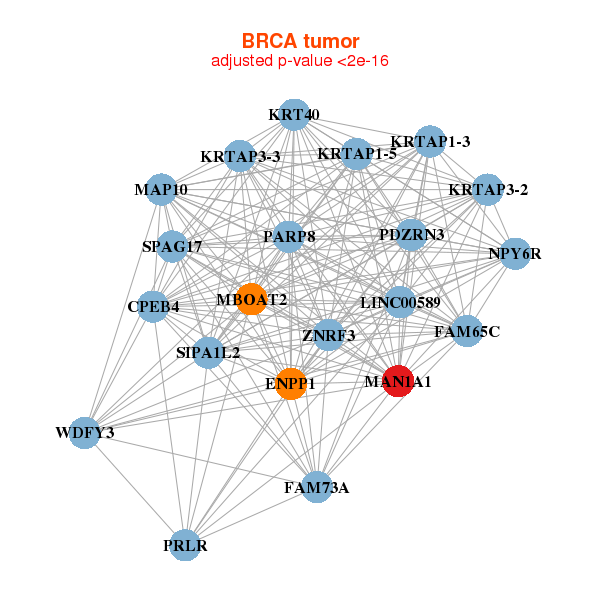
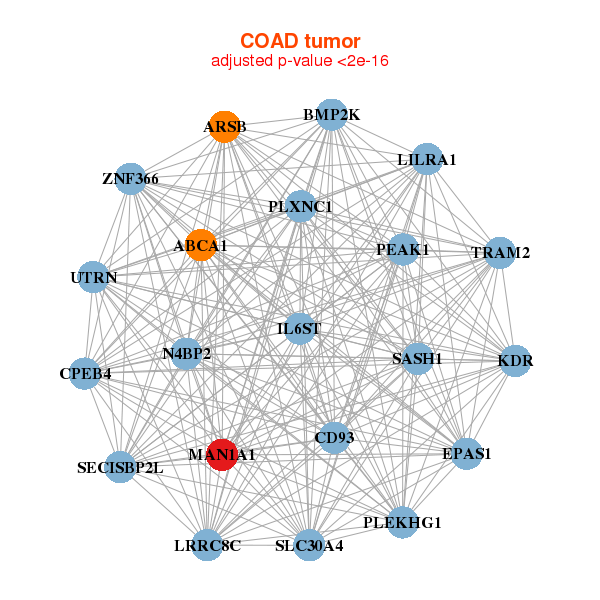
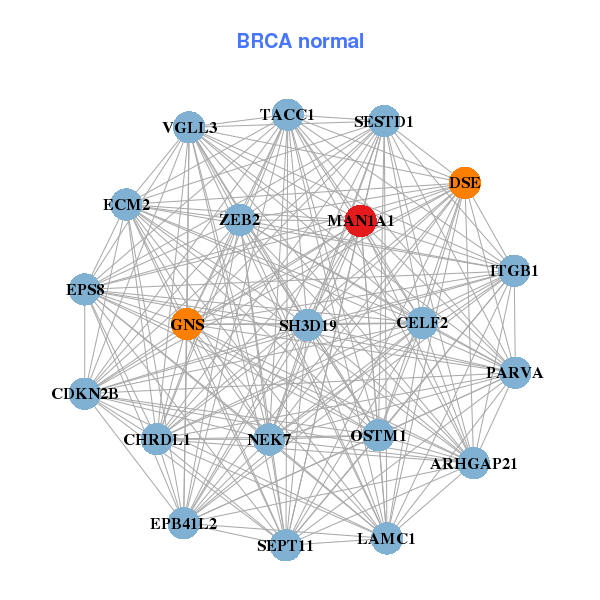
| Gene-Gene Network Information |
| * Co-Expression network figures were drawn using R package igraph. Only the top 20 genes with the highest correlations were shown. Red circle: input gene, orange circle: cell metabolism gene, sky circle: other gene |
: Open all plots for all cancer types
 |
|
| LINC00589,CPEB4,ENPP1,FAM65C,FAM73A,MAP10,KRT40, KRTAP1-3,KRTAP1-5,KRTAP3-2,KRTAP3-3,MAN1A1,MBOAT2,NPY6R, PARP8,PDZRN3,PRLR,SIPA1L2,SPAG17,WDFY3,ZNRF3 | ARHGAP21,CDKN2B,CELF2,CHRDL1,DSE,ECM2,EPB41L2, EPS8,GNS,ITGB1,LAMC1,MAN1A1,NEK7,OSTM1, PARVA,SEPT11,SESTD1,SH3D19,TACC1,VGLL3,ZEB2 |
 |
|
| ABCA1,ARSB,BMP2K,CD93,CPEB4,EPAS1,IL6ST, KDR,LILRA1,LRRC8C,MAN1A1,N4BP2,PLEKHG1,PLXNC1, SASH1,SECISBP2L,PEAK1,SLC30A4,TRAM2,UTRN,ZNF366 | ABAT,BMF,NCMAP,EPB41L3,HADHA,HADHB,IL13RA1, IPMK,KBTBD11,LAMP2,LPCAT3,MAN1A1,MARCH8,PBLD, SCAMP5,SNX24,TMEM19,TNIK,TOR1AIP2,UBTD2,VPS35 |
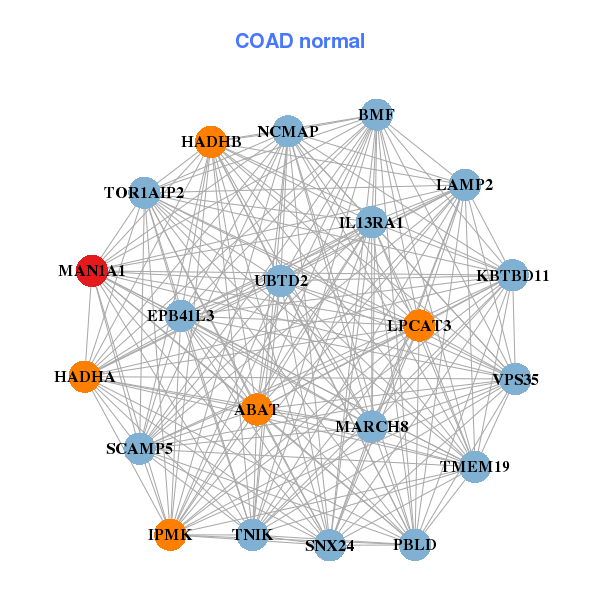
| * Co-Expression network figures were drawn using R package igraph. Only the top 20 genes with the highest correlations were shown. Red circle: input gene, orange circle: cell metabolism gene, sky circle: other gene |
: Open all plots for all cancer types
| Top |
: Open all interacting genes' information including KEGG pathway for all interacting genes from DAVID
| Top |
| Pharmacological Information for MAN1A1 |
| There's no related Drug. |
| Top |
| Cross referenced IDs for MAN1A1 |
| * We obtained these cross-references from Uniprot database. It covers 150 different DBs, 18 categories. http://www.uniprot.org/help/cross_references_section |
: Open all cross reference information
|
Copyright © 2016-Present - The Univsersity of Texas Health Science Center at Houston @ |